 Open Access Article
A neural network-based algorithm for high-throughput characterisation of viscoelastic properties of flowing microcapsules
Tao
Lin
a,
Zhen
Wang
b,
Wen
Wang
a and
Yi
Sui
 *a
*a
aSchool of Engineering and Materials Science, Queen Mary University of London, London E1 4NS, UK. E-mail: y.sui@qmul.ac.uk
bDepartment of Mechanical Engineering, University College London, London WC1E 6BT, UK
First published on 19th January 2021
Abstract
Microcapsules, consisting of a liquid droplet enclosed by a viscoelastic membrane, have a wide range of biomedical and pharmaceutical applications and also serve as a popular mechanical model for biological cells. In this study, we develop a novel high throughput approach, by combining a machine learning method with a high-fidelity mechanistic capsule model, to accurately predict the membrane elasticity and viscosity of microcapsules from their dynamic deformation when flowing in a branched microchannel. The machine learning method consists of a deep convolutional neural network (DCNN) connected by a long short-term memory (LSTM) network. We demonstrate that with a superior prediction accuracy the present hybrid DCNN-LSTM network can still be faster than a conventional inverse method by five orders of magnitude, and can process thousands of capsules per second. We also show that the hybrid network has fewer restrictions compared with a simple DCNN.
1 Introduction
A microcapsule is a deformable particle which has a liquid core enclosed by a thin elastic or viscoelastic membrane. Microcapsules have been a popular simplified mechanical model of living biological cells,1–3 and the mechanical properties such as viscosity and elasticity have been related to cell states and human disease processes.4,5 Artificial synthetic microcapsules are widely used in biomedical and pharmaceutical applications such as encapsulated cell culture,6 controlled agent release7 and targeted drug delivery.8 The membrane of microcapsules protects their internal contents and regulates mass exchange. Its mechanical properties determine a microcapsule's mechanical strength and its dynamic deformation corresponding to external forces. Characterising mechanical properties of microcapsules is therefore important in the design and manufacture of synthetic microcapsules, and in biomedical and clinical applications such as active cell sorting and cancer diagnosis.It has been very difficult to characterise mechanical properties of microcapsules or biological cells due to their fragility and tiny size. A number of methods have been proposed, such as atomic force microscopy,9 micropipette aspiration,10 parallel-plate rheometry,11 optical stretcher,12 magnetic twisting cytometry13(see a recent review14). In these methods, a common practice is to measure the deformation of particles under a well-defined stress. Note that fluid forces generated in shear,15–17 centrifugal,18,19 and extensional20,21 flows have also been used to deform suspended capsules. The throughput rates of these methods are typically limited to 10–1000 capsules or cells per hour, which are inadequate to the measurement of a large population of heterogeneous particles. For biomedical applications such as cell sorting or cancer diagnosis based on mechanical properties of cells, many thousands to millions of cells need to be measured in minutes to hours. Those applications therefore require high-throughput approaches that can process at least hundreds of cells per second.5
To address the unmet need of the high processing throughput rate, novel hydrodynamic approaches have been proposed in recent years,4,22–32 where microcapsules or living biological cells are flowed through microfluidic channels. The particles are deformed by the fluid stresses inside the narrow channels. By fitting the steady or dynamic deformed particle profiles to theoretical predictions, mechanical properties such as viscosity and elastic modulus, of the particle can be obtained inversely. The current state-of-the-art systems can conduct real-time measurement of the deformation of hundreds of cells per second.
A current limitation of the transformative hydrodynamic approaches is that it still cannot conduct real-time measurement of the viscosity and elastic modulus of microcapsules or cells at a high throughput rate. The mechanical properties need to be obtained by post-processing the experimental data using inverse methods, with hours to days of processing time depending on the size of the sample. This is because that existing inverse methods often need to compare a test sample with a large number of samples (obtained by theoretical predictions) stored in a data bank to find the best fit, which is a very time-consuming process. Inferring viscosity of a particle is particularly slow, since it is necessary to consider the time evolution of the particle deformation.
In recent years, machine learning has attracted much attention from different communities including soft matter physics and engineering, for it provides a versatile tool which can infer the relationship between data and their corresponding measurements. Machine learning approaches, such as the supported vector machines, have been applied to glassy systems to identify flow defects,33 analyze atomic structures,34 and predict plasticity.35 Deep convolutional neural networks (DCNN) have significant merits in processing data that come in the form of images,36 and have led to exciting applications such as classification of cells,37 characterization of amorphous materials,38 prediction of emulsion stability,39 and geometrical optimization of aerofoils.40 The long short-term memory (LSTM) neural networks41 are superior in processing time-series data and building the temporal connections, and have been broadly used in applications such as weather forecasting,42 clinical diagnosis,43 and prediction of chemical reactions.44
In the present study we develop a novel high throughput approach, by combining a hybrid DCNN-LSTM neural network with a high-fidelity mechanistic capsule model, to accurately predict the membrane elasticity and viscosity of microcapsules from their dynamic deformation when flowing in a branched microchannel. Unlike conventional inverse methods which have to conduct a time-consuming process to find the best fit, the present neural network is trained offline, and its predicting process only involves a limited number of algebraic calculations. It is therefore much faster and can predict the membrane elasticity and viscosity of thousands of capsules per second. We also demonstrate that the present method can deal with capsules with large deformation in fast flows. Furthermore, the present DCNN-LSTM neural network has fewer restrictions compared with a simple DCNN approach.
2 Method
The present method predicts the membrane viscosity and elasticity of a microcapsule from its dynamic deformation in the bifurcation region of a branched microchannel. The method consists of two parts. The first part is a microfluidic platform for flow-induced capsule deformation, which is detailed in Section 2.1. The second part is a DCNN-LSTM network-based prediction algorithm. As described in Section 2.4, the DCNN-LSTM network belongs to supervised learning, and can be viewed as an operator which maps inputs, that are images of the deformed capsule, to measurements, that are membrane viscosity and elasticity.2.1 Microchannel flow geometry
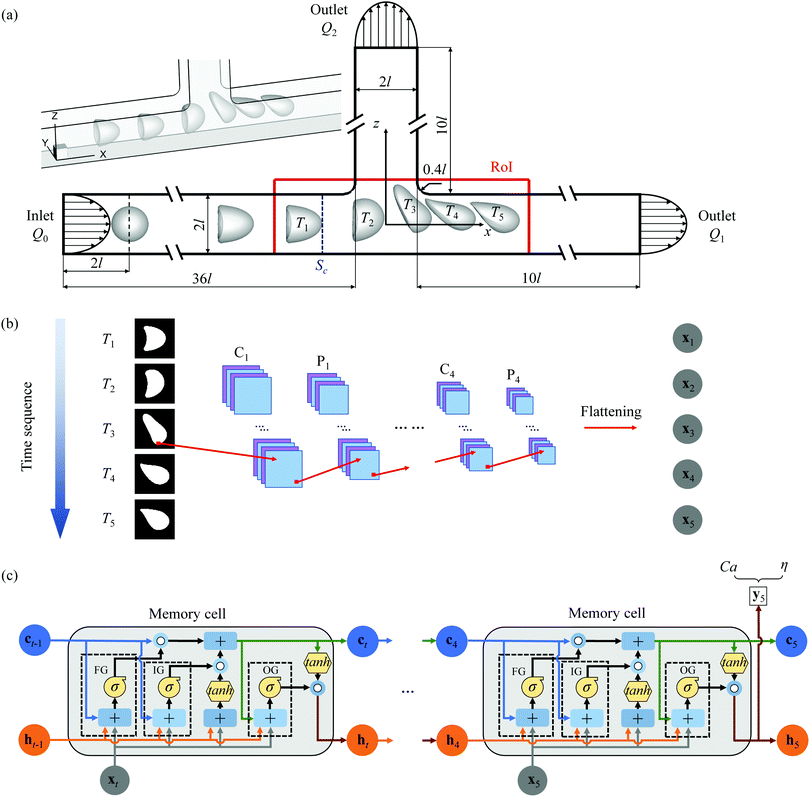
The problem setup is shown schematically in Fig. 1(a). An initially spherical capsule of radius a flows through a straight channel with an orthogonal side branch. The parent channel and the two downstream daughter channels have a constant square cross-section 4l2 with a side length 2l. The corners of the bifurcation are rounded with a radius of 0.4l. The length of the parent channel and two daughter channels are 36l and 10l, respectively. A three-dimensional Cartesian coordinate is used with x-axis along the axis of the main channel, z-axis along the side branch axis and x = y = z = 0 at the bifurcation centre.In the branched channel, the fluids inside and outside the capsule are both incompressible and Newtonian with density ρ and viscosity μ. No-slip boundary condition is imposed on the channel wall. At the upstream inlet and the two downstream outlets, the velocity profiles are set to be fully developed laminar channel flow profiles corresponding to flow rates Q0, Q1 and Q2 respectively, with Q0 = Q1 + Q2.
The length of the parent channel allows the capsule to develop into a steady shape before arriving at the bifurcation of the channel. We define a region of interest (RoI) covering the entire bifurcation area of the channel with −3.5l ≤ x ≤ 4.5l and −l ≤ z ≤ 1.5l (shown in Fig. 1(a)). When the capsule is flowing in the RoI, its instantaneous deformed profiles at different times are captured. These profiles are then employed by a trained DCNN-LSTM neural network to predict the membrane viscosity and elasticity of the capsule. The first capsule profile is captured when the capsule's front point touches the plane Sc at x = −2l. At this instance, the capsule is at its steady shape of flowing in the straight parent channel. The time interval ΔT between two adjacent capsule profiles is 1.34l/V, where V is the mean fluid velocity in the parent channel. With such a choice of time interval, five instantaneous profiles can be captured when the capsule is flowing through the RoI. This enables the DCNN-LSTM neural network to accurately predict the capsule membrane properties.
The current microchannel geometry with a bifurcation provides a versatile platform where the trajectory and transient deformation of the capsule can be controlled conveniently by adjusting the flow strength and flow split ratio between two downstream channels, without the necessity of changing the geometry of the channel. In experiments, the channel can be fabricated using polydimethylsiloxane with standard soft lithography, and the flow can be controlled by multiple syringe pumps at the channel inlet and outlets.
2.2 Microcapsule mechanical model
The capsule is regarded as a liquid droplet enclosed by an infinitely thin viscoelastic membrane with a small bending resistance. A no-slip boundary condition at the capsule membrane has been assumed. The membrane elasticity is modelled by the Skalak (SK) constitutive law,45 which has a strain-hardening property. Specifically, the two principal in-plane tensions τe1,2 are calculated as | (1) |
The viscous stress of the membrane τν is split into the shear viscous stress τνs and the dilatational viscous stress τνd:48
τν = τνs + τνd = μs[2D − tr(D)P] + μd![[thin space (1/6-em)]](https://www.rsc.org/images/entities/char_2009.gif) tr(D)P, tr(D)P, | (2) |
We employ the Kelvin–Voigt (KV) viscoelastic model49 to describe the viscoelastic behaviour of the membrane. The total stress tensor is assumed to be the sum of the elastic and the viscous stresses. It should be noticed that the KV model has been widely used to describe the mechanics of capsules and biological cells.50–52
Apart from the elastic and viscous stresses, the out-of-plane bending force is calculated as:53
| fb = kc[(2H + c0)(2H2 − 2κg − c0H) + ΔLB(2H − c0)]n, | (3) |
The dimensionless parameters governing capsule deformation in the bifurcation region are:
(i) the dimensionless membrane viscosity η = μs/(μa);
(ii) the capillary number Ca = μV/Gs, which measures the ratio between the viscous fluid force and the membrane elastic force;
(iii) the size ratio β = a/l which compares the size of the capsule to the hydraulic radius of the square channel;
(iv) the flow Reynolds number Re = ρV(2l)/μ;
(v) the flow split ratio q = Q2/Q0, which is the ratio of flow rates in the side branch and the parent channel.
2.3 Immersed-boundary lattice Boltzmann method
We first use a well-tested immersed-boundary lattice Boltzmann method to simulate the transient deformation of the capsule in the branched channel. The simulations results, including deformed capsule profiles and corresponding membrane parameters, are then used to train a DCNN-LSTM neural network.Details of the immersed-boundary lattice Boltzmann method can be found in our previous works,55–57 and only a brief summary of the method is provided here. The fluid flow is solved by a three-dimensional nineteen-velocity (D3Q19) lattice Boltzmann method (LBM). At channel walls, the no-slip boundary condition is applied using a second-order bounce-back scheme.58 A second-order non-equilibrium extrapolation method59 has been employed to impose the velocity boundary conditions at the inlet and two outlets. The interaction between the fluid and the capsule is solved using the immersed boundary method of Peskin.60 The three-dimensional capsule membrane is discretised into flat triangular elements, and a finite element membrane model is employed to calculate the deformation gradient tensor, the principal extension ratios λ1 and λ2 and the stress tensor. To integrate the viscoelastic stress, we follow the same approach of Yazdani and Bagchi.49
The present numerical scheme for capsule deformation in fluid had been validated extensively against previous theoretical and computational results of capsules in linear shear flow55,56,61 and channel flows.57,62 In the present study, uniform Cartesian grids are used in the flow domain with Δx = Δy = Δz = 0.04l. The capsule membrane is discretised into 8192 flat triangular elements connecting 4098 nodes. We find further reducing flow grid size or increasing membrane elements does not lead to any visible change in capsule trajectory and deformed shapes in the branched channel.
2.4 DCNN-LSTM neural network
The present neural network consists of a DCNN and an LSTM network, that are connected in series. The hybrid network is developed using the open-source software Tensorflow63 with Keras Application Programming Interface (API),64 and its architecture is shown in Fig. 1(b and c). The first part is a DCNN, and its main function is to extract spatial features from transient deformed profiles of the flowing capsule. As shown in Fig. 1(b), the inputs of the DCNN are binary images of capsule instantaneous profiles at T = T1 ∼ Ts, where the subscript s denotes the sth moment. Note that the mass centre of a capsule is at the centre of each binary image which covers a square domain with a side length of 2l. Spatial features of the capsule images are learned and converted to a lower-dimensional form by the convolutional and pooling layers of the DCNN. The output is then reshaped by a flattening operation into a feature vector, represented by x = x1 ∼ xs, which is then fed to the LSTM neural network that represents the second half of the hybrid network. As shown in Fig. 1(c), the main function of the LSTM network is to build the temporal connections between the DCNN outputs and use them to predict the membrane viscosity and elasticity of the capsule. More details of the two networks are given below.The architecture of the DCNN is shown in Fig. 1(b), where there are four convolutional blocks, within each a convolutional and a pooling layers are in sequence. These are followed by a flattening operation. The convolutional layer consists of a few filters, which are much smaller in spatial dimensions than the input image. During the convolution operation between each filter and the input image, the filter slides through the entire image and the filter weights make an elementwise scalar product with each small region of the input image (see Fig. 2(a)), following:40
 | (4) |
| oij = σ(dij + b), | (5) |
| σ(z) = max(0, z). | (6) |
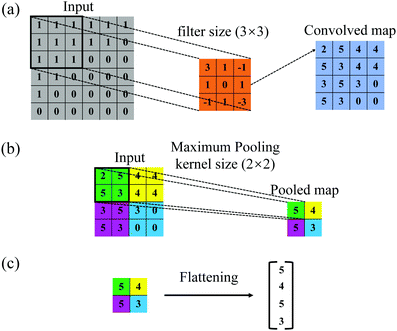 | ||
| Fig. 2 (a) Convolution, (b) maximum pooling, and (c) flattening operations in the convolutional, pooling and flattening layers, respectively, of the DCNN. | ||
The pooling layer usually follows the convolutional layer and reduce the dimension of the output of the convolutional layer. In the present study, we have used the maximum pooling operation that gives the maximum of the numbers in the pooling kernel (see Fig. 2(b)). After the last maximum pooling, a flattening operation is conducted on the pooled feature maps. The flattening operation converts the two-dimensional digital feature maps into single-column feature vectors (illustrated in Fig. 2(c)), so that the outputs of the DCNN can be processed by the connected LSTM neural network (Fig. 1(c)).
The LSTM neural network builds up the temporal connections between sequential feature vectors using memory cells (shown in Fig. 1(c)). Each memory cell contains three gates: the forget gate (FG), the input gate (IG) and the output gate (OG), which regulate the flow of information by selectively adding information (IG), removing information (FG), or letting it through to the next cell (OG). A memory cell of the time instance Tt takes the cell state, cell output of the previous memory cell (i.e., ct−1 and ht−1, respectively, which carry historical information), and the current feature vector xt as inputs, and generates its current cell state ct and output ht, that can be fed to the next memory cell, or be used to make predictions.
The equations of a memory cell to compute its gates and states are as shown in the following equations:66
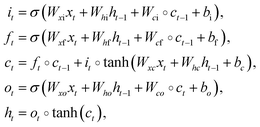 | (7) |
 denotes the element-wise product, the W terms denote weight matrixes (e.g. Wxi is the weights matrix from the input to the input gate), the b terms denote bias vectors (e.g. bi is the input gate bias vector), the subscript t − 1 and t indicate the last moment and current moment, respectively, the sigmoid function denoted by σ follows
| σ(ε) = 1/(1 + e−ε). | (8) |
The hyperbolic tangent function denoted by tanh is given by
| tanh(ε) = (1 − e−2ε)/(1 + e−2ε). | (9) |
At the final memory cell, the cell output hs (s = 5 in the present study) is fed into two output layers, which conduct regression tasks and predict the capsule membrane viscosity and shear elasticity. The equation of output vector ys is given by
| ys = δ(Wyhs) + by, | (10) |
The present DCNN-LSTM neural network is trained on a set of examples. Each example contains a few binary images of the instantaneous profiles of a capsule when it is flowing in the channel bifurcation region (see the binary images of Fig. 1(b)), and the corresponding parameters such as the capsule membrane viscosity and shear elasticity. The examples are obtained from computational simulations using the immersed boundary lattice Boltzmann method.
During training, the internal parameters of the network are adjusted to minimize a loss function that describes how close the predictions are to the ground truth. The total loss consists of the losses from each regression tasks. We use the square loss function for a regression task:
| Lregi = ‖yregi − yi‖2, | (11) |
 | (12) |
To optimize the trainable internal parameters, we derive the gradients of the loss function Ltotal with respect to these parameters using a backpropagation algorithm,67 and then an optimizer, which employs a stochastic gradient descent algorithm called ADAM,68 is used to update the values of these parameters. Mini-batch mode training is applied, and exposing all training samples to the DCNN-LSTM neural network once is called an epoch. At the end of each epoch, the DCNN-LSTM neural network is validated with a small portion of the training samples (i.e., 10% in the present study) which have not been used in the training process. With the process iterating, the total loss decreases and converges towards small values. To avoid overfitting, a batch-normalization69 has been applied in the present model. The training process is terminated with a predefined early stopping criteria, when the total loss of validation shows no further improvement over several iterations even after reducing the learning rate. After training and validation, the DCNN-LSTM neural network can be used to predict the membrane viscosity and shear elasticity of flowing microcapsule from its transient profiles in the channel bifurcation region.
The performance of the present DCNN-LSTM neural network is affected by its certain hyperparameters. Our extensive validations and tests suggest that the following choices of hyperparameters lead to the optimum prediction accuracy of the present: the DCNN has four blocks, each of which has one convolutional layer and one max-pooling layer in sequence. For each convolutional layer, the filter size is 3 × 3 with a stride of one and the same padding operation. The number of filters in each of the four convolutional layers is 16, 32, 64, and 128, respectively. For each max-pooling layer, the kernel size is 2 × 2 with a stride of two and the same padding operation. In each memory cell of the LSTM network, the number of neurons in the FG, IG and OG is 128. During training, the size of the mini-batch is chosen to be 32. An initial learning rate of 0.001 is applied with a learning rate scheduler, which gradually reduces the learning rate when the total loss of validation shows no improvement over epochs.
3 Results and discussion
3.1 Prediction of membrane viscosity and shear elasticity
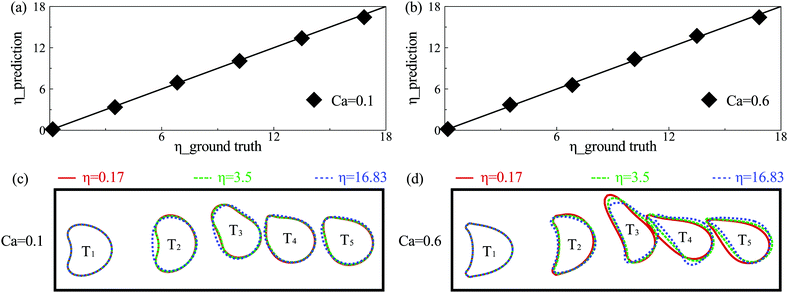
To test the prediction accuracy of the present DCNN-LSTM neural network, we first use it to infer capsule membrane viscosity η. Both the training and testing samples are obtained from numerical simulation. The training data contains 52 samples, and each sample consists of five binary images of instantaneous cross-sectional profile of a capsule at different moments (see Fig. 1(b)). The capsule membrane viscosity η ranges from 0.03 to 17, with Ca = 0.1 and 0.6, respectively. The values of parameters considered cover the range of moderate to large deformation of a capsule that can be readily achieved in experiments. The testing data, not used in the training process of the network, are within the same ranges of parameters. Fig. 3(a and b) compare the predicted η with the corresponding ground truth at Ca = 0.1 and 0.6, respectively. Excellent agreements can be observed. The mean absolute percentage error (MAPE) of predicted η from corresponding ground truth, evaluated from entire testing samples, is 3.38% at Ca = 0.1 and 3.47% at Ca = 0.6, which suggests excellent prediction accuracy of the present model. In the present study, the MAPE of a parameter A is defined as: | (13) |
In the present study, training samples distribute evenly in the parametric space considered. We find that the size of training samples (i.e., the number of samples used in training) has a significant effect on the prediction accuracy of the DCNN-LSTM network. With the same network of Fig. 3(b) for capsules at Ca = 0.6, we reduce the training sample size from 52 to 26, and then to 13. We find that the MAPE of predicted η from the corresponding ground truth increases sharply from 3.47% to 12.48%, and then to 26.24%.
The effect of membrane viscosity on capsule deformation in the branch channel can be seen from Fig. 3(c and d). It has no effect on the first profile of the capsule, which is still at its steady-state in the feeding channel. However, membrane viscosity can significantly limit the deformation of a capsule during its transient motion in the channel bifurcation. We also notice that when η ≤ 3.5, its effect on capsule deformation is weak, in particular for a capsule with moderate deformation (e.g., at Ca = 0.1). Capsule instantaneous profiles are visually identical at membrane viscosity η = 0.17 and 3.5. However, the present DCNN-LSTM neural network seems to be able to learn the subtle differences between capsule profiles and give an accurate prediction of the capsule membrane viscosity.
It is worth mentioning that the present mechanical models for both fluid flow and capsule dynamics can conveniently take into account the inertial effect,57 which is relevant to inertial microfluidics where the average flow speed can reach meters per second.24 We conduct studies similar to those in Fig. 3 and consider the same capsule at a much higher flow Reynolds number Re = 40 in the inertial flow regime. We find that the prediction accuracy of membrane viscosity η by the present DCNN-LSTM neural network is similar to that of Fig. 3 (not shown). In practical experiments, for a microcapsule with a radius of 50 mm suspended in water at room temperature, a flow Reynolds number of Re = 40 can be achieved with an average flow speed of 0.24 m s−1. This corresponds to a pressure drop of 2.77 kPa per centimetre channel length in a microchannel with a half cross-sectional width of 83 mm (β = 0.6).
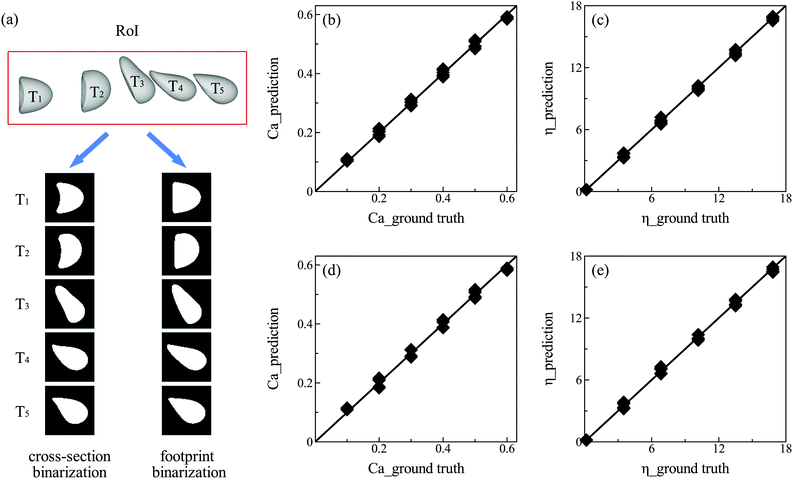
Note that the present DCNN-LSTM neural network can be conveniently extended to predictions of multiple mechanical properties of the capsule membrane. This is done by adding more parallel output layers. In the present study, we demonstrate its extension to the prediction of capsule capillary number Ca, besides the membrane viscosity η. The membrane shear elasticity Gs is calculated from the capillary number by Gs = μV/Ca. The additional prediction task involves an increase in the training sample size. Here the training data have been extended from those used in Fig. 3, to include additional 260 samples, with Ca ranging from 0.1 to 0.6, in the same range of membrane viscosity η. The testing data consist of 36 samples at six values of η and six values of Ca (see Fig. 4(b and c)). Fig. 4(b and c) compare the predicted Ca and η with their corresponding ground truth. The MAPEs of Ca and η from their ground truth are 3.65% and 3.42%, respectively, which suggest excellent prediction accuracy of the present model.
3.2 Prediction using capsule footprint profiles
Often it is not easy to obtain the cross-sectional profile of a capsule from an experimental image when the capsule is experiencing large deformation inside a microchannel. Such a case can be seen from Fig. 4(a) for a capsule with Ca = 0.6, where the rear region of the capsule forms a concave parachute shape and part of it hides in the shadow. In previous studies, it was necessary to manually erase the concave region to obtain the cross-sectional shape,70 which may cost considerable processing time. To solve this difficult problem, we test if the present DCNN-LSTM neural network can make accurate predictions from the footprint profiles of a capsule (see images on the right side of Fig. 4(a)). The training and testing data, using samples of footprint profiles, are prepared from the same cases employed in Fig. 4(b and c). With the new solution, we compare the predicted capillary number Ca and membrane viscosity η with their corresponding ground truth in Fig. 4(d and e). The MAPEs of Ca and η from their ground truth are 4.98% and 4.78%, respectively, which are only slightly higher than those using the cross-sectional profiles of the capsule, that contain more geometrical information of the capsule's rear region.3.3 Comparison with an inverse method
We compare the performance of the present DCNN-LSTM neural network with that of a conventional inverse method. There are mainly two types of conventional inverse methods. The first type compares simple unique features of a deformed capsule measured in the experiment, such as the total length along the flow direction, with those of a data bank that have been obtained by theoretical predictions covering a wide range of parameters. The mechanical properties of the capsule are inferred from the theoretical prediction that gives the best fit.26 The second type of inverse method is similar to the first type in that it also infers properties from the best fit, however, the second type of method compares the entire profile of a deformed capsule.In the present branched channel geometry, the dynamic deformation of the capsule in the bifurcation region is complicated and cannot be captured by simply considering the capsule length, we therefore use the second type of inverse method. We compare all the five instantaneous capsule profiles of a testing sample with those corresponding profiles of each sample image stored in a data bank. The geometrical difference between capsule profiles is quantified by the mean Hausdorff distance (MHD)71 in the present study. To explain the MHD, let us consider a set of m′ points, R = {r1, r2, r3,…rm′} from the ith instantaneous capsule profile of a testing image, and another set of n′ points, S = {s1, s2, s3,…sn′} from the ith instantaneous capsule profile of an image of the data bank. Assuming that the two sets of points have the same centre of mass, the MHD ![[h with combining macron]](https://www.rsc.org/images/entities/i_char_0068_0304.gif) i(R,S) of the two capsule profiles is defined as:
i(R,S) of the two capsule profiles is defined as:
 | (14) |
 | (15) |
![[H with combining macron]](https://www.rsc.org/images/entities/i_char_0048_0304.gif) (R,S) indicates the best fit. The properties of the capsule in the testing sample are then considered to be identical to those of the capsule from the data bank that gives the best fit.
(R,S) indicates the best fit. The properties of the capsule in the testing sample are then considered to be identical to those of the capsule from the data bank that gives the best fit.
We first compare the accuracy of the DCNN-LSTM neural network and the inverse method in predicting the capsule membrane viscosity η and capillary number Ca. The same training and testing samples of Fig. 4(b and c) have been used here. In the inverse method, the training samples are used as the data bank, which provides images that a testing image can be compared with. We find both methods can accurately predict Ca with a comparable MAPE that is around 3%. However, the present DCNN-LSTM neural network is considerably more accurate than the inverse method in predicting the capsule membrane viscosity η. The MAPE by the DCNN-LSTM neural network is 3.42%, which is significantly lower than 16.29% by the inverse method. We notice that the DCNN-LSTM neural network significantly outperforms the inverse method when the capsule membrane viscosity is low and therefore only weakly affects the capsule deformation (see capsule profiles in Fig. 3). This result is actually not surprising. In the inverse method, the cross-sectional profile of a capsule membrane has been discretised into 128 elements. While in the present DCNN-LSTM neural network, each binary image has an area of 2l × 2l that is covered by 80 × 80 pixels. The cross-sectional profile of a capsule membrane is covered by more than 150 pixels, which are considerably more than the membrane elements used in the inverse method. The higher resolution may have resulted in a better prediction accuracy.
Next, we compare the throughput rate of the present DCNN-LSTM neural network and the inverse method. There are mainly two steps in the prediction process. The first step is image processing where the original image of a deformed capsule is converted into a form that can be used as an input by a prediction method. In the second step a prediction method calculates the membrane shear elasticity and viscosity based on the transient capsule profiles in the channel bifurcation. For the inverse method, image processing involves edge detection and segmentation of the five cross-sectional profiles of a capsule membrane, with each profile discretised into 128 equal-sized elements. This can be done conveniently using Matlab and 1351 samples can be processed within a single second using a desktop personal computer (Intel Core i7, 4 GHz). Image processing in the present DCNN-LSTM neural network is mainly a binarization process where the five instantaneous capsule profiles of a sample are converted into five binary images with value 1 inside the capsule and 0 outside (see Fig. 1(b)). A Matlab subroutine can process 3975 samples per second with the same desktop computer.
Regarding the second step of processing, from Table 1 it can be seen that the prediction throughput rate of the present DCNN-LSTM neural network is higher than that of the inverse method by five orders of magnitude. The high throughput rate of the DCNN-LSTM neural network is not surprising and is mainly due to two reasons. Firstly, compared with the inverse method which needs to conduct a time-consuming process to find the best fit, the present DCNN-LSTM neural network has completed training offline before making a prediction, and the prediction process only involves a limited number of algebraic calculations. Secondly, computations of the DCNN-LSTM neural network are GPU based and utilize parallel computing, which is the case for the present prediction (GPU model: Tesla V100-16GB, 1.38 GHz).
| Throughput rate/method | Inverse method | Present method |
|---|---|---|
| Image processing (sample/s) | 1351 | 3975 |
| Prediction (sample/s) | 0.01 | 2470 |
3.4 Comparison with a DCNN
Note that we can use a simple DCNN to predict the capsule membrane properties from its transient deformation in the RoI. Such a DCNN is also developed in the present study and its architecture is shown in Fig. 5. Compared with the architecture of the DCNN-LSTM neural network, the only difference of the DCNN is that it has replaced the LSTM network by a fully connected layer which has 256 neurons in the present study. For the DCNN, a sample image used for training or testing is in the form of a binary image which stacks multiple instantaneous capsule profiles in the RoI, as shown in Fig. 5.It is very interesting to compare the prediction accuracy and throughput rate of the two neural networks. Here we consider the performance of both networks with different numbers of instantaneous capsule profiles within the same RoI, using the same cases of Fig. 3. As illustrated in Fig. 6(a), we double the image capturing frequency in each test so that the number of capsule profiles in the RoI increases from two, which is the minimum for analysing time evolution of capsule deformation, to three, five and finally to nine, where capsule profiles have overlapped (see the column of sample images used by the DCNN) due to the small time interval between two adjacent profiles.
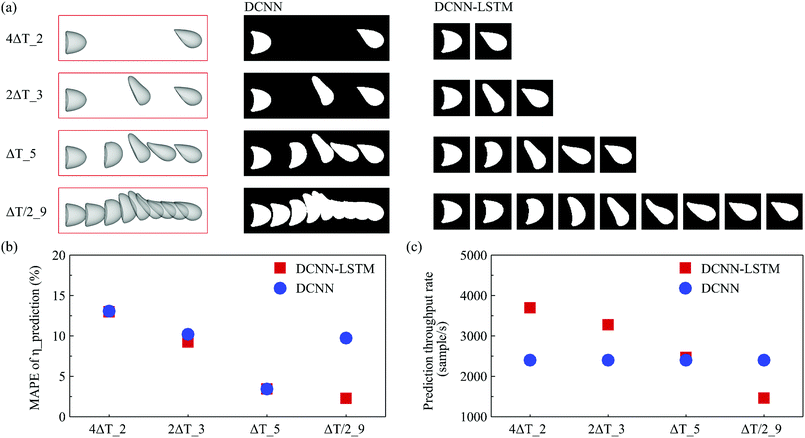 | ||
| Fig. 6 (a) Increasing the number of capsule profiles in the RoI by doubling the image capturing frequency. The term mΔT_n is the label of a sample where there are n capsule profiles in the RoI and the time interval between two adjacent capsule profiles is mΔT, where ΔT = 1.34l/V. The corresponding binary images used as inputs of the DCNN and DCNN-LSTM neural network are shown in the middle and right columns, respectively. Comparison of (b) the MAPE of the predicted membrane viscosity η from the corresponding ground truth, and (c) the prediction throughput rate, of the two networks. The same cases used in Fig. 3 have been employed in the tests here. | ||
The comparisons of MAPE of the predicted membrane viscosity η from the corresponding ground truth and the prediction throughput rate of the two networks are presented in Fig. 6(b and c). From Fig. 6(b), it can be seen that when the number of capsule profiles is small and there is no overlap between capsule profiles, the prediction accuracy of the two networks are comparable. With the number of capsule instantaneous profiles in the RoI increases, the time evolution of capsule deformation is better resolved which has led to higher prediction accuracy for both networks. However, we notice that with nine instantaneous capsule profiles in the RoI, the overlap of capsule profiles of sample images used by the DCNN causes loss of local geometrical information, which has resulted in a reduced prediction accuracy. The DCNN-LSTM neural network, however, does not have such a limitation because it processes individual instantaneous capsule images.
It can be seen from Fig. 6(c) that the prediction throughput rate of the DCNN does not depend on the number of capsule images in the RoI. This is due to the fact that the DCNN processes sample images covering the same RoI with the size of 8l × 2.5l represented by 320 × 100 pixels. For the DCNN-LSTM neural network, the amount of data that need to be processed is proportional to the number of capsule profiles, and therefore the prediction throughput rate decreases with the number of capsule profiles in a sample. Note that the two networks have similar prediction throughput rates when there are five capsule profiles in the samples. In such a situation, the total number of pixels of a DCNN-LSTM sample is 80 × 80 × 5 = 32![[thin space (1/6-em)]](https://www.rsc.org/images/entities/char_2009.gif) 000, which is the same to that of a DCNN sample. With the same amount of data contained in the samples, we notice that the DCNN-LSTM neural network has a slightly higher prediction throughout rate than the DCNN, possibly due to the fact that there are fewer neurons in the LSTM network compared with the FC layer of the DCNN.
000, which is the same to that of a DCNN sample. With the same amount of data contained in the samples, we notice that the DCNN-LSTM neural network has a slightly higher prediction throughout rate than the DCNN, possibly due to the fact that there are fewer neurons in the LSTM network compared with the FC layer of the DCNN.
3.5 Effect of image resolution
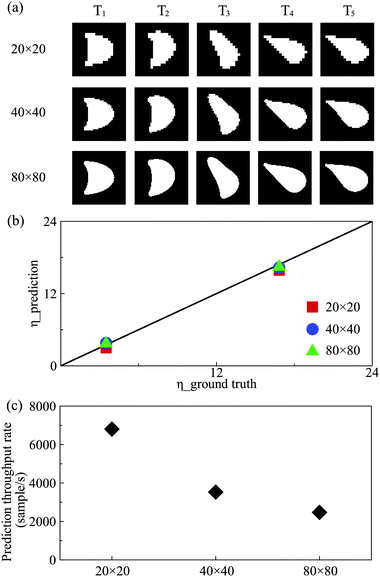
In experiments, images of capsules or biological cells may have different resolutions which can affect the performance of the present DCNN-LSTM neural network. We therefore test this effect by considering capsule images with three different levels of resolution (illustrated in Fig. 7(a)). Note that both training and testing samples, with various resolutions, are prepared using the same cases employed in Fig. 3(b). From Fig. 7(b), it is seen that with the image resolution dropping to 20 pixels in each direction, deviation of the predicted η from the corresponding ground truth has increased. The MAPE of the predicted η from the corresponding ground truth increases from 4.25%, using images with 80 pixels in each direction, to 10.09%. However, the sacrifice of prediction accuracy is associated with a significant increase of prediction throughput rate, which has grown from 2470 to 6800 samples per second, that can be seen from Fig. 7(c). This feature may be very useful to applications where the processing throughput rate is more important than precise membrane rheology.3.6 Effect of capsule off-centre distance
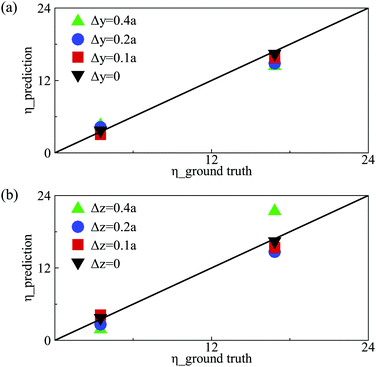
Note that capsules have been initially centre-aligned in the feeding channel in the present numerical simulations. In experiments, microcapsules or biological cells may flow into the channel with a random distribution of off-centre initial positions.72 We therefore also test the performance of the present DCNN-LSTM neural network by predicting the membrane viscosity η of capsules which are released from different initial off-centre positions. We consider the same capsules of Fig. 3(b) with low and moderate membrane viscosity, and use the same DCNN-LSTM neural network of Fig. 3(b). Fig. 8 compares predicted η with the corresponding ground truth, for testing samples with different initial off-centre distances along the channel depth and width directions, respectively. The prediction accuracy of the DCNN-LSTM neural network deteriorates with the capsule off-centre distance, and is particularly sensitive to capsule off-centre distance along the channel width direction. The results suggest that in experiment an upstream flow-focusing module73,74 will be needed in order to align capsules with the channel centreline in the feeding channel.3.7 Performance of the network in extrapolation
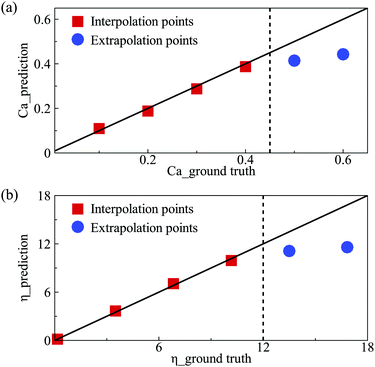
We also test the prediction accuracy of the present DCNN-LSTM network in extrapolation. We use the same network of Fig. 4(b and c) but train it with samples that cover a narrower parametric space. The parametric boundaries of the training samples are marked by dashed lines in Fig. 9(a and b), which compare the predicted Ca and η, respectively, with the corresponding ground truth. In Fig. 9, a few testing samples are outside the parametric space of the training samples, and therefore the DCNN-LSTM network needs to extrapolate to predict values of Ca or η from those samples. From the results shown in Fig. 9, we can see that the extrapolation accuracy of the present neural network deteriorates with the extrapolation distance of a testing sample, and is generally not satisfactory.4 Conclusions
We have developed a novel approach, by integrating a DCNN-LSTM neural network with a high-fidelity mechanistic capsule model, for high throughput and accurate characterisation of the membrane viscosity and shear elasticity of flowing microcapsules. We have demonstrated the high accuracy of the approach through extensive tests against computer-simulation data where the ground truth is exactly known. Unlike conventional inverse methods, which need to conduct a time-consuming process to identify the best fit, the present DCNN-LSTM neural network is trained offline and its prediction process only involves a limited number of simple algebraic calculations. The present method can therefore increase the throughput rate by five orders of magnitude and characterise thousands of capsules per second. The present approach is also very flexible in that it can deal with both the cross-section and footprint capsule profiles with comparable high accuracy. Furthermore, our new approach can conveniently characterise capsules with large deformation in inertial flow regimes, due to the versatility of the present mechanical models for both capsule dynamics and fluid flow. We have compared the performance of the DCNN-LSTM neural network with a simple DCNN, which has also been proposed in the present study, and show that the DCNN-LSTM neural network is superior and has fewer restrictions.Note that the present study has its limitations. Firstly, we have only considered capsules with a KV membrane in a narrow range of associated parameters. For practical unknown microcapsules, there may be a range of possibilities in membrane constitutive laws and the measurement of the membrane elasticity and viscosity will depend on the choice of the constitutive models in the regime of large deformation.21 In principle our method can be extended to cover additional membrane constitutive laws (e.g., power law models75,76) and a much wider parametric space, to avoid extrapolation. However, this may involve a significant expansion of the size of training samples and possibly also the architecture of the network. Secondly, the present branched channel is a flow-through device which can facilitate high-throughput measurement, however, there is a broad scope to optimize the geometry to promote tank-treading motion of the capsule17 at the channel bifurcation, so that the capsule dynamics is more sensitive to the membrane viscosity. Finally, the present approach has only been tested using simulation results. Validation with experiments will be an important step in our future research. The present work, as a preliminary study, suggests that the DCNN-LSTM neural network may serve as a promising tool for high throughput mechanical characterisation of flowing microcapsules or biological cells.
Conflicts of interest
There are no conflicts to declare.Acknowledgements
This work was partially supported by the UK Engineering and Physical Science Research Council (EP/K000128/1) and the China Scholarship Council. We thank the referees for their constructive comments. We also acknowledge the effort of Ruixin Lu in generating simulation data.References
- C. T. Lim, E. H. Zhou and S. T. Quek, J. Biomech., 2006, 39, 195–216 CrossRef CAS.
- A. Mietke, O. Otto, S. Girardo, P. Rosendahl, A. Taubenberger, S. Golfier, E. Ulbricht, S. Aland, J. Guck and E. Fischer-Friedrich, Biophys. J., 2015, 109, 2023–2036 CrossRef CAS.
- M. Laumann, W. Schmidt, A. Farutin, D. Kienle, S. Förster, C. Misbah and W. Zimmermann, Phys. Rev. Lett., 2019, 122, 128002 CrossRef CAS.
- O. Otto, P. Rosendahl, A. Mietke, S. Golfier, C. Herold, D. Klaue, S. Girardo, S. Pagliara, A. Ekpenyong and A. Jacobi, et al. , Nat. Methods, 2015, 12, 199 CrossRef CAS.
- E. M. Darling and D. Di Carlo, Annu. Rev. Biomed. Eng., 2015, 17, 35–62 CrossRef CAS.
- A. E. Mayfield, E. L. Tilokee, N. Latham, B. McNeill, B.-K. Lam, M. Ruel, E. J. Suuronen, D. W. Courtman, D. J. Stewart and D. R. Davis, Biomaterials, 2014, 35, 133–142 CrossRef CAS.
- M. Lorch, M. J. Thomasson, A. Diego-Taboada, S. Barrier, S. L. Atkin, G. Mackenzie and S. J. Archibald, Chem. Commun., 2009, 6442–6444 RSC.
- S. V. Bhujbal, P. de Vos and S. P. Niclou, Adv. Drug Delivery Rev., 2014, 67, 142–153 CrossRef.
- Z. L. Zhou, A. H. W. Ngan, B. Tang and A. X. Wang, J. Mech. Behav. Biomed. Mater., 2012, 8, 134–142 CrossRef CAS.
- R. M. Hochmuth, J. Biomech., 2000, 33, 15–22 CrossRef CAS.
- M. Rachik, D. Barthès-Biesel, M. Carin and F. Edwards-Lévy, J. Colloid Interface Sci., 2006, 301, 217–226 CrossRef CAS.
- J. Guck, S. Schinkinger, B. Lincoln, F. Wottawah, S. Ebert, M. Romeyke, D. Lenz, H. M. Erickson, R. Ananthakrishnan and D. Mitchell, et al. , Biophys. J., 2005, 88, 3689–3698 CrossRef CAS.
- N. Wang and D. E. Ingber, Biochem. Cell Biol., 1995, 73, 327–335 CrossRef CAS.
- P. H. Wu, D. R. B. Aroush, A. Asnacios, W. C. Chen, M. E. Dokukin, B. L. Doss, P. Durand-Smet, A. Ekpenyong, J. Guck and N. V. Guz, et al. , Nat. Methods, 2018, 15, 491–498 CrossRef CAS.
- K. S. Chang and W. L. Olbricht, J. Fluid Mech., 1993, 250, 609–633 CrossRef CAS.
- A. Walter, H. Rehage and H. Leonhard, Colloids Surf., A, 2001, 183, 123–132 CrossRef.
- C. de Loubens, J. Deschamps, F. Edwards-Lévy and M. Leonetti, J. Fluid Mech., 2016, 789, 750–767 CrossRef CAS.
- G. Pieper, H. Rehage and D. Barthès-Biesel, J. Colloid Interface Sci., 1998, 202, 293–300 CrossRef CAS.
- M. Husmann, H. Rehage, E. Dhenin and D. Barthès-Biesel, J. Colloid Interface Sci., 2005, 282, 109–119 CrossRef CAS.
- C. de Loubens, J. Deschamps, M. Georgelin, A. Charrier, F. Edwards-Lévy and M. Leonetti, Soft Matter, 2014, 10, 4561–4568 RSC.
- C. de Loubens, J. Deschamps, G. Boedec and M. Leonetti, J. Fluid Mech., 2015, 767, R3 CrossRef.
- Y. Lefebvre, E. Leclerc, D. Barthès-Biesel, J. Walter and F. Edwards-Lévy, Phys. Fluids, 2008, 20, 123102 CrossRef.
- T. X. Chu, A.-V. Salsac, E. Leclerc, D. Barthès-Biesel, H. Wurtz and F. Edwards-Lévy, J. Colloid Interface Sci., 2011, 355, 81–88 CrossRef CAS.
- D. R. Gossett, H. T. K. Tse, S. A. Lee, Y. Ying, A. G. Lindgren, O. O. Yang, J. Rao, A. T. Clark and D. Di Carlo, Proc. Natl. Acad. Sci. U. S. A., 2012, 109, 7630–7635 CrossRef CAS.
- S. Byun, S. Son, D. Amodei, N. Cermak, J. Shaw, J. H. Kang, V. C. Hecht, M. M. Winslow, T. Jacks and P. Mallick, et al. , Proc. Natl. Acad. Sci. U. S. A., 2013, 110, 7580–7585 CrossRef CAS.
- X. Q. Hu, B. Sévénié, A. V. Salsac, E. Leclerc and D. Barthès-Biesel, Phys. Rev. E: Stat., Nonlinear, Soft Matter Phys., 2013, 87, 063008 CrossRef.
- G. Prado, A. Farutin, C. Misbah and L. Bureau, Biophys. J., 2015, 108, 2126–2136 CrossRef CAS.
- P.-Y. Gires, D. Barthès-Biesel, E. Leclerc and A.-V. Salsac, J. Mech. Behav. Biomed. Mater., 2016, 58, 2–10 CrossRef CAS.
- C. Trégouët, T. Salez, C. Monteux and M. Reyssat, Phys. Rev. Fluids, 2018, 3, 053603 CrossRef.
- B. Fregin, F. Czerwinski, D. Biedenweg, S. Girardo, S. Gross, K. Aurich and O. Otto, Nat. Commun., 2019, 10, 415 CrossRef CAS.
- C. Trégouët, T. Salez, C. Monteux and M. Reyssat, Soft Matter, 2019, 15, 2782–2790 RSC.
- M. H. Panhwar, F. Czerwinski, V. A. S. Dabbiru, Y. Komaragiri, B. Fregin, D. Biedenweg, P. Nestler, R. H. Pires and O. Otto, Nat. Commun., 2020, 11, 1–13 Search PubMed.
- E. D. Cubuk, S. S. Schoenholz, J. M. Rieser, B. D. Malone, J. Rottler, D. J. Durian, E. Kaxiras and A. J. Liu, Phys. Rev. Lett., 2015, 114, 108001 CrossRef CAS.
- T. A. Sharp, S. L. Thomas, E. D. Cubuk, S. S. Schoenholz, D. J. Srolovitz and A. J. Liu, Proc. Natl. Acad. Sci. U. S. A., 2018, 115, 10943–10947 CrossRef CAS.
- D. Richard, M. Ozawa, S. Patinet, E. Stanifer, B. Shang, S. A. Ridout, B. Xu, G. Zhang, P. K. Morse and J.-L. Barrat, et al. , Phys. Rev. Mater., 2020, 4, 113609 CrossRef CAS.
- Y. LeCun, Y. Bengio and G. Hinton, Nature, 2015, 521, 436 CrossRef CAS.
- A. Kihm, L. Kaestner, C. Wagner and S. Quint, PLoS Comput. Biol., 2018, 14, e1006278 CrossRef.
- K. Swanson, S. Trivedi, J. Lequieu, K. Swanson and R. Kondor, Soft Matter, 2020, 16, 435–446 RSC.
- J. W. Khor, N. Jean, E. S. Luxenberg, S. Ermon and S. K. Y. Tang, Soft Matter, 2019, 15, 1361–1372 RSC.
- V. Sekar, M. Zhang, C. Shu and B. C. Khoo, AIAA J., 2019, 57, 993–1003 CrossRef.
- S. Hochreiter and J. Schmidhuber, Neural Comput., 1997, 9, 1735–1780 CrossRef CAS.
- X. Y. Qing and Y. G. Niu, Energy, 2018, 148, 461–468 CrossRef.
- Z. C. Lipton, D. C. Kale, C. Elkan and R. Wetzel, 2015, arXiv preprint arXiv:1511.03677.
- D. Fooshee, A. Mood, E. Gutman, M. Tavakoli, G. Urban, F. Liu, N. Huynh, D. Van Vranken and P. Baldi, Mol. Syst. Des. Eng., 2018, 3, 442–452 RSC.
- R. Skalak, A. Tozeren, R. P. Zarda and S. Chien, Biophys. J., 1973, 13, 245–264 CrossRef CAS.
- J. B. Freund, Annu. Rev. Fluid Mech., 2014, 46, 67–95 CrossRef.
- D. Barthès-Biesel, Annu. Rev. Fluid Mech., 2016, 48, 25–52 CrossRef.
- D. Barthès-Biesel and H. Sgaier, J. Fluid Mech., 1985, 160, 119–135 CrossRef.
- A. Yazdani and P. Bagchi, J. Fluid Mech., 2013, 718, 569–595 CrossRef CAS.
- R. M. Hochmuth, P. R. Worthy and E. A. Evans, Biophys. J., 1979, 26, 101–114 CrossRef CAS.
- T. W. Secomb and R. Skalak, Q. J. Mech. Appl. Math., 1982, 35, 233–247 CrossRef.
- A. Diaz, D. Barthès-Biesel and N. Pelekasis, Phys. Fluids, 2001, 13, 3835–3838 CrossRef CAS.
- O. Y. Zhong-Can and W. Helfrich, Phys. Rev. A: At., Mol., Opt. Phys., 1989, 39, 5280 CrossRef.
- C. Dupont, A.-V. Salsac, D. Barthès-Biesel, M. Vidrascu and P. Le Tallec, Phys. Fluids, 2015, 27, 051902 CrossRef.
- Y. Sui, Y. T. Chew, P. Roy and H. T. Low, J. Comput. Phys., 2008, 227, 6351–6371 CrossRef.
- Y. Sui, Y. T. Chew, P. Roy, Y. P. Cheng and H. T. Low, Phys. Fluids, 2008, 20, 112106 CrossRef.
- Z. Wang, Y. Sui, A. V. Salsac, D. Barthès-Biesel and W. Wang, J. Fluid Mech., 2016, 806, 603–626 CrossRef CAS.
- M. Bouzidi, M. Firdaouss and P. Lallemand, Phys. Fluids, 2001, 13, 3452–3459 CrossRef CAS.
- Z. Guo, C. Zheng and B. Shi, Chin. Phys., 2002, 11, 366–374 CrossRef.
- C. S. Peskin, J. Comput. Phys., 1977, 25, 220–252 CrossRef.
- Y. Sui, H. T. Low, Y. T. Chew and P. Roy, Phys. Rev. E: Stat., Nonlinear, Soft Matter Phys., 2008, 77, 016310 CrossRef CAS.
- Z. Wang, Y. Sui, A. V. Salsac, D. Barthès-Biesel and W. Wang, J. Fluid Mech., 2018, 849, 136–162 CrossRef CAS.
- M. Abadi, P. Barham, J. Chen, Z. Chen, A. Davis, J. Dean, M. Devin, S. Ghemawat, G. Irving and M. Isard, et al., Proceedings of 12th USENIX symposium on operating systems design and implementation, California, USA, 2016, pp. 265–283.
- A. Gulli and S. Pal, Deep Learning with Keras, Packt Publishing Ltd, Birmingham, UK, 2017 Search PubMed.
- G. E. Dahl, T. N. Sainath and G. E. Hinton, Proceedings of 38th international conference on acoustics, speech and signal processing, Vancouver, Canada, 2013, pp. 8609–8613.
- H. Sak, A. Senior and F. Beaufays, 2014, arXiv preprint arXiv:1402.1128.
- D. E. Rumelhart, G. E. Hinton and R. J. Williams, Nature, 1986, 323, 533–536 CrossRef.
- D. P. Kingma and J. L. Ba, 2014, arXiv preprint arXiv:1412.6980.
- S. Ioffe and C. Szegedy, 2015, arXiv preprint arXiv:1502.03167.
- F. Risso, F. Collé-Paillot and M. Zagzoule, J. Fluid Mech., 2006, 547, 149–173 CrossRef CAS.
- M. P. Dubuisson and A. K. Jain, Proceedings of 12th international conference on pattern recognition, Jerusalem, Israel, 1994, pp. 566–568.
- A. Guckenberger, A. Kihm, T. John, C. Wagner and S. Gekle, Soft Matter, 2018, 14, 2032–2043 RSC.
- D. Di Carlo, D. Irimia, R. G. Tompkins and M. Toner, Proc. Natl. Acad. Sci. U. S. A., 2007, 104, 18892–18897 CrossRef CAS.
- A. A. Nawaz, X. Zhang, X. Mao, J. Rufo, S.-C. S. Lin, F. Guo, Y. Zhao, M. Lapsley, P. Li and J. P. McCoy, et al. , Lab Chip, 2014, 14, 415–423 RSC.
- A. Pandey, S. Karpitschka, C. H. Venner and J. H. Snoeijer, J. Fluid Mech., 2016, 799, 433–447 CrossRef CAS.
- H. Perrin, A. Eddi, S. Karpitschka, J. H. Snoeijer and B. Andreotti, Soft Matter, 2019, 15, 770–778 RSC.
| This journal is © The Royal Society of Chemistry 2021 |

