
 Open Access Article
 This Open Access Article is licensed under a
 Creative Commons Attribution 3.0 Unported Licence
Effects of lipid heterogeneity on model human brain lipid membranes†
Sze May
Yee
 a,
Richard J.
Gillams
b,
Sylvia E.
McLain
c and
Christian D.
Lorenz
*a
a,
Richard J.
Gillams
b,
Sylvia E.
McLain
c and
Christian D.
Lorenz
*a
aDepartment of Physics, King's College London, London WC2R 2LS, UK. E-mail: chris.lorenz@kcl.ac.uk
bSchool of Electronics and Computer Science, and Institute for Life Sciences, University of Southampton, Southampton SO17 1BJ, UK
cDepartment of Chemistry, School of Life Sciences, University of Sussex, Brighton BN1 9RH, UK
First published on 16th October 2020
Abstract
Cell membranes naturally contain a heterogeneous lipid distribution. However, homogeneous bilayers are commonly preferred and utilised in computer simulations due to their relative simplicity, and the availability of lipid force field parameters. Recently, experimental lipidomics data for the human brain cell membranes under healthy and Alzheimer's disease (AD) conditions were investigated, since disruption to the lipid composition has been implicated in neurodegenerative disorders, including AD [R. B. Chan et al., J. Biol. Chem., 2012, 287, 2678–2688]. In order to observe the effects of lipid complexity on the various bilayer properties, molecular dynamics simulations were used to study four membranes with increasing heterogeneity: a pure POPC membrane, a POPC and cholesterol membrane in a 1![[thin space (1/6-em)]](https://www.rsc.org/images/entities/char_2009.gif) :1 ratio (POPC–CHOL), and to our knowledge, the first realistic models of a healthy brain membrane and an Alzheimer's diseased brain membrane. Numerous structural, interfacial, and dynamical properties, including the area per lipid, interdigitation, dipole potential, and lateral diffusion of the two simple models, POPC and POPC–CHOL, were analysed and compared to those of the complex brain models consisting of 27 lipid components. As the membranes gain heterogeneity, a number of alterations were found in the structural and dynamical properties, and more significant differences were observed in the lateral diffusion. Additionally, we observed snorkeling behaviour of the lipid tails that may play a role in the permeation of small molecules across biological membranes. In this work, atomistic description of realistic brain membrane models is provided, which can add insight towards the permeability and transport pathways of small molecules across these membrane barriers.
:1 ratio (POPC–CHOL), and to our knowledge, the first realistic models of a healthy brain membrane and an Alzheimer's diseased brain membrane. Numerous structural, interfacial, and dynamical properties, including the area per lipid, interdigitation, dipole potential, and lateral diffusion of the two simple models, POPC and POPC–CHOL, were analysed and compared to those of the complex brain models consisting of 27 lipid components. As the membranes gain heterogeneity, a number of alterations were found in the structural and dynamical properties, and more significant differences were observed in the lateral diffusion. Additionally, we observed snorkeling behaviour of the lipid tails that may play a role in the permeation of small molecules across biological membranes. In this work, atomistic description of realistic brain membrane models is provided, which can add insight towards the permeability and transport pathways of small molecules across these membrane barriers.
1 Introduction
The cellular membrane is an essential component of every cell, forming barriers within the cell itself and with the external environment. These membranes are composed of a complex mixture of lipids and proteins that typically contain hundreds of different lipid species, which differ in headgroup and/or hydrocarbon tail length and degrees of saturation. Cell membranes have also been found to have approximately 30% of their interfacial area covered by a variety of proteins.1–4 Normally, the lipid composition varies significantly between the various organelles and subcellular compartments2,5–8 and between different cells. Additionally, the composition of the plasma membrane has been found to be dependent on the organism, cell stage, environmental factors, and tissue types.9–18Changes in lipid composition have also been linked to many diseases.19–23 For example, depression, anxiety, and drug addiction are strongly associated with changes in the lipid composition in the brain.24–26 Furthermore, various neurological diseases including Alzheimer's disease (AD), Parkinson's disease, and epilepsy have been linked to lipid imbalances that result from the deregulation of biochemical pathways associated with phosphoinositide (PIPs) lipids.27–29
The complex and evolving composition of cell membranes and the fact that they play significant roles in both healthy and diseased cells have led to an increased emphasis to understand how changes in the lipid composition affect the structural and dynamical properties of the membranes. Sophisticated experimental techniques, including single-particle tracking, fluorescence correlation spectroscopy, super-resolved imaging, scattering, solid-state NMR, and mass spectrometry have recently been used to provide insight into the lateral organisation of the various components within membranes, as well as the potential causes for this organisation.30–36 Despite advances in these various techniques, the full molecular-scale details of the interactions that result in the various structural and dynamical properties of interest are currently not accessible by experiment alone.
Computational modelling, in principle, is capable of providing this added level of detail and has become an essential tool in the investigations of lipid membranes.37,38 In recent investigations of brain lipid membranes, a range of different models have been used to represent the membranes and their interactions with small molecules or peptides. The models used range in lipid composition from pure 1-palmitoyl-2-oleoyl-sn-glycero-3-phosphocholine (POPC)39–42 to mixtures of up to five different lipid species (including cholesterol)43,44 to complex realistic lipid mixtures.45,46 In the current work, all-atom classical molecular dynamics (MD) simulations were used to investigate the effects of increasing lipid complexity on the bilayer structure, lipid dynamics, and dipole potential. We used two simple membranes consisting of pure POPC and POPC–CHOL in a 1:1 ratio. Meanwhile, we present the first heterogeneous brain cell models consisting of 27 lipid components in an effort to mimic the experimental compositions identified by Chan et al.47 (Fig. 1 and Table 1).
 | ||
| Fig. 1 (a) General compositions of the lipid types used in the BH800 and BAD800 brain cell models (see Table 1 for full detail of different membranes). (b) Side view of a complex brain membrane system. Lipids are coloured according to the pie charts. | ||
| Lipid type | Lipid name | sn1/sn2 | BH800 | BAD800 | BH | BAD | POPC | POPC–CHOL |
|---|---|---|---|---|---|---|---|---|
| CHOL | CHL1 | — | 392 | 408 | 98 | 102 | — | 100 |
| PC | SDPC | 18:0/22:6 | 12 | 8 | 3 | 2 | ||
| SAPC | 18:0/20:4 | 24 | 20 | 6 | 5 | — | — | |
| SLPC | 18:0/18:2 | — | 20 | — | 5 | |||
| POPC | 16:0/18:1 | 44 | 44 | 11 | 11 | 200 | 100 | |
| DPPC | 16:0/16:0 | 32 | 28 | 8 | 7 | — | — | |
| PLPC | 16:0/22:6 | 16 | — | 4 | — | |||
| PE | SDPE | 18:0/22:6 | 32 | 24 | 8 | 6 | ||
| SAPE | 18:0/20:4 | 44 | 36 | 11 | 9 | |||
| SLPE | 18:0/18:2 | 32 | 32 | 8 | 8 | — | — | |
| SOPE | 18:0/18:1 | 12 | 12 | 3 | 3 | |||
| DSPE | 18:0/18:0 | 4 | 4 | 1 | 1 | |||
| DAPE | 20:4/20:4 | — | 4 | — | 1 | |||
| PS | SDPS | 18:0/22:6 | 8 | 8 | 2 | 2 | — | — |
| SOPS | 18:0/18:1 | 12 | 12 | 3 | 3 | |||
| PI | SAPI25 | 18:0/20:4 | 16 | 12 | 4 | 3 | ||
| PNPI25 | 16:0/18:3 | 4 | 4 | 1 | 1 | — | — | |
| POPI25 | 16:0/18:1 | 4 | 4 | 1 | 1 | |||
| SM | ASM | 18:1/20:0 | 44 | 44 | 11 | 11 | — | — |
| NSM | 18:1/24:1 | 20 | 20 | 5 | 5 | |||
| CER | CER180 | 18:1/18:0 | 4 | 8 | 1 | 2 | ||
| CER241 | 18:1/24:1 | 4 | 4 | 1 | 1 | |||
| GALCER241 | 18:1/24:1 | 8 | 12 | 2 | 3 | |||
| GALCER240 | 18:1/24:0 | 4 | 4 | 1 | 1 | — | — | |
| GLCCER200 | 18:1/20:0 | 8 | 8 | 2 | 2 | |||
| GLCCER241 | 18:1/24:1 | 4 | 8 | 1 | 2 | |||
| SLFCER240 | 18:1/24:0 | 8 | 4 | 2 | 1 | |||
| SLFCER241 | 18:1/24:1 | 8 | 8 | 2 | 2 | |||
| Total number of lipids per leaflet | 800 | 800 | 200 | 200 | 200 | 200 | ||
| Total number of water molecules | 82373 |
81612 |
21995 |
21678 |
17979 |
14657 |
||
2 Methods
2.1 Model membranes
Two brain cell membranes representing the healthy (BH800) and Alzheimer's diseased (BAD800) state were modelled based on experimental lipidomics data of the prefrontal cortex cells47 (Fig. 1 and Table 1). BH800 and BAD800 each consists of 800 lipids per leaflet. We also conducted simulations of membranes with the same lipid composition as BH800 and BAD800 but with only 200 lipids per leaflet, BH and BAD, respectively, to investigate system size effects. Additionally, we simulated a pure 1-palmitoyl-2-oleoyl-sn-glycero-3-phosphocholine (POPC) membrane, and a membrane consisting of a 50:50 mixture of POPC and cholesterol to investigate the effects of lipid heterogeneity on the membrane properties. Each of these simpler membranes contain 200 lipids per leaflet. Table 1 reports their symmetric lipid distributions in the upper and lower leaflets. The chemical structures of the various lipids used are shown in Fig. 2. All systems were generated using the CHARMM-GUI Membrane Builder, using the CHARMM36 parameters for lipids and the CHARMM TIP3P model for water.48–50 As a result, each lipid molecule is randomly placed within the two leaflets of the bilayer. In doing so the structure of each lipid molecule is randomly chosen from a lipid structural library which contains 2000 conformations for each lipid type that have been produced from a combination of homogenous and heterogeneous lipid membrane simulations. Then each membrane was solvated with a water thickness of at least 22.5 Å (default setting) and neutralised to a salt concentration of 150 mM NaCl.
 | ||
| Fig. 2 General structure of the lipid types in Table 1. | ||
2.2 MD simulation protocol
GROMACS version 2018 was used to perform all MD simulations in this manuscript.51 Initial structures were energy-minimised using steepest descent to remove steric clashes between atoms. Then, a series of simulations were carried out using the NVT (constant number of particles, volume, and temperature) and then the NPT (constant number of particles, pressure, and temperature) ensembles for at least 0.45 ns in order to equilibrate the temperature and density of the systems. In doing so, the prescribed simulation protocol by CHARMM-GUI was followed.49,50 All equilibrated systems were simulated under NPT conditions, to a total length of 300 ns for smaller systems (POPC, POPC–CHOL, BH, and BAD), and to a total length of 200 ns for larger systems (BH800 and BAD800). In the production simulation, the temperature was maintained at 310 K by the Nosé–Hoover thermostat,52 with a time constant of 5 ps. Semi-isotropic pressure coupling was maintained at 1 bar by the Parrinello–Rahman barostat,53 with a time constant of 5 ps and standard compressibility of 4.5 × 10⁻⁵ bar−1. The Verlet cut-off scheme was employed. Electrostatic interactions were calculated using the Particle-Mesh Ewald algorithm. Both electrostatic and van der Waals interactions were cut off beyond 1.2 nm. All bonds involving hydrogen atoms were constrained using the LINCS algorithm.542.3 Data analysis details
Ensembled averages were analysed over the full length of the trajectories. Standard errors were calculated as standard deviations of the mean. The results of the two different sized healthy (BH800 and BH) and diseased (BAD800 and BAD) membranes are generally similar. Data for the smaller membranes (BH and BAD) are mainly included in the ESI,† unless stated otherwise.Area per lipid (APL) was calculated by Voronoi analysis in the membrane analysis tool, MEMBPLUGIN.55 The oxygen atom (name O3) was used as the key atom to represent CHOL, while a triad of glycerol carbons were used to represent non-CHOL lipids (names C2, C21, C31 for PC, PE, PS, and PI; names C1F, C2S, C3S for SM and CER) (Fig. S1a and b, ESI†). These key atoms were selected because they lie at a similar depth in the membrane. By projecting the coordinates of the key atoms onto the xy-plane, a series of Delaunay triangulations and Voronoi diagrams can be constructed56 to give the APL (Fig. S1c, ESI†).
Bilayer thickness was defined as the average phosphate-to-phosphate positions, and was calculated using MDAnalysis.57
Surface roughness (R) was calculated using MDAnalysis.57 The C2 and C2S atoms of all non-CHOL lipids were used as reference atoms. The method by Plesnar et al.58 was applied:

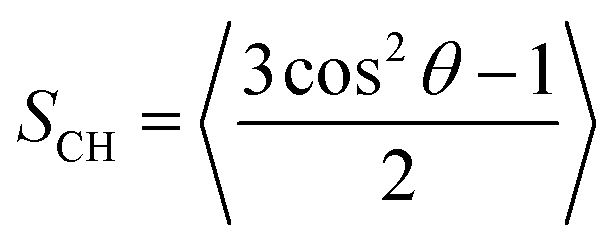
Order parameter (SCH) quantifies the time-averaged C–H bond angle, θ, with respect to the bilayer normal. Using MEMBPLUGIN,55SCH was calculated according to:
| BH800 | BAD800 | POPC–CHOL | POPC | ||
|---|---|---|---|---|---|
| APL (Å2) | CHOL | 30.0 ± 0.6 | 30.4 ± 0.5 | 30.1 ± 0.4 | — |
| PC | 56.4 ± 0.7 | 56.2 ± 0.6 | 54.8 ± 0.7 | 64.8 ± 0.8 | |
| PE | 55.5 ± 0.9 | 56.0 ± 0.9 | |||
| PS | 57.1 ± 1.4 | 55.2 ± 1.4 | |||
| PI | 56.6 ± 1.6 | 55.1 ± 1.4 | — | — | |
| SM | 49.8 ± 1.0 | 50.5 ± 1.0 | |||
| CER | 49.9 ± 1.0 | 50.0 ± 1.0 | |||
| Average | 42.3 ± 0.5 | 42.0 ± 0.4 | 42.5 ± 0.4 | 64.8 ± 0.8 | |
| Thickness (Å) | 47.3 ± 0.4 | 47.2 ± 0.3 | 45.8 ± 0.3 | 38.8 ± 0.4 | |
| Interdigitation | I ρ | 0.22 ± 0.02 | 0.23 ± 0.02 | 0.16 ± 0.02 | 0.30 ± 0.02 |
| w ρ (nm) | 4.88 ± 0.31 | 4.94 ± 0.32 | 3.21 ± 0.35 | 5.53 ± 0.47 | |
| I C (%) | 3.5 ± 0.1 | 3.6 ± 0.1 | 3.2 ± 0.3 | 5.4 ± 0.2 | |
| Roughness (Å) | Upper | 0.89 ± 0.11 | 0.88 ± 0.11 | 0.74 ± 0.08 | 1.10 ± 0.14 |
| Lower | 0.90 ± 0.10 | 0.88 ± 0.10 | 0.73 ± 0.08 | 1.07 ± 0.15 | |
| Tilt (°) | CHOL (C3 → C17) | 11.6 ± 0.5 | 11.4 ± 0.5 | 12.0 ± 0.7 | — |
| PC (P → N) | 65.9 ± 1.4 | 65.6 ± 1.6 | 66.7 ± 1.5 | 67.9 ± 0.9 | |
| PE (P → N) | 73.2 ± 1.6 | 72.9 ± 1.7 | |||
| PS (P → N) | 65.0 ± 4.2 | 64.2 ± 4.5 | |||
| PI (P → C14) | 50.9 ± 3.1 | 51.5 ± 3.5 | — | — | |
| SM (P → N) | 69.5 ± 2.2 | 70.6 ± 2.1 | |||
| CER (O1 → C4) | 41.8 ± 2.1 | 42.7 ± 2.1 | |||
Lipid interdigitation was calculated using MEMBPLUGIN, which measures the degree of acyl chain interdigitation using a correlation-based fraction that gives the mass overlap of two leaflets (Iρ) and its corresponding width of the overlapping regions (wρ). Iρ is measured so that 0 ≤ Iρ ≤ 1 indicates between zero to complete mass overlap. In addition, a coordination-based fraction (IC) evaluates the number of heavy atoms that are in contact with the opposing leaflet within the recommended default cutoff at 4 Å.55
Lipid tail snorkeling was determined by the terminal carbon z-positions of each hydrocarbon sn chain. The absolute values of z from both leaflets were taken, and binned to a histogram in order to obtain a normalised probability density, using MDAnalysis.57
Dipole potential (Ψ(z)) was computed using the gmx potential module from the GROMACS package.51 The simulation box was divided along the bilayer normal to obtain the charge density per slab. Double integration of the charge density, ρ(z), then yields the dipole potential, Ψ(z):59

Lateral diffusion was calculated using the gmx msd module from the GROMACS package.51 Diffusion coefficients (D) are calculated from the slopes by fitting a straight line (Dt + c) through the plots of the mean square displacements (MSDs),51 between 30–200 ns for POPC, POPC–CHOL, BH, and BAD, and between 20–150 ns for BH800 and BAD800. However, the lipids in each membrane experience subdiffusion since productions were simulated on a sub-microsecond timescale.60,61 Thus, the coefficients obtained in this work are merely estimated values of D, which we use because we are mainly interested in the qualitative comparisons of the lipid mobility between the various bilayer environments, as was similarly done in previous work.62
3 Results and discussion
3.1 Effects of lipid heterogeneity on the structural properties of lipid membranes
In the homogeneous POPC membrane, the bilayer thickness and APL equilibrate to 38.8 Å (Fig. S4, ESI†) and 64.8 Å2 (Fig. S2, ESI†), respectively (Table 2), in close agreement with previously reported values.58,63,64 The addition of 50% cholesterol in POPC–CHOL causes the bilayer to thicken to 45.8 Å (Fig. S4, ESI†), and the APL of PC lipids to reduce to 54.8 Å2 (Fig. S2, ESI†), characteristic of the well-established condensing effect of cholesterol.58,65,66 As the membrane gains lipid heterogeneity in BH800/BAD800, the thickness increases to 47 Å (Fig. S4, ESI†), but interestingly, the APL of PC lipids also increases slightly to 56 Å2 (Fig. S2, ESI†) in comparison to the POPC–CHOL membrane (Table 2). However, PE and PS lipids do not seem to feel the condensing effect of cholesterol to the same extent as PC, since both lipid types maintain APLs (Table 2 and Fig. S2, ESI†) that are similar to the areas reported for pure POPE (55.6–59.2 Å2)63,64,67 and pure POPS (55.8–57.5 Å2)63,68 membranes. Generally, in BH800/BAD800 the APLs of CHOL, PC, PE, PS, and PI lipid types (Table 2 and Fig. S2, ESI†) are in range to those reported for multicomponent yeast-like membranes:69 CHOL ∼30 Å2, and phospholipids ∼54–58 Å2 while the average APL of BH800/BAD800 (Table 2 and Fig. S3, ESI†) resembles the average APL of multicomponent mammalian-like membrane (POPC, POPE, POPS, CHOL, PSM):63 ∼42 Å2.Inversely correlated to the bilayer thickness is the lipid interdigitation, whereby the lipid chains in the upper and lower leaflets overlap at the bilayer centre. Such is the case where an increase in thickness from POPC to POPC–CHOL is accompanied by a decrease in the interdigitation parameters (Table 2 and Fig. S5, ESI†). Our findings are in line with the fact that cholesterol is proposed to reduce lipid interdigitation.70 However, complex membranes BH800/BAD800 at similar cholesterol levels to POPC–CHOL depart from this trend by showing a greater extent of interdigitation even as the bilayer thickens (Table 2 and Fig. S5, ESI†). This likely arises from the membrane containing a range of lipids that are diverse in chain lengths as well as degrees of saturation. Changes in the interdigitation have been suggested to have numerous implications, including on the interfacial tension of lipid membranes,71 the formation of membrane micro-domains,72 and the modulation of lipid droplets.73
The condensing effect of cholesterol is also closely related to its ordering effect on the lipid chains in a membrane,66 which is observable using the order parameter (SCH). Typically, lipids with a smaller APL will see an increase in the order of their hydrocarbon tails. At first, only the sn tails of POPC lipids in the various membranes were evaluated (Fig. S6, ESI†), and effectively displays a higher order in the POPC–CHOL, BH800, and BAD800 systems, relative to the pure POPC system. To approximate the order of the overall membrane, the order parameters were averaged across the various lipid types containing either a sn16:0, sn18:0, or sn18:1 tail (Fig. S7, ESI†), all of which show a similar trend to the order in Fig. S6 (ESI†). However, in BH800/BAD800, the ∼5 Å2 difference in APL between the SM and CER lipids and the PC, PE, PS, and PI lipids (Table 2) appears to not have been resulted in a greater amount of order in the SM and CER lipid tails (Fig. S7c compared to Fig. S7a and b, ESI†). Instead, in the membranes that contain 50% cholesterol, the value of SCH reaches a maximum (SCH ∼ 0.4) in the middle of the tails. Generally, the order profiles are consistent with existing literature that has reported studies of bilayers containing ∼50% cholesterol.74–77 The values of the order parameter observed in the lipids within BH800/BAD800 indicate that brain cell membranes realistically adopt a liquid-ordered state, since usually SCH < 0.3 in liquid-disordered membranes.
The tilt angle of cholesterol is another quantity that further explains how cholesterol imparts order on the packing environment. The orientation of CHOL shows the narrowest distribution in BH800/BAD800 (Fig. S10, ESI†), with the smallest average tilt angle of 11° (Table 2). This value is smaller compared to those previously measured in experiment78–80 and simulation69,81,82 (∼14–25°), all of which studied membranes with lower percentages of cholesterol within them, but the tilt is consistent with the angle observed in a simulation of a lipid bilayer with a 1:1 ratio of POPC and cholesterol.62 Otherwise, tilt angles that were measured in the headgroups of PC and PI lipids69,83 (Table 2 and Fig. S10, ESI†) are similar to those in simple model bilayers (where comparable). The orientation of the CER sugar headgroups seem to correspond to the tilt angles reported for membranes containing glycolipids (∼40°),84–86 even though they have a glycerol backbone (glyceroglycolipids) instead of the sphingosine backbone of the CER lipids used in this study (glycosphingolipids). The broad distributions in the tilt angles demonstrate a degree of freedom on the membrane surface that seems to be independent of the lipid packing. This is further evidenced by the similar hydration features of waters surrounding CHOL (Fig. S11, ESI†) and PC (Fig. S13, ESI†) lipids that are shared across the various membranes, which is unaffected by changes in the physical properties (Table 2). Previous simulation studies have found similar distances that define the first neighbor hydration shell around the oxygen atom in cholesterol,62 the nitrogen atom in the headgroup of the PC lipids,87,88 and the nitrogen atom in the headgroup of PE lipids.89 (Further details on the hydration of lipids are discussed in the ESI.†) Incidentally, the steadiness in the APL, thickness, and roughness parameters (Fig. S3, S4 and S8, ESI†) show an effectiveness of the CHARMM force field to quickly stabilise not only simple membranes, including POPC and POPC–CHOL, but more importantly complex membranes like BH800 and BAD800 that contain a cocktail of up to 27 lipid components. The average surface roughness of POPC (1.1 Å) is higher than POPC–CHOL (0.7 Å) (Table 2), whereby the relationship between the two is consistent with the findings by Plesnar et al.58
As lipid tails were expected to interdigitate vertically, we found instances in the simulation where some tail ends would snorkel towards the headgroup interface as in Fig. 3. In existing literature, Feix et al. has demonstrated flexibility in the tails of nitroxides to infer vertical fluctuations of terminal methyl groups in dimyristoylphosphatidylcholine (DMPC) bilayers.90 In addition, the snorkeling phenomena has been ascribed to the side chains of amino acids in transmembrane proteins to assist in protein-membrane interactions.91–93 Meanwhile, a membrane-only simulation has observed the sn24:1 tail to adopt a hooked conformation,94 but not quite bending to the extent of the U-shapes seen in Fig. 3. It is curious that lipid tails would snorkel deeply to an area of the membrane with high order (Fig. S7, ESI†). Thus, we evaluated the z-positions of the terminal carbons, and used a threshold of z > 10 Å to indicate any snorkeling events. Similar trends are expressed in the hydrocarbon chains across all systems (Table 3 and Table S2, ESI†). Mainly, the tails tend to equilibrate around the bilayer centre (z < 10 Å) (Table 3 and Table S2, ESI†). Otherwise, the probability of snorkeling increases with increasing degrees of unsaturation in the hydrocarbon chain, for instance, in the order of sn16:0/sn18:0/sn20:0 < sn18:1 < sn18:2 < sn20:4 < sn22:6 in the case of BH800 (Table 3). Additionally, for tails with the same degree of unsaturation, we have found that the likelihood of snorkeling increases with the length of the hydrocarbon tail, for instance, sn24:1 > sn18:1 (Table 3). Compared to POPC, it is also immediately obvious that the snorkeling events become much less probable in POPC–CHOL and BH800/BAD800 (Table 3 and Table S2, ESI†), which also seems to correlate to a decreasing number of water permeation events (Table S3, ESI†).
 | ||
| Fig. 3 Example snapshot of lipid tails snorkeling in the BH membrane all occurring in one time frame, in the chains sn18:2 (top), sn20:4 (lower left), and sn24:1 (lower right), with the carbon tails in grey. Hydrogen, water, and ion atoms were removed for clarity. | ||
| System | Chain type | Probability (%) | Num. chains per leaflet | |
|---|---|---|---|---|
| z < 10 | z > 10 | |||
| POPC | sn16:0 | 97.4 | 2.6 | 200 |
| sn18:1 | 93.9 | 6.1 | 200 | |
| POPC–CHOL | sn16:0 | 99.9 | 0.1 | 100 |
| sn18:1 | 98.8 | 1.2 | 100 | |
| BH800 | sn16:0 | 99.6 | 0.4 | 132 |
| sn18:0 | 99.7 | 0.3 | 200 | |
| sn20:0 | 99.9 | 0.1 | 52 | |
| sn18:1 CER | 99.1 | 0.9 | 112 | |
| sn18:1 | 98.0 | 2.0 | 72 | |
| sn24:1 | 97.4 | 2.6 | 44 | |
| sn18:2 | 97.6 | 2.4 | 48 | |
| sn20:4 | 96.2 | 3.8 | 84 | |
| sn22:6 | 95.9 | 4.1 | 52 | |
3.2 Changes in transmembrane dipole potential resulting from lipid heterogeneity
The distribution of electric charge in a bilayer is important because it affects the mechanisms of interaction and permeability of drugs with the lipid bilayer and/or the surrounding membrane proteins.95,96 Thus, the dipole potential profile of membranes is particularly crucial in the process of novel drug design. For example, the electrostatics of bacterial membranes is especially relevant for the design of novel antimicrobial drugs since the electrostatic interactions during drug binding is what provides the driving force for the insertion process of the drug into the membrane.97,98 Poisson's equation, as we have used here, is typically used to calculate the dipole potential from MD trajectories.63Fig. 4 shows the dipole potential across each of the membranes we have simulated here. Generally, the dipole profiles across all systems have matching qualitative features. Initially, the potential starts at the reference value in the aqueous phase at 0 V. Then, the potential increases sharply over the lipid headgroups to experience potential barriers at the membrane interface at z ∼ ±15 Å, before reaching a global maximum at the bilayer centre (Fig. 4). Between POPC and POPC–CHOL, the presence of cholesterol is demonstrated to raise the potential barriers most substantially at the centre by 0.3 V (Fig. 4). In the realistic membranes BH800/BAD800, lipid diversity in the headgroup as well as tail regions lower potential barriers at the interfaces to 0.42–0.45 V, and at the centre to 0.89–0.90 V (Fig. 4). Thus, the dipole potential is sensitive to the membrane composition and environment. And this reiterates that the selection of an appropriate model is important as it could affect the relevant mechanisms of interaction in such permeation studies. | ||
| Fig. 4 Dipole potential profiles relative to the bilayer centre, z = 0. (Error bars omitted from the figure for clarity.) Potential barriers and related error bars at the bilayer interfaces, z ∼ ±15 Å, and bilayer centre, z = 0 (table below) | ||
3.3 Changes in lipid diffusion with increased lipid heterogeneity
Lateral diffusion evaluates the mobility of lipids in the xy-plane of the membrane, and is therefore used as a gauge for the dynamics of lipid mixing. However, the systems here were only simulated on a sub-microsecond timescale, which means that lipids in the bilayer experience subdiffusion.60–62 Thus, the diffusion coefficients (D) obtained from the slopes of the mean square displacements (MSDs) (Fig. 5) are estimated values of D. As we are mostly interested in qualitatively comparing the lateral movement of the different lipid types within the various bilayer environments that we have studied, we will use the values of D determined from the slopes of the MSD plots in order to do so. This has been done previously for similar purposes.62 As cholesterol is well-known to retard diffusion rates,99 the diffusion constant of POPC in the pure membrane consequently reduces by half, from 9.1 × 10⁻⁸ cm2 s−1 (consistent with reported value100) to 4.1 × 10⁻⁸ cm2 s−1 in the POPC–CHOL membrane (Fig. 5a and d). The diffusion of PC lipids (and all other lipids) slow down further in BH800 and BAD800 as the lipid composition becomes more heterogeneous (Fig. 5c and f). We believe that the greater extent of interdigitation in the lipid packing of BH800 and BAD800 compared to POPC–CHOL is able to affect the fluidity of the respective membranes consisting of ∼50% cholesterol (Table 2). The only significant difference we observed between the large and small brain membranes was when comparing the lipid diffusion in BH800 and BH (Fig. 5c and e). In these two healthy systems, the lipids diffuse approximately twice as fast in the smaller BH membrane than in the larger BH800 membrane. Interestingly, no such difference was observed in the two diseased BAD800 and BAD membranes (Fig. 5f and e). One difference in the lipid compositions between the healthy BH and diseased BAD membranes is that BH contains lipids with generally more polyunsaturated fatty acid (PUFA) chains than BAD. And it has been previously shown that increasing degrees of chain unsaturation increases the rate of diffusion,101,102 which seems to describe the case between BH and BAD (Fig. 5b and e). Thus, we believe that the difference between BH800 and BH results from system size effects as well as short simulation time lengths. As the larger membranes of course have more of each lipid species, we will therefore achieve better sampling of the lipid diffusion of a given species in the larger membranes. This would be particularly true for the lipid species which are minor components of the membrane. | ||
| Fig. 5 Plots of the mean squared displacement as a function of time for each of the simulated membranes. Diffusion coefficients (D) as calculated from the slopes of these curves are used for qualitative comparisons between the various lipids. | ||
4 Conclusions
In this manuscript, we have conducted atomistic simulations to compare between bilayers containing simplistic (POPC and POPC–CHOL) and complex (BH800/BH and BAD800/BAD) lipid compositions. We present the first atomistic simulations of realistic human brain membrane models (under healthy and Alzheimer's diseased conditions) incorporating 27 lipid types that range in lipid headgroups, lipid tail lengths, degrees of saturation, as well as symmetry and asymmetry in the lipid tails. Our studies demonstrated effective differences in the properties between the simple and heterogeneous membranes, especially in the dipole potential and lateral diffusion. As homogeneous PC bilayers are commonly used to investigate the permeability of small molecules across the membrane,103–105 it is worth noting that the decreased potential barriers in simple models could alter the permeation mechanisms of small molecules compared to membranes of similar complexity as found in actual biological cells. But of course, other factors at play include the permeate size, membrane organisation phase, etc.106 Whilst POPC–CHOL seems a good approximation to the complex membranes, there is however a significant qualitative difference in the diffusion dynamics, which could also affect studies of permeability.107,108 The decreased diffusion of lipid molecules in the model BAD membrane is consistent with the findings that decreased lipid fluidity leads to accelerated amylodogenic processing of the Alzheimer's Precursor Protein.109In addition, we have demonstrated that the hydrocarbon tails of the lipid molecules have a tendency to snorkel towards the membrane's interface with the aqueous surroundings. We correlated the likelihood of a lipid tail to snorkel with increasing degrees of unsaturation in the hydrocarbon chains as well as longer tail length. Also, we observe that lipid snorkeling is more common in the more disordered membrane (POPC) where there is less steric hindrance to the motion of the lipid tails. We have also shown that there is a direct correlation between the amount of snorkelling observed in a lipid bilayer and the amount of water that is able to permeate into the membrane. This suggests that lipid snorkeling may play a role in the ability of small molecules to permeate across biological membranes. Continuing to understand the mechanisms that induce changes to the membrane mechanics and biophysics, and therefore cell functions will prove beneficial in developing new therapeutic strategies for the prevention and treatment of Alzheimer's disease and other neurological diseases.
Conflicts of interest
There are no conflicts to declare.Acknowledgements
We are grateful for the computational support received via the UKs HEC Materials Chemistry Consortium, which is funded by the EPSRC (EP/L000202/1, EP/R029431/1) that has allowed us to use the ARCHER UK National Supercomputing Service (http://www.archer.ac.uk) and the UK Materials and Molecular Modelling Hub (MMM Hub), which is partially funded by the EPSRC (EP/P020194/1), to carry out the MD simulations reported in this manuscript.Notes and references
- Y. Yang, M. Lee and G. D. Fairn, J. Biol. Chem., 2018, 293, 6230–6240 CrossRef CAS.
- G. Van Meer, D. R. Voelker and G. V. Feigenson, Nat. Rev. Mol. Cell Biol., 2008, 9, 112–124 CrossRef CAS.
- T. Harayama and H. Riezman, Nat. Rev. Mol. Cell Biol., 2018, 19, 281–296 CrossRef CAS.
- J. L. Sampaio, M. J. Gerl, C. Klose, C. S. Ejsing, H. Beug, K. Simons and A. Shevchenko, Proc. Natl. Acad. Sci. U. S. A., 2011, 108, 1903–1907 CrossRef CAS.
- J. S. O'Brien and E. L. Sampson, J. Lipid Res., 1965, 6, 537–544 Search PubMed.
- Y. Kishimoto, B. W. Agranoff, N. S. Radin and R. M. Burton, J. Lipid Res., 1969, 16, 397–404 CAS.
- C. M. Klose, A. Surma and K. Simons, Curr. Opin. Cell Biol., 2013, 25, 406–413 CrossRef CAS.
- C. M. Klose, A. Surma and K. Simons, Trends Cell Biol., 2015, 25, 427–436 CrossRef.
- A. Yamashita, Y. Hayashi, Y. Nemoto-Sasaki, M. Ito, S. Oka, T. Tanikawa, K. Waku and T. Sugiura, Prog. Lipid Res., 2014, 53, 18–81 CrossRef CAS.
- S. Grosch, S. Schiffmann and G. Geisslinger, Prog. Lipid Res., 2012, 51, 50–62 CrossRef.
- T. Harayama, M. Eto, Y. Kita, E. Otsubo, D. Hishikawa, S. Ishii, K. Sakimura, M. Mishina and T. Shimizu, Cell Metab., 2014, 20, 295–305 CrossRef CAS.
- W. C. Breckenridge, G. Gombos and I. G. Morgan, Biochim. Biophys. Acta, 1972, 266, 695–707 CrossRef CAS.
- W. W. Christie, J. Lipid Res., 1985, 26, 507–512 CAS.
- G. E. Attila-Gokcumen, E. Muro, J. Relat-Goberna, S. Sasse, A. Bedigian, M. L. Coughlin, S. Garcia-Manyes and U. S. Eggert, Cell, 2014, 156, 428–439 CrossRef.
- K. R. Levental, J. H. Lorent, X. Lin, A. D. Skinkle, M. A. Surma, E. A. Stockenbojer, A. A. Gorfe and I. Levental, Biophys. J., 2016, 110, 1800–1810 CrossRef CAS.
- K. Tulodziecka, B. B. Diaz-Rohrer, M. M. Farley, R. B. Chan, G. Di Paolo, K. R. Levental, M. N. Waxham and I. Levental, Mol. Biol. Cell, 2016, 27, 3480–3489 CrossRef CAS.
- M. Aureli, S. Grassi, S. Prioni, S. Sonnino and A. Prinetti, Biochim. Biophys. Acta, 2015, 1851, 1006–1016 CrossRef CAS.
- M. K. Dymond, C. V. Hague, A. D. Postle and G. S. Attard, J. R. Soc., Interface, 2002, 10, 20120854 CrossRef.
- G. van Meer, EMBO J., 2005, 24, 3159–3165 CrossRef CAS.
- C. Fernandez, M. Sandin, J. L. Sampaio, P. Almgren, K. Narkiewicz, M. Hoffmann, T. Hedner, B. Wahlstrand, K. Simons, A. Shevchenko, P. James and O. Melander, PLoS One, 2013, 8, e71846 CrossRef CAS.
- J. C. M. Holthuis and A. K. Menon, Nature, 2014, 510, 48–57 CrossRef CAS.
- J. A. Kuivenhoven and R. A. Hegele, Biochim. Biophys. Acta, 2014, 1842, 1993–2009 CrossRef CAS.
- F. Lamari, F. Mochel, F. Sedel and J. M. Saudubray, J. Inherited Metab. Dis., 2013, 36, 411–425 CrossRef CAS.
- C. P. Müller, M. Reichel, C. Mühle, C. Rhein, E. Gulbins and J. Kornhuber, Biochim. Biophys. Acta, 2015, 1851, 1052–1065 CrossRef.
- A. Dinoff, N. Herrmann and K. L. Kanctôt, J. Affective Disord., 2017, 213, 35–43 CrossRef CAS.
- M. Schneider, B. Levant, M. Reichel, E. Gulbins, J. Kornhuber and C. P. Müller, Neurosci. Biobehav. Rev., 2017, 76B, 336–362 CrossRef.
- M. G. Waugh, Biochim. Biophys. Acta, 2015, 1851, 1066–1082 CrossRef CAS.
- P. Cui, X. Ma, H. Li, W. Lang and J. Hao, Front. Neurosci., 2018, 12, 605 CrossRef.
- A. D. Frej, G. P. Otto and R. S. B. Williams, Eur. J. Cell Biol., 2017, 96, 154–163 CrossRef CAS.
- E. Lyman, C. L. Hsieh and C. Eggeling, Biophys. J., 2018, 115, 595–604 CrossRef CAS.
- J. D. Nickels, J. C. Smith and X. Cheng, Chem. Phys. Lipids, 2015, 192, 87–99 CrossRef CAS.
- M. T. Marty, K. K. Hoi and C. V. Robinson, Acc. Chem. Res., 2016, 49, 2459–2467 CrossRef CAS.
- M. T. Marty, K. K. Hoi and C. V. Robinson, Biochim. Biophys. Acta, Biomembr., 2014, 1838, 3171–3190 CrossRef.
- D. M. Owen and K. Gaus, Front. Plant Sci., 2013, 4, 503 Search PubMed.
- J. Griffié, G. Burn and D. M. Owen, Curr. Top. Membr., 2015, 75, 125–165 Search PubMed.
- A. Suhaj, A. Le Marois, D. J. Williamson, K. Suhling, C. D. Lorenz and D. M. Owen, Phys. Chem. Chem. Phys., 2018, 20, 16060–16066 RSC.
- S. J. Marrink, V. Corradi, P. C. T. Souza, H. I. Ingólfsson, D. P. Tieleman and M. S. P. Sansom, Chem. Rev., 2019, 119, 6184–6226 CrossRef CAS.
- G. Enkavi, M. Javanainen, W. Kulig, T. Róg and I. Vattulainen, Chem. Rev., 2019, 119, 5607–5774 CrossRef CAS.
- T. S. Carpenter, D. A. Kirshner, E. Y. Lau, S. E. Wong, J. P. Nilmeier and F. C. Lightsteon, Biophys. J., 2014, 107, 630–641 CrossRef CAS.
- A. Shamloo, M. Z. Pedram, H. Heidari and A. Alasty, J. Magn. Magn. Mater., 2016, 410, 187–197 CrossRef CAS.
- N. Q. Thai, P. E. Theodorakis and M. S. Li, J. Chem. Inf. Model., 2020, 60, 3057–3067 CrossRef CAS.
- A. Goliaei, U. Adhikari and M. L. Berkowitz, ACS Chem. Neurosci., 2015, 6, 1296–1301 CrossRef CAS.
- N. Ntarakas, I. Ermilova and A. P. Lyubartsev, Eur. Biophys. J., 2019, 48, 813–824 CrossRef CAS.
- N. Rajagopal, F. J. Irudayanathan and S. Nangia, J. Phys. Chem. B, 2019, 123, 983–993 CrossRef CAS.
- H. I. Ingólfsson, T. S. Carpenter, H. Bhatia, P.-T. Bremer, S. J. Marrink and F. C. Lightstone, Biophys. J., 2017, 113, 2271–2280 CrossRef.
- Y. Wang, E. Gallagher, C. Jorgensen, E. P. Troendle, D. Hu, P. C. Searson and M. B. Ulmschneider, Sci. Rep., 2019, 9, 6117 CrossRef.
- R. B. Chan, T. G. Oliveira, E. P. Cortes, L. S. Honig, K. E. Duff, S. A. Small, M. R. Wenk, G. Shui and G. Di Paolo, J. Biol. Chem., 2012, 287, 2678–2688 CrossRef CAS.
- E. L. Wu, X. Cheng, S. Jo, H. Rui, K. C. Song, E. M. Dávila-Contreras, Y. Qi, J. Lee, V. Monje-Galvan, R. M. Venable, J. B. Klauda and W. Im, J. Comput. Chem., 2014, 35, 1997–2004 CrossRef CAS.
- J. Lee, X. Cheng, J. M. Swails, M. S. Yeom, P. K. Eastman, J. A. Lemkul, S. Wei, J. Buckner, J. C. Jeong, Y. Qi, S. Jo, V. S. Pande, D. A. Case, C. L. Brooks, A. D. MacKerell, J. B. Klauda and W. Im, J. Chem. Theory Comput., 2016, 12, 405–413 CrossRef CAS.
- J. Lee, D. S. Patel, J. Støahle, S.-J. Park, N. R. Kern, S. Kim, J. Lee, X. Cheng, M. A. Valvano, O. Holst, Y. Knirel, Y. Qi, S. Jo, J. B. Klauda, G. Widmalm and W. Im, J. Chem. Theory Comput., 2019, 15, 775–786 CrossRef CAS.
- D. Van der Spoel and B. Hess, Wiley Interdiscip. Rev.: Comput. Mol. Sci., 2011, 1, 710–715 CAS.
- D. J. Evans and B. L. Holian, J. Chem. Phys., 1985, 83, 4069–4074 CrossRef CAS.
- M. Parrinello and A. Rahman, J. Appl. Phys., 1981, 52, 7182–7190 CrossRef CAS.
- B. Hess, H. Bekker, H. J. Berendsen and J. G. Fraaije, J. Comput. Chem., 1997, 18, 1463–1472 CrossRef CAS.
- R. Guixà-González, I. Rodriguez-Espigares, J. M. Ramírez-Anguita, P. Carrió-Gaspar, H. Martinez-Seara, T. Giorgino and J. Selent, Bioinformatics, 2014, 30, 1478–1480 CrossRef.
- G. Lukat, J. Krüger and B. Sommer, J. Chem. Inf. Model., 2013, 53, 2908–2925 CrossRef CAS.
- N. Michaud-Agrawal, E. J. Denning, T. B. Woolf and B. Oliver, J. Comput. Chem., 2011, 32, 2319–2327 CrossRef CAS.
- E. Plesnar, W. K. Subczynski and M. Pasenkiewicz-Gierula, Biochim. Biophys. Acta, Biomembr., 2012, 1818, 520–529 CrossRef CAS.
- W. Ding, M. Palaiokostas, W. Wang and M. Orsi, J. Phys. Chem. B, 2015, 119, 15263–15274 CrossRef CAS.
- M. Javanainen, H. Hammaren, L. Monticelli, J.-H. Jeon, M. S. Miettinen, H. Martinez-Seara, R. Metzler and I. Vattulainen, Faraday Discuss., 2013, 161, 397–417 RSC.
- G. R. Kneller, K. Baczynski and M. Pasenkiewicz-Gierula, J. Chem. Phys., 2011, 135, 141105 CrossRef.
- E. Plesnar, W. K. Subczynski and M. Pasenkiewicz-Gierula, J. Phys. Chem. B, 2013, 117, 8758–8769 CrossRef CAS.
- G. Shahane, W. Ding, M. Palaiokostas and M. Orsi, J. Mol. Model., 2019, 25, 76 CrossRef.
- R. M. Venable, F. L. H. Brown and R. W. Pastor, Chem. Phys. Lipids, 2015, 192, 60–74 CrossRef CAS.
- W.-C. Hung, M.-T. Lee, F.-Y. Chen and H. W. Huang, Biophys. J., 2007, 92, 3960–3967 CrossRef CAS.
- T. Róg, M. Pasenkiewicz-Gierula, I. Vattulainen and M. Karttunen, Biochim. Biophys. Acta, 2009, 1788, 97–121 CrossRef.
- R. P. Rand, N. Fuller, V. A. Parsegian and D. C. Rau, Biochemistry, 1988, 27, 7711–7722 CrossRef CAS.
- P. Mukhopadhyay, L. Monticelli and D. P. Tieleman, Biophys. J., 2004, 86, 1601–1609 CrossRef CAS.
- E. L. Wu, Y. Qi, K. C. Song, J. B. Klauda and W. Im, J. Phys. Chem. B, 2014, 118, 4315–4325 CrossRef CAS.
- T. Mavromoustakos, P. Chatzigeorgiou, C. Koukoulitsa and S. Durdagi, Int. J. Quantum Chem., 2011, 111, 1172–1183 CrossRef CAS.
- J. M. Seddon, Biochim. Biophys. Acta, 1990, 1031, 1–69 CrossRef CAS.
- H. S. Muddana, R. R. Gullapalli, E. Manias and P. J. Butler, Phys. Chem. Chem. Phys., 2011, 13, 1368–1378 RSC.
- A. Bacle, R. Gautier, C. L. Jackson, P. F. Fuchs and S. Vanni, Biophys. J., 2017, 112, 1417–1430 CrossRef CAS.
- C. Hofsäβ, E. Lindahl and O. Edholm, Biophys. J., 2003, 84, 2192–2206 CrossRef.
- E. Wang and J. B. Klauda, J. Phys. Chem. B, 2017, 121, 4833–4844 CrossRef CAS.
- I. Ermilova and A. P. Lyubartsev, Soft Matter, 2019, 15, 78–93 RSC.
- F. Leeb and L. Maibaum, Biophys. J., 2018, 115, 2179–2188 CrossRef CAS.
- W. Guo, V. Kurze, T. Huber, N. H. Afdhal, K. Beyer and J. A. Hamilton, Biophys. J., 2002, 83, 1465–1478 CrossRef CAS.
- S. R. Shaikh, V. Cherezov, M. Caffrey, S. P. Soni, D. LoCascio, W. Stillwell and S. R. Wassall, J. Am. Chem. Soc., 2006, 128, 5375–5383 CrossRef CAS.
- P. Wydro, S. Knapczyk and M. Lapczyńska, Langmuir, 2011, 27, 5433–5444 CrossRef CAS.
- J. Aittoniemi, T. Róg, P. Niemelä, M. Pasenkiewicz-Gierula, M. Karttunen and I. Vattulainen, J. Phys. Chem. B, 2006, 110, 25562–25564 CrossRef CAS.
- V. Monje-Galvan and J. B. Klauda, Mol. Simul., 2017, 43, 1179–1188 CrossRef CAS.
- D. Lupyan, M. Mezei, D. E. Logothetis and R. Osman, Biophys. J., 2010, 98, 240–247 CrossRef CAS.
- T. Róg, I. Vattulainen, A. Bunker and M. Karttunen, J. Phys. Chem. B, 2007, 111, 10146–10154 CrossRef.
- J. Kapla, B. Stevensson, M. Dahlberg and A. Maliniak, J. Phys. Chem. B, 2012, 116, 244–252 CrossRef CAS.
- K. Baczynski, M. Markiewicz and M. Pasenkiewicz-Gierula, FEBS Lett., 2018, 592, 1507–1515 CrossRef CAS.
- F. Foglia, M. J. Lawrence, C. D. Lorenz and S. E. McLain, J. Chem. Phys., 2010, 133, 145103 CrossRef.
- R. J. Gillams, C. D. Lorenz and S. E. McLain, J. Chem. Phys., 2016, 144, 225101 CrossRef.
- N. H. Rhys, I. B. Duffy, C. L. Snowden, C. D. Lorenz and S. E. McLain, J. Chem. Phys., 2019, 150, 115104 CrossRef.
- J. B. Feix, C. A. Popp, S. D. Venkataramu, A. H. Beth, J. H. Park and J. S. Hyde, Biochemistry, 1984, 23, 2293–2299 CrossRef CAS.
- E. Strandberg, S. Morein, D. T. Rijkers, R. M. Liskamp, P. C. Van der Wel and J. Antoinette Killian, Biochemistry, 2002, 41, 7190–7198 CrossRef CAS.
- E. Strandberg and J. A. Killian, FEBS Lett., 2003, 544, 69–73 CrossRef CAS.
- M. Jafari, F. Mehrnejad and F. Doustdar, PLoS One, 2017, 12, e0187216 CrossRef.
- M. Adams, E. Wang, X. Zhuang and J. B. Klauda, Biochim. Biophys. Acta, Biomembr., 2018, 1860, 2134–2144 CrossRef CAS.
- A. Wiese, K. Brandenburg, B. Lindner, A. B. Schromm, S. F. Carroll, E. T. Rietschel and U. Seydel, Biochemistry, 1997, 36, 10301–10310 CrossRef CAS.
- T. Gutsmann, N. Haberer, S. F. Carroll, U. Seydel and A. Wiese, Biol. Chem., 2001, 382, 425–434 CAS.
- M. M. Domingues, R. G. Inácio, J. M. Raimundo, M. Martins, M. A. R. B. Castanho and N. C. Santos, Biopolymers, 2012, 98, 338–344 CrossRef CAS.
- H. K. Ravi, M. Stach, T. A. Soares, T. Darbre, J.-L. Reymond and M. Cascella, Chem. Commun., 2013, 49, 8821 RSC.
- A. Filippov, G. Orädd and G. Lindblom, Biophys. J., 2003, 84, 3079–3086 CrossRef CAS.
- L. Janosi and A. A. Gorfe, J. Chem. Theory Comput., 2010, 6, 3267–3273 CrossRef CAS.
- A. L. Rabinovich, V. V. Kornilov, N. K. Balabaev, F. A. M. Leermakers and A. V. Filippov, Biochem. (Mosc.) Suppl. Ser. A Membr. Cell Biol., 2007, 1, 343–357 Search PubMed.
- M. Javanainen and H. Martinez-Seara, Phys. Chem. Chem. Phys., 2019, 21, 11660 RSC.
- D. Bemporad, C. Luttmann and J. Essex, Biochim. Biophys. Acta, Biomembr., 2005, 1718, 1–21 CrossRef CAS.
- T. S. Carpenter, D. A. Kirshner, E. Y. Lau, S. E. Wong, J. P. Nilmeier and F. C. Lightstone, Biophys. J., 2014, 107, 630–641 CrossRef CAS.
- C. T. Lee, J. Comer, C. Herndon, N. Leung, A. Pavlova, R. V. Swift, C. Tung, C. N. Rowley, R. E. Amaro, C. Chipot, Y. Wang and J. C. Gumbart, J. Chem. Inf. Model., 2016, 56, 721–733 CrossRef CAS.
- M. Palaiokostas, W. Ding, G. Shahane and M. Orsi, Soft Matter, 2018, 14, 8496–8508 RSC.
- K. V. Shaitan, M. Y. Antonov, Y. V. Tourleigh, O. V. Levtsova, K. B. Tereshkina, I. N. Nikolaev and M. P. Kirpichnikov, Biochem. (Mosc.) Suppl. Ser. A Membr. Cell Biol., 2008, 2, 73–81 Search PubMed.
- S. Mitragotri, J. Controlled Release, 2003, 86, 69–92 CrossRef CAS.
- I. Peters, U. Igbavboa, T. Schutt, S. Haidari, U. Hartig, X. Rosello, S. Bottner, E. Copanaki, T. Deller, D. Kogel, W. G. Wood, W. E. Muller and G. P. Eckert, Biochim. Biophys. Acta, 2009, 1788, 964–972 CrossRef CAS.
Footnote |
| † Electronic supplementary information (ESI) available: Plots for membrane structural properties (APL, bilayer thickness, and roughness), lipid structural properties (order parameters and tilt angles), tail snorkeling, and RDFs of hydration. See DOI: 10.1039/d0sm01766c |
| This journal is © The Royal Society of Chemistry 2021 |