Clogged water bridges for fog harvesting†
Jihye
Park‡
a,
Changje
Lee‡
 b,
Sangyoup
Lee
*b,
Hyesung
Cho
a,
Myoung-Woon
Moon
 a and
Seong Jin
Kim
 *a
*a
aMaterials and Life Science Research Division, Korea Institute of Science and Technology, Seoul, 02792, Republic of Korea. E-mail: kyk756@kist.re.kr
bBiomedical Research Institute, Korea Institute of Science and Technology, Seoul, 02792, Republic of Korea. E-mail: sangyoup@kist.re.kr
First published on 30th October 2020
Abstract
Capillary water bridges clogged in the holes of mesh-type fog harvesters have previously been considered only as a drawback because they decrease fog-harvesting yield by hindering airflow in front of the clogged mesh in the usual wind conditions. In this study, we show that the role of a clogged water bridge may not be entirely negative and can contribute to increased fog harvesting by increasing the effective shade coefficient in a special condition with high fog inertia. As the fog speed close to the mesh or the plate increases, clogged mesh as well as the impermeable solid plate are found to produce high fog-harvesting efficiency owing to the high inertia of fog particles that impact the blocked wall. For fast fog speeds (∼4 m s−1) near the mesh, our results show that the fog-harvesting efficiency is proportional to the effective shade coefficient because fog flow circumventing the mesh is limited owing to high fog inertia. We analyzed the clogging effect on fog-harvesting performance by distinguishing between self-clogging and non-self-clogging patterns based on the water bridge stability clogged in mesh holes.
1 Introduction
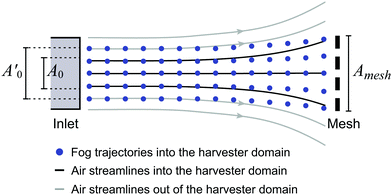
Filter clogging is a major issue that critically affects the performance of most filters, such as fog-collection filters,1–3 membrane filters,4 oil–water separation filters,5 and particulate matter filters.6 In general, clogging has been considered a drawback that decreases filter performance by blocking flow circulation in the filter system, as well as increasing the pressure drop across the filter.2,3 This problem is exacerbated when the filter pores are strongly stuck so that the filter cannot recover its initial performance. Numerous engineering works have addressed this issue to reduce the occurrence of filter clogging.1,7 One of the main causes for the filter clogging is capillary clogging of the liquid bridge, which forms to minimize the interfacial energies of liquid, solid, and air interfaces in the filter hole.1–3 Capillary clogging is especially important in harvesting fog from the air for industrial3,8–10 and environmental purposes.2,9,11 An important industrial example is the requirement to harvest fog that forms during the evaporation of cooling water that circulates inside most power plants and factories.3,9,10,12 This fog can be observed above the factory chimney where it outflows, which is called white smoke or white plume. The emission of white smoke causes vast losses of industrial water and is therefore required to be recollected and recycled to supplement the cooling water.3,9,13 White smoke also causes environmental problems by obstructing visibility on streets and roads as well as icing roadways, sidewalks, and electrical power lines that may pose serious risks.12,13 Previous studies have reported that white smoke can react to form toxic components by mixing with gaseous emissions from other sources.12 Fog-harvesting meets another environmental need by obtaining drinking water, especially in arid regions.14 Some regions relatively close to the ocean receive foggy wind every morning, which generally emerges from the ocean in several regions, including Chile, Peru, and South Africa.14,15 Fog-harvesting in these areas provides alternative water resources and is capable of producing around 4.6 L per m2 per day with maximum daily yields approaching 4000 L.16 In this regard, there is a requirement to improve the fog-harvester design, materials, and models to enhance fog-harvesting efficiency as well as expand the regions where fog-harvesting can be applied.17Mesh geometry is traditionally used in fog harvesting rather than an impermeable solid plate to optimize efficiency.2,11,18 When there is no clogging, fog-harvesting efficiency has been theoretically predicted to depend on the shade coefficient, SC, which is a part of the mesh surface capable of capturing fog particles by occluding an incident fog flow.2,11,19 Theory predicts that at low SC, fog-harvesting efficiency increases with SC as the solid area to harvest the fog increases. However, when SC increases further to between a critical value of 0.5–0.6, the fog-harvesting efficiency becomes inversely proportional to SC by increasing the amount of fog flow circumventing the mesh. Fig. 1 schematically shows air streamlines circumventing the mesh domain as light gray curves, whereas black curves with area A0 at the inlet indicate air streamlines that can flow into the mesh domain. Accordingly, for an impermeable solid plate, the fog-harvesting efficiency is supposed to be low from a significant reduction in A0.11 Open mesh, rather than the impermeable plate, has therefore been used to harvest fog. Clogging is presently considered only to deteriorate fog-harvesting performance by rendering the mesh fully impermeable. However, surprisingly, these clogging effects have not yet been tested over wide and systematic variations of mesh geometry. The detailed role of clogged water bridges in fog-harvesting therefore remains unclear.
In the present work, we systematically investigated the clogging effect on fog-harvesting performance with varying the hole size of the mesh and SC. When the fog particles can collide with the plate with high inertia at a fast fog speed ≫1 m s−1, the clogged mesh as well as the impermeable solid plate are observed to harvest fair amounts of fog in comparison to clog-free mesh, owing to the enlarged effective SC in the capture of more fog particles that deviate more straightly from each air streamline as presented by the blue dots in Fig. 1. We discuss the clogging effect based on the stability of the clogged water bridge, which is mainly controlled by the hole size, d, which provides another view for the design of fog-harvesting mesh to consider each feature of different clogging types.
2 Methods
2.1 Design of 3D-printed mesh
Fog-harvesting mesh was fabricated using a 3D printer (CUBICON Single plus/CUBICON Inc.) to systematically investigate the effects of mesh geometry and hole clogging on fog-harvesting performance. For mesh geometry, a regular hole-pattern with square-shaped holes was used by varying SC and d. For the square hole-patterned mesh, SC is defined as | (1) |
 , where lc is the capillary length, which is 2.7 mm for water in our experimental conditions. Mesh clogging can therefore be controlled by designing d in comparison to lc. In the present experiment, three different hole sizes of 2, 5, and 7 mm were tested. For each hole size, SC was varied between 0.2 and 0.9. The mesh of these holes was printed at a size of 35 × 35 mm with a thickness of 1 mm. The case with SC = 1.0, which represents an impermeable solid plate without a hole, was also tested as a reference. The printing material was a moderately hydrophobic polylactic acid (PLA) with a static contact angle of 80 ± 5° by the sessile drop method. Unlike dew-harvesting that requires a highly hydrophilic surface to condense humid air, the water removal property of a hydrophobic surface is beneficial in fog-harvesting.20 In the present work, the surface wettability is maintained constant to focus on the effects of different mesh geometry.
2.2 Fog-harvesting experiments
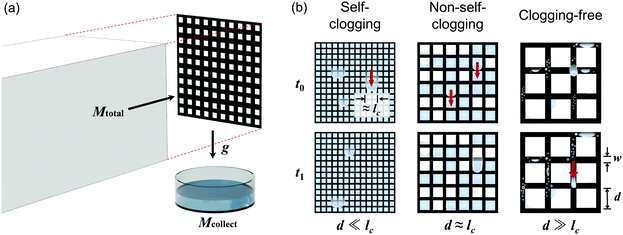
Fog-harvesting experiments were performed by shooting a fog jet from an ultrasonic humidifier by adjusting the flow speed between 3.0 and 4.4 m s−1, which is in a similar range as values reported for the foggy wind speed typically found in white smoke inside the chimney of cooling towers.3,10 The fog inlet was designed to have the same dimension as the fog-harvesting mesh, as schematically illustrated in Fig. 2(a). The distance between the fog inlet and the mesh was kept to be 50 mm with their faces parallel to each other. The amounts of water harvested by the mesh (Mcollect) and water supplied from the humidifier (Mtotal) were measured after one hour. The fog-harvesting efficiency can then be measured by | (2) |
3 Results and discussion
3.1 Single-hole experiments
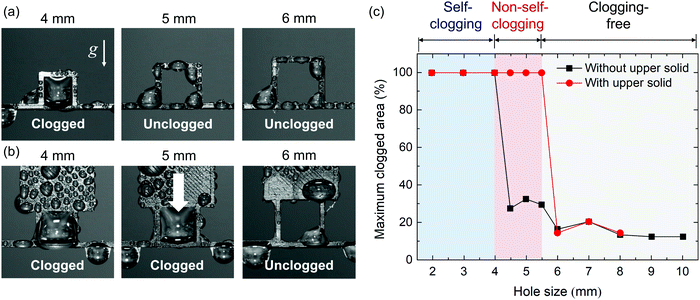
Prior to fog-harvesting experiments by mesh, an experiment of shooting the fog jet to the single hole was performed to classify the clogging behavior by hole size, as shown in Fig. 3. In this experiment, the hole size varied from 2 to 10 mm. When the fog was supplied to a mesh with a hole size smaller than the capillary length (d < lc), a water bridge formed by coalescing water menisci on the hole edges. Fig. 3(a) shows that the 2 mm hole is clogged while the 5 mm hole cannot be fully clogged even after one hour of fog-jet shooting. This is because the meniscus in the bigger hole cannot grow to a size that can coalesce with another meniscus. In Fig. 3(c), the maximum clogged area (%) after one hour is plotted as a function of hole size by the black curve. The results show that only the holes with d ≤ 4 mm can be fully clogged by closing menisci inside the single hole.In Fig. 3(b), another single-hole experiment is performed with different geometry. Here, an extra solid part is added on top of the hole so that the water can be harvested on this solid surface and then flow down to the hole. When water flows down over the hole, it helps clog the hole by connecting adjacent menisci to be fully clogged on the hole. As a result, the 5 mm hole can be fully clogged by the water from above, as shown in Fig. 3(b), which did not clogged by itself without an upper solid, as in Fig. 3(a). These results are plotted as the red curves in Fig. 3(c), which shows three different regimes in comparison with the black curve. The first regime in which d ≤ 4 mm is characterized by the capability of self-clogging. A critical value of 4 mm is similar to the capillary length (lc ≈ 2.7 mm) that is the parameter that describes the stability of the capillary water bridge, as previously discussed.21 The second regime in which 4 mm < d < 5.5 mm is called non-self-clogging, where a water bridge can form only by catching the water falling down from above. The last regime where d ≥ 5.5 mm corresponds to a clogging-free hole that cannot be clogged by any means because the hole size is too large to stabilize the capillary water bridge.21
3.2 Clogging behavior of the 3D-printed mesh
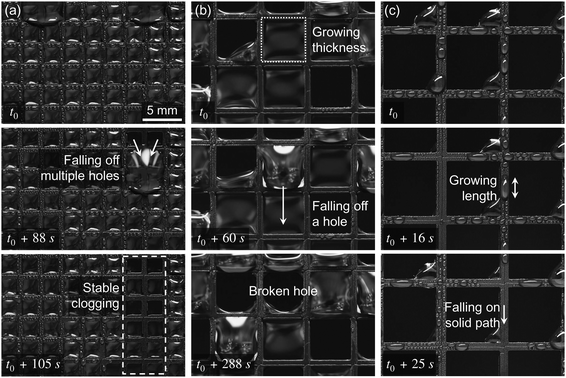
Based on the understanding how a single hole is clogged by fog jet from the previous section, an experiment was performed to measure the fog-harvesting efficiency using the mesh geometry. Fig. 4(a) shows that all of the 2 mm holes in a mesh (smaller than the capillary length) are fully clogged by the water bridges, as found in the single-hole experiment. These water bridges stably survive to continue clogging the holes even when the water drains down out of the hole, as schematically shown in Fig. 2 and experimentally in Fig. 4(a). However, when the hole size is in the non-self-clogging regime with d = 5 mm and low SC ≤ 0.5, the mesh is partly blocked, as shown in Fig. 4(b). For high SC ≥ 0.6, a clogged hole is not observed on the mesh with d = 5 mm owing to the wide width (w) of the solid strip between holes. This wide solid path makes the water captured on the solid surface flow down through the solid path rather than fall down to the hole. As mentioned, a 5 mm hole cannot be clogged by itself without an external water supply from above. Even though the mesh with 5 mm holes is clogged by the external water for low SC ≤ 0.5, this clogged water bridge can break down when water falls out of the hole owing to low water bridge stability, as shown at the last image (t0 + 288 s) in Fig. 4(b). A 5 mm hole is also capable of collecting and storing sufficient fog water to reach a weight to fall by its own gravity from a hole, as shown at t0 + 60 s in Fig. 4(b). This is in contrast with the mesh with 2 mm holes where the water should coalesce with other water from adjacent holes to obtain sufficient weight to fall down, as shown at t0 + 88 s in Fig. 4(a). When the hole size is substantially larger than the capillary length (d ≫ lc), the hole can no longer be fully clogged, as shown in Fig. 4(c). Accordingly, the fog is captured on the solid surface unlike the clogging cases in which the fog is captured on the solid surface as well as the clogged water surface. The water bulk then flows down following the solid path when it reaches a critical weight.3.3 Clogging-free mesh and impermeable plate
The effects of mesh geometry on fog-harvesting performance are studied by systematically varying the hole size (d) and shade coefficient (SC) of the square hole-patterned mesh. Fig. 5 shows the fog-harvesting efficiency, η, as a function of SC for d = 2, 5, and 7 mm, which are tested at flow speeds of 3.0 m s−1 (Fig. 5(a)) and 4.4 m s−1 (Fig. 5(b)). For the clogging-free mesh (open triangles), the η is found to have the maximum around SC = 0.5 when the fog blows at the relatively slow speed, as in Fig. 5(a). As briefly mentioned, this dependency with a maximum at 0.5 ≤ SC ≤ 0.6 was previously predicted by aerodynamic theory.11 In general, fog-harvesting efficiency has been analyzed by dividing η into sub-efficiencies as η = ηaηcηd,3,11 where ηa is called the aerodynamic efficiency, ηc is the capturing efficiency, and ηd is the drain efficiency. As illustrated in Fig. 1, ηa describes the macroscopic aerodynamic efficiency, which indicates the ratio of the amount of fog flowing toward the solid surface of the mesh. ηc states the collision probability of the fog particles on the solid surface against the local flow distortion. ηc should therefore be proportional to fog particle inertia.22 Aerodynamic efficiency was previously modeled by Rivera11 with assuming that the particulate flow of the fog can be analyzed by its air properties; | (3) |
 | (4) |
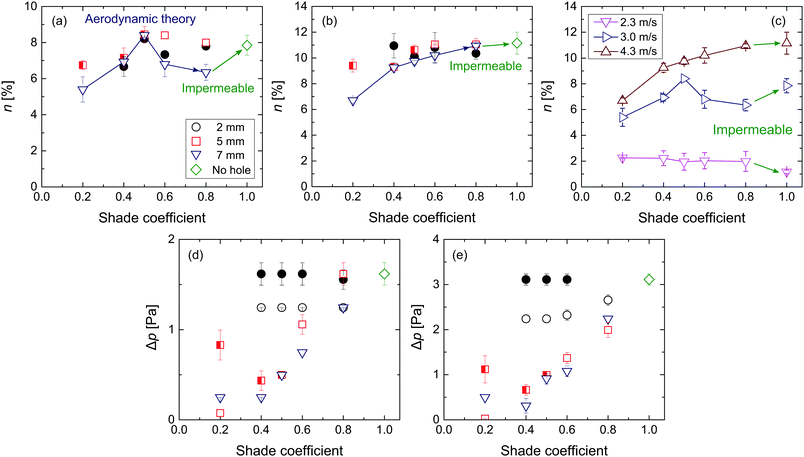 | ||
| Fig. 5 (a and b) Fog-harvesting efficiency (η) measured by eqn (2) as a function of shade coefficient for three different hole sizes of 2, 5, and 7 mm tested at two different fog speeds: (a) 3.0 m s−1 and (b) 4.4 m s−1. (c) Different dependencies of η on shade coefficient of the clogging-free mesh with d = 7 mm for three different fog speeds. (d and e) Pressure drop across the mesh as a function of shade coefficient for two different fog speeds: (d) 3.0 m s−1 and (e) 4.4 m s−1. | ||
Fig. 5(c) shows that the η–SC curve changes with the fog speed close to the mesh. At the lowest fog speed of 2.3 m s−1, the η decreases when SC changes from 0.8 to 1.0; in other words, when the mesh holes are clogged. The fog-harvesting efficiency of the impermeable plate (SC = 1.0) is then found to enhance with the increase of the fog speed. At the fastest fog speed of 4.4 m s−1, the fog-harvesting efficiency is observed to increase proportionally with SC (Fig. 5(b and c)):
| η ∝ SC. | (5) |
 which can impact the plate, than A0 of the air stream.
It is worth reminding that, in the present experimental setup, the fog inlet and the impermeable plate have the same dimension. If a larger fog inlet than the plate is used, the fog flow will circumvent the plate domain more easily. It means that it will be more difficult to increase the impact speed of fog particles incident to the plate, in a usual wind condition. As an instance, when a larger fog inlet whose diameter is 90 mm is used, the fog-harvesting efficiency at SC = 1 hardly enhances even with the increase of the fog speed from 1.5 m s−1 to 3.0 m s−1 as plotted in Fig. S1 (for more detail, see the ESI†). Accordingly, it should be carefully noted that the experimental result in this paper does not oppose the classical aerodynamic theory. Rather, it supplements the theory for a special condition when the fog particles can collide with the plate or the mesh with high inertia.
3.4 Self- and non-self-clogging meshes
Fog-harvesting efficiency measured on the self-clogging mesh (2 mm holes) and non-self-clogging mesh (5 mm holes with low SC ≤ 0.5) is plotted in Fig. 5(a and b) as filled and half-filled symbols, respectively. For the self-clogging meshes, as anticipated, the fog-harvesting efficiency and the pressure drop are measured to be almost equivalent to those of the impermeable solid plate regardless of SC for fast fog speeds. Because the impermeable plate can show high fog-harvesting yield as discussed in the previous section, the self-clogging mesh, as well as the non-self clogging mesh, consistently present better or similar fog-harvesting efficiency than the clogging-free mesh for each SC for these fog speeds, as in Fig. 5(a and b). Characteristics that distinguish the non-self-clogging from the self-clogging mesh are that not all of the holes of the former are clogged and clogging requires a long time. For example, the clogging of the 5 mm hole mesh with SC of 0.2 is fully developed after 20 min, whereas the clogging fully covers the entire mesh domain within 1 min for the 2 mm hole meshes, as compared in Fig. 7(b and c). The 5 mm hole mesh presents a pressure drop as low as the clogging-free mesh when not yet clogged, as shown by the red open square for 0.2 ≤ SC ≤ 0.5 in Fig. 5(d and e). After some of the holes are clogged, the pressure drop increases to the half-filled squares. The increase in pressure drop, as well as the enhancement of fog-harvesting efficiency, from the clogging-free mesh is most pronounced for the lowest SC value of 0.2. This is because the non-self-clogging mesh is more active when the solid width is narrower, for which the water collected on the narrow solid strip tends to be transported to the adjacent clogged water bridge. The non-self-clogging mesh, especially with low SC of 0.2, can be considered to have fog-responsive characteristics that enhance the performance to harvest more fog sometime after the fog starts to blow; otherwise its holes are fully open to have the lowest pressure drop like the clogging-free mesh. The self-clogging mesh can also be considered to have fog-responsive properties, but already presents a high-pressure drop even in the dry state and its entire mesh domain is clogged too quickly. This fog-responsive property of the non-self-clogging mesh can be beneficial to make more efficient use of the fog-harvesting net, especially in areas with strong winds. In these areas, it is desirable to use a fog-harvesting net with the lowest SC because the fracture toughness for the bending of solid strips in the mesh should be inversely proportional to w.23 It should be noted that SC ∝ w for given hole size as in eqn (1). Otherwise, the fog-harvesting net should be ruptured, as reported previously.24 However, the lowest fog-harvesting efficiency should be obtained when the mesh with lowest SC is used if the mesh is clogging-free, as in Fig. 5(a and b). The non-self-clogging mesh can be beneficial by allowing the lowest pressure drop under everyday strong winds, but increasing the fog-harvesting capability only when the fog is blowing.3.5 Fall-off behavior
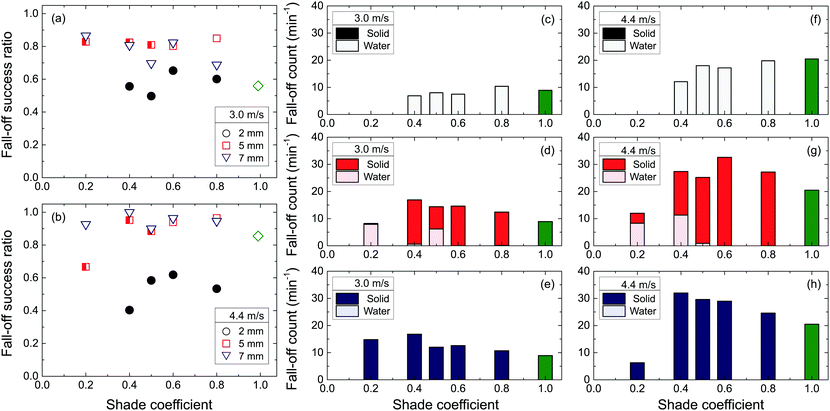
In addition to the aerodynamic capture efficiencies, the drain efficiency ηd is also a factor that affects fog-harvesting efficiency.3,11,25 This value quantifies the efficiency to drain water to the container on the bottom from the mesh by gravity. In the present work, ηd is estimated by counting the number of falling water drops from the mesh. Fig. 6(a and b) shows the fall-off success ratio, which is the ratio of water drops that successfully fall off the mesh out of all of the falling water drops. In the plot, the clogging-free meshes (blue triangles) show high fall-off success unlike the clogged meshes. This is because the falling water drops can be easily detached from the hydrophobic PLA surface. However, when the holes are clogged, the mesh edge near the bottom is covered by a thick water film, as similarly discussed for superhydrophilic surfaces in previous studies,26 which causes the pinned water to not drain into the bottom container.The fall-off water drops can be further categorized by their falling path, such as flowing down through the solid strip or via the water film, as shown in Fig. 6(c–h). The blue bar graphs indicate that the water consistently falls though the solid pathway for the clogging-free mesh because there is no source to keep a thick water film. However, the water falls always via the clogged water bridges on the self-clogging meshes, as indicated by the white bars in Fig. 6(c and f). These two cases coexist for the non-self-clogging meshes, as shown in Fig. 6(d and g). For each graph, the green bar at SC = 1.0 indicates the data of the impermeable solid plate without a hole. This implies that the clogging-free mesh sheds the water drops consistently more frequently than the impermeable plate with a maximum around SC = 0.4. In comparison, the water drops on the self-clogging mesh do not fall off as often as the impermeable plate owing to the thick water film near the mesh bottom. However, it should be carefully noted that a higher fall-off frequency does not guarantee a larger volume of the water harvested on the bottom container. In general, the clogged meshes shed bigger water drops than in the clogging-free mesh, as shown in Fig. 4. This implies that self-clogging mesh can harvest a comparable amount of fog as the clogging-free mesh. For instance, the amount of fog harvested on the self-clogging mesh is larger than the clogging-free mesh at SC = 0.4 at a fastest fog speed, as in Fig. 5(b), although the self-clogging mesh has the lowest fall-off count and the clogging-free mesh has the maximum fall-off count at this SC.
3.6 Flow distortion and effective shade coefficient
Fog-harvesting efficiency cannot be determined solely by the solid shade coefficient (SC) due to the clogging issue. This is because the fog particles interact with the clogged water surface, which increases the effective SC. This increase can play a role in enhancing fog-harvesting efficiency, especially for fast fog speeds owing to high fog inertia that impacts the blocked surface. At a fast fog speed ≫1 m s−1, the fog-harvesting efficiency is expected to be proportional to the effective SC because the detouring fog flow over the mesh edges can be relieved by high fog inertia. In this section, we quantify the effective SC by fog flow distortion in front of the mesh. Here, the fog flow distortion indicates the change of fog flow by the presence of the mesh surface from the reference state without a mesh. During the time T, the fog flow distortion can be quantified as | (6) |
 and
and  for x and z axes, u and v are the instantaneous velocity components of the fog flow with the mesh, and ū and
 ![[v with combining macron]](https://www.rsc.org/images/entities/i_char_0076_0304.gif) are the time-averaged velocities of the reference fog flow without a mesh. Higher wd values therefore indicate that the fog flow is more disturbed by the blockage either from the solid mesh or clogged water surface. In the present work, wd is estimated by measuring the flow field around the mesh using the particle image velocimetry (PIV) technique. Details of the PIV experimental setup are listed in the ESI.†
are the time-averaged velocities of the reference fog flow without a mesh. Higher wd values therefore indicate that the fog flow is more disturbed by the blockage either from the solid mesh or clogged water surface. In the present work, wd is estimated by measuring the flow field around the mesh using the particle image velocimetry (PIV) technique. Details of the PIV experimental setup are listed in the ESI.†
Fig. 7(a) presents the velocity field of the fog flow obtained from the PIV experiment around the hole-patterned meshes with different shade coefficients, where the background is colored by the fog flow distortion (wd) in eqn (6). In the figure, the black vertical bars located at x = 0 mm indicate the region in which the PIV data are not available owing to the mesh, and z is the vertical coordinate. To visualize the clogging effect, the fog flow field is compared between the data for the initial 10 s and those collected for 10 s after 1 min. Fig. 7(b) shows that the self-clogging mesh with SC of 0.4 is quickly clogged within 1 min. Its flow pattern after being clogged is therefore almost identical with the flow pattern measured for the impermeable solid plate, as shown in Fig. 7(a). High fog flow distortion is also observed for the self-clogging mesh even during the initial 10 s in comparison to other meshes presumably because of a large pressure drop by the small mesh holes themselves. While the fog flow pattern around the self-clogging mesh is similar to the impermeable solid plate, the fog flow pattern around the non-self-clogging mesh is more similar to the clogging-free case, as shown in Fig. 7(c and d).
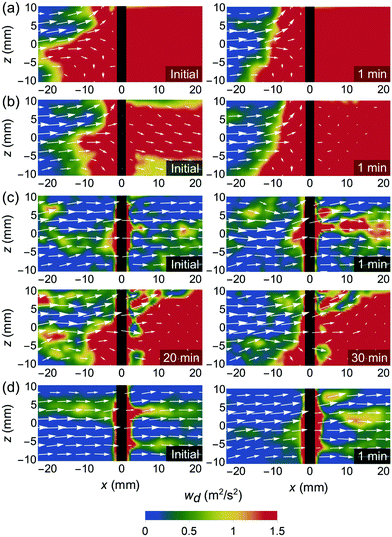 | ||
| Fig. 7 Fog flow fields measured by particle image velocimetry around (a) an impermeable solid plate, (b) self-clogging mesh with 2 mm holes and SC = 0.4, (c) non-self-clogging mesh with d = 5 mm holes and SC = 0.2, and (d) clogging-free mesh with 7 mm holes and SC = 0.2. The color map presents wd, which quantifies how the fog flow is distorted by the solid mesh as well as the clogged water surface as defined in eqn (6). | ||
For the 5 mm hole mesh with SC of 0.2, no noticeable flow change is observed during the first 1 min of the initial stage, as compared in Fig. 7(c), because the non-self-clogging requires a longer time to develop. Flow distortion from the clogged water bridges emerges slowly with time to become fully developed after 20 min. The 5 mm hole mesh is clearly not fully clogged but rather partly clogged, unlike the self-clogging mesh. For the clogging-free mesh, the fog flow is distorted only by the solid mesh, and correspondingly, the fog flow pattern around the mesh rarely changes with time (Fig. 7(d)) because it lacks the clogged water bridge that generates the time-varying characteristics. Additionally, Fig. 7(d) shows that the fog flow pattern is nearly horizontal. This should support the proportionality (η ∝ SC) in eqn (5) because the detouring fog flow over the mesh edges can be relieved by this straight flow pattern.
A change in flow distortion can be more quantitatively compared between different mesh geometries by calculating the average flow distortion  for the domain near the mesh in Fig. 7: −10 mm < x < 0 mm and −10 mm < z < 10 mm. For this domain,
 | (7) |
 , which indicates the limitation in enhancing η by increasing the effective SC. Fig. 8 also shows better proportionality between η and
  than the plot of η versus SC (Fig. 5(b)) because it considers the effective SC for the clogged meshes.
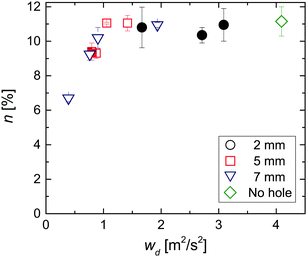 | ||
| Fig. 8 Proportionality of fog-harvesting efficiency with average work of flow distortion in eqn (7) near the mesh, which estimates the effective shade coefficient. | ||
4 Conclusions
In the present work, the interaction between the mesh and the fog flow is investigated with a systematic variation of the hole size, the shade coefficient, and the fog speed close to the mesh. From the experiments, it is found that the impermeable solid plate can harvest a fair amount of fog, when the fog particles can collide with the plate with high inertia at a fast fog speed ≫1 m s−1. In this condition, the clogged mesh similar to the impermeable plate produces a high fog-harvesting yield by increasing the effective shade coefficient from the clogged water bridges. This suggests that the mesh clogging, which undermines the fog-harvesting capability in a usual wind condition, may not be a mere drawback if the fog particles are able to keep its impact inertia. Also, the fog-harvesting efficiency of the clogging-free mesh is proportional to the solid shade coefficient for fast fog speeds ≈4 m s−1, which indicates that the fog flow circumventing the mesh domain is limited owing to high fog inertia. Furthermore, the clogging effect on fog-harvesting performance differs between self- and non-self-clogging meshes, which are distinguished by the stability of the clogged water bridge. The present results suggest that these different clogging characteristics can be applied to mesh-type fog harvester design, especially for those with a low shade coefficient when the fog blows close to the mesh at a fast speed ≫1 m s−1.Conflicts of interest
There are no conflicts to declare.Acknowledgements
This work was supported by a KIST internal project (2E30250) and grant (No. 20190437) of the Disaster and Safety Management Institute funded by the Korea Coast Guard of the Korean government. S. J. K. also would like to thank Kyuhyong Kim and Prof. Ho-Young Kim for in-depth discussions.Notes and references
- W. Shi, M. J. Anderson, J. B. Tulkoff, B. S. Kennedy and J. B. Boreyko, ACS Appl. Mater. Interfaces, 2018, 10, 11979–11986 CrossRef CAS
.
- K.-C. Park, S. S. Chhatre, S. Srinivasan, R. E. Cohen and G. H. McKinley, Langmuir, 2013, 29, 13269–13277 CrossRef CAS
.
- R. Ghosh, T. K. Ray and R. Ganguly, Energy, 2015, 89, 1018–1028 CrossRef
.
- P. Buzatu, H. Qiblawey, A. Odai, J. Jamaleddin, M. Nasser and S. J. Judd, Water Res., 2018, 144, 46–54 CrossRef CAS
.
- X. Yue, Z. Li, T. Zhang, D. Yang and F. Qiu, Chem. Eng. J., 2019, 364, 292–309 CrossRef CAS
.
- J. Li, F. Zhou and S. Li, Process Saf. Environ. Prot., 2017, 109, 357–364 CrossRef CAS
.
- J. Huang, Z. Wang, J. Zhang, X. Zhang, J. Ma and Z. Wu, Sci. Rep., 2015, 5, 9268 CrossRef CAS
.
- D. Kampa, S. Wurster, J. Buzengeiger, J. Meyer and G. Kasper, Int. J. Multiphase Flow, 2014, 58, 313–324 CrossRef CAS
.
-
R. Ghosh and R. Ganguly, Droplet and Spray Transport: Paradigms and Applications, Springer, 2018, pp. 237–266 Search PubMed
.
- R. Ghosh and R. Ganguly, Proc. Inst. Mech. Eng., Part A, 2019, 234, 994–1014 CrossRef
.
- J. de Dios Rivera, Atmos. Res., 2011, 102, 335–342 CrossRef
.
- H. Veldhuizen and J. Ledbetter, J. Air Pollut. Control Assoc., 1971, 21, 21–24 CrossRef
.
- M. Shuangchen, C. Jin, J. Kunling, M. Lan, Z. Sijie and W. Kai, Renewable Sustainable Energy Rev., 2017, 73, 225–235 CrossRef
.
- O. Klemm, R. S. Schemenauer, A. Lummerich, P. Cereceda, V. Marzol, D. Corell, J. Van Heerden, D. Reinhard, T. Gherezghiher and J. Olivier,
et al.
, Ambio, 2012, 41, 221–234 CrossRef
.
- R. S. Schemenauer and P. Cereceda, Nat. Resour. Forum, 1994, 18, 91–100 CrossRef
.
- J. Olivier, GeoJournal, 2004, 61, 203 CrossRef
.
- J. K. Domen, W. T. Stringfellow, M. K. Camarillo and S. Gulati, Clean Technol. Environ. Policy, 2014, 16, 235–249 CrossRef
.
- M. Azad, W. Barthlott and K. Koch, Langmuir, 2015, 31, 13172–13179 CrossRef CAS
.
- C. M. Regalado and A. Ritter, Atmos. Res., 2016, 178, 45–54 CrossRef
.
- D. Seo, J. Lee, C. Lee and Y. Nam, Sci. Rep., 2016, 6, 24276 CrossRef CAS
.
- J. Meseguer, L. Slobozhanin and J. Perales, Adv. Space Res., 1995, 16, 5–14 CrossRef CAS
.
- H. Johnstone and M. Roberts, Ind. Eng. Chem., 1949, 41, 2417–2423 CrossRef CAS
.
-
A. F. Bower, Applied mechanics of solids, CRC Press, 2009 Search PubMed
.
- R. Holmes, J. de Dios Rivera and E. de la Jara, Atmos. Res., 2015, 151, 236–249 CrossRef
.
- X. Dai, N. Sun, S. O. Nielsen, B. B. Stogin, J. Wang, S. Yang and T.-S. Wong, Sci. Adv., 2018, 4, eaaq0919 CrossRef
.
- A. Lee, M.-W. Moon, H. Lim, W.-D. Kim and H.-Y. Kim, Langmuir, 2012, 28, 10183–10191 CrossRef CAS
.
Footnotes |
| † Electronic supplementary information (ESI) available. See DOI: 10.1039/d0sm01133a |
| ‡ J. P. and C. L. are co-first authors. |
| This journal is © The Royal Society of Chemistry 2021 |

