 Open Access Article
Bifurcating reactions: distribution of products from energy distribution in a shared reactive mode†
Priyam
Bharadwaz‡
,
Mauricio
Maldonado-Domínguez‡
 and
Martin
Srnec
 *
*
J. Heyrovský Institute of Physical Chemistry, The Czech Academy of Sciences, Dolejškova 3, Prague 8, 18223, Czech Republic. E-mail: martin.srnec@jh-inst.cas.cz
First published on 23rd August 2021
Abstract
Bifurcating reactions yield two different products emerging from one single transition state and are therefore archetypal examples of reactions that cannot be described within the framework of the traditional Eyring's transition state theory (TST). With the growing number and importance of these reactions in organic and biosynthetic chemistry, there is also an increasing demand for a theoretical tool that would allow for the accurate quantification of reaction outcome at low cost. Here, we introduce such an approach that fulfils these criteria, by evaluating bifurcation selectivity through the energy distribution within the reactive mode of the key transition state. The presented method yields an excellent agreement with experimentally reported product ratios and predicts the correct selectivity for 89% of nearly 50 various cases, covering pericyclic reactions, rearrangements, fragmentations and metal-catalyzed processes as well as a series of trifurcating reactions. With 71% of product ratios determined within the error of less than 20%, we also found that the methodology outperforms three other tested protocols introduced recently in the literature. Given its predictive power, the procedure makes reaction design feasible even in the presence of complex non-TST chemical steps.
Introduction
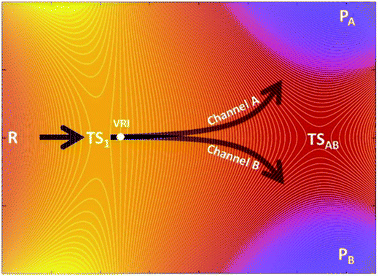
The kinetic ratio of competing reactions starting from the same reactants is governed by the difference in free energies of their associated transition states, as described by statistical transition-state theory (TST) so that the exclusive or dominant product arises from the lowest free-energy barrier.1,2 However, there is a steadily growing number of reactions which exhibit a non-statistical (non-TST) behavior where the traditional TST breaks down.3–5 Prototypical examples are bifurcating organic reactions, the channels of which diverge after passing a common (so-called ambimodal) transition state (TS1) and lead to two different products as illustrated in the schematic potential energy surface (PES) depicted in Scheme 1.6–11 Once the ambimodal TS is surmounted, this branching PES is characterized by two different product channels accessed without additional TSs. In such a scenario, selectivity is solely controlled by the atomic positions and momenta of the reactive system once the TS1 configuration has been surpassed. The overlap of these structural and dynamic signatures with energetically downhill reactive channels determines the final branching ratio.Cycloadditions are the archetypal and most widely explored reactions within this field.2 Besides them, the palette of organic reactions known to possess branching PES features includes nucleophile substitution vs. addition in α-haloketones,12 Beckmann and Schmidt rearrangements vs. fragmentation, and isomeric Pummerer rearrangements.13 Metal-catalyzed reactions and biosynthetic routes are now recognized examples of bifurcating reactions, highlighting the ever-growing importance of non-equilibrium reactivity.10,14–16 Importantly, this field has fruitfully evolved by the synergy of experiment and theory. However, prediction and quantification of the product outcome from computational models is still far from being routine. Successful models with proven simplicity and predictive power may thus find immediate application, making reaction design feasible even in the presence of complex non-TST chemical steps.
From the computational perspective, various methods have been used to determine or predict product ratios of such reactions. The most common approach employs ab initio molecular dynamics (MD) to evolve reaction systems starting from the rate-determining TS1.17,18 The atomic velocities along with their directions at TS1 are set up randomly and produce trajectories that end up in one of the possible products. This approach requires a collection of a statistically significant number of trajectories, the ratio of which defines the product branching ratio. While ab initio MD can provide accurate predictions, its major drawback lies in its considerable computational/time cost. In contrast to this method, Carpenter et al. developed a much cheaper computational approach (denoted as a ‘dynamic match’)19 that utilizes a projection of the TS1 reactive mode (i.e. the eigenvector with an imaginary frequency) on two bifurcated post-TS1 reaction coordinates, for which one needs three stationary points (TS1, PA and PB) from the PES presented in Scheme 1. The method was demonstrated to be effective in qualitative/semi-quantitative predictions but the number of tested systems remains rather limited. An alternative approach put forward by Houk correlates bond order differences at TS1 with the product ratio,20 fitting a linear function to data from a set of 15 reactions. Although purely empirical, this model has been tested on several examples with positive results,21–23 demonstrating that TS1 contains information which, if decoded, allows to make predictions on bifurcating energy surfaces. Recently, Goodman et al. designed an approach for the quantitative prediction of product outcomes of bifurcating organic reactions.24,25 Their ValleyRidge.py algorithm takes advantage of the topography of PES with a post-TS1 bifurcation and returns the product ratio by combining three key atomic displacement gradients (in the TS1 → TSAB, TSAB → PA and TSAB → PB directions; see Scheme 1) with a simplified model of the TS1 valley. Thus, the method requires the structure of four key points of the PES – TS1, TSAB, PA and PB. Despite its simplicity, it is reported to be remarkably successful in the prediction of product branching ratios, as shown for a set of ∼50 reactions. However, the method is originally tailored for reactions with a post-TS1 bifurcation fulfilling all four above-mentioned points on the respective PES and its application requires the compulsory input of these structures. We note in passing that the protocols are referred in this work as n-point methods to express the number of points from the PES involved in the quantification of product distributions. The dynamic match approach and the ValleyRidge.py program are three-point- and four-point-methods, respectively, as their numerical solution depends on the specified number of points and variations in the character of any point will produce a different solution. Houk's bond-order method and the procedure herein described are one-point-based, as only qualitative information from other points is used to tailor the method but all numerical values are obtained exclusively from the TS1 structure.
In this study, we present an approach that quantifies the branching ratio from one key point of the PES from Scheme 1 (that is the TS1), which is also a good prerequisite for a broader applicability of the method with no limitation to reactions with ‘four-point’-defined furcations and without bias towards predefined products. Specifically, the presented method relies on the kinetic energy distribution within the reactive mode at TS1, as introduced by us and already applied to coupled electron-proton transfer (CEPT) reactivity and post-CEPT selectivity.26,27 Here, we first concisely summarize the principles of the method (denoted as Reactive Mode Composition Factor – RMCF) and later assess its accuracy in the quantification of product ratios of bifurcating organic reactions and compare its performance with existing protocols. We also briefly discuss the chemical insight provided by the analysis and the limitations of the method.
Computational details
Density functional theory (DFT) calculations
Unless stated otherwise, geometry optimization and vibrational analysis of all the presented structures were performed using the B3LYP28 functional combined with the def2-TZVP basis set,29,30 applying the D3 dispersion correction31 and the conductor-like polarizable continuum model (CPCM)32 to mimic the solvent environment, if present (further denoted as B3LYP+D3/def2-TZVP(/CPCM)). The same method was applied to derive kinetic energy distribution (KED) factors defined later in the text. Reaction free energies, ΔG, were evaluated from equilibrium geometries using the following equation:ΔG = ΔEel + Δ[EZPVE + pV − RT![[thin space (1/6-em)]](https://www.rsc.org/images/entities/char_2009.gif) ln ln![[thin space (1/6-em)]](https://www.rsc.org/images/entities/char_2009.gif) Q] (+ ΔGsolv) Q] (+ ΔGsolv) | (1) |
![[thin space (1/6-em)]](https://www.rsc.org/images/entities/char_2009.gif) Q] corresponds to the thermal enthalpic and entropic contributions to the change of the solute energy with EZPVE and Q being the zero-point vibrational energy and molecular partition function obtained from a frequency calculation (at 298 K, 1 atm; ideal-gas approximation) on top of optimized geometries; the ΔGsolv term, calculated using the CPCM method, was only included for those reactions where solvent was reported in the original reference. The functionals ωB97X-D33 and mPW1k34 combined with 6-31G(d) basis set35 for TS optimization and frequency calculations were tested, as recommended by others.36,37 Quasi-classical molecular dynamics was carried out using the Atom-centered Density Matrix Propagation (ADMP) formalism, with the B3LYP+D3/def2-TZVP(/CPCM) protocol.38 Trajectories were initialized from the TS1 structure. The initial total nuclear kinetic energy was set to the zero-point vibrational energy obtained during frequency calculations. Initial velocity vectors for all atoms were set random orientations. Velocities for the j-th atom were rescaled every five steps to ensure constant temperature, by the relation
Q] corresponds to the thermal enthalpic and entropic contributions to the change of the solute energy with EZPVE and Q being the zero-point vibrational energy and molecular partition function obtained from a frequency calculation (at 298 K, 1 atm; ideal-gas approximation) on top of optimized geometries; the ΔGsolv term, calculated using the CPCM method, was only included for those reactions where solvent was reported in the original reference. The functionals ωB97X-D33 and mPW1k34 combined with 6-31G(d) basis set35 for TS optimization and frequency calculations were tested, as recommended by others.36,37 Quasi-classical molecular dynamics was carried out using the Atom-centered Density Matrix Propagation (ADMP) formalism, with the B3LYP+D3/def2-TZVP(/CPCM) protocol.38 Trajectories were initialized from the TS1 structure. The initial total nuclear kinetic energy was set to the zero-point vibrational energy obtained during frequency calculations. Initial velocity vectors for all atoms were set random orientations. Velocities for the j-th atom were rescaled every five steps to ensure constant temperature, by the relation  MD was carried out with an integration time step of 0.5 fs and total simulation times of 200 fs in all cases. All calculations were used as implemented in the software Gaussian 16 version B.01.39
Results and discussion
Reactive mode composition factor (RMCF) analysis
To understand the usability of the analysis in the space of non-TST bifurcating reactions, we first introduce its physical background. Considering the harmonic approximation, the normal vibrational coordinates Qα are related to the mass-weighted atomic displacements
 | (2) |
 representing the motion of the j-th atom in the mode α. These vectors also allow to express the atomic kinetic energy 〈Tj〉 as a linear combination of kinetic energies of normal modes 〈Tα〉:
 | (3) |
 associated with mode α by
 | (4) |
 and hence atomic KED factors of the reactive mode (≡ej,RM2). Note that KED factors of this mode (as of any normal mode α) are normalized:
  (n – total number of atoms in the system). A more detailed description for the RMCF theory and its applications can be found in ref. 26.
A crucial part of the approach is to group atomic KED factors to N sets accounting for fractions of kinetic energy of the TS1 reactive mode, which are differentially available for subsequent N reactive channels. In case of two competing post-TS1 reactive channels A and B, it requires selection of two disjunctive groups of atoms and evaluate their KEDRM factors at TS1 and
and  A general prescription for such a selection is described in the following section. The percentage of the product PA (further denoted as the product branching ratio χKED) resulting from the competition between two reactive channels is then defined as:
 | (5) |
TS partition for the calculation of branching ratios
Regardless of the reaction type involved, the workflow for TS1 partition that proved to be robust and reliable to all the reactions studied in this study is as follows:(1) Identify the atom pairs directly involved in the formation/cleavage of the bonds associated with each of the N relevant products and ascribe these pairs to N different partitions. Exclude the cleaved/formed bonds that are common to all products.
(2) Include to each partition all directly bonded H atoms.
(3) Include to each partition only the directly bonded heavy atoms (along with their H-atom caps), which are not covalently bridged to the opposite partition.
(4) Ignore all further atoms.
For most reactions, at least one bond exclusive to each product is discernible at TS1 and, thus, fragment definition is unambiguous. In cases where only one bond is formed and one is cleaved, as in reactions 13–16, 24 and 52, the modified instructions are to be followed:
(1) Identify the atom pair directly involved in the formation of the unique bond. Include in this partition all directly bonded H-atoms. This fragment corresponds to channel A.
(2) Identify the atom pair ascribed to the bond scission or formation that is common to all products. Include in this partition all directly bonded H atoms.
(3) The fragment B is composed of all atoms that are not ascribed to A nor to the common fragment.
Scheme 2 illustrates the above-described workflow for TS partition in terms of atomic KED factors that are grouped into two relevant partitions for each upcoming reaction channel. The selection of the relevant atomic pairs can be inferred from the TS1 structure, and we provide as ESI† a python program (rmcf.py) to expedite this process by performing the following tasks:
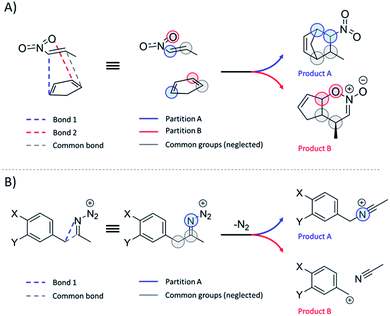 | ||
| Scheme 2 (A) Partition of the reactive system at TS1 into two groups of atoms ascribed to two competing channels in bifurcating reactions presented in this study. Note that these groups also include hydrogen atoms that are not explicitly visualized. Each of two groups is associated with a fraction of kinetic energy of the reactive mode at TS1 (see the main text), which is utilized for evaluation of the product branching ratio χKED using eqn (5). (B) Partitioning scheme for reactions where one bond is cleaved and only one bond is formed. | ||
(1) Calculation of the kinetic energy distribution within the reactive mode.
(2) Displacement of the TS geometry along the reactive mode.
(3) Gauge of all interatomic displacements and their ranking as a list of potential bond formation/breaking events.
By inspection of the provided list of potential bond formation/cleavage events, the user can identify chemically relevant bonds and follow the provided workflow for TS partitioning. The selection of relevant atomic pairs is not completely automatic, but this provides the flexibility needed to screen numerous potential products from a single TS structure. We refer the reader to Table S1† where detailed partitions for all reactions are included. In addition, we compare alternative partitioning schemes for all reactions in ESI (Tables S2 and S3†), corroborating the outlined selection strategy. As demonstrated in ESI (Table S4†), the use of alternative functionals ωB97X-D and mPW1k combined with the 6-31G(d) basis set has a minor impact on the results from the reactive mode composition factor analysis.
Studied bifurcating reactions
In the first part of the presented study, we use a collection of 48 bifurcating reactions, which were computationally investigated previously by Lee and Goodman in ref. 24 and for which the referential data (i.e., experimental or MD-based product branching ratios) were reported in the literature. All these reactions are given in Fig. 1 and all associated TSs are visualized in Fig. S1† (for more detailed information on ratios and solvent conditions, see Table S5†). The studied reactions cover a broad spectrum of reactions, featuring a rich set of bifurcating pericyclic processes (1–12, 23–34, 47–48),14,43–56 nitrene insertions (35–38),57 rearrangement and fragmentation reactions (13–16, 39),13,58–60 the branching in nucleophilic additions and substitutions (17–22, 46),11,61 and solvent-dependent isomeric Pummerer rearrangements (40–44).12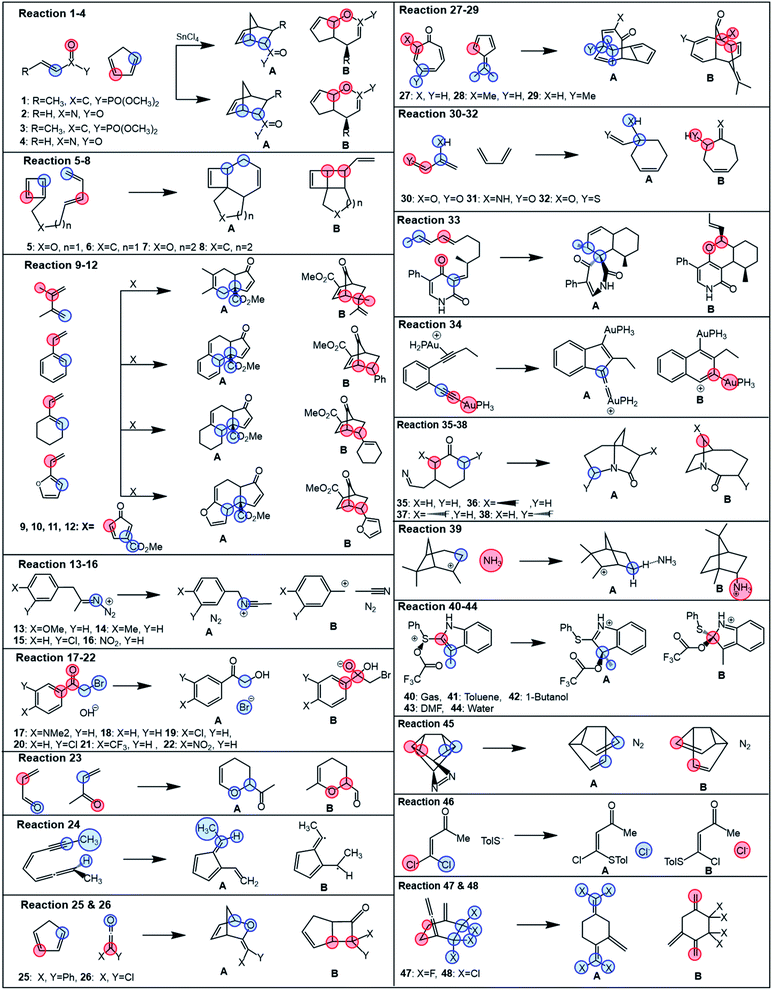 | ||
| Fig. 1 Bifurcating reactions considered in this study. Referential data for product ratios are taken from the literature (references in the main text). Partition of each reactive system for evaluation of branching ratio (χ) is carried out according to the description in Scheme 2. Blue and red colors correspond to partitions A and B, specified in more detail in Table S1.† | ||
RMCF analysis of transition states from bifurcating reactions
The product ratios calculated from eqn (5) and their comparison with experimental and MD data for all reactions depicted in Fig. 1 are presented in Fig. 2. From that, we found that RMCF correctly determines the major product in 89% of the studied reactions (i.e., 41 from the 46 bifurcating reactions) and, for 21 and 45, it yields 50%![[thin space (1/6-em)]](https://www.rsc.org/images/entities/char_2009.gif) :
:![[thin space (1/6-em)]](https://www.rsc.org/images/entities/char_2009.gif) 50% distributions (with <10% error) over products A and B, in excellent agreement with the referential data. This is apparent from Fig. 2A, where the top-right quadrant of the plot is most populated. The exceptions are reactions 5, 12, 15, 16 and 22, for which the referential major products are predicted by RMCF to be formed in minority. In addition, Fig. 2B shows that an unsigned deviation from the referential data (KEDerror) is only ≤10% for 25 and ≤20% for 34 of the total 48 cases.
50% distributions (with <10% error) over products A and B, in excellent agreement with the referential data. This is apparent from Fig. 2A, where the top-right quadrant of the plot is most populated. The exceptions are reactions 5, 12, 15, 16 and 22, for which the referential major products are predicted by RMCF to be formed in minority. In addition, Fig. 2B shows that an unsigned deviation from the referential data (KEDerror) is only ≤10% for 25 and ≤20% for 34 of the total 48 cases.
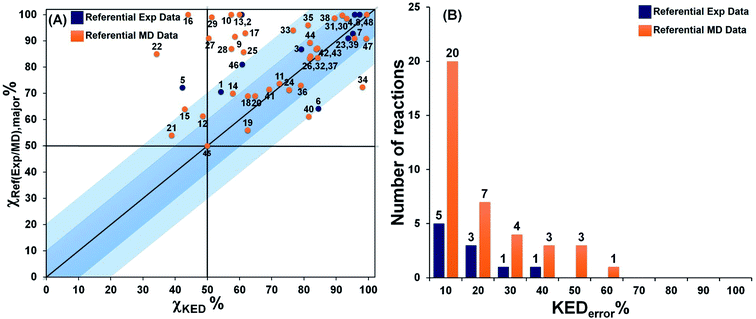 | ||
| Fig. 2 The correlation between χKED from eqn (5) and the referential χref(exp/MD),major values, as obtained from experiment or MD simulations (blue or orange points) for reactions 1–48 from Fig. 1 are presented (panel A). Note that χKED refers to the product that is determined as a major product in the reference. The distribution of the number of reactions according to the unsigned deviation KEDerror ≡ |χKED − χref(exp/MD),major|) are shown in panel B. Note that more details are provided in Table S5.† | ||
Considering the computational subset of references, the RMCF shows a very good performance. Namely, KEDerror falls in the range of ≤10% for 20 and ≤20% for 27 of the 38 reactions (Fig. 2, the orange bars). In comparison with the available experimental data, RMCF is found to perform even better: KEDerror of ≤10% for 5 and ≤20% for 8 of the 10 cases is observed (Fig. 2, blue bars). We consider of utmost importance the comparison with available experimental data.§ In this context, the RMCF analysis is capable of correct determination of the major product in 89% of studied cases, with a correct quantification (with a tolerance of <20%) in 80% of them. The results of the analysis of all reactions in the present work with the rmcf.py program are summarized in Table S6.†
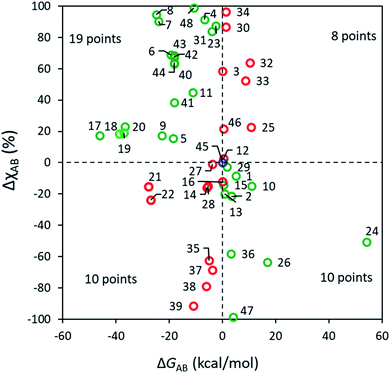
Selectivity and thermodynamic driving force in bifurcating reactions
According to a traditional linear free energy relationship (LFER), a more exergonic reaction within a set of closely related reactions tends to have a lower barrier and hence to proceed preferably. Namely, if reaction A is more exergonic than B (i.e., ΔGAB < 0), the barrier for A tends to be lower than that for B, which leads to a larger ratio in favor of PA. In the case of bifurcating reactions, the situation is slightly different since both reactions A and B share a common barrier, and only a frugal number of discussions relate the selectivity of bifurcating reactions with their corresponding driving forces.4,62 Some selected examples have been pointed out in the literature,63 where the effect of ΔGAB is overridden by the dynamic match between atomic momenta at TS1 and an upcoming reaction channel. Whether the occurrence of these examples is common or only a minority has, to our knowledge, not been addressed in a broad chemical space. The present set of ∼50 diverse reactions enriches the pool of data correlating ΔGAB and the excess of one of the products, ΔχAB and these results are shown in Fig. 3. All ΔG values are condensed in Table S7.†As seen in Fig. 3, it is clear that the effect of thermodynamic driving force on A vs. B selectivity in bifurcating reactions should only be considered with high caution. For 29 out of 48 reactions (60% of cases), the major product is indeed more stable, although no clear correlation can be discerned between ΔGAB and the excess of PA, even for apparently similar processes. For example, reactions 5 (with ΔGAB = 18.4 kcal mol−1 and ΔχAB = 15%) and 6 (ΔGAB = 19.4 kcal mol−1 and sizeable ΔχAB = 69%) share the same mechanism yet their outcome does not follow an intuitive LFER-like trend. For 18 reactions the major predicted product is less stable demonstrating that, in a substantial number of cases, the local curvature of the PES at TS1 overcomes the effect of having product basins of different depths. The RMCF method correctly predicts the major product for 89% of the reactions (for 71% within a 20% error) implying that the post-TS dynamics for most of the studied reactions is encoded in TS1. Our present results demonstrate that the dissection of TS structures using the RMCF approach is semiquantitatively predictive even in complex bifurcating PES where LFER analyses might be inconclusive or lead to incorrect predictions.
Comparison of RMCF with existing approaches designed for product ratio evaluation
Here, we assess the performance of three alternative computational PES-topography based procedures relative to the RMCF analysis: (i) Goodman's four-point algorithm,17 which involves the ambimodal TS1 along with TSAB, PA and PB points of the PES as illustrated in Scheme 1; (ii) Carpenter's ‘dynamic match’ based on TS1, PA and PB,19 and (iii) an approach put forward by Houk,20 which correlates bond order ratios at the ambimodal TS1 with the product ratio. For the sake of comparison with RMCF, we use the B3LYP+D3/def2-TZVP(/CPCM) level of theory for all these protocols.In our hands, Goodman's 4-point algorithm could be applied to 45 out of the 48 reactions when the B3LYP + D3/def2-TZVP method is used (all attempts to calculate 15, 16 and 34 were unsuccessful, as described in ESI†). For this reason, reactions 15, 16 and 34 will be excluded in all forthcoming comparisons between methods, to treat all protocols on an equal footing. In addition, reactions 21 and 45 are not considered for the ranking of selectivity predictions, as their ratios are within 45–55% and no major product can be discerned neither experimentally nor computationally in such cases.
Goodman's method correctly predicts the major product in 81% of 43 reactions from Fig. 1, with the error below 10% for 53% of them (and below 20% for 71% of cases) as shown in Fig. 4A and S3.† As evidenced by reactions 15 and 16, where TSAB could not be located, the strict requirement of four optimized structures may render it less applicable to broader types of reactions. Further, the explicit tailoring of Goodman's method towards bifurcating reactions turns it increasingly demanding for higher order furcations, as in the case of trifurcations, where a division into three competing bifurcations with a total input of 7 stationary points was necessary in the original ref. 24. An important remark is that Goodman's 4-point approach was tested on reactions calculated with different methods, some of them selected by the original authors to maximize the agreement with experiments.28,29,40 Under such conditions, both Goodman's and RMCF methods perform even better (Fig. S4 and S5†), yet this heterogeneity precludes the selection of a generally reliable method. For the same set of reactions, we herein show that with qualitatively correct selectivity in 93% (40 out of 43) and with the correct quantification (with a tolerance of 20%) in 71% of cases, the RMCF analysis with the B3LYP functional proves to be a general and balanced prescription requiring a single point from the PES complemented by qualitative information of the suspected products or chemical knowledge from the user.
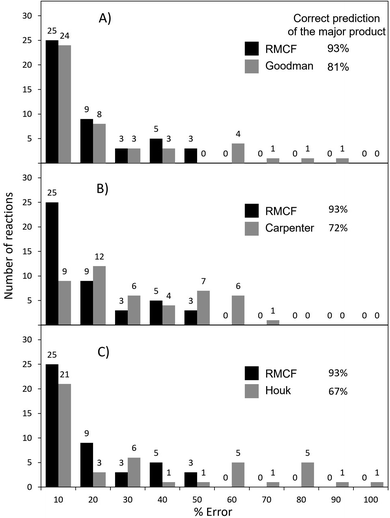 | ||
| Fig. 4 The performance of the RMCF approach versus the performance of three other PES-topography based approaches: the Goodman's algorithm from ref. 24 (panel A), Carpenter's dynamic match from ref. 19 (panel B) and Houk's bond-order based fitting function from ref. 20 (panel C). The performance of all four methods is assessed with respect to referential (experimental or MD) data for reactions presented in Fig. 1. Reactions 21 and 45, with referential ratios of 45–55% were not considered for evaluating major product predictions. | ||
In case of Carpenter's dynamic match, it correctly predicts the major product for 72% of reactions from Fig. 1 but the quantification of the product ratio is considerably less successful: only 20% (and 47%) of reactions fall within the deviation of 10% (and 20%) from referential data (Fig. 4B, S6 and S7†).
Finally, Houk's method of bond order ratios (BOR) at the ambimodal TS1 relies on a linear fit to a training set of reactions and is expected to work adequately for processes which are closely related to those used in the fit. It determines the correct major product for 67% of the reactions in Fig. 1, with 47% (and 54%) of all reactions predicted within error of 10% (and 20%) from the reference data (Fig. 4C, S8 and S9†). The BOR and RMCF methods were also applied to the training set of 15 reactions used the original ref. 20 and the results are given in ESI (Table S8, Fig. S10 and S11†).
Robustness of the DFT protocol
Since the existing pool of computational studies have employed a broad gamut of density functionals to tackle each specific problem, we compared the accuracy of B3LYP+D3/def2-TZVP(/CPCM) with that of other DFT-based levels of theory employed in the original references (see ESI for more details, Table S9 and Fig. S4†). For 43 out of 48 bifurcations, we observe that B3LYP yields results comparable to those obtained with the approaches used in the original references, i.e., with a difference of <10% (Tables S4 and S10†). For two of the five remaining reactions, B3LYP improves product ratios by >10% (25 and 42). Contrarily, the B3LYP results for 1, 10 and 40 are worsened by >10%. Despite this robustness, the tendency of the B3LYP-based approach to overestimate asynchronicity of highly asynchronous TSs has been recently pointed out.28,29 In such extreme cases, the ωB97XD/6-31G(d)(/CPCM) and mPW1k/6-31G(d)(/CPCM) levels of theory were proposed as reliable alternatives. Thus, we recalculated with them all organic reactions from Fig. 1. The results are summarized in Table S5.† With mean unsigned errors of ∼16% for B3LYP, and ∼15% for ωB97X-D and mPW1k functional based calculations, there is no significant advantage for any of the alternative functionals over B3LYP (see Fig. S12†). Overall, we conclude this section stating that the B3LYP-based methodology is sufficiently robust for the calculation of reactive mode composition factors and hence distributions of bifurcating reaction products.Performance of the RMCF method with unseen ambimodal reactions
The partition scheme for transition states was selected to guarantee maximum robustness and applicability of the RMCF method to the broadest possible chemical space. As such, reactions 1–48 served as a training set for the model. Next, we proceed to evaluate its performance on a test set of 13 additional reactions, 49–61,64–70 shown in Fig. 5.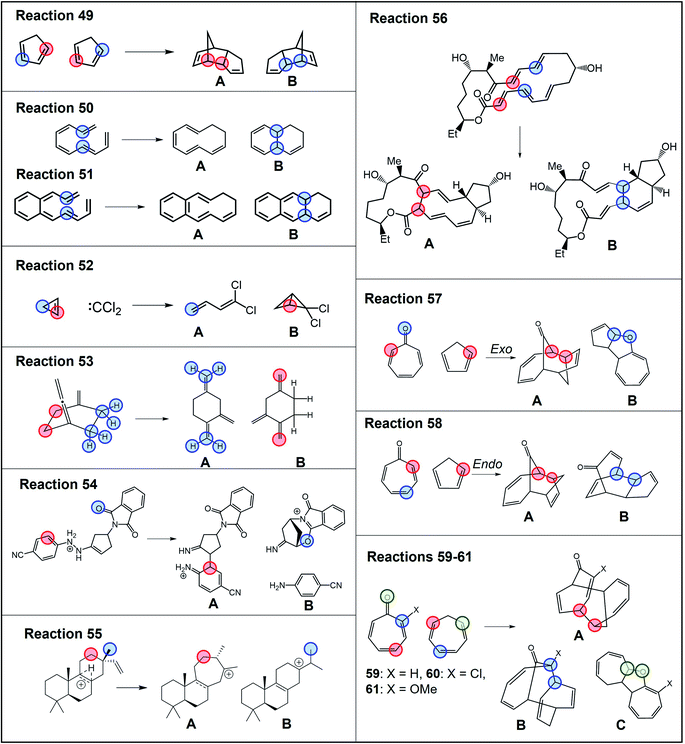 | ||
| Fig. 5 Test set of ambimodal reactions 49–61 (ref. 64–70) not included in the selection of the partitioning scheme. Partition of each reactive system for evaluation of branching ratio (χ) is carried out according to the description in Scheme 2. Blue, red and green colors correspond to partitions A–C, specified in more detail in Tables S10 and S11.† | ||
The RMCF method retains well its robustness on these reactions, predicting product distributions with errors of <20% for 77% of the tested reactions, with mean unsigned error of 14% (Fig. S13, Tables S10 and S11†). This demonstrates the adequate performance of the method on general organic reactions beyond the set employed during its development.
Among the test set, reaction 55 is striking as 11 different stationary points were obtained from MD simulations68 (the structure of all the products accessible from TS55 and their yields from MD, as reported in ref. 68, are condensed in Fig. S14†). The discrimination of all 11 products is admittedly out of the scope of the presented method, as explained in detail in ESI (Table S14† and accompanying discussion). Nonetheless, as the authors note, this dauntingly complex reactive system lands predominantly on species 55A and 55B, each as a mixture of two conformers. On the basis of this observation, we treated this reaction as a bifurcating system and applied the RMCF analysis predicting a 57%![[thin space (1/6-em)]](https://www.rsc.org/images/entities/char_2009.gif) :
:![[thin space (1/6-em)]](https://www.rsc.org/images/entities/char_2009.gif) 43% ratio, in good agreement with the MD result of 59%
43% ratio, in good agreement with the MD result of 59%![[thin space (1/6-em)]](https://www.rsc.org/images/entities/char_2009.gif) :
:![[thin space (1/6-em)]](https://www.rsc.org/images/entities/char_2009.gif) 32%. The remaining 9% (products 55C–55H, Fig. S14†) cannot be accounted for by the RMCF method.
32%. The remaining 9% (products 55C–55H, Fig. S14†) cannot be accounted for by the RMCF method.
Also of interest is the set of reactions 59–61, involving different tropones and cycloheptatriene. It has been suggested that these processes involve trifurcating PES, where a single TS1 leads to three different products. In all these cases, the rmcf.py program does not predict any propensity for formation of the bond leading to product C in line with MD carried out by Houk and coworkers, which yielded 1% of 59C, 1% of 60C and 0% of 61C.65 Hence, we treated these reactions as bifurcations, obtaining ratios of 39%![[thin space (1/6-em)]](https://www.rsc.org/images/entities/char_2009.gif) :
:![[thin space (1/6-em)]](https://www.rsc.org/images/entities/char_2009.gif) 61% (vs. Houk's MD ratio of 36%
61% (vs. Houk's MD ratio of 36%![[thin space (1/6-em)]](https://www.rsc.org/images/entities/char_2009.gif) :
:![[thin space (1/6-em)]](https://www.rsc.org/images/entities/char_2009.gif) 58% for 59A
58% for 59A![[thin space (1/6-em)]](https://www.rsc.org/images/entities/char_2009.gif) :
:![[thin space (1/6-em)]](https://www.rsc.org/images/entities/char_2009.gif) 59B), 42%
59B), 42%![[thin space (1/6-em)]](https://www.rsc.org/images/entities/char_2009.gif) :
:![[thin space (1/6-em)]](https://www.rsc.org/images/entities/char_2009.gif) 58% (vs. 63%
58% (vs. 63%![[thin space (1/6-em)]](https://www.rsc.org/images/entities/char_2009.gif) :
:![[thin space (1/6-em)]](https://www.rsc.org/images/entities/char_2009.gif) 30% for 60A
30% for 60A![[thin space (1/6-em)]](https://www.rsc.org/images/entities/char_2009.gif) :
:![[thin space (1/6-em)]](https://www.rsc.org/images/entities/char_2009.gif) 60B) and 36%
60B) and 36%![[thin space (1/6-em)]](https://www.rsc.org/images/entities/char_2009.gif) :
:![[thin space (1/6-em)]](https://www.rsc.org/images/entities/char_2009.gif) 64% (vs. 55%
64% (vs. 55%![[thin space (1/6-em)]](https://www.rsc.org/images/entities/char_2009.gif) :
:![[thin space (1/6-em)]](https://www.rsc.org/images/entities/char_2009.gif) 37% for 61A
37% for 61A![[thin space (1/6-em)]](https://www.rsc.org/images/entities/char_2009.gif) :
:![[thin space (1/6-em)]](https://www.rsc.org/images/entities/char_2009.gif) 61B). The origin of the discrepancies for 60 and 61 is unclear but it is likely is a consequence of steric interactions, as the authors mention in the original work, and which would be consistent with the erroneous prediction of the major product in reaction 5 (see the section Advantages and limitations of RMCF).
61B). The origin of the discrepancies for 60 and 61 is unclear but it is likely is a consequence of steric interactions, as the authors mention in the original work, and which would be consistent with the erroneous prediction of the major product in reaction 5 (see the section Advantages and limitations of RMCF).
Application to reactions featuring statistical and nonstatistical contributions
There exist cases, where a reaction might present statistical steps (i.e., the selectivity between two or more transition states can be estimated using Eyring's TST) and nonstatistical steps (where the RMCF analysis can predict product distributions). We will exemplify this application as an additional test of the versatility of the RMCF protocol. The first example is the reaction between dichlorocarbene and 2-methylbenzocyclopropene (reaction 62, Fig. 6). In agreement with the original report,63 we predict two isomeric and nearly degenerate transition states (ΔΔG≠ = 0.5 kcal mol−1), which can both bifurcate to yield the isomeric products 62A and 62B. By applying TST, we estimate a statistical 70%![[thin space (1/6-em)]](https://www.rsc.org/images/entities/char_2009.gif) :
:![[thin space (1/6-em)]](https://www.rsc.org/images/entities/char_2009.gif) 30% partitioning between both transition states. RMCF analysis of them yields nonstatistical ratios of 95%
30% partitioning between both transition states. RMCF analysis of them yields nonstatistical ratios of 95%![[thin space (1/6-em)]](https://www.rsc.org/images/entities/char_2009.gif) :
:![[thin space (1/6-em)]](https://www.rsc.org/images/entities/char_2009.gif) 5% and 9%
5% and 9%![[thin space (1/6-em)]](https://www.rsc.org/images/entities/char_2009.gif) :
:![[thin space (1/6-em)]](https://www.rsc.org/images/entities/char_2009.gif) 91% to products 62A and 62B (Table S12†). Combining these results we predict a 69%
91% to products 62A and 62B (Table S12†). Combining these results we predict a 69%![[thin space (1/6-em)]](https://www.rsc.org/images/entities/char_2009.gif) :
:![[thin space (1/6-em)]](https://www.rsc.org/images/entities/char_2009.gif) 31% ratio, in excellent agreement with the experimental quantification that is 68%
31% ratio, in excellent agreement with the experimental quantification that is 68%![[thin space (1/6-em)]](https://www.rsc.org/images/entities/char_2009.gif) :
:![[thin space (1/6-em)]](https://www.rsc.org/images/entities/char_2009.gif) 32%.
32%.
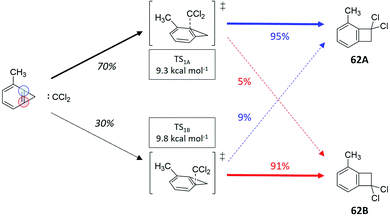 | ||
| Fig. 6 Reaction between dichlorocarbene and 2-methylbenzocyclopropene (ref. 63), featuring two energetically close transition state, each of them showcasing a different branching ratio to the experimentally observed products. Ratios in black were obtained from TST and colored percentages from RMCF analysis. | ||
A final test to our protocol is the challenging tripericyclic reaction between 8,8-dicyanoheptafulvene and 6,6-dimethylfulvene. Houk et al. reported an ambimodal TS leading to the formation of [4 + 6], [6 + 4] and [8 + 2] cycloproducts (63A, 63B and 63C in Fig. 7).71 From MD simulations, all three cycloadducts are formed in the ratio of 87%![[thin space (1/6-em)]](https://www.rsc.org/images/entities/char_2009.gif) :
:![[thin space (1/6-em)]](https://www.rsc.org/images/entities/char_2009.gif) 3%
3%![[thin space (1/6-em)]](https://www.rsc.org/images/entities/char_2009.gif) :
:![[thin space (1/6-em)]](https://www.rsc.org/images/entities/char_2009.gif) 3%. However, according to experiments of Liu and Ding, there are only two detectable cycloadducts 63B and 63C, with the ratio of 54%
3%. However, according to experiments of Liu and Ding, there are only two detectable cycloadducts 63B and 63C, with the ratio of 54%![[thin space (1/6-em)]](https://www.rsc.org/images/entities/char_2009.gif) :
:![[thin space (1/6-em)]](https://www.rsc.org/images/entities/char_2009.gif) 46%.72,73 To reconcile this discrepancy, Houk proposed that the kinetically favored major product 63A undergoes rapid conversion to the thermodynamically more stable cycloadducts 63B and 63C, although no estimation of the final 63B
46%.72,73 To reconcile this discrepancy, Houk proposed that the kinetically favored major product 63A undergoes rapid conversion to the thermodynamically more stable cycloadducts 63B and 63C, although no estimation of the final 63B![[thin space (1/6-em)]](https://www.rsc.org/images/entities/char_2009.gif) :
:![[thin space (1/6-em)]](https://www.rsc.org/images/entities/char_2009.gif) 63C ratio was possible from MD studies and thus the link between the trifurcation outcome and the experimentally observed selectivity in this process was not addressed.
63C ratio was possible from MD studies and thus the link between the trifurcation outcome and the experimentally observed selectivity in this process was not addressed.
 | ||
| Fig. 7 Trifurcating cycloaddition reaction 63, between 8,8-dicyanoheptafulvene and 6,6-dimethylfulvene. The partition of TS1 required for calculation of χKED of products is highlighted by colored circles following the prescription in Scheme 2. | ||
To address it, we first calculated KED values for ambimodal 63-TS1 to determine a product distribution of 22%![[thin space (1/6-em)]](https://www.rsc.org/images/entities/char_2009.gif) :
:![[thin space (1/6-em)]](https://www.rsc.org/images/entities/char_2009.gif) 26%
26%![[thin space (1/6-em)]](https://www.rsc.org/images/entities/char_2009.gif) :
:![[thin space (1/6-em)]](https://www.rsc.org/images/entities/char_2009.gif) 52% for 63A, 63B and 63C, respectively (Table S13†). In agreement with ref. 72, we observe that 63A must be redistributed over 63B and 63C since it undergoes two bifurcating Cope rearrangements via two energetically comparable ambimodal transition states, TS2A and TS2B (Fig. 8). Since 63A originates from an 8.2 kcal mol−1 descent from TS1 and the upcoming barriers to 63B and 63C are 10.0 and 11.4 kcal mol−1, we expect a randomization of momenta in the 63A basin. This renders TST applicable to estimate the selectivity between these two channels. The calculated preference of TS2A over TS2B by 1.4 kcal mol−1 yields a ratio of 91
52% for 63A, 63B and 63C, respectively (Table S13†). In agreement with ref. 72, we observe that 63A must be redistributed over 63B and 63C since it undergoes two bifurcating Cope rearrangements via two energetically comparable ambimodal transition states, TS2A and TS2B (Fig. 8). Since 63A originates from an 8.2 kcal mol−1 descent from TS1 and the upcoming barriers to 63B and 63C are 10.0 and 11.4 kcal mol−1, we expect a randomization of momenta in the 63A basin. This renders TST applicable to estimate the selectivity between these two channels. The calculated preference of TS2A over TS2B by 1.4 kcal mol−1 yields a ratio of 91![[thin space (1/6-em)]](https://www.rsc.org/images/entities/char_2009.gif) :
:![[thin space (1/6-em)]](https://www.rsc.org/images/entities/char_2009.gif) 9 for the transformation of 63A to 63B and 63C. Applying now the RMCF protocol, we foresee that TS2A and TS2B favor 99% of 63B and 98% of 63C, respectively. Thus, the initial fraction of 22% for 63A is eventually partitioned ∼9
9 for the transformation of 63A to 63B and 63C. Applying now the RMCF protocol, we foresee that TS2A and TS2B favor 99% of 63B and 98% of 63C, respectively. Thus, the initial fraction of 22% for 63A is eventually partitioned ∼9![[thin space (1/6-em)]](https://www.rsc.org/images/entities/char_2009.gif) :
:![[thin space (1/6-em)]](https://www.rsc.org/images/entities/char_2009.gif) 1 between 63B and 63C, leading to the final ratio of 46%
1 between 63B and 63C, leading to the final ratio of 46%![[thin space (1/6-em)]](https://www.rsc.org/images/entities/char_2009.gif) :
:![[thin space (1/6-em)]](https://www.rsc.org/images/entities/char_2009.gif) 54%, with a deviation of only 8% from experiment. The ωB97X-D- and mPW1k-calculated KED values obtained for TS1 predict relative abundance of 63A, 63B and 63C to be 42%
54%, with a deviation of only 8% from experiment. The ωB97X-D- and mPW1k-calculated KED values obtained for TS1 predict relative abundance of 63A, 63B and 63C to be 42%![[thin space (1/6-em)]](https://www.rsc.org/images/entities/char_2009.gif) :
:![[thin space (1/6-em)]](https://www.rsc.org/images/entities/char_2009.gif) 16%
16%![[thin space (1/6-em)]](https://www.rsc.org/images/entities/char_2009.gif) :
:![[thin space (1/6-em)]](https://www.rsc.org/images/entities/char_2009.gif) 42% and 44%
42% and 44%![[thin space (1/6-em)]](https://www.rsc.org/images/entities/char_2009.gif) :
:![[thin space (1/6-em)]](https://www.rsc.org/images/entities/char_2009.gif) 16%
16%![[thin space (1/6-em)]](https://www.rsc.org/images/entities/char_2009.gif) :
:![[thin space (1/6-em)]](https://www.rsc.org/images/entities/char_2009.gif) 40%, respectively (see Fig. S15†). The subsequent post-TS2A and post-TS2B bifurcations towards the final products 63B and 63C yield a 49%
40%, respectively (see Fig. S15†). The subsequent post-TS2A and post-TS2B bifurcations towards the final products 63B and 63C yield a 49%![[thin space (1/6-em)]](https://www.rsc.org/images/entities/char_2009.gif) :
:![[thin space (1/6-em)]](https://www.rsc.org/images/entities/char_2009.gif) 51% ratio for ωB97XD and 43%
51% ratio for ωB97XD and 43%![[thin space (1/6-em)]](https://www.rsc.org/images/entities/char_2009.gif) :
:![[thin space (1/6-em)]](https://www.rsc.org/images/entities/char_2009.gif) 57% for mPW1k, in agreement with B3LYP.
57% for mPW1k, in agreement with B3LYP.
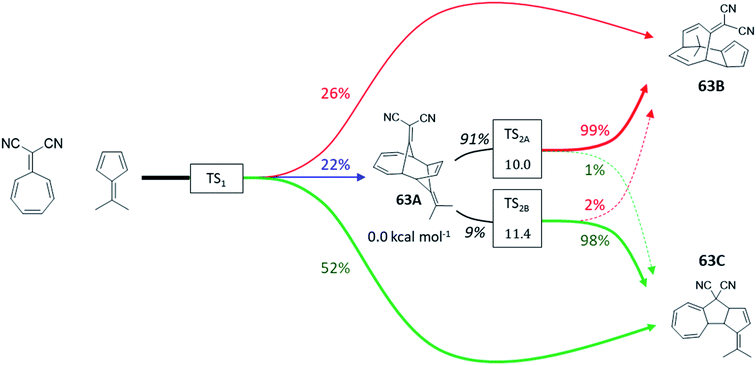 | ||
| Fig. 8 Tripericyclic reaction between 8,8-dicyanoheptafulvene and 6,6-dimethylfulvene in chloroform. Only 63B and 63C were observed experimentally (ref. 54). Two bifurcating Cope rearrangements occurring via two ambimodal transition states TS2A and TS2B act as exit channels from the unstable 63A species. The product distributions are calculated at the B3LYP+D3/def2-TZVP/CPCM level of theory. Ratios in black were obtained from TST and colored percentages from RMCF analysis. | ||
These results show that the RMCF analysis can be combined with TST for the quantitative analysis of complex reactions involving both statistical and nonstatistical contributions, including reactions with N > 2 post-TS channels.
Advantages and limitations of RMCF
In light of other methods, RMCF is the best balanced with respect to simplicity and accuracy. It is comparably simple to Houk's BOR approach since it requires a minimal input, which is only one point from the PES. When the kinetic energy distribution at the reactive mode is complemented with qualitative information about the expected products, it reaches the accuracy of (or even surpasses) the four-point algorithm of Goodman et al. (Scheme 3).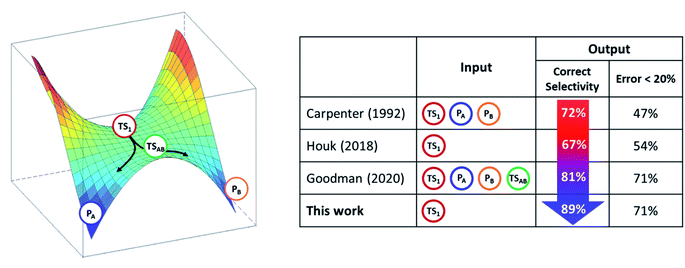 | ||
| Scheme 3 The transition state TS1 in bifurcating reactions encodes enough information to forecast the product ratio. The analysis of reactive mode composition factors (RMCF) provides an intuitive means to achieve this. Correct selectivity implies the prediction of the correct major product. The measures reflect method performance on the reaction set from Fig. 1. | ||
One-point methods will prove especially advantageous when additional points of the PES are inaccessible or computationally expensive to optimize, and when more than two products emerge from TS1. However, it is worth noting that reactions 5 and 13–16 are mostly out of reach for RMCF and the three other methods tested here, demonstrating that complex trajectories are still a challenge for simplified models. In the case of 5, the motion at the TS1 structure points towards (4 + 2) cycloaddition, which in fact should be a less favored pathway. Thus, it seems that a tight –CH2OCH2– tether outweighs this kinetic-energy propensity at TS1, which eventually leads to the (2 + 2) product. An analogous example was pointed out by us in the past in the context of ‘rebound’ hydroxylation vs. dissociation in post H-atom abstraction reactivity,27 where a reaction poised for dissociation in terms of KED follows the hydroxylation channel due to tethering. Such examples demonstrate the possibility to tilt the selectivity against the kinetic energy distribution at TS1.
One noticeable limitation of the method stems from the lack of a temperature dependence in the RMCF analysis. While a thermostat can be routinely applied in MD simulations so that product ratios can vary as a function of temperature, the eigenvalues of the diagonalized hessian matrix (and, consequently, kinetic energy distributions) are independent of the temperature. However, there is only a little evidence of a change in branching ratios emanating from a change in temperature. For example, experimentally determined product ratio for thermolysis of enyne-allenes (a reaction similar to 24) changes in the range of 2–4% as T is increased from 30° to 100 °C.74 Another relevant example is the activation of CH4 by MgO+, which has been studied experimentally and by means of MD.75 Since the calculated PES is expected to display a shallow intermediate, this process cannot be considered a canonical bifurcating reaction. However, MD trajectories bypassed such intermediate, leading directly to either of the two accessible reactive channels akin to a bifurcating reaction. Remarkably, only a small product redistribution (3%) was observed in going from 300 to 600 K, suggesting that dynamically controlled reactions might be relatively insensitive to changes in temperature and thus amenable to RMCF analysis. The influence of temperature on the outcome of branching reactions remains an underdeveloped area.
Regarding the presence of shallow intermediates in branching PES and their influence on selectivity, we demonstrated in the past the successful application of the RMCF methodology to the rebound vs. dissociation dichotomous mechanism in C–H activation reactions by iron-oxo species.27 In this context, a nascent carbon-centered radical can either (1) dissociate out of the solvent cage and become susceptible to trapping and further transformations, or (2) ‘ballistically’ recombine with the Fe–OH species in a nonequilibrium process. The kinetic energy distributions calculated using the RMCF protocol provided a clear and predictive rationalization of the selectivity observed in such cases. Also relevant are the MD studies on the cycloaddition between cyclopentadiene and dichloroketene (reaction 26) by Singleton and coworkers,37 where they observed that the B3LYP PES features a shallow intermediate, yet most trajectories bypass it suggesting that the influence of such intermediates might be only marginal, in agreement with the MD studies on CH4 activation by MgO+ in ref. 75. Recently, Goodman's 4-point method was extended to also account for shallow intermediates by the inclusion of the intermediate as a fifth stationary point.25
Conclusions
The Reactive Mode Composition Factor (RMCF) analysis and its application to bi- and multifurcating reactions and their product distribution is presented. This significantly extends the portfolio of non-TST behaving reactions whose selectivity is reliably predicted by RMCF. As we demonstrate in the present work, the protocol allows the quantification of product ratios for bifurcating reactions by partitioning the kinetic energy distribution (KED) of the reactive mode of the shared transition state into chemically meaningful and well-defined fragments. A theoretical connection between KED with branching ratios was postulated and its validity was tested on a set of >60 bifurcating reactions. To expedite the application of the method, a program (rmcf.py) to perform the RMCF analysis on transition states calculated with the Gaussian software is provided and complemented by a robust workflow to aid the partition any arbitrary (ambimodal) TS structure.Regarding its power, the RMCF analysis compares favorably with existing computational protocols designed to predict branching ratios, outperforming all tested alternatives in predicting major products and yielding comparable results to the best performing method reported so far, while requiring as input a single transition state connecting the reactant complex with the available product channels, complemented by qualitative information about the products of the bifurcation. The method proved to be capable of qualitatively correct predictions for 89% from a set of ca. 50 branching reactions presented in Fig. 1, yielding quantitative and semiquantitative (<10% and <20% deviations) for 52% and 71% of reactions, while providing an intuitive picture of the motion signatures responsible for the predicted ratios. The method can be applied in tandem with traditional transition state theory, to tackle reactions where statistical and nonstatistical steps occur sequentially, providing excellent agreement with experimental and MD results.
Our results also demonstrate that, despite the thermodynamic bias towards a given reactive channel, a linear-free energy relationship rationale is generally not applicable to anticipate the selectivity in bifurcating reactions, where atomic motion along the PES can override the post-TS curvature imprinted by different reaction driving forces. The success of the RMCF method under such circumstances pinpoints that the reactive mode of TS structures encodes sufficient information to reliably predict branching ratios at a fraction of the cost of MD simulations.
Overall, the RMCF protocol is a versatile tool for the prediction and understanding of bi- and multifurcating reactions. Considering its intuitive application to the analysis of chemical reactions, coupled to the ad libitum partition of transition states and the quantification of kinetic energy distributions within reactive modes that the method allows, we foresee that this study will foster the update of known reactions with yet unexplained facts and also aid in the understanding of novel and puzzling reaction mechanisms.
Data availability
The datasets supporting this article have been uploaded as part of the ESI.†Author contributions
The manuscript was written through contributions of all authors. All authors have given approval to the final version of the manuscript.Conflicts of interest
There are no conflicts to declare.Acknowledgements
The project was supported by the Grant Agency of the Czech Republic (Grant No. 21-10383S) and by The Ministry of Education, Youth and Sports from the Large Infrastructures for Research, Experimental Development and Innovations project ‘e-Infrastructure CZ – LM2018140’. We thank Barry Carpenter for his generosity in providing us the code for calculation of bifurcation ratios with the dynamic match approach. We also thank Jonathan Goodman and Sanha Lee for their helpful suggestions to calculate bifurcation product ratios using their ValleyRidge.py program. We also thank Santiago Alonso-Gil for his help in writing the Fortran subroutine included in the rmcf.py program.Notes and references
- Modern Physical Organic Chemistry, ed. E. V. Anslyn and D. A. Dougherty, University Science Books, Sausalito, CA, 2006 Search PubMed.
- J. L. Bao and D. G. Truhlar, Chem. Soc. Rev., 2017, 46, 7548–7596 RSC.
- D. H. Ess, S. E. Wheeler, R. G. Iafe, L. Xu, N. Çelebi-Ölçüm and K. N. Houk, Angew. Chem., Int. Ed., 2008, 47, 7592–7601 CrossRef CAS PubMed.
- J. Rehbein and B. K. Carpenter, Phys. Chem. Chem. Phys., 2011, 13, 20906–20922 RSC.
- S. R. Hare and D. J. Tantillo, Pure Appl. Chem., 2017, 89, 679–698 CAS.
- D. A. Singleton, C. Hang, M. J. Szymanski, M. P. Meyer, A. G. Leach, K. T. Kuwata, J. S. Chen, A. Greer, C. S. Foote and K. N. Houk, J. Am. Chem. Soc., 2003, 125, 1319–1328 CrossRef CAS PubMed.
- T. Bekele, C. F. Christian, M. A. Lipton and D. A. Singleton, J. Am. Chem. Soc., 2005, 127, 9216–9223 CrossRef CAS PubMed.
- A. E. Litovitz, I. Keresztes and B. K. Carpenter, J. Am. Chem. Soc., 2008, 130, 12085–12094 CrossRef CAS PubMed.
- D. R. Glowacki, S. P. Marsden and M. J. Pilling, J. Am. Chem. Soc., 2009, 131, 13896–13897 CrossRef CAS PubMed.
- Z. Wang, J. S. Hirschi and D. A. Singleton, Angew. Chem., Int. Ed., 2009, 48, 9156–9159 CrossRef CAS PubMed.
- A. Patel, Z. Chen, Z. Yang, O. Gutierrez, H. Liu, K. N. Houk and D. A. Singleton, J. Am. Chem. Soc., 2016, 138, 3631–3634 CrossRef CAS PubMed.
- D. J. Pasto, K. Garves and M. P. Serve, J. Org. Chem., 1967, 32, 774–778 CrossRef CAS.
- S. R. Hare, A. Li and D. J. Tantillo, Chem. Sci., 2018, 9, 8937–8945 RSC.
- Y. J. Hong and D. J. Tantillo, Org. Biomol. Chem., 2010, 8, 4589–4600 RSC.
- E. L. Noey, X. Wang and K. N. Houk, J. Org. Chem., 2011, 76, 3477–3483 CrossRef CAS PubMed.
- Y. J. Hong and D. J. Tantillo, Nat. Chem., 2014, 6, 104–111 CrossRef CAS PubMed.
- S. J. Ang, W. Wang, D. Schwalbe-Koda, S. Axelrod and R. Gómez-Bombarelli, Chem, 2021, 7, 738–751 CAS.
- S. R. Hare, R. P. Pemberton and D. J. Tantillo, J. Am. Chem. Soc., 2017, 139, 7485–7493 CrossRef CAS PubMed.
- T. H. Peterson and B. K. Carpenter, J. Am. Chem. Soc., 1992, 114, 766–767 CrossRef CAS.
- Z. Yang, X. Dong, Y. Yu, P. Yu, Y. Li, C. Jamieson and K. N. Houk, J. Am. Chem. Soc., 2018, 140, 3061–3067 CrossRef CAS PubMed.
- B. Li, Y. Li, Y. Dang and K. N. Houk, ACS Catal., 2021, 11, 6816–6824 CrossRef CAS.
- H. Zhang, A. J. E. Novak, C. S. Jamieson, X.-S. Xue, S. Chen, D. Trauner and K. N. Houk, J. Am. Chem. Soc., 2021, 143, 6601–6608 CrossRef CAS PubMed.
- C. S. Jamieson, A. Sengupta and K. N. Houk, J. Am. Chem. Soc., 2021, 143, 3918–3926 CrossRef CAS PubMed.
- S. Lee and J. M. Goodman, J. Am. Chem. Soc., 2020, 142, 9210–9219 CrossRef CAS PubMed.
- S. Lee and J. M. Goodman, Org. Biomol. Chem., 2021, 19, 3940–3947 RSC.
- M. Maldonado-Domínguez, D. Bím, R. Fučík, R. Čurík and M. Srnec, Phys. Chem. Chem. Phys., 2019, 21, 24912–24918 RSC.
- M. Maldonado-Domínguez and M. Srnec, J. Am. Chem. Soc., 2020, 142, 3947–3958 CrossRef PubMed.
- A. D. Becke, J. Chem. Phys., 1993, 98, 5648–5652 CrossRef CAS.
- F. Weigend and R. Alhrichs, Phys. Chem. Chem. Phys., 2005, 7, 3297–3305 RSC.
- F. Weigend, Phys. Chem. Chem. Phys., 2006, 8, 1057–1065 RSC.
- S. Grimme, J. Antony, S. Ehrlich and H. Krieg, J. Chem. Phys., 2010, 132, 154104 CrossRef PubMed.
- M. Cossi, N. Rega, G. Scalmani and V. Barone, J. Comput. Chem., 2003, 24, 669–681 CrossRef CAS PubMed.
- J. D. Chai and M. Head-Gordon, Phys. Chem. Chem. Phys., 2008, 10, 6615–6620 RSC.
- C. Adamo and V. Barone, J. Chem. Phys., 1998, 108, 664–675 CrossRef CAS.
- M. M. Francl, W. J. Pietro and W. J. Hehre, J. Chem. Phys., 1982, 77, 3654–3665 CrossRef CAS.
- M. Linder and T. Brinck, Phys. Chem. Chem. Phys., 2013, 15, 5108–5114 RSC.
- B. R. Ussing, C. Hang and D. A. Singleton, J. Am. Chem. Soc., 2006, 128, 7594–7607 CrossRef CAS PubMed.
- H. B. Schlegel, J. M. Millam, S. S. Iyengar, G. A. Voth, G. E. Scuseria, A. D. Daniels and M. J. Frisch, J. Chem. Phys., 2001, 114, 9758–9763 CrossRef CAS.
- M. J. Frisch, G. W. Trucks, H. B. Schlegel, G. E. Scuseria, M. A. Robb, J. R. Cheeseman, G. Scalmani, V. Barone, G. A. Petersson, H. Nakatsuji, X. Li, M. Caricato, A. V. Marenich, J. Bloino, B. G. Janesko, R. Gomperts, B. Mennucci, H. P. Hratchian, J. V. Ortiz, A. F. Izmaylov, J. L. Sonnenberg, D. Williams-Young, F. Ding, F. Lipparini, F. Egidi, J. Goings, B. Peng, A. Petrone, T. Henderson, D. Ranasinghe, V. G. Zakrzewski, J. Gao, N. Rega, G. Zheng, W. Liang, M. Hada, M. Ehara, K. Toyota, R. Fukuda, J. Hasegawa, M. Ishida, T. Nakajima, Y. Honda, O. Kitao, H. Nakai, T. Vreven, K. Throssell, J. A. Montgomery, Jr, J. E. Peralta, F. Ogliaro, M. J. Bearpark, J. J. Heyd, E. N. Brothers, K. N. Kudin, V. N. Staroverov, T. A. Keith, R. Kobayashi, J. Normand, K. Raghavachari, A. P. Rendell, J. C. Burant, S. S. Iyengar, J. Tomasi, M. Cossi, J. M. Millam, M. Klene, C. Adamo, R. Cammi, J. W. Ochterski, R. L. Martin, K. Morokuma, O. Farkas, J. B. Foresman and D. J. Fox, Gaussian 16, Revision B.01, Gaussian, Inc., Wallingford CT, 2016 Search PubMed.
- H. Kikouchi and D. A. Singleton, Nat. Chem., 2018, 10, 237–241 CrossRef PubMed.
- L. M. M. Quijano and D. A. Singleton, J. Am. Chem. Soc., 2011, 133, 13824–13827 CrossRef CAS PubMed.
- C. Doubleday and W. L. Hase, J. Phys. Chem. A, 1998, 102, 3648–3658 CrossRef CAS.
- S. Hanessian and P. Compain, Tetrahedron, 2002, 58, 6521–6529 CrossRef CAS.
- S. E. Denmark, B. S. Kesler and Y. C. Moon, J. Org. Chem., 1992, 57, 4912–4924 CrossRef CAS.
- N. Çelebi-Ölçüm, D. H. Ess, V. Aviyente and K. N. Houk, J. Am. Chem. Soc., 2007, 129, 4528–4529 CrossRef PubMed.
- J. Limanto, K. S. Khuong and K. N. Houk, J. Am. Chem. Soc., 2003, 125, 16310–16321 CrossRef CAS PubMed.
- M. Harmata and M. G. Gomes, Eur. J. Org. Chem., 2006, 2273–2277 CrossRef CAS.
- J. B. Thomas, J. R. Waas, M. Harmata and D. A. Singleton, J. Am. Chem. Soc., 2008, 130, 14544–14555 CrossRef CAS PubMed.
- Z. Wang, J. S. Hirschi and D. A. Singleton, Angew. Chem., Int. Ed., 2009, 48, 9156–9159 CrossRef CAS PubMed.
- M. Schmittel, M. Keller, S. Kiau and M. Strittmatter, Chem.–Eur. J., 1997, 3, 807–816 CrossRef CAS.
- S. Yamabe, T. Dai, T. Minato, T. Machiguchi and T. Hasegawa, J. Am. Chem. Soc., 1996, 118, 6518–6519 CrossRef CAS.
- P. Yu, T. Q. Chen, Z. Yang, C. Q. He, A. Patel, Y. H. Lam, C. Y. Liu and K. N. Houk, J. Am. Chem. Soc., 2017, 139, 8251–8258 CrossRef CAS PubMed.
- S. Chen, P. Yu and K. N. Houk, J. Am. Chem. Soc., 2018, 140, 18124–18131 CrossRef CAS PubMed.
- M. Ohashi, F. Liu, Y. Hai, M. Chen, M. C. Tang, Z. Yang, M. Sato, K. Watanabe, K. N. Houk and Y. Tang, Nature, 2017, 549, 502–506 CrossRef PubMed.
- R. Villar López, O. N. Faza and C. Silva López, J. Org. Chem., 2017, 82, 4758–4765 CrossRef PubMed.
- L. Ye, Y. Wang, D. H. Aue and L. Zhang, J. Am. Chem. Soc., 2012, 134, 31–34 CrossRef CAS PubMed.
- R. B. Campos and D. J. Tantillo, Chem, 2019, 5, 227–236 CAS.
- T. Katori, S. Itoh, M. Sato and H. Yamataka, J. Am. Chem. Soc., 2010, 132, 3413–3422 CrossRef CAS PubMed.
- N. Mandal and A. Datta, J. Phys. Chem. B, 2018, 122, 1239–1244 CrossRef CAS PubMed.
- D. T. Major and M. Weitman, J. Am. Chem. Soc., 2012, 134, 19454–19462 CrossRef CAS PubMed.
- X. S. Bogle and D. A. Singleton, Org. Lett., 2012, 14, 2528–2531 CrossRef CAS PubMed.
- B. K. Carpenter, Angew. Chem., Int. Ed., 1998, 37, 3340–3350 CrossRef PubMed.
- M. Khrapunovich, E. Zelenova, L. Seu, A. N. Sabo, A. Flatherty and D. C. Merrer, J. Org. Chem., 2007, 72, 7574–7580 CrossRef CAS PubMed.
- S. Itoh, N. Yoshimura, M. Sato and H. Yamataka, J. Org. Chem., 2011, 76, 8294–8299 CrossRef CAS PubMed.
- C. S. Jamieson, A. Sengupta and K. N. Houk, J. Am. Chem. Soc., 2021, 143, 3918–3926 CrossRef CAS PubMed.
- D. C. Merrer and P. R. Rablen, J. Org. Chem., 2005, 70, 1630–1635 CrossRef CAS PubMed.
- M. Khrapunovich, E. Zelenova, L. Seu, A. N. Sabo, A. Flaherty and D. C. Merrer, J. Org. Chem., 2007, 72, 7574–7580 CrossRef CAS PubMed.
- Y. J. Hong and D. J. Tantillo, Nat. Chem., 2014, 6, 104–111 CrossRef CAS PubMed.
- E. L. Noey, Z. Yang, Y. Li, H. Yu, R. N. Richey, J. M. Merritt, D. P. Kjell and K. N. Houk, J. Org. Chem., 2017, 82, 5904–5909 CrossRef CAS PubMed.
- H. J. Kim, M. W. Ruszczycky, S. H. Choi, Y. N. Liu and H. W. Liu, Nature, 2011, 473, 109–112 CrossRef CAS PubMed.
- X. S. Xue, C. S. Jamieson, M. García-Borrás, X. Dong, Z. Yang and K. N. Houk, J. Am. Chem. Soc., 2019, 141, 1217–1221 CrossRef CAS PubMed.
- C. Y. Liu and S. T. Ding, J. Org. Chem., 1992, 57, 4539–4544 CrossRef CAS.
- C. Y. Liu, S. T. Ding, S. Y. Chen, C. Y. You and H. Y. Shie, J. Org. Chem., 1993, 58, 1628–1630 CrossRef CAS.
- S. Itoh, N. Yoshimura, M. Sato and H. Yamataka, J. Org. Chem., 2011, 76, 8294–8299 CrossRef CAS PubMed.
- B. C. Sweeny, H. Pan, A. Kassem, J. C. Sawyer, S. G. Ard, N. S. Shuman, A. A. Viggiano, S. Brickel, O. T. Unke, M. Upadhyay and M. Meuwly, Phys. Chem. Chem. Phys., 2020, 22, 8913–8923 RSC.
Footnotes |
| † Electronic supplementary information (ESI) available. See DOI: 10.1039/d1sc02826j |
| ‡ These authors contributed equally. |
| § Experiments and simulations complement each other in this context. In case of reactions 1 and 2, where low free energy barriers might facilitate product interconversion, we carried out MD to ascertain the reported experimental values. These results can be found in Fig. S2.† A relevant example of the limitation of MD simulations and the importance of experiments is reaction 34, where only product PA is obtained experimentally yet the reported ratio from MD is 72%. The authors admit (ref. 44) that the ratio is preliminary since only 29 trajectories were productive. The RMCF method predicts a 98% ratio of PA, in good agreement with the experiment, yet we used the reported MD result for comparison with Goodman's protocol. |
| This journal is © The Royal Society of Chemistry 2021 |

