
 Open Access Article
 This Open Access Article is licensed under a Creative Commons Attribution-Non Commercial 3.0 Unported Licence
Predicting potentially hazardous chemical reactions using an explainable neural network†
Juhwan
Kim‡
a,
Geun Ho
Gu‡
a,
Juhwan
Noh‡
 a,
Seongun
Kim
b,
Suji
Gim
c,
Jaesik
Choi
*b and
Yousung
Jung
*a
a,
Seongun
Kim
b,
Suji
Gim
c,
Jaesik
Choi
*b and
Yousung
Jung
*a
aDepartment of Chemical and Biomolecular Engineering (BK21 four), Korea Advanced Institute of Science and Technology (KAIST), Daejeon 34141, Republic of Korea. E-mail: ysjn@kaist.ac.kr
bGraduate School of Artificial Intelligence, KAIST Daejeon: 291 Daehak-ro, N24, Yuseong-gu, Daejeon 34141, Republic of Korea. E-mail: jaesik.choi@kaist.ac.kr
cEnvironment & Safety Research Center, Samsung Electronics Co., 1, Samsungjeonja-ro, Hwasung-si, Gyeonggi-do, Republic of Korea
First published on 13th July 2021
Abstract
Predicting potentially dangerous chemical reactions is a critical task for laboratory safety. However, a traditional experimental investigation of reaction conditions for possible hazardous or explosive byproducts entails substantial time and cost, for which machine learning prediction could accelerate the process and help detailed experimental investigations. Several machine learning models have been developed which allow the prediction of major chemical reaction products with reasonable accuracy. However, these methods may not present sufficiently high accuracy for the prediction of hazardous products which particularly requires a low false negative result for laboratory safety in order not to miss any dangerous reactions. In this work, we propose an explainable artificial intelligence model that can predict the formation of hazardous reaction products in a binary classification fashion. The reactant molecules are transformed into substructure-encoded fingerprints and then fed into a convolutional neural network to make the binary decision of the chemical reaction. The proposed model shows a false negative rate of 0.09, which can be compared with 0.47–0.66 using the existing main product prediction models. To provide explanations for what substructures of the given reactant molecules are important to make a decision for target hazardous product formation, we apply an input attribution method, layer-wise relevance propagation, which computes the contributions of individual inputs per input data. The computed attributions indeed match some of the existing chemical intuitions and mechanisms, and also offer a way to analyze possible data-imbalance issues of the current predictions based on relatively small positive datasets. We expect that the proposed hazardous product prediction model will be complementary to existing main product prediction models and experimental investigations.
Introduction
Chemical reactions comprise a complex network of elementary reactions between molecules. While the chemical process is designed by carefully constructing the reaction network, investigating uncharted reaction conditions entails risks in formation of toxic or explosive materials. Thus, understanding and potentially predicting the toxicity of reaction conditions and byproducts in advance can be invaluable in the safety of laboratories.Conventionally, numerous experiments are performed to assess the reaction network in the reaction environment. However, the time and cost for experimental reaction investigations for possible safety issues are high. The advances of algorithmic analysis in computational sciences have led to several methods that can enumerate the reaction network and predict possible intermediates and products. Methods such as CAMEO,1 EROS,2 IGOR,3 SOPHIA,4 and Robia5 use heuristically designed reaction templates and are repeatedly applied to enumerate the reaction network. A more recently developed Reaction Mechanism Generator (RMG)6 uses elementary reaction templates trying to eliminate the heuristic component of the reaction network generation. However, most of these models require human-encoded knowledge in the target reaction network (i.e. elementary reaction templates associated with the target reaction) and are sometimes marginally extrapolated to unknown chemical space.
On the other hand, matrix-based models7–9 use mainly density functional theory (DFT) calculations to assess the reaction network without significant prior knowledge. These models produce possible chemical reaction paths through mathematical transformations of the graph theory representation of molecules. By combining empirical chemical intuitions such as octet rules and the elemental valence, chemically valid reaction networks can be enumerated, the paths of which are assessed by DFT calculations. Despite the successful proof of demonstration for the chosen applications, the major bottleneck of these methods is that DFT calculations are still too computationally expensive to explore every path plausible.
Another exhaustive reaction path and product prediction method based on electronic structure calculations is the work of Maeda and co-workers.10–12 In their approach, a scaled hypersphere around the initial reactants is defined to optimize the molecular structure along the reaction path. Various radii of the hypersphere can be used to find the appropriate transition states and the corresponding paths, and bimolecular reactions can also be considered by applying an artificial force between the two reactants. While the method can be applied to an arbitrary chemical reaction with promising accuracy (hence potentially usable for toxin predictions, the focus of this work), the current drawback is, again, a very high cost of quantum chemical calculations for numerous saddle point searches.
Incorporating machine learning methods in enumerating reaction networks can thus enable fast and accurate prediction of reaction products. For example, the template-based machine learning model of Coley and coworkers13 automatically learns the reaction conditions associated with each template and predicts product candidates. The machine learning model is significantly faster than the methods discussed above, and is also shown to achieve an accuracy higher than 90% in the top-5 predicted products. Some drawbacks include the fact that the templates are based on prior knowledge,14 and reactions that did not exist in the dataset cannot be predicted.
In addressing the latter limitations of template-based models, template-free models have also been developed, including the graph convolution model (GNN)15,16 and Molecular Transformer (MT) model.17 The graph convolution model directly identifies five chemical bonds that would most likely undergo transformation. The generated product candidates are ranked by a scoring neural network. This model results in 93.4% accuracy for the top-5 candidates. The molecular transformer model adapts the attention-only neural translator model18 to translate reactant SMILES19 into product SMILES, similar to a language translation task. The molecular transformer's accuracy is 95.8% in the top-5 candidates.
While these data-driven product prediction models have yielded very reasonable accuracy to predict the main products, these methods may not be suitable for predicting the dangerous reactions since the laboratory safety requires a particularly low false negative prediction rate in order not to miss any toxin- or explosive molecule-forming reactions. In this work, we propose a machine learning model that can predict the formation of the target toxins or explosive substructures in a binary decision. The proposed binary classification model with fingerprint representations of molecules and reactions yields a significantly lower false negative rate (0.09) than those of the existing product prediction models (0.47–0.66). To further understand the decision making process of the convolutional neural network, we implemented an input attribution method, Layer-wise Relevance Propagation (LRP),20 which provides reasonable explanations for the formation of hazardous reaction products that are consistent with usual chemical intuitions.
Methods
Data
We use the chemical reaction data extracted from the USPTO (United States Patent and Trademark Office) by Lowe21,22 and Reaxys data from Elsevier.23 The USPTO reaction database includes about 3.8 million reactions in reaction SMILES format,19 and the Reaxys database includes about 49 million chemical reactions.23 As hazardous chemicals, we consider in this work toxins and potentially explosive molecules as defined below.The target toxins were taken from Toxic Release Inventory (TRI) 2018![[thin space (1/6-em)]](https://www.rsc.org/images/entities/char_2009.gif) 24) from the United States Environmental Protection Agency (EPA). TRI 2018 contains 694 molecules that can cause more than one of three conditions, cancer or other chronic human health effects, significant adverse acute human health effects, or significant adverse environmental effects.24 These toxins were converted to SMILES data by OPSIN,25,26 where 482 toxins were successfully converted into a valid SMILES string. We extracted the relevant positive reaction data from the USPTO and Reaxys database by a keyword search which involves the target toxins in the product list but not in the reactant list using rdkit.27 We then removed the duplicate reactions, reactions with more than 10 reactants, and reactions with elemental mismatch between the reactants and products. Among the 482 toxins, 17 toxins which have more than 100 positive data (i.e. reactions that produce the given toxin) are selected.
24) from the United States Environmental Protection Agency (EPA). TRI 2018 contains 694 molecules that can cause more than one of three conditions, cancer or other chronic human health effects, significant adverse acute human health effects, or significant adverse environmental effects.24 These toxins were converted to SMILES data by OPSIN,25,26 where 482 toxins were successfully converted into a valid SMILES string. We extracted the relevant positive reaction data from the USPTO and Reaxys database by a keyword search which involves the target toxins in the product list but not in the reactant list using rdkit.27 We then removed the duplicate reactions, reactions with more than 10 reactants, and reactions with elemental mismatch between the reactants and products. Among the 482 toxins, 17 toxins which have more than 100 positive data (i.e. reactions that produce the given toxin) are selected.
For explosive chemicals, while the EPA provides a list of explosive compounds,28 the number of data points that contain the particular explosive compound is too small for machines to learn its chemistry. Instead, therefore, 22 potentially explosive substructures taken from the safety data of EH&S and Division of Research Safety are used in this work.29,30 These substructures are defined to potentially cause a sudden release of pressure, gas, and heat when subjected to sudden shock, pressure, or high temperature.30 We used the top 8 potentially explosive substructures with the highest number of data points from the USPTO database.
The list of toxins and potentially explosive substructures considered in this work is summarized in Table 1. The potentially explosive substructures with the number of positive data points > 10000 were trimmed to 10000 by random selection.
| Toxins | Explosive substructures |
|---|---|
| Butyl acrylate (43) | *OO (258) |
| Ethylene oxide (91) | *OO* (270) |
| Acrylic acid (275) | *N![[double bond, length as m-dash]](https://www.rsc.org/images/entities/char_e001.gif) O (366) O (366) |
| Quinoline (328) | *NN* (590) |
| Cumene (335) | *NNN (3378) |
| Nitrobenzene (389) | *CNO (7940) |
| Sulfuric acid (709) | *C![[triple bond, length as m-dash]](https://www.rsc.org/images/entities/char_e002.gif) C* (10210) C* (10210) |
| Benzamide (712) | *CC* (38516) |
| Styrene (1054) | |
| Naphthalene (1142) | |
| Propene (1273) | |
| Cl (1618) | |
| Formaldehyde (2306) | |
| Phenol (2614) | |
| Acetophenone (2703) | |
| Ammonia (3126) | |
| Biphenyl (3165) |
Since both positive and negative data are necessary to train a binary classification model, we collected negative data that do not contain target hazardous materials in reactants or products from the USPTO reaction database. We then removed the too obvious negative reaction data where none of the chemical elements of the target compounds appear in the reactants since they can be judged easily even without machine learning. The 10000 reactions with the highest yields among the relevant negative reaction data are then finally chosen since they would have a smaller chance of byproduct formation which may be hazardous compounds considered in this study.
We split the data into test, validation, and training sets. Test and validation sets are first built by randomly selecting 10% of positive and negative data, and the remaining 80% is used for training. As the number of positive and negative data points are not balanced for some target compounds (see Table 1), we introduce a random oversampling approach which duplicates data in the minority class (i.e. positive data in this work) during training.31,32
Model
The fingerprint bit vector is used to represent the reactant molecules. The existence and absence of each substructure are represented by binary numbers 0 and 1 in each bit, respectively. Morgan fingerprinting33 is a widely used method to represent molecules that map a substructure bit to a vector of constant length. However, the number of fingerprints can become larger than the vector size, and one bit in the vector can involve multiple substructures, reducing the descriptor interpretability. Thus, we modified the Morgan fingerprinting algorithm to improve interpretability. For every data point in the training set, substructure SMARTS (SMILES arbitrary target specification)34 of radius 0 to 2 is extracted and built into a substructure library. To reduce the computational cost of training and avoid overfitting, the substructures that appear less than 5 times in the training data were removed. The number of substructures in the library becomes the length of the fingerprint vectors and the index of each substructure in the library becomes a bit in fingerprints (see Fig. 1a). The maximum number of reactants is ten; thus, for each reaction, the input descriptor matrix is , where NF is the number of substructures (e.g. NF = 6472 for the ammonia prediction model in this work). In addition to this modified Morgan fingerprint, other molecular representations including the SMILES string-based RNN model35 and MEGNet,36 one form of graph convolution based model, were also used as baseline models for comparison.
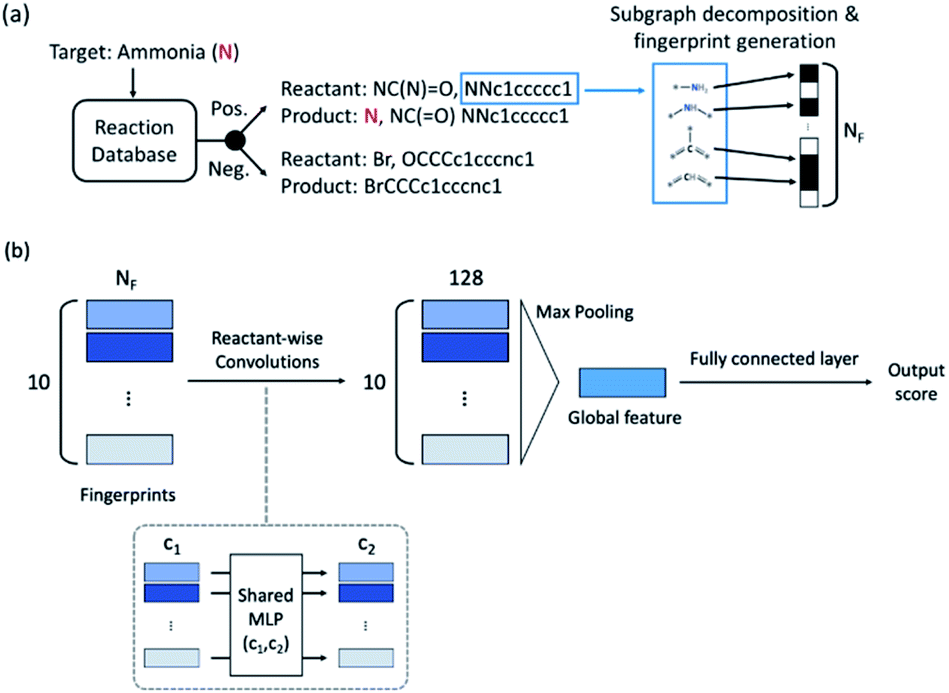 | ||
| Fig. 1 (a) Schematic of the positive and negative reaction extraction, and fingerprint representation of the reaction. (b) Fingerprint-based binary classification model architecture. Input fingerprints pass 2 convolutional layers of 256 and 128 channels with ReLU, max pooling and 2 fully connected layers of 128 and 64 channels with the sigmoid function. The final output is a number between 0 (normal) and 1 (toxic or explosive). | ||
The model architecture is shown in Fig. 1b. For each data point, a reactant-wise convolution, the same convolution operation used in PointNet,37 is performed with ReLU nonlinearity.38 After 2 convolution layers of 256 and 128 channels, max pooling is applied to ensure a permutation invariance in the reactant order (predicting the same result for different orders of reactants). Then 2 fully connected layers and the sigmoid function are applied to obtain an output between 0 (negative) and 1 (positive). The center value of 0.5 was set to a decision boundary. Pytorch39 was used for model implementation, and L2-regularization with strength of 0.01 was applied during training.
To compare the proposed binary model accuracy, we also benchmarked the GNN15 and MT17 models toward the prediction of hazardous materials in Table 1. For this purpose, we used the GNN as published15 without re-training the model with the toxin and explosive substructure data since most of these reaction data do not have a proper atom mapping between reactants and products needed in GNN. For the molecular transformer model, however, we used the published pre-trained model (pre-MT), and in addition we re-trained the model (denoted as re-MT) with the current set of hazardous compound data in Table 1.
Results and discussion
Model accuracy
While the product prediction models predict the chemical structures of potential products, the binary classification model predicts whether a particular target compound will be produced or not. To compare the performance of the product prediction and binary classification models, 2 product prediction models and 3 binary classification models were tested on the same dataset. The GNN top-n (n = 1, 10, 100) accuracy measures the probability that the target hazardous product would exist within the n highest-score-products. Two MT models, pre-MT and re-MT, were also tested as discussed in the Model section. Binary classification models considered here use three different descriptors, a modified Morgan fingerprint-based model, SMILES-based RNN binary prediction model, and molecular graph-based MEGNet model.The performance of the models is measured by three metrics: accuracy, false-positive rate, and false-negative rate. The accuracy, the most widely used performance metric, is the ratio of correct prediction (true positive and true negative) among all test data. Because of an imbalance between positive (minimum 43) and negative data (10000), the conventional accuracy is not sufficient to explain the performance of models. The false-positive rate is the rate of the wrong positive prediction among negative data, meaning that the model incorrectly predicts that target hazardous compounds will be produced when they are not hazardous. High false positive rates would cause extra expenses to investigate the corresponding reactions and take unnecessarily preventive actions. The false-negative rate, on the other hand, is the rate of the wrong negative predictions among positive data, meaning that the model incorrectly predicts that the target hazardous molecules will not be produced even though they actually yield potentially dangerous products. If the false negative rate is high, potentially dangerous reactions can be missed out which can cause critical accidents. Thus, false-negative rates can be thought of as the most important measure of the model performance for the prediction of hazardous materials.
The average performances are summarized and compared in Table 2. All models show relatively high overall average accuracy, due mostly to a large number of negative data points and low false-positive rates. For false-negative rates, however, the difference between product prediction models and binary classification models is clear; the false negative rates for GNN and MT models are relatively high, ranging between 0.47 and 0.83, and those for binary models range between 0.09 and 0.21. Thus, while the existing product prediction models are promising and applicable for general purpose main product predictions, they show clear limitations toward the prediction of hazardous materials. On the other hand, the binary classification models show low false negative rates. The fingerprint-based model, in particular, shows the lowest false negative rate, 0.093, among the tested models.
| Overall accuracy | False-positive | False-negative | |
|---|---|---|---|
| Product prediction | |||
| GNN top-1 | 0.902 | 0.011 | 0.805 |
| GNN top-10 | 0.910 | 0.034 | 0.622 |
| GNN top-100 | 0.885 | 0.087 | 0.472 |
| pre-MT | 0.899 | 0.003 | 0.832 |
| re-MT | 0.884 | 0.025 | 0.656 |
|
|||
| Binary classification | |||
| Fingerprints | 0.975 | 0.021 | 0.093 |
| RNN | 0.975 | 0.015 | 0.213 |
| MEGNet | 0.964 | 0.028 | 0.168 |
To find out whether the difference in performance between models originates from the difference of the model or the training data, the MT was re-trained with the same data that the binary classification models used. As one can expect, this retrained model, re-MT, achieved a lower false-negative ratio (0.66) than pre-MT (0.83). However, a false-negative rate of 0.66 of re-MT is still significantly higher than the 0.09 of the binary classification model, suggesting that binary classification models are more suitable to predict hazardous products than main product prediction models.
The overall performance in Table 2 is further decomposed into false-positive and negative rates of individual toxins and potentially explosive substructures in Fig. 2 and 3, respectively. The x-axis in Fig. 2 and 3 is sorted by the number of positive cases. The compounds on the left-side of the x-axis have a smaller number of positive reaction data points and molecules located on the right-side have a larger number of positive reaction data points. As the number of positive data points increases, the false-negative rate of binary classification models decreases for both toxins and potentially explosive substructures. We note that the pre-trained toxin prediction models (such as pre-MT) do not show such a systematic performance increase with the amount of data.
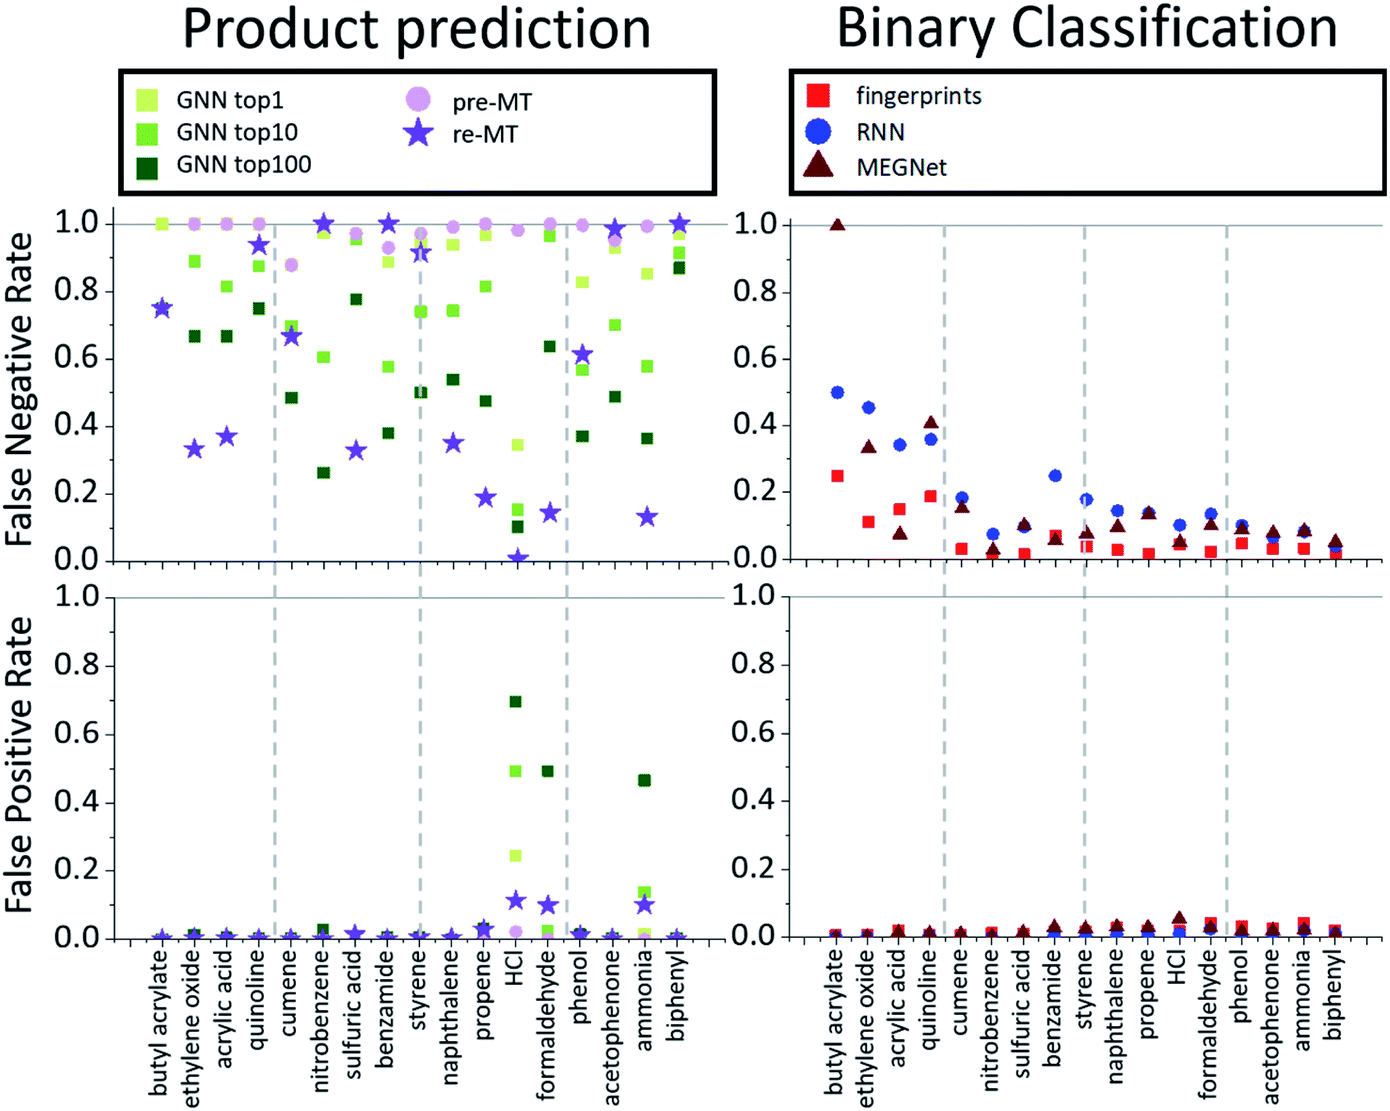 | ||
| Fig. 2 False negative (bottom two) and false positive rates (top two) for various models (product prediction models GNN and MT vs. binary classification models fingerprint, RNN and MEGNet) considered in this work for toxins. | ||
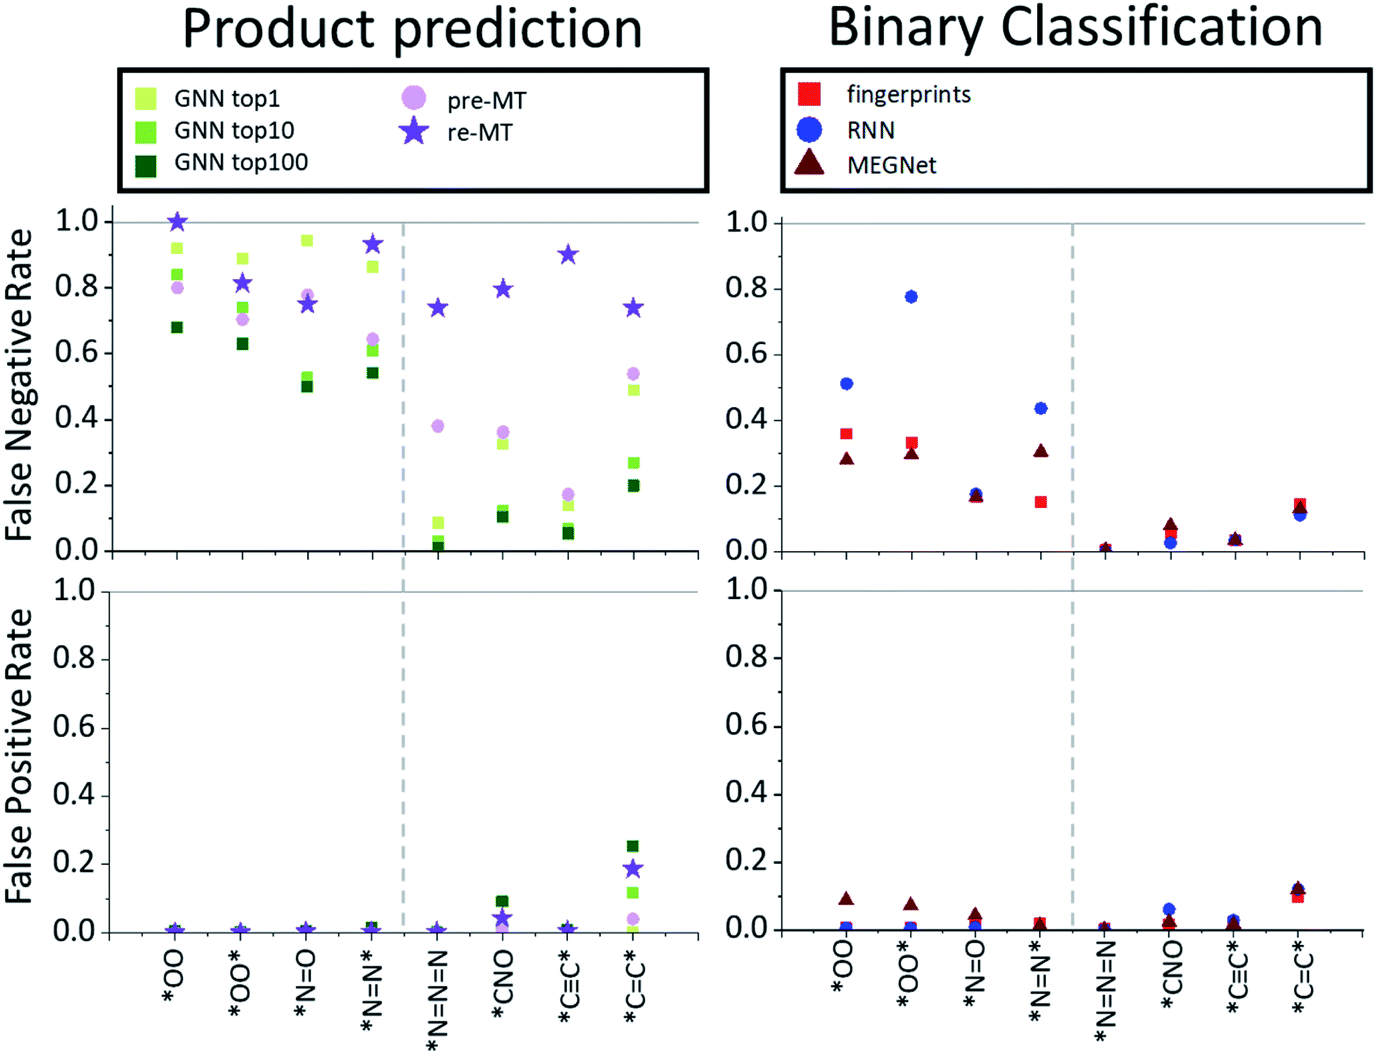 | ||
| Fig. 3 False negative (bottom two) and false positive rates (top two) for various models (product prediction models GNN and MT vs. binary classification models fingerprint, RNN and MEGNet) considered in this work for potentially explosive substructures. | ||
Interpretations using layer-wise relevance propagation (LRP)
In order to understand the decision making process of the neural network, we implemented an input attribution method, Layer-wise Relevance Propagation (LRP) for our fingerprint-based model. LRP was originally developed in image-based neural network models to determine each pixel's contribution to the final outcome of an image classification model. In this work, LRP computes the contribution of each fingerprint bit as calculated by backward propagation of the relevance (classification) score as shown in Fig. 4b.20 The sum of all contributions from neurons within the same layer is thus always the same as the classification score taken from forward prediction (see Fig. 4b). By this analysis, we attempt to gain insights into which chemical substructures of reactants are mainly responsible for the formation of toxins and explosive substructures (see Fig. 4c). | ||
| Fig. 4 (a) The proposed fingerprint-based binary classification model. (b) With layer-wise backward relevance propagation (LRP), the contribution of each substructure is calculated. (c) Substructures with higher contribution scores in the reactants are highlighted to gain chemical intuition for the toxin formation reaction. | ||
For quantitative understanding of the LRP scores, we first define a term, target reconstruction reaction. The latter is defined as a reaction in which the most highlighted (or contributed) fingerprint bit (substructure) in the reactant is part of the target toxins or potentially explosive molecules (see Fig. 5a). The target reconstruction ratio for a toxin is then the number of target reconstruction reactions out of all the reactions that produce a specific toxin, and similarly for an explosive substructure. According to the results summarized in Fig. 5b, the majority of the toxin-producing reactions correspond to target reconstruction in which the most highlighted reactant substructures are indeed part of the target hazardous compounds. For further analysis, we denote the toxins (or explosive substructures) with target reconstruction ratios > 0.5 as target reconstruction dominant toxins (or explosive substructures). With this definition, 14 toxins (out of 17) and 5 explosive substructures (out of 8) are target reconstruction dominant cases.
 | ||
| Fig. 5 (a) Schematic cartoon of the target reconstruction reaction in which the most highlighted (or contributed) substructure is part of the target. (b) Ratio of the target reconstruction reactions for the chosen toxins and explosive substructures. (c) The color-coded average contribution scores for atoms and bonds for all target reconstruction dominant toxin molecules. ① butyl acrylate, ② ethylene oxide, ③ acrylic acid, ④ quinoline, ⑤ cumene, ⑥ nitrobenzene, ⑦ sulfuric acid, ⑧ benzamide, ⑨ styrene, ⑩ naphthalene, ⑪ propene, ⑫ phenol, ⑬ acetophenone, ⑭ biphenyl. | ||
To understand which part of the toxins contributed the most to the positive predictions in target reconstruction dominant cases, we considered the average LRP contribution score for every atom and bond for the 14-target reconstruction dominant toxins (see Fig. 5c). That is, the LRP score of each substructure in the reactant fingerprint is projected onto atoms and bonds in the corresponding toxin product. The average contribution score of an atom (or bond) is computed by taking the average of the LRP scores of all substructures that contain that particular atom (or bond), then normalize it by the highest LRP score for that reaction. For all toxins that contain an aromatic ring, the aromatic rings show relatively high contribution scores compared to the other parts, indicating the latter ring-type substructures in the reactants are essential, not surprisingly, to generate aromatic-containing target toxins. It also implies the stability of aromatic rings that are mostly retained under most reaction conditions. However, since these most highlighted target reconstruction units cannot alone produce the toxins (for example, for phenol, one needs a hydroxyl group in the reactant, in addition to the most highlighted benzene ring, to form the target toxin), we statistically analyzed the remaining substructures not present in the target toxin with high LRP scores in Fig. 6. We present the results for benzamide (#8 in Fig. 5c) and phenol (#12 in Fig. 5c). For benzamide in Fig. 6a, the two most highlighted substructures in SMILES format (which are not part of the toxin's substructure) are c1(C(O)N*)cc:*:cc1 (29.0% among positive predictions) and N(*)* (23.2% among positive predictions), whose chemical structures are shown in Fig. 6. For phenol in Fig. 6b, c1cc:*:cc1O* (51.6% among positive predictions) and O(*)* (14.5% among positive predictions) are the two most highlighted substructures that are not part of the target toxin. These substructures can be transformed into low-scored substructures in target toxins.
 | ||
| Fig. 6 (a and b) Plots of the average contribution score of benzamide and phenol and most highlighted substructures except the target reconstruction substructure. The ratio of the most non-target reconstruction substructure among every positive prediction. | ||
Some other small molecule toxins such as ammonia and HCl are already undecomposable unique substructures by themselves within our fingerprint representation (ammonia = N and HCl = Cl). For these toxins, we analyzed the substructures that have a higher LRP score than the hypothetical equally distributed LRP score (i.e., final classification score divided by the number of substructures), which we denote as positively contributing substructures. For example, in Fig. 7a, four most frequently appearing positively contributing substructures for ammonia production are depicted. These four substructures correspond to a well-known ammonia formation from urea if NH2 is attached to any heavy atom site * of the substructure. We discuss the result of LRP analysis for ammonia formation further in the Limitations section below. Another example is the formation of the *–NO substructure. As shown in Fig. 7b, oxidation of the –OH group with the *–N* substructure leads to the formation of *–NO.
 | ||
| Fig. 7 The statistical LRP analysis for (a) ammonia production reactions and (b) *–NO production reactions. The numbers refer to the percentage of each substructure which contributes positively (i.e., whose LRP scores are higher than the final classification score divided by the total number of substructures) to the hazardous material formation (also see the main text). | ||
Limitations and opportunities
We performed target reconstruction-based analysis on several toxins. However, for the explosive substructures, the molecular size of the explosive substructures is too small to perform meaningful analysis. In this work, all reactions in which the target explosive substructure already exists in the reactants were removed for meaningful training. Therefore, the target reconstruction ratio is only defined using the remaining substructures. The remaining substructures are often too small in number for explosive substructures. For example, *NN* has only one substructure (*N*) that is not identical to the target *NN*, thus the average contribution score for each atom and bond cannot be calculated. Therefore, for small toxins such as ammonia and hydrogen chloride and potentially explosive substructures, the target reconstruction-based analysis such as in Fig. 5c is not feasible. Despite this limitation in performing target reconstruction analysis for simple molecules with one heavy atom and explosive substructures, one can still get a valid chemical intuition on the importance of the highlighted substructures by analyzing the hazardous materials case-by-case as shown in Fig. 7a and b.
We note that not every high-scored substructure can be derived from the known reaction mechanisms and some predictions and their interpretations are not chemically intuitive. These cases arise due likely to a data imbalance in which the machine makes a decision based on the observation that simply a particular substructure appears frequently in positive data but rarely in negative data, not necessarily based on chemical principles. For example, the second most frequently highlighted substructure for the *–NO prediction model is [B–](F)(F)(F)F (simply, BF4). The BF4 substructure is contained in 86 reactions among positive reaction data (about 29% of positive data) but is contained in only 5 reactions among negative data (only 0.005% of negative data). The substructure is highlighted maybe because BF4 does play an important role in the formation of *–NO, or just due to data imbalance. These cases cannot be distinguished only with the model itself, and demonstrate the importance of the data to further improve the model.
To further understand how much data imbalance affected the model, we performed additional analysis. We first calculated, for every substructure for a given toxin database, the ratio of the given substructure occurrence in the positive training data to that in the negative data, and if this ratio is more than 5:1 (i.e. the given substructure is observed 5 times or more in the positive training data than in the negative data), we define that the corresponding substructure may have a potential data-imbalance issue. Next, the prediction of a given toxin formation for a chosen chemical reaction is said to be “a potentially biased prediction by data-imbalance” if the LRP analysis of a given prediction yields the data-imbalanced substructure as the most highlighted substructure. We denote them as “potentially” biased prediction by data-imbalance since the two possibilities of chemically meaningful prediction vs. data-biased prediction may be difficult to distinguish solely by considering the data-imbalance ratio.
Fig. 8 shows the percentage of potentially biased predictions by data-imbalance for each of the toxins and explosive substructures. It is notable that most predictions for all toxins are not biased due to data-imbalance. In fact, statistically, we find that the substructures without data-imbalance were identified by LRP as the most important factors for 98.9% of all predictions in the test datasets of toxin formation, and this percentage remains at 98.6% even if the definition of data-imbalance is set more aggressively down to positive:negative = 2:1 (ESI†).
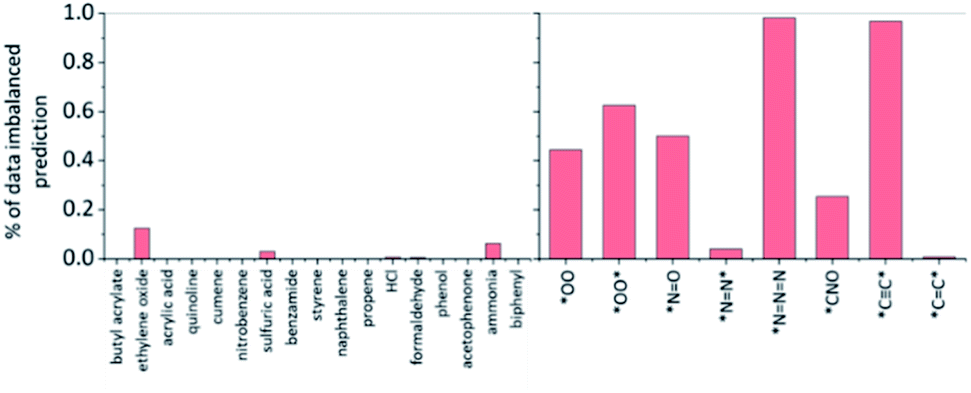 | ||
| Fig. 8 The percentage of the potentially biased predictions by data-imbalance for the chosen toxins and explosive substructures identified by the LRP analysis. The substructure is defined to have potential data imbalance if the ratio of the given substructure occurrence in the positive training data to that in the negative data is more than 5:1. See the ESI† for additional analysis using the positive:negative = 2:1 ratio as a data-imbalance criterion. | ||
On the other hand, for explosive substructures, except for *NN* and *CC*, the prediction of other explosive substructures may have been potentially biased from the data-imbalance with the positive:negative data ratio of 5:1 or more. This high data-imbalance ratio for explosive substructures seems to be related to the simple chemical formula of most explosive substructures (such as *CC*, *NNN, etc.). That is, the latter simple explosive substructures are mostly part of the reactants already in the form of their slight variations, rather than newly formed from reactions. For example, HC* (where * means any heavy atoms) is the most frequently highlighted substructure for the *CC* prediction model because 96% of the reactions that produce *CC* in the USPTO database do not newly form the CC triple bond but generate *CC* by substituting H in HC* with another heavy atom. In another example, [N–][N+] [N–] (azide anion) is the most frequently highlighted substructure for the *NNN prediction model, and we find that 98% of the reactions which produce *NNN include sodium azide (NaN3) as a reactant. For these cases, one may conclude that the predictions are heavily affected by data-imbalance, but it might also be possible to interpret it as, based on LRP, the prediction may still be chemically sensible (C* leading to a *CC* or azide group in the reactants leading to *NNN).
Related to a potential data-imbalance issue, we make a further note on the case of ammonia production. For NH3 data, we note that all negative data that do not include N in the reactants have been removed since it is too obvious that reactants without N would not produce NH3. With this in mind, the most frequently highlighted substructure analyzed by LRP is *O. The substructure occurrent counting shows that there are 1222 reactions in the positive training data that contain *O in the reactants while there are 5754 reactions in the negative training data which contain *O in the reactants. That is, the NH3 prediction model is not data-imbalanced (quite the opposite), and the *O analyzed to be the important substructure for ammonia formation suggests that the *O in the reactant would lead to the NH3 formation only in the presence of other functional groups such as *–NH2, for example, as in Fig. 7a. The fact that most (96%) of the latter 5754 negative reactions are still predicted not to produce NH3 (even if they include *O) indicates that the model did not simply memorize data imbalance, and the decision derived from the model is indeed the result of learning the correlation with other reactant substructures included in the dataset.
Our work may be used in combination with generative models such that the generated molecules do not contain toxins or explosive substructures. In the literature, individual units of generative models which are in charge of making visual units were revealed.40 However, it is not explicitly studied which units in the generative models are in charge of generating molecules with toxic or explosive effects, and such an extension would be an interesting subject of future study. We also note that the proposed model is not restricted to the prediction of toxins or hazardous compounds, but can be extended to the prediction of general molecules or substructures of interest when sufficient amount of data is available. LRP would then offer an explanation to clarify the chemistry of the particular molecular formation that can complement the existing expert intuitions.
Conclusions
We have implemented a fingerprint-based binary reaction classification model to predict the formation of a given hazardous product. By focusing on the formation possibility of one target, our model can predict the formation of toxins with greater accuracy. The present binary classification model achieves a significantly lower false negative rate of 0.09 than those (0.47–0.66) of previously reported broad product prediction models. The developed model is analyzed using an input attribution method, layer-wise relevance propagation, to chemically understand the decision making process. The most important substructures of the reactants that are responsible for the formation of the given toxins are identified by decomposing the final classification scores into a sum of contributions from all substructures representing the reactants. The latter analysis reproduces some common prior knowledge on chemical reaction mechanisms. We expect that the current fingerprint-based binary classification approach for hazardous compounds could be complementary to the existing universal main reaction product prediction models to explore the chemical reaction space oriented towards a particular target formation.Data availability
The reaction data used in this research, fingerprint based model, and the LRP analysis code are available at https://github.com/kaist-amsg/HazardousPredetection.Author contributions
Juhwan Kim – data curation, formal analysis, investigation, methodology, software, validation, visualization, writing – original draft. Geun Ho Gu – methodology, software, validation, writing – review & editing. Juhwan Noh – data curation, software, validation, visualization, writing – review & editing. Seongun Kim – software. Suji Gim – discussion. Jaesik Choi – writing – review & editing, funding acquisition, supervision. Yousung Jung – conceptualization, writing – review & editing, funding acquisition, resources, supervision.Conflicts of interest
There are no conflicts to declare.Acknowledgements
We acknowledge the financial support from Samsung Electronics. J. C. acknowledges the support from the AI+X project from KAIST.References
- T. D. Salatin and W. L. Jorgensen, J. Org. Chem., 1980, 45, 2043–2051 CrossRef CAS.
- J. Gasteiger, M. G. Hutchings, B. Christoph, L. Gann, C. Hiller, P. Löw, M. Marsili, H. Saller and K. Yuki, in Organic Synthesis, Reactions and Mechanisms, Springer, 1987, pp. 19–73 Search PubMed.
- I. Ugi, J. Bauer, K. Bley, A. Dengler, A. Dietz, E. Fontain, B. Gruber, R. Herges, M. Knauer and K. Reitsam, Angew. Chem., Int. Ed., 1993, 32, 201–227 CrossRef.
- H. Satoh and K. Funatsu, J. Chem. Inf. Comput. Sci., 1995, 35, 34–44 CrossRef CAS.
- I. M. Socorro, K. Taylor and J. M. Goodman, Org. Lett., 2005, 7, 3541–3544 CrossRef CAS PubMed.
- C. W. Gao, J. W. Allen, W. H. Green and R. H. West, Comput. Phys. Commun., 2016, 203, 212–225 CrossRef CAS.
- Y. V. Suleimanov and W. H. Green, J. Chem. Theory Comput., 2015, 11, 4248–4259 CrossRef CAS PubMed.
- Y. Kim, J. W. Kim, Z. Kim and W. Y. Kim, Chem. Sci., 2018, 9, 825–835 RSC.
- J. W. Kim, Y. Kim, K. Y. Baek, K. Lee and W. Y. Kim, J. Phys. Chem. A, 2019, 123, 4796–4805 CrossRef CAS PubMed.
- K. Ohno and S. Maeda, J. Phys. Chem. A, 2006, 110, 8933–8941 CrossRef CAS PubMed.
- S. Maeda and K. Morokuma, J. Chem. Theory Comput., 2011, 7, 2335–2345 CrossRef CAS PubMed.
- S. Maeda, K. Ohno and K. Morokuma, Phys. Chem. Chem. Phys., 2013, 15, 3683–3701 RSC.
- C. W. Coley, R. Barzilay, T. S. Jaakkola, W. H. Green and K. F. Jensen, ACS Cent. Sci., 2017, 3, 434–443 CrossRef CAS PubMed.
- D. Fooshee, A. Mood, E. Gutman, M. Tavakoli, G. Urban, F. Liu, N. Huynh, D. Van Vranken and P. Baldi, Mol. Syst. Des. Eng., 2018, 3, 442–452 RSC.
- C. W. Coley, W. Jin, L. Rogers, T. F. Jamison, T. S. Jaakkola, W. H. Green, R. Barzilay and K. F. Jensen, Chem. Sci., 2019, 10, 370–377 RSC.
- C. Coley, rexgen_direct, https://github.com/connorcoley/rexgen_direct, accessed 10/07/2020 Search PubMed.
- P. Schwaller, T. Laino, T. Gaudin, P. Bolgar, C. A. Hunter, C. Bekas and A. A. Lee, ACS Cent. Sci., 2019, 5, 1572–1583 CrossRef CAS PubMed.
- A. Vaswani, N. Shazeer, N. Parmar, J. Uszkoreit, L. Jones, A. N. Gomez, Ł. Kaiser and I. Polosukhin, CoRR, 2017, arXiv:1706.03762 Search PubMed.
- D. Weininger, J. Chem. Inf. Comput. Sci., 1988, 28, 31–36 CrossRef CAS.
- S. Bach, A. Binder, G. Montavon, F. Klauschen, K.-R. Müller and W. Samek, PLoS One, 2015, 10, e0130140 CrossRef PubMed.
- D. M. Lowe, Extraction of chemical structures and reactions from the literature, University of Cambridge, 2012, DOI:10.17863/CAM.16293.
- D. Lowe, Chemical reactions from US patents, 1976–Sep 2016, https://figshare.com/articles/Chemical_reactions_from_US_patents_1976-Sep2016_/5104873, accessed 09/17/2020.
- Elsevier, reaxys, https://www.reaxys.com/#/, accessed 09/17/2020 Search PubMed.
- UnitedStatesEnvironmentalProtectionAgency, TRI-Listed Chemicals, https://www.epa.gov/toxics-release-inventory-tri-program/tri-listed-chemicals, accessed 09/17/2020 Search PubMed.
- D. M. Lowe, P. T. Corbett, P. Murray-Rust and R. C. Glen, J. Chem. Inf. Model., 2011, 51(3), 739–753 CrossRef CAS PubMed.
- L. Daniel, OPSIN Information, https://opsin.ch.cam.ac.uk/information.html#references, accessed 09/17/2020 Search PubMed.
- rdkit, https://www.rdkit.org/, accessed 2020/09/17, 2020/09/17 Search PubMed.
- U. S. E. P. Agency, List of Explosive Chemicals, https://ofmpub.epa.gov/sor_internet/registry/substreg/searchandretrieve/searchbylist/search.do?search=%26searchCriteria.substanceList=221%26searchCriteria.substanceType=-1#list-details, accessed 09/17/2020 Search PubMed.
- jrrichar, Potentially Explosive Experiments, https://drs.illinois.edu/Page/SafetyLibrary/PotentiallyExplosiveExperiments, accessed 09/17/2020 Search PubMed.
- E. Health&Safety, Potentially Explosive Chemicals, https://www.ehs.ucsb.edu/labsafety-chp/sop/potentially-explosive-chemicals, accessed 09/17/2020 Search PubMed.
- N. Japkowicz, Proc. of the Int’l Conf. on Artificial Intelligence, 2000, 56 Search PubMed.
- C. Chen and C. Li, Data Mining for Direct Marketing – Specific Problems and Solutions, Proceedings of Fourth International Conference on Knowledge Discovery and Data Mining (KDD-98), 1998, pp. 73–79 Search PubMed.
- D. Rogers and M. Hahn, J. Chem. Inf. Model., 2010, 50, 742–754 CrossRef CAS PubMed.
- Daylight, SMARTS – A Language for Describing Molecular Patterns, https://www.daylight.com/dayhtml/doc/theory/theory.smarts.html, accessed 05/01/2021 Search PubMed.
- P. Schwaller, T. Gaudin, D. Lanyi, C. Bekas and T. Laino, Chem. Sci., 2018, 9, 6091–6098 RSC.
- C. Chen, W. Ye, Y. Zuo, C. Zheng and S. P. Ong, Chem. Mater., 2019, 31, 3564–3572 CrossRef CAS.
- C. R. Qi, H. Su, K. Mo and L. J. Guibas, Proceedings of the IEEE conference on computer vision and pattern recognition, 2017, 652–660 Search PubMed.
- V. Nair and G. E. Hinton, ICML, 2010 Search PubMed.
- A. Paszke, S. Gross, S. Chintala, G. Chanan, E. Yang, Z. DeVito, Z. Lin, A. Desmaison, L. Antiga and A. Lerer, https://openreview.net, 2017.
- D. Bau, J.-Y. Zhu, H. Strobelt, A. Lapedriza, B. Zhou and A. Torralba, Proc. Natl. Acad. Sci. U. S. A., 2020, 117, 30071–30078 CrossRef CAS PubMed.
Footnotes |
| † Electronic supplementary information (ESI) available: Area under the ROC curve of models, product invalid rate of the molecular transformer model and highlighted substructures of fingerprint-based models. See DOI: 10.1039/d1sc01049b |
| ‡ J. K., G. H. G. and J. N. contributed equally to this work. |
| This journal is © The Royal Society of Chemistry 2021 |