DOI:
10.1039/D1SC00436K
(Edge Article)
Chem. Sci., 2021,
12, 7098-7114
Metal–metal bonded alkaline-earth distannyls†
Received
23rd January 2021
, Accepted 19th March 2021
First published on 23rd March 2021
Abstract
The first families of alkaline-earth stannylides [Ae(SnPh3)2·(thf)x] (Ae = Ca, x = 3, 1; Sr, x = 3, 2; Ba, x = 4, 3) and [Ae{Sn(SiMe3)3}2·(thf)x] (Ae = Ca, x = 4, 4; Sr, x = 4, 5; Ba, x = 4, 6), where Ae is a large alkaline earth with direct Ae–Sn bonds, are presented. All complexes have been characterised by high-resolution solution NMR spectroscopy, including 119Sn NMR, and by X-ray diffraction crystallography. The molecular structures of [Ca(SnPh3)2·(thf)4] (1′), [Sr(SnPh3)2·(thf)4] (2′), [Ba(SnPh3)2·(thf)5] (3′), 4, 5 and [Ba{Sn(SiMe3)3}2·(thf)5] (6′), most of which crystallised as higher thf solvates than their parents 1–6, were established by XRD analysis; the experimentally determined Sn–Ae–Sn′ angles lie in the range 158.10(3)–179.33(4)°. In a given series, the 119Sn NMR chemical shifts are slightly deshielded upon descending group 2 from Ca to Ba, while the silyl-substituted stannyls are much more shielded than the phenyl ones (δ119Sn/ppm: 1′, −133.4; 2′, −123.6; 3′, −95.5; 4, −856.8; 5, −848.2; 6′, −792.7). The bonding and electronic properties of these complexes were also analysed by DFT calculations. The combined spectroscopic, crystallographic and computational analysis of these complexes provide some insight into the main features of these unique families of homoleptic complexes. A comprehensive DFT study (Wiberg bond index, QTAIM and energy decomposition analysis) points at a primarily ionic Ae–Sn bonding, with a small covalent contribution, in these series of complexes; the Sn–Ae–Sn′ angle is associated with a flat energy potential surface around its minimum, consistent with the broad range of values determined by experimental and computational methods.
Introduction
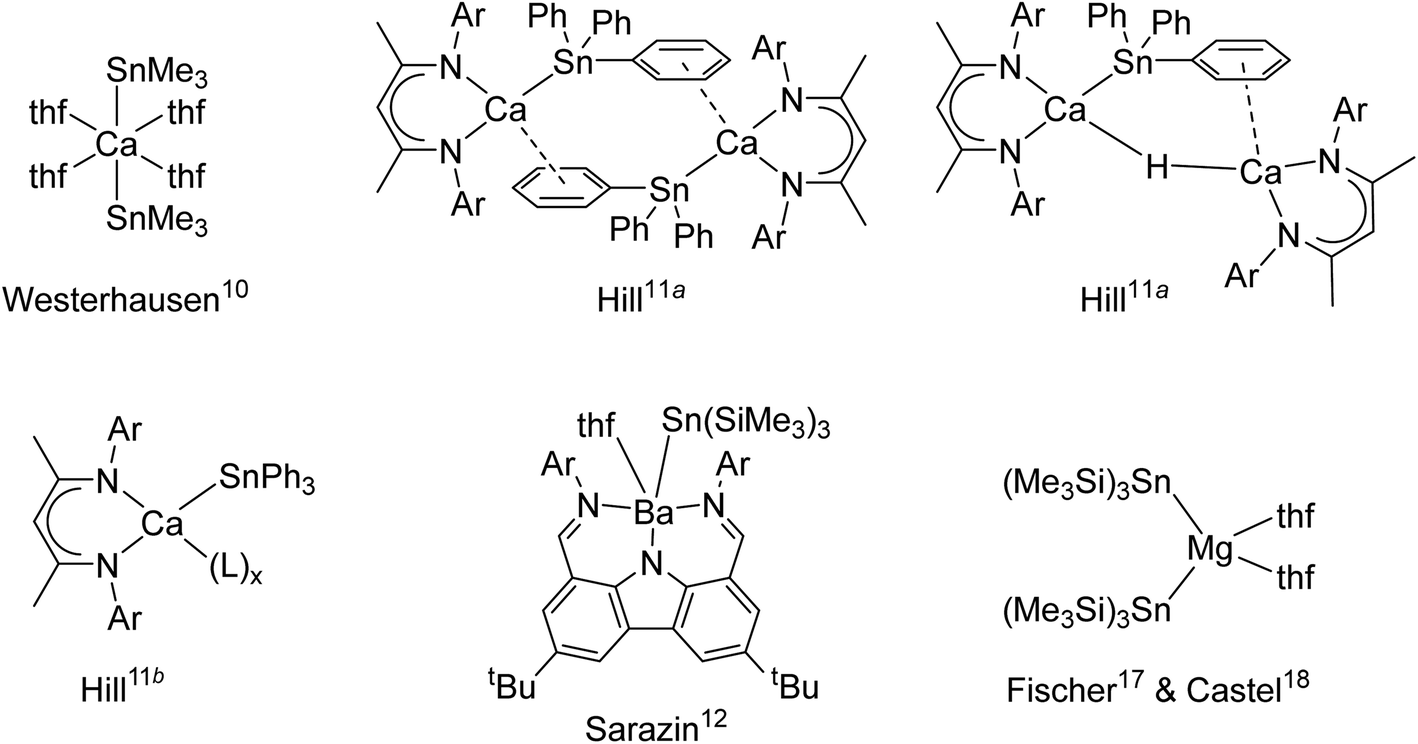
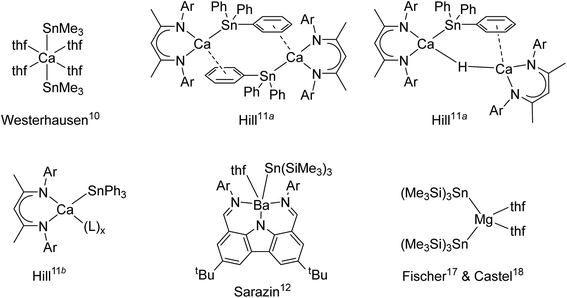
Beyond their spreading use in molecular catalysis,1 heavy alkaline earth (Ae = Ca, Sr and Ba) compounds continue to attract interest due to their intriguing reactivity and structural features. Hill's highly nucleophilic, solvent-free calcium-hydride has proved a fantastic breakthrough2 that has opened access to unprecedented bond activation and catalytic processes.3 A growing range of well-defined and structurally authenticated compounds that contain various Ae–X σ-bonds, where X is a monoanionic group such as for instance an alkyl, amide, alkoxide, halide or a hydride, are now available.
Metal–metal bonded molecular compounds have been essential in the development of inorganic chemistry. They are continuing to receive sustained attention because of their unusual structural patterns, bonding properties and exciting reactivity.4 Amongst these, molecular alkaline-earth complexes featuring Ae-to-metal bonds, where Ae is a large alkaline earth (Ae = Ca, Sr or Ba), remain scarce. The homobimetallic magnesium(I) β-diketiminate [{BDIDiPP}Mg–Mg{BDIDiPP}] (where BDIDiPP = HC{(Me)CN-2,6-iPr2-C6H3}2, with DiPP = 2,6-iPr2-C6H3) stands out as an extremely convenient, stoichiometric reducing agent,5 but similar homobimetallic compounds with larger Ae metals remain unknown to date. On the other hand, a handful of heterobimetallic complexes involving Ae-to-metal σ bonds have been reported with d or p-block metals. These compounds are expected to exhibit high reactivity due to the high polarisation of the intermetallic bond between the electropositive Ae element (Pauling's electronegativity, χP: Ca, 1.00; Sr, 0.95; Ba, 0.89) and other, more electronegative metals. Ae-transition metal complexes, e.g. [Ae{Co(CO)3(PCy3)}2·(thf)x]2, were synthesised for Ae = Mg, Ca and Sr, and their electronic structures were probed; the Ae–Co interaction was found by DFT calculations to decrease down group 2 from Be to Sr.6 Some examples of Ae-metal σ-bonded complexes with post-transition metals are available. For instance, Ae–Ga gallyls exist for the three large alkaline earths (Ae = Ca, Sr and Ba), as in [Ae{Ga{N(DiPP)C(R)}2}2·(tmeda)2] with R = H or Me.7,8 Combined with the calcium alumanyl [{CH2SiMe2N(DiPP)}2AlCa{BDIDiPP}] only recently unveiled, they constitute the extent of σ-bonded complexes involving group 13 metals currently accessible.9 A few cases of Ae-to-tetrel bonds with group 14 elements also exist. The seminal complex, Westerhausen's [Ca(SnMe3)2·(thf)4], was reported in 1994 (Fig. 1).10 The heteroleptic β-diketiminato-calcium stannyls [{BDIDiPP}CaSn(μ2-H)(SnPh3)Ca{BDIDiPP}] and [{BDIDiPP}CaSnPh3]2, as well as the monomeric Lewis adducts [{BDIDiPP}CaSnPh3·(L)x] (L = thf, 2,2,5,5-Me4-thf and Ph3P = O; x = 1–2), were obtained much later; the adducts were shown to be suitable sources of tin-centred nucleophiles that reacted with Cl2SntBu2 or carbodiimines.11 On the other hand, strontium stannyls are still unknown, while characterisation of the very first barium stannyl, the heteroleptic [{CarbDiPP}BaSn(SiMe3)3·thf] (CarbDiPP = 2,9-(CH![[double bond, length as m-dash]](https://www.rsc.org/images/entities/char_e001.gif) N-2,6-iPr2-C6H3)2-4,7-tBu2-C12H4N) was recently accomplished by our group,12 along with the preparation of its calcium congener, [{CarbDiPP}CaSn(SiMe3)3·thf].13 Bonding analysis by DFT methods in these complexes pointed at a highly ionic Ae-to-Sn bond, with a HOMO essentially located on tin, even if a non-negligible orbital contribution was also found in the barium stannyl.
N-2,6-iPr2-C6H3)2-4,7-tBu2-C12H4N) was recently accomplished by our group,12 along with the preparation of its calcium congener, [{CarbDiPP}CaSn(SiMe3)3·thf].13 Bonding analysis by DFT methods in these complexes pointed at a highly ionic Ae-to-Sn bond, with a HOMO essentially located on tin, even if a non-negligible orbital contribution was also found in the barium stannyl.
 |
| | Fig. 1 Structurally characterised alkaline-earth stannyls (Ar = 2,6-iPr2-C6H3). | |
Although a number of compounds featuring Ae-to-Si and Ae-to-Ge σ bonds to lighter tetrels, as in [Ae{Si(SiMe3)3}2·(thf)n] and [Ae{Ge(SiMe3)3}2·(thf)n] or related species (Ae = Ca, Sr, n = 3; Ba, n = 4), have been reported,14,15 the sole homoleptic alkaline-earth distannyl remains [Ca(SnMe3)2·(thf)4].10 Peculiarly, the isolation of the analogue [Ca(SnPh3)2·(thf)4] with aromatic substituents has proved troublesome. Even though this complex was said to have been obtained as a colourless solid and used as a crude, it was not structurally authenticated and no spectroscopic data were provided.16 Attempts to generate a Ca-SnPh3 fragment by reaction of elemental calcium with Ph3SnSnPh3 in liquid ammonia in the presence of a crown-ether and HMPA produced the separated ion pair [Ca(18-c-6)·(hmpa)2][Sn(SnPh3)3]2. Similar observations were made with strontium, whereas the barium salt [Ba(18-c-6)·(hmpa)2][SnPh3]2 could be crystallised.16
While working on [{CarbDiPP}BaSn(SiMe3)3·thf],12 it came to our attention that the magnesium distannyl [Mg{Sn(SiMe3)3}2] had been made from [MgBr2·Et2O] and [KSn(SiMe3)3·(thf)2];17 it was recrystallised from thf as the disolvate [Mg{Sn(SiMe3)3}2·(thf)2].18 These complexes are kinetically stabilised by the presence of bulky tris(trimethylsilyl)stannyls. Moreover, since the Sn–Si bond is more robust than the Sn–Sn one,19 the (Me3Si)3Sn− moieties are less likely to engage in side reactions than their tris(trimethylstannyl)stannyl counterparts. In this context, we now report the first homologous series of alkaline-earth stannyls for Ae = Ca, Sr and Ba. The molecular structures of the Ae-distannyls [Ae(SnPh3)2·(thf)n] and their stability in solution are introduced. The synthesis and structural features of the bulkier [Ae{Sn(SiMe3)3}2·(thf)n] are also discussed. These complexes have been characterised by single-crystal X-ray diffraction and by high resolution solution multinuclear NMR spectroscopy. Structural analysis was combined with theoretical (DFT) investigations to shed light on the bonding patterns and to highlight subtle differences between the large alkaline earths Ca, Sr and Ba.
Results and discussion
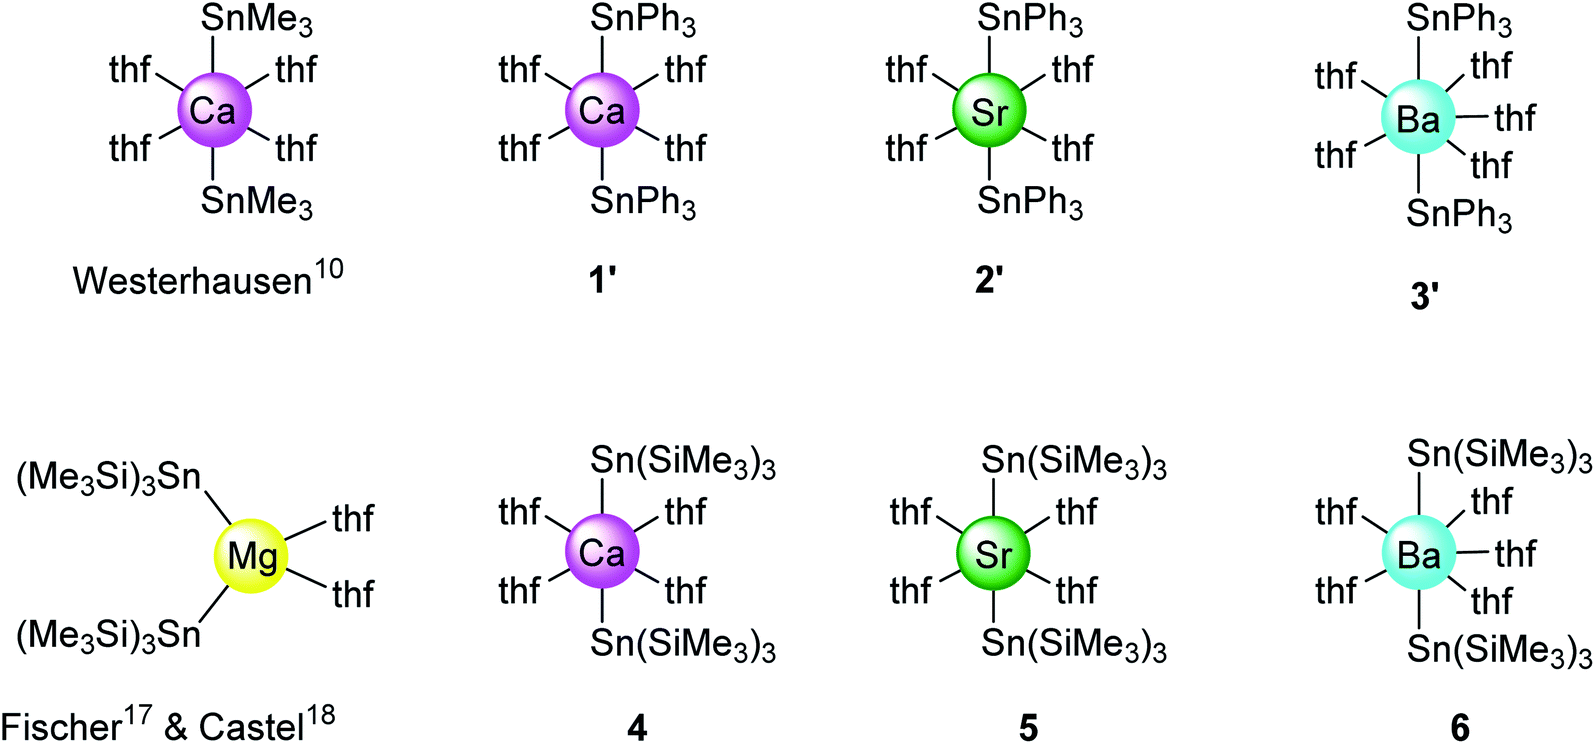
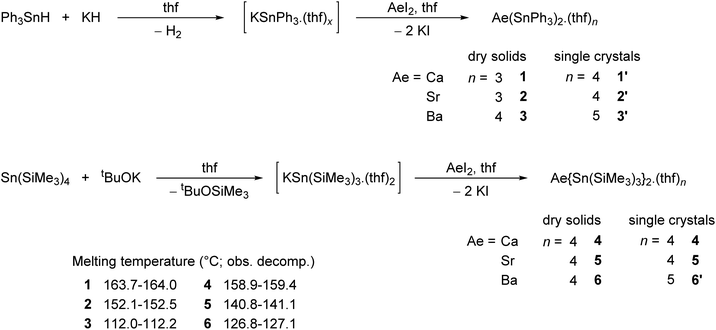
The alkaline-earth distannyls [Ca(SnPh3)2·(thf)4] (1′), [Sr(SnPh3)2·(thf)4] (2′) and [Ba(SnPh3)2·(thf)5] (3′) were synthesised upon reaction in thf of the corresponding Ae iodides with [KSnPh3(thf)x] (Scheme 1). The compounds were isolated as pale yellow crystals in 58–73% yields from a mixture of thf and petroleum ether, and their solid-state molecular structures were determined by X-ray crystallography. Partial removal of thf from these crystals is achieved upon thorough drying under dynamic vacuum to afford [Ca(SnPh3)2·(thf)3] (1), [Sr(SnPh3)2·(thf)3] (2) and [Ba(SnPh3)2·(thf)4] (3). Complexes 1–3 are sparingly soluble, and only dissolve in thf; it hence proved impossible to obtain single crystals of these solvates. The related complexes [Ca{Sn(SiMe3)3}2·(thf)4] (4), [Sr{Sn(SiMe3)3}2·(thf)4] (5) and [Ba{Sn(SiMe3)3}2·(thf)5] (6′) were prepared following the reaction of AeI2 with in situ prepared [KSn(SiMe3)3·(thf)2] in thf.17 They were isolated in moderate yields (31–62%) as pale yellow crystals upon recrystallisation from petroleum ether; in contrast to their trisphenyltin analogues, their solubility in common organic solvents, including aliphatic hydrocarbons, is excellent. The crystalline barium complex 6′ loses a thf molecule when dried in vacuo to give the tetra-thf adduct [Ba{Sn(SiMe3)3}2·(thf)4] (6). Besides, even as a solid, with time it shows signs of decomposition (in particular, the formation of a black solid is observed, assumed to be elemental tin(0); this would be consistent with dismutation processes suggested by the formation of oxidised species, e.g. SnR4 and R3SnSnR3, observed in solution, vide infra) at temperatures above 0 °C, and it should therefore be kept cold. The series of homologous complexes 4–6 is completed by the already documented magnesium complex [Mg{Sn(SiMe3)3}2·(thf)2],17,18 a complex isolated as pale yellow crystals with solubility properties similar to those of 4–6. Their identity was established by XRD analysis, and their purity was confirmed by solution NMR spectroscopy. The melting temperatures (with the observed decomposition) were recorded for all complexes; for a given stannyl, they decrease from Ca to Sr and then to Ba.
 |
| | Scheme 1 Syntheses of the alkaline-earth (Ae = Ca, Sr, Ba) distannyls 1–6. | |
X-ray diffraction crystallography
The solid-state structures of all complexes were determined by XRD analysis performed on single crystals. The independent set of compounds 1′–3′ and 4–6′ constitute the first homologous series of molecular complexes of the heavy alkaline earths (Ae = Ca, Sr and Ba) that contain Ae–Sn bonds. The details and specificities of the structures for 1′–6′ are discussed in the following section and are compared to those of the other reported Ae-distannyls, [Ca(SnMe3)2·(thf)4]10 and [Mg{Sn(SiMe3)3}2·(thf)2]17,18 (Fig. 2). A comparative summary of metric meters is tabulated further down (see Table 2).
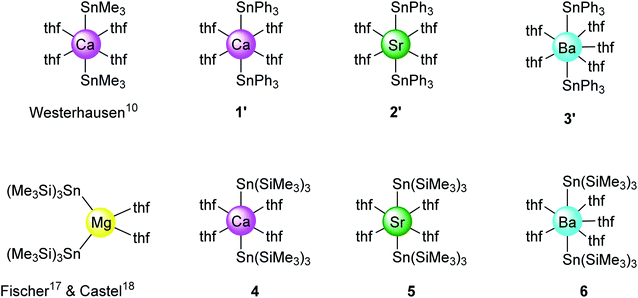 |
| | Fig. 2 Sketch of the molecular structures of new and reported10,17,18 alkaline-earth distannyls. | |
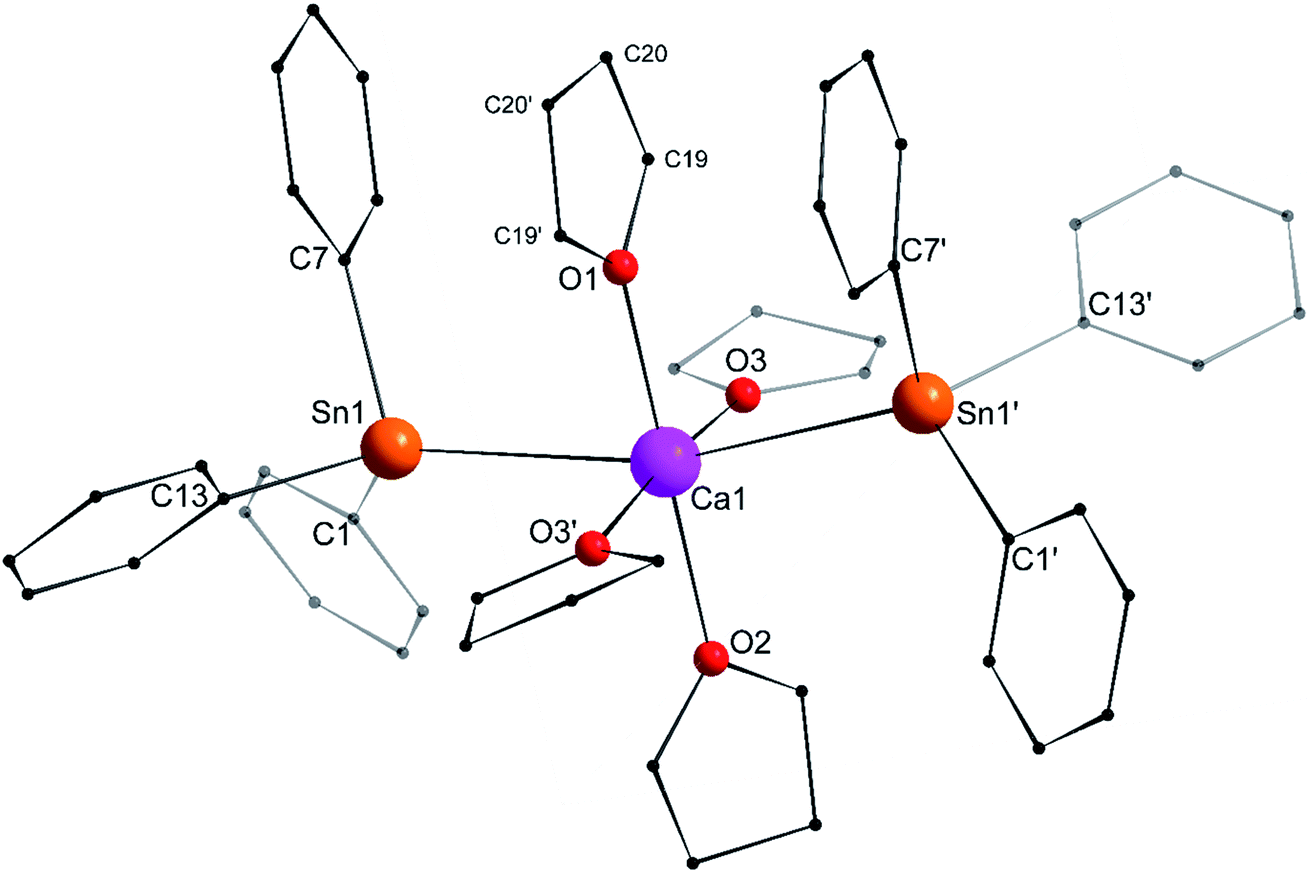
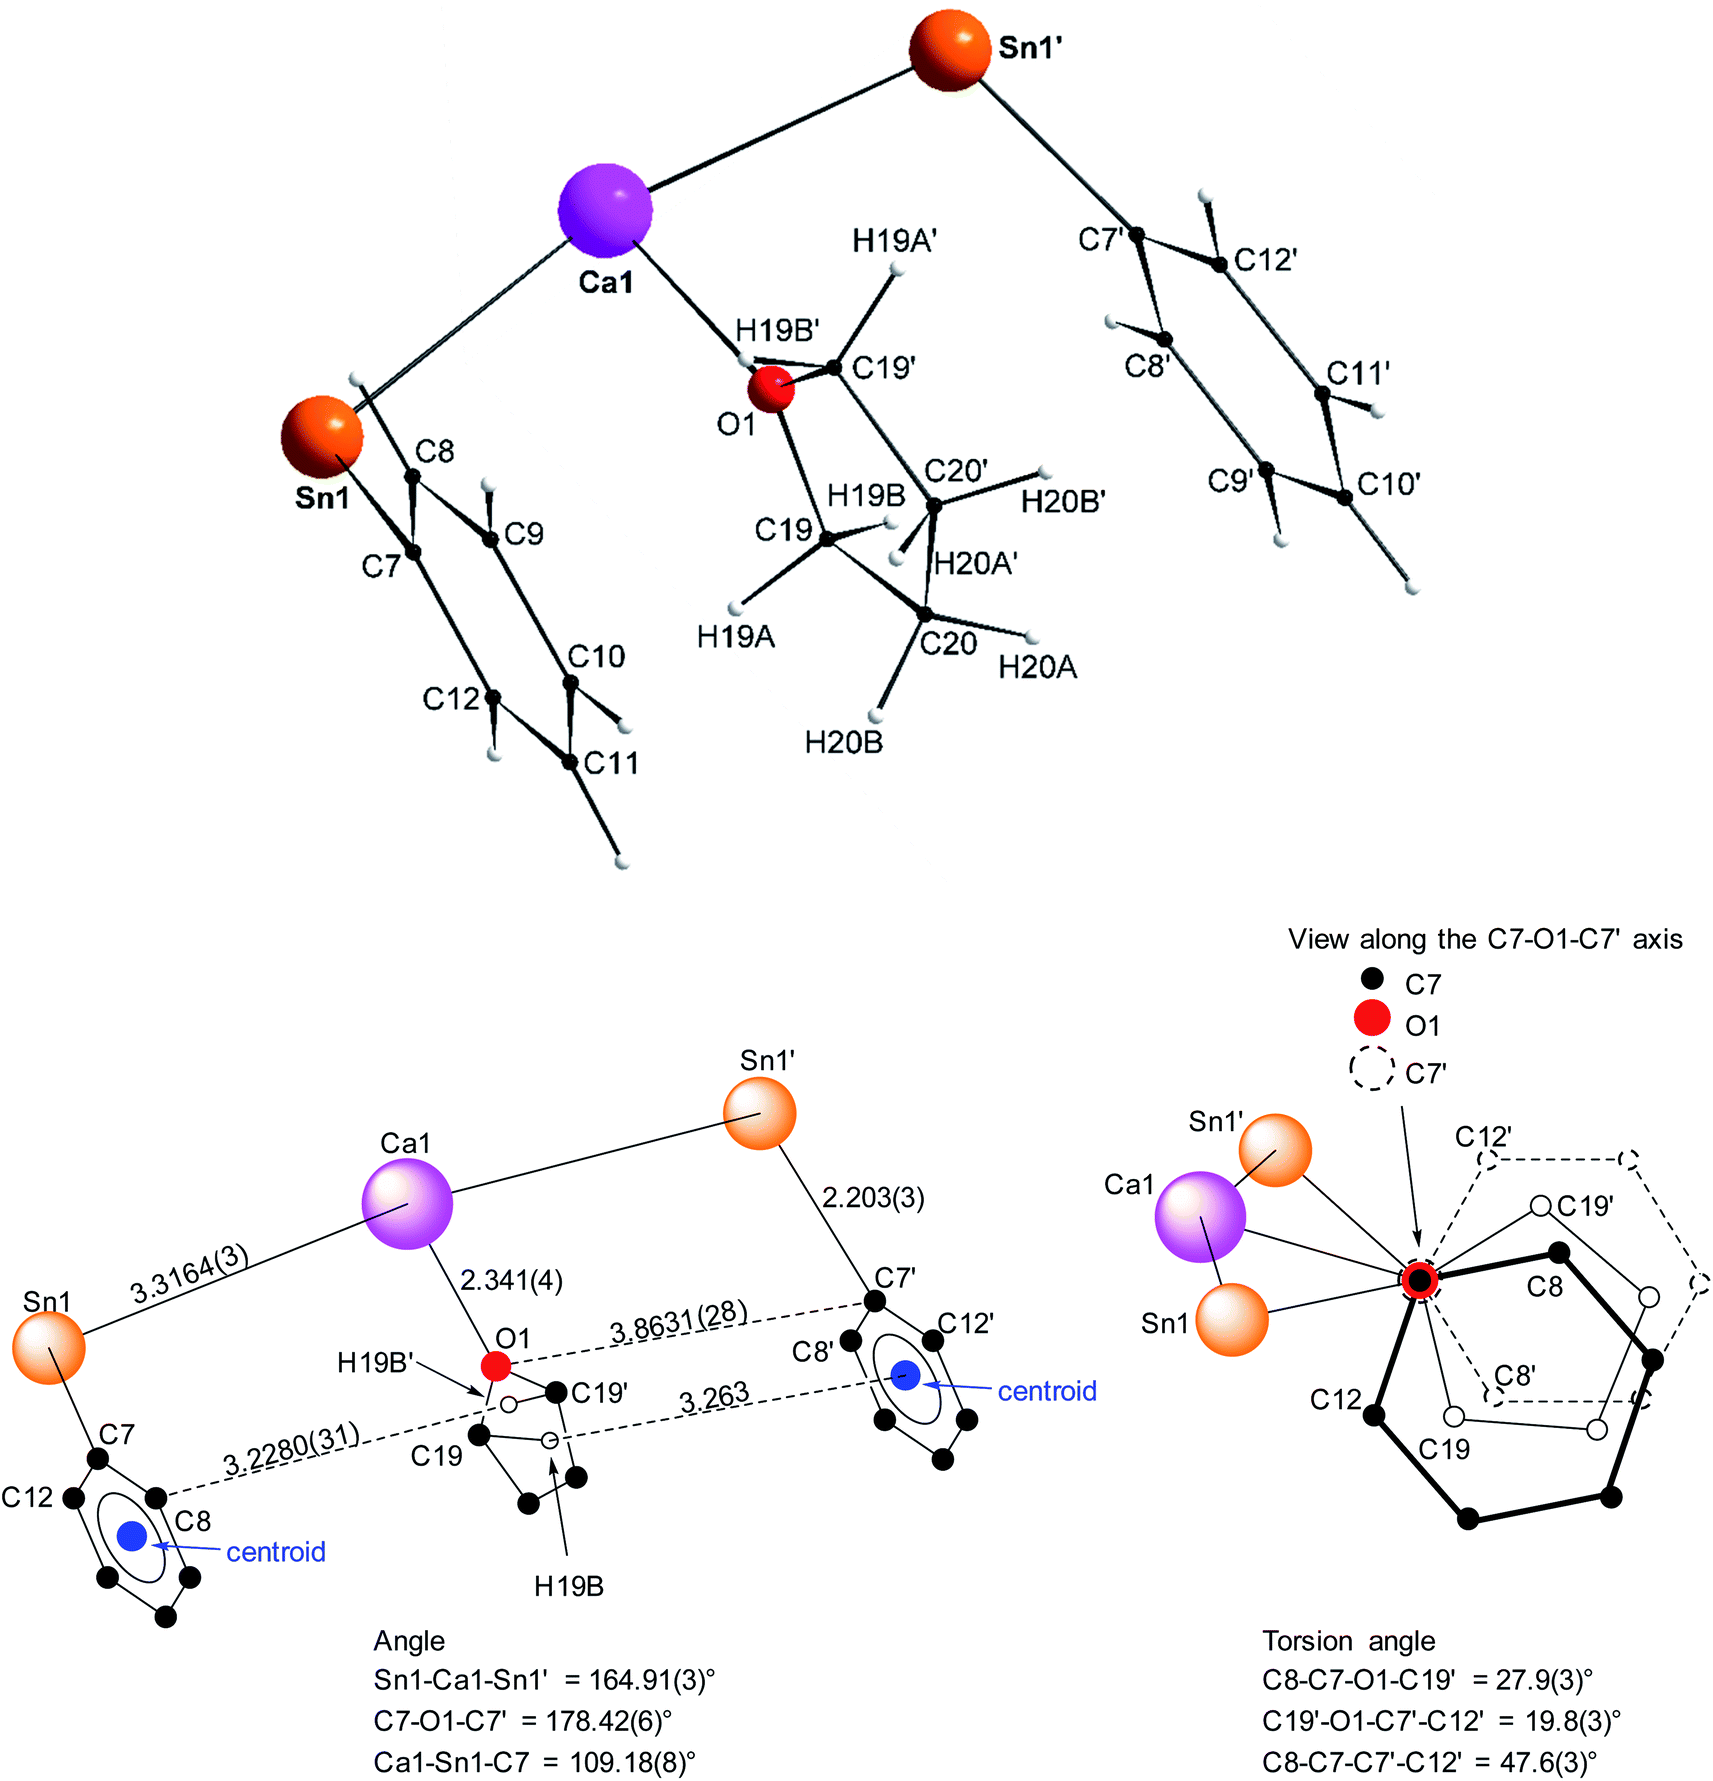
Single crystals of the tetra-solvate calcium-distannyl [Ca(SnPh3)2·(thf)4] (1′) were obtained upon crystallisation from the thf/petroleum ether washings of the reaction. The C2v-symmetric geometry about Ca1 forms a slightly distorted octahedron, with tin atoms at the axial positions whereas the four oxygen atoms and the metal are coplanar (Fig. 3). The symmetry axis goes through O1, Ca1 and O2. The Sn1–Ca1–Sn1′ angle in 1′ (164.91(3)°) is narrower than in the centrosymmetric [Ca(SnMe3)2·(thf)4] (180.0°).10 This deviation from perfect linearity might simply be the outcome of packing forces in the crystal lattice. However, it is also possible that the observed bending of the angle towards O1 enables the formation of favourable intramolecular Cthf–H⋯C(π-arene) interactions (at a minimal C–H interatomic distance of 3.2280(31) Å, and a shortest distance to the centroid of 3.263 Å) between the H atoms of the thf molecule corresponding to O1 and the two flanking aromatic rings corresponding to C7 and C7′. In particular, the three best mean planes defined respectively by these two aromatic rings and by the pertaining O1-thf molecule are nearly parallel, while the C7–O1–C7′ angle is almost linear (178.42(6)°). A view along this C7–O1–C7′ axis shows that the three rings are only slightly offset, with a representative O1–C7 interatomic distance of 3.8631(28) Å (Fig. 4). The Ca1–Sn1 interatomic distance in 1′ (3.3164(3) Å) is slightly longer than that in [Ca(SnMe3)2·(thf)4] (3.2721(3) Å),10 which is interpreted as the expression of a weaker bonding and a greater charge separation in 1′. The Ca1–Oi interatomic distances to the different oxygen atoms (i = 1, 2, 3 and 3′), in the range 2.341(4)–2.382(3) Å, match those in the dicationic solvate [Ca(thf)62+] in the ion pair (Ca(thf)62+]·2[B(C6F5)4−] (2.344(3)–2.375(3) Å![[thin space (1/6-em)]](https://www.rsc.org/images/entities/char_2009.gif) 20). They are therefore compatible with a near-quantitative δ−Sn⋯Ca2+⋯Snδ− charge separation in 1′ and a formal oxidation state + II for Sn centres, as expected from the electronegativities of calcium and tin (χP = 1.00 and 1.96). Accordingly, the Ci–Sn1–Cj angles (i, j = 1, 7, 13) in 1′, all in the range of 96.71(11)–98.90(12)°, are consistent with a quasi-exclusive contribution of p orbitals at the tin(II) centre to the formation of the Sn–C bonds. The lone pair at tin is of mostly s character, in agreement with the very low |1J119Sn–13C| value measured for 1′ (88.9 Hz, vide infra).21
20). They are therefore compatible with a near-quantitative δ−Sn⋯Ca2+⋯Snδ− charge separation in 1′ and a formal oxidation state + II for Sn centres, as expected from the electronegativities of calcium and tin (χP = 1.00 and 1.96). Accordingly, the Ci–Sn1–Cj angles (i, j = 1, 7, 13) in 1′, all in the range of 96.71(11)–98.90(12)°, are consistent with a quasi-exclusive contribution of p orbitals at the tin(II) centre to the formation of the Sn–C bonds. The lone pair at tin is of mostly s character, in agreement with the very low |1J119Sn–13C| value measured for 1′ (88.9 Hz, vide infra).21
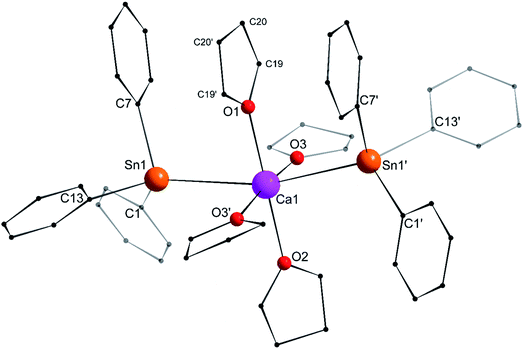 |
| | Fig. 3 Molecular solid-state structure of [Ca(SnPh3)2·(thf)4] (1′). H atoms omitted for clarity. Selected bond lengths (Å): Ca1–Sn1 = 3.3164(3), Ca1–O1 = 2.341(4), Ca1–O2 = 2.360(3), Ca1–O3 = 2.382(3), Sn1–C1 = 2.200(3), Sn1–C7 = 2.203(3), and Sn1–C13 = 2.199(3). Selected angles (°): C1–Sn1–C13 = 98.90(12), C1–Sn1–C7 = 98.02(11), C1–Sn1–Ca1 = 120.27(9), C7–Sn1–C13 = 96.71(11), C7–Sn1–Ca1 = 109.18(8), C13–Sn1–Ca1 = 127.79(8), O1–Ca1–O2 = 180.0, O1–Ca1–O3 = 92.86(7), O2–Ca1–O3 = 87.14(7), O3–Ca1–O3′ = 174.28(14), O3–Ca1–Sn1′ = 90.97(6), O3′–Ca1–Sn1′ = 89.78(6), Sn1–Ca1–O1 = 82.453(15), Sn1–Ca1–O2 = 97.547(15), Sn1–Ca1–O3 = 89.78(6), and Sn1–Ca1–Sn1′ = 164.91(3). Symmetry transformations used to generate equivalent atoms: −x, y, −z + 1/2; T = [1, 0, 0]. | |
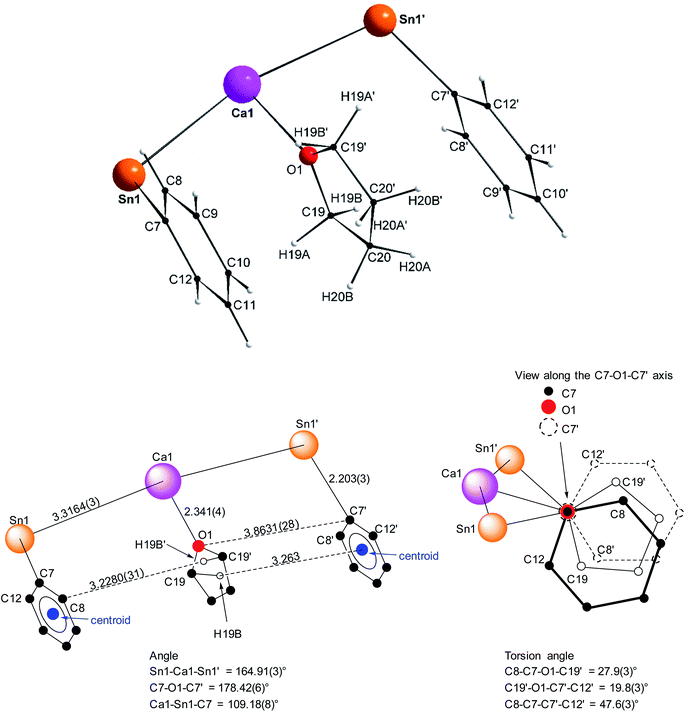 |
| | Fig. 4 Representation of the Sn1–C7(arom.), Ca1–O1(thf) and Sn1′-C7′(arom.) fragments in the molecular structure of the C2v-symmetric [Ca(SnPh3)2·(thf)4] (1′). Distances in Å. See Fig. 3 for the complete structure. | |
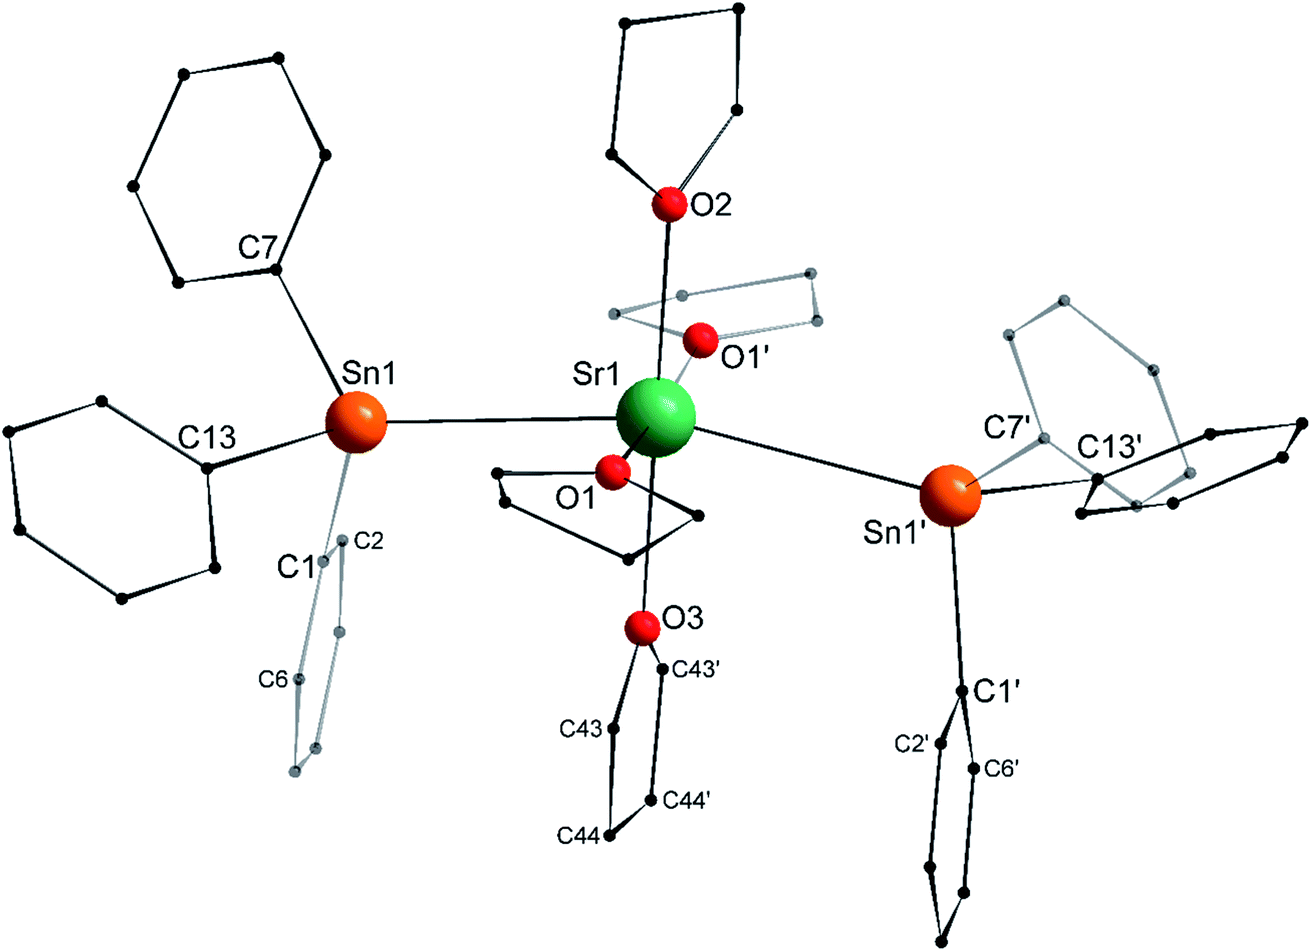
The structure of the C2v-symmetric strontium distannyl [Sr(SnPh3)2·(thf)4] (2′) depicted in Fig. 5 resembles closely that of 1′. It is the first structurally authenticated strontium stannyl with an unsupported Sr–Sn bond. Note, however, that the isolated structure of the alkoxide-bridged [Sr{(μ2-OtBu)3Sn–Fe(CO)4}2], which contains a short Sn⋯Sr interatomic distance (3.2929(20) Å) and that likely features some degree of covalence, is known.22 The metal atom in 2′ lies in an octahedral environment, also with four thf molecules in equatorial positions and the two stannyls in the axial sites. The Sn1–Sr1–Sn1′ angle of 163.504(15)° matches that in 1′. The Ci–Sn1–Cj angles (i, j = 1, 7, 13) are in the range 97.51(11)–99.53(11)°, and again attests the presence of mostly s-type lone pair at the tin atoms in 2′. The Sr1–Sn1 interatomic distance of 3.4293(4) Å is longer than the corresponding Ca1–Sn1 bond in 1′ (3.3164(3) Å). Yet, the increase is much lesser than expected on account of the ionic radii of the dications Sr2+ (1.18 Å) and Ca2+ (1.00 Å), which, counter-intuitively, may reflect a stronger, more covalent bond with strontium. Interestingly, the shortest Cthf–H⋯C(π-arene) distance for the thf molecule corresponding to O3 and the two flanking aromatic substituents that encapsulate it (corresponding to the ipso C-atoms C1 and C1′) of 3.2222(32) Å are identical to those in 1′ (with a distance to the centroid of 3.224 Å), despite the much larger ionic radius of strontium and longer Ae-to-Sn distances in 2′. The thf molecule and two flanking aromatic rings are again nearly parallel, while the C1–O3–C1′ angle is linear (179.285(62)°). The O3–C1 (and O3–C1′) interatomic distance to the pertaining ipso C-atoms in 2′ (3.9379(28) Å) is as expected longer than the corresponding one in the calcium derivative 1′ (3.8631(28) Å).
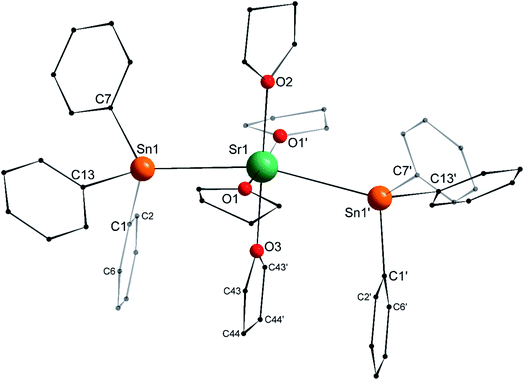 |
| | Fig. 5 Molecular solid-state structure of [Sr(SnPh3)2·(thf)4] (2′). H atoms omitted for clarity. Selected bond lengths (Å): Sr1–Sn1 = 3.4293(4), Sr1–O1 = 2.511(3), Sr1–O2 = 2.502(4), Sr1–O3 = 2.479(4), Sn1–C1 = 2.200(3), Sn1–C7 = 2.197(3), and Sn1–C13 = 2.196(3). Selected angles (°): C1–Sn1–C7 = 98.43(11), C1–Sn1–C13 = 97.51(11), C1–Sn1–Sr1 = 109.08(8), C7–Sn1–C13 = 99.53(11), C7–Sn1–Sr1 = 119.33(8), C13–Sn1–Sr1 = 127.49(8), O1– Sr1–O1′ = 174.21(17), O1–Sr1–O2 = 87.10(8), O1–Sr1–O3 = 92.90(8), O1–Sr1–Sn1 = 90.97(7), O1–Sr1–Sn1′ = 89.86(7), O2–Sr1–O3 = 180.0, O2–Sr1–Sn1 = 98.248(8), O3–Sr1–Sn1 = 81.752(8), and Sn1–Sr1–Sn1′ = 163.504(15). Symmetry transformations used to generate equivalent atoms: −x, y, −z + 1/2; T = [0, 0, 0]. | |
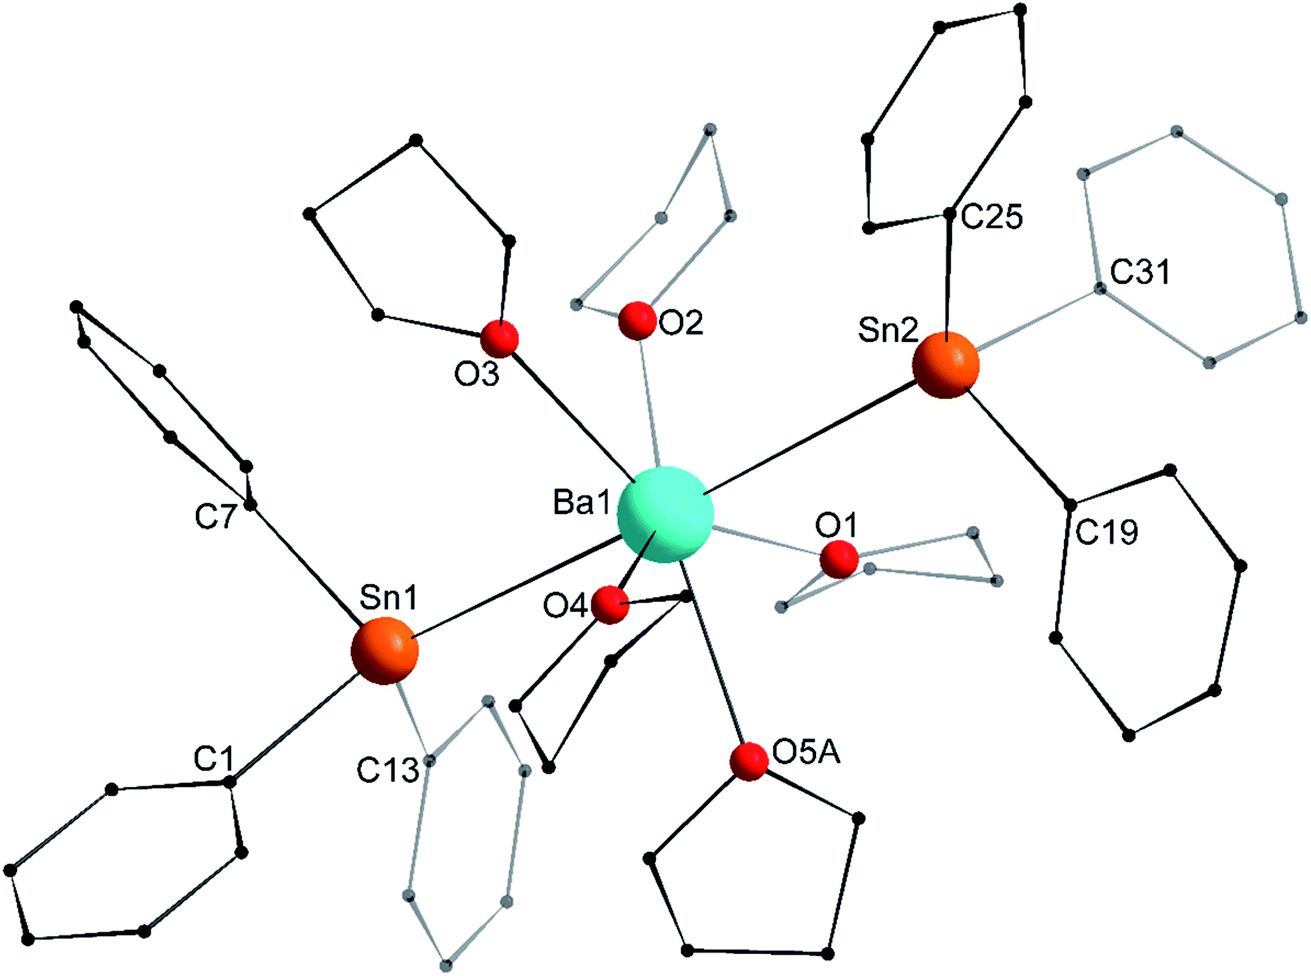
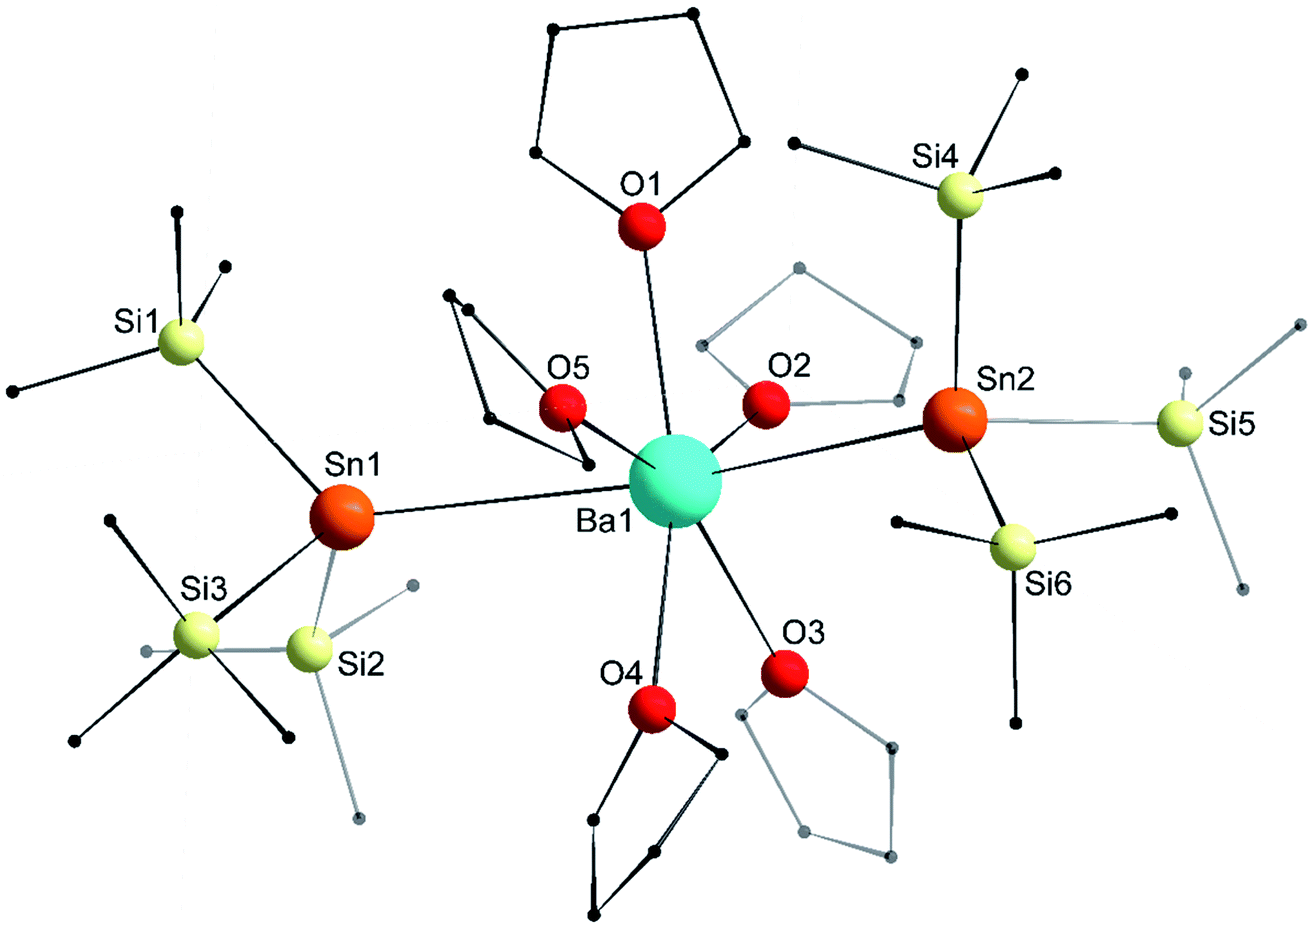
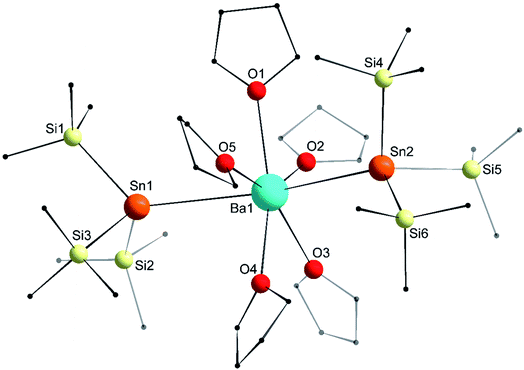
The asymmetric unit in the crystal lattice of [Ba(SnPh3)2·(thf)5] (3′) contains two independent and similar, but not identical, molecules of the complex. Only one of them, corresponding to Ba1, is displayed in Fig. 6, and its metric parameters are detailed here. A summary of relevant metric parameters highlighting the main differences between the two molecules is collected in Table 1. The geometry around the 7-coordinate Ba1 atom forms a near-perfect pentagonal bipyramid, an uncommon geometry for barium. The tin atoms Sn1 and Sn2 are located in axial positions, with a near-linear Sn1–Ba1–Sn2 angle of 176.65(3)°. The five oxygen atoms occupy the equatorial sites, with all Oi–Ba1–Oi+1 angles (for i = 1–4) in the range of 68.9(3)–74.5(4)° close to the ideal value of 72.0°. They are almost coplanar, and the Ba1 atom rests only 0.031(2) Å away from the best average plane defined by these five O-atoms. The Ba1–Sn interatomic distances (3.6575(12) and 3.6821(12) Å) are noticeably longer than in the heteroleptic complex [{CarbDiPP}BaSn(SiMe3)3·thf] (3.521(3) Å),12 the only other referenced complex with an unsupported Ba–Sn bond.23 The Ba1–Sn bond lengths in 3′ are also much longer than in the strontium complex 2′ (3.4293(4) Å), with an increase greater than expected from the difference of ionic radii between Sr2+ and Ba2+ (1.18 and 1.35 Å, respectively). On the other hand, the increase compared to the Ca1–Sn bond length in 1′ (3.3164(3) Å) is in line with the difference of ionic radii for Ca2+ (1.00 Å) and Ba2+. As for 1′ and 2′, the Ci–Sn–Cj angles around the Sn1 and Sn2 atoms are in the range 95.5(6)–100.3(5)°. Most of the Sni–Ba1–Oj angles are reasonably close to 90.0°, as expected for a pentagonal bipyramid geometry. The Sn3–Ba2–Sn4 angle of 169.20(3)° in the second independent molecule is narrower than the Sn1–Ba1–Sn2 one, which induces notable changes in the Sni–Ba2–Oj angles around Ba2 (Table 1). The differences in the structural geometry corresponding to the Ba2+ cations in the two molecules of 3′ found in the asymmetric unit highlight the fact that bonding in these molecules is predominantly electrostatic in nature with little directionality (vide infra).
 |
| | Fig. 6 Molecular solid-state structure of [Ba(SnPh3)2·(thf)5] (3′). H atoms and non-interacting lattice thf molecule omitted for clarity. Only one of the two similar molecules in the asymmetric unit is depicted with the main component (67.4%) of the disordered thf component at O5A. Selected bond lengths (Å): Ba1–Sn1 = 3.6821(12), Ba1–Sn2 = 3.6575(12), Ba1–O1 = 2.742(5), Ba1–O2 = 2.686(4), Ba1–O3 = 2.700(8), Ba1–O4 = 2.738(8), Ba1–O5A = 2.698(12), Sn1–C1 = 2.221(13), Sn1–C7 = 2.210(15), Sn1–C13 = 2.198(15), Sn2–C19 = 2.212(15), Sn2–C25 = 2.189(14), and Sn2–C31 = 2.220(14). Selected angles (°): Sn1–Ba1–Sn2 = 176.65(3), C1–Sn1–C13 = 97.3(5), C1–Sn1–C7 = 95.5(6), C7–Sn1–C13 = 99.1(5), C19–Sn2–C25 = 96.0(5), C19–Sn2–C31 = 96.6(6), C25–Sn2–C31 = 99.0(5), O1–Ba1–O2 = 72.76(18), O1–Ba1–O5A = 73.8(2), O2–Ba1–O3 = 72.5(3), O3–Ba1–O4 = 74.5(4), O4–Ba1–O5A = 68.9(3), O1–Ba1–Sn1 = 94.62(10), O1–Ba1–Sn2 = 83.74(10), O2–Ba1–Sn1 = 82.58(10), O2–Ba1–Sn2 = 94.14(11), O3–Ba1–Sn1 = 87.4(2), O3–Ba1–Sn2 = 92.2(2), O4–Ba1–Sn1 = 99.3(2), O4–Ba1–Sn2 = 83.8(2), O5A–Ba1–Sn1 = 87.2(3), and O5A–Ba1–Sn2 = 95.2(3). | |
Table 1 Relevant metric parameters for the two independent molecules in the asymmetric unit of [Ba(SnPh3)2·(thf)5] (3′)
|
|
Molecule 1 (Ba1) |
|
Molecule 2 (Ba2) |
| Sn1 |
Sn2 |
O |
Sn3 |
Sn4 |
O |
Average valuesa |
|
Values averaged over all equivalent bonds and angles in the two independent molecules.
Angle between two consecutive O atoms in the equatorial plane around Ba1 and Ba2 atoms.
|
| Ba–X [Å] |
3.6821(12) |
3.6575(12) |
|
3.6366(11) |
3.6496(11) |
|
Ba–Sn = 3.656 |
|
|
|
|
|
2.686(4) |
|
|
2.703(7) |
Ba–O = 2.731 |
|
|
|
|
2.698(12) |
|
|
2.731(8) |
|
|
|
|
|
2.700(8) |
|
|
2.748(9) |
|
|
|
|
|
2.738(8) |
|
|
2.781(9) |
|
|
|
|
|
2.742(5) |
|
|
2.785(9) |
|
|
| Sn–C [Å] |
2.198(15) |
2.189(14) |
|
2.185(15) |
2.160(12) |
|
Sn–C = 2.202 |
| 2.210(15) |
2.212(15) |
|
2.216(8) |
2.192(12) |
|
|
| 2.221(13) |
2.220(14) |
|
2.218(9) |
2.210(12) |
|
|
|
| Sn–Ba–Sn [°] |
176.65(3) |
|
|
169.20(3) |
|
|
Sn–Ba–Sn = 172.9° |
|
| Sn–Ba–Oi [°] |
82.58(10) |
83.74(10) |
|
78.93(17) |
80.2(2) |
|
Sn–Ba–Oi = 90.1° |
| 87.2(3) |
83.8(2) |
|
80.6(2) |
81.8(2) |
|
|
| 87.4(2) |
92.2(2) |
|
83.4(2) |
89.2(2) |
|
|
| 94.62(10) |
94.14(11) |
|
101.9(2) |
91.48(17) |
|
|
| 99.3(2) |
95.2(3) |
|
103.7(2) |
110.0(2) |
|
|
|
| Ci–Sn–Cj [°] |
95.5(6) |
96.0(5) |
|
96.7(5) |
95.6(4) |
|
Ci–Sn–Cj = 97.7° |
| 97.3(5) |
96.6(6) |
|
98.4(4) |
98.9(5) |
|
|
| 99.1(5) |
99.0(5) |
|
99.0(5) |
100.3(5) |
|
|
|
| Oi–Ba–Oi+1 [°]b |
|
|
68.9(3) |
|
|
72.8(3) |
Oi–Ba–Oi+1b = 73.3° |
|
|
|
72.5(3) |
|
|
73.0(3) |
|
|
|
|
72.76(18) |
|
|
74.0(3) |
|
|
|
|
73.8(2) |
|
|
74.9(3) |
|
|
|
|
74.5(4) |
|
|
75.7(3) |
|
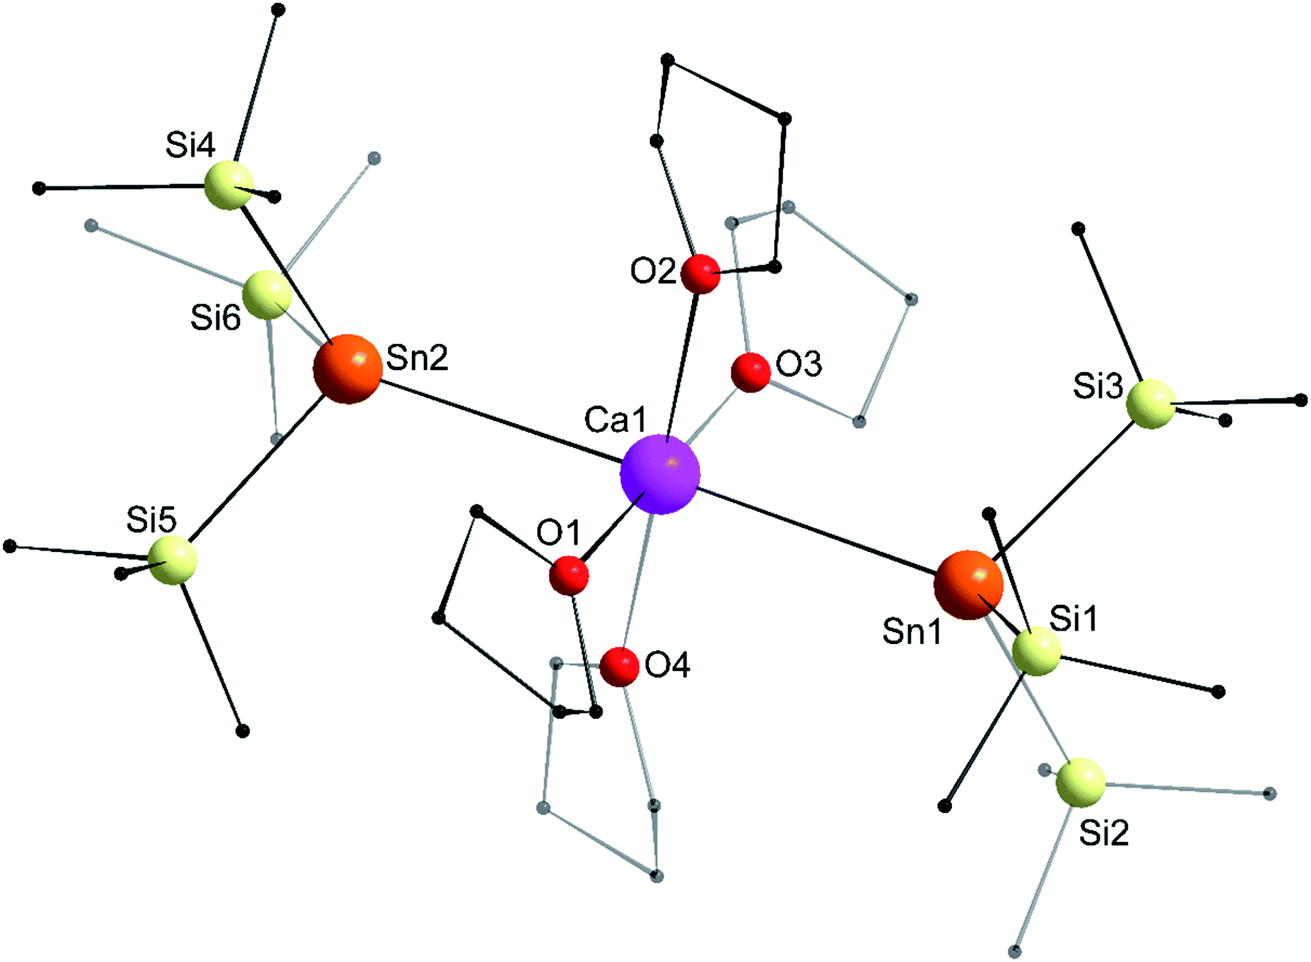
The structure of the octahedral [Ca{Sn(SiMe3)3}2·(thf)4] (4) is shown in Fig. 7. The two tin atoms are in axial positions, and unlike in 1′, the Sn1–Ca1–Sn2 angle of 178.29(2)° is close to linearity. Accordingly, the O1–Ca1–O3 and O2–Ca1–O4 angles are also linear. The Ca1–Sn1 and Ca1–Sn2 interatomic distances of 3.3653(7) and 3.3649(7) Å are comparatively longer than in the six-coordinate complexes 1′ (3.3164(3) Å) and [Ca(SnPh3)2·(thf)4] (3.2721(3) Å). The Sii–Sn–Sij angles around Sn1 (96.93(3)–100.58(3)°) and Sn2 (97.06(3)–99.19(4)°) are consistent with a very minor contribution of the 5s orbital to the formation of the various Sn-to-Si bonds.
 |
| | Fig. 7 Molecular solid-state structure of [Ca{Sn(SiMe3)3}2·(thf)4] (4). H atoms omitted for clarity. Selected bond lengths (Å): Ca1–Sn1 = 3.3653(7), Ca1–Sn2 = 3.3649(7), Ca1–O1 = 2.353(2), Ca1–O2 = 2.392(3), Ca1–O3 = 2.361(3), Ca1–O4 = 2.382(3), Sn1–Si1 = 2.6032(10), Sn1–Si2 = 2.5963(11), Sn1–Si3 = 2.6083(10), Sn2–Si4 = 2.5995(11), Sn2–Si5 = 2.6068(10), and Sn2–Si6 = 2.6079(10). Selected angles (°): O1–Ca1–O2 = 89.14(9), O1–Ca1–O3 = 179.70(10), O1–Ca1–O4 = 93.40(10), O2–Ca1–O3 = 90.94(10), O2–Ca1–O4 = 177.17(9), O3–Ca1–O4 = 86.51(10), O1–Ca1–Sn1 = 90.25(7), O2–Ca1–Sn1 = 89.08(6), O3–Ca1–Sn1 = 90.04(7), O4–Ca1–Sn1 = 92.15(7), O1–Ca1–Sn2 = 88.05(7), O2–Ca1–Sn2 = 91.09(7), O3–Ca1–Sn2 = 91.66(7), O4–Ca1–Sn2 = 87.76(6), Si1–Sn1–Si2 = 99.17(3), Si1–Sn1–Si3 = 100.58(3), Si2–Sn1–Si3 = 96.93(3), Si4–Sn2–Si5 = 97.06(3), Si4–Sn2–Si6 = 99.19(4), Si5–Sn2–Si6 = 97.88(3), Ca1–Sn1–Si1 = 123.77(3), Ca1–Sn1–Si2 = 120.80(3), Ca1–Sn1–Si3 = 110.84(3), Ca1–Sn2–Si4 = 120.73(3), Ca1–Sn2–Si5 = 110.83(3), Ca1–Sn2–Si6 = 125.57(3), and Sn1–Ca1–Sn2 = 178.29(2). | |
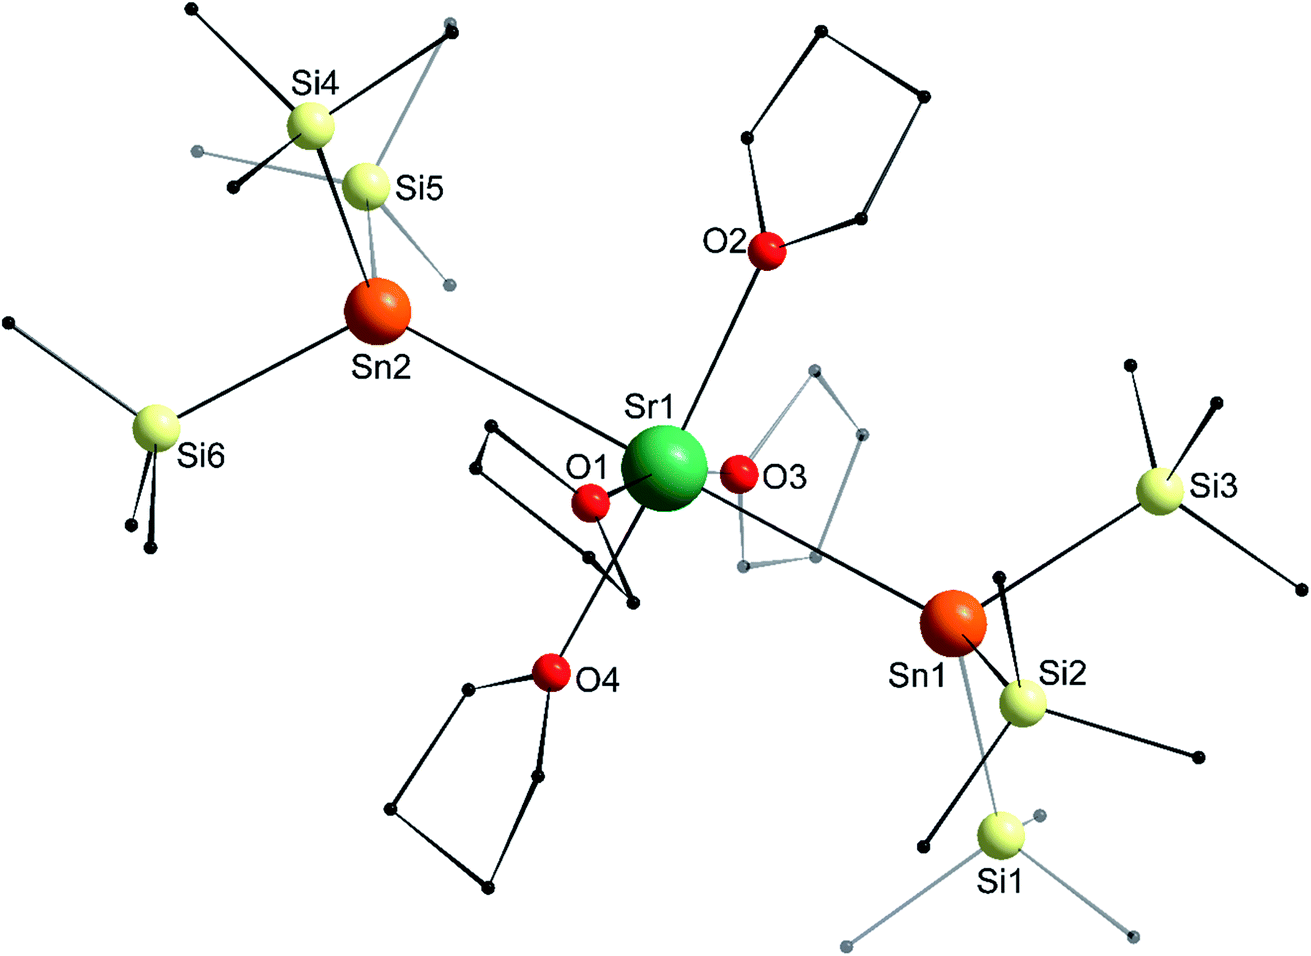
In the molecular solid state, the strontium complex [Sr{Sn(SiMe3)3}2·(thf)4] (5) is isostructural with the congeneric calcium complex 4, and forms a perfect octahedron (Fig. 8; only one of the two independent but very similar molecules in the asymmetric is represented), with a linear Sn1–Sr1–Sn2 angle of 179.33(4)°. Similar to the calcium analogues, the Sr1–Sn1 and Sr1–Sn2 interatomic distances in 5 (3.4600(11) and 3.4550(11) Å) are a little longer than in 2′ (3.4293(4) Å), while the different Sii–Sn–Sij angles range from 96.93(3)° to 100.58(3)°. The Sr1–Sn bond lengths in 5 are less than 0.10 Å longer than those in 4, that is, as seen in 1′ and 2′, the increase in the bond length is lower than the difference of ionic radii between Ca2+ and Sr2+ in six-coordinate environments (0.18 Å).
 |
| | Fig. 8 Molecular solid-state structure of [Sr{Sn(SiMe3)3}2·(thf)4] (5). H atoms omitted for clarity. Only one of the two independent but nearly identical molecules found in the asymmetric unit is drawn. Selected bond lengths (Å): Sr1–Sn1 = 3.4600(11), Sr1–Sn2 = 3.4550(11), Sr1–O1 = 2.532(8), Sr1–O2 = 2.518(8), Sr1–O3 = 2.529(15), Sr1–O4 = 2.507(8), Sn1–Si1 = 2.599(4), Sn1–Si2 = 2.591(3), Sn1–Si3 = 2.593(3), Sn2–Si4 = 2.582(3), Sn2–Si5 = 2.582(4), and Sn2–Si6 = 2.596(3). Selected angles (°): O1–Sr1–O2 = 95.9(3), O1–Sr1–O3 = 170.4(5), O1–Sr1–O4 = 89.0(3), O2–Sr1–O3 = 92.6(6), O2–Sr1–O4 = 173.2(3), O3–Sr1–O4 = 82.9(6), O1–Sr1–Sn1 = 90.94(19), O1–Sr1–Sn2 = 89.69(19), O2–Sr1–Sn1 = 91.2(2), O2–Sr1–Sn2 = 88.5(2), O3–Sr1–Sn1 = 84.5(5), O3–Sr1–Sn2 = 94.9(5), O4–Sr1–Sn1 = 93.5(2), O4–Sr1–Sn2 = 86.8(2), Si1–Sn1–Si2 = 97.47(13), Si1–Sn1–Si3 = 101.03(12), Si2–Sn1–Si3 = 96.54(12), Si4–Sn2–Si5 = 98.34(12), Si4–Sn2–Si6 = 96.80(12), Si5–Sn2–Si6 = 100.38(13), Sr1–Sn1–Si1 = 117.60(10), Sr1–Sn1–Si2 = 124.13(8), Sr1–Sn1–Si3 = 115.62(9), Sr1–Sn2–Si4 = 117.29(8), Sr1–Sn2–Si5 = 116.57(10), Sr1–Sn2–Si6 = 122.94(9), and Sn1–Sr1–Sn2 = 179.33(4). | |
The molecular structure of the seven-coordinate [Ba{Sn(SiMe3)3}2·(thf)5] (6′) forms a slightly distorted pentagonal bipyramid (Fig. 9), where the two tin atoms occupy the axial sites with a Sn1–Ba1–Sn2 angle of 158.101(16)° substantially narrower than the ideal 180° and that found in 3′. On the whole though, the structural features in 6′, notably the Ba–Sn bond lengths (3.6668(8) and 3.7058(8) Å) are comparable to those in 3′. Similarly, the angles corresponding to the tin atoms and the Sn–Si distances in 6′ match those in the calcium and strontium derivatives 4 and 5.
 |
| | Fig. 9 Molecular solid-state structure of [Ba{Sn(SiMe3)3}2·(thf)5] (6′). H atoms omitted for clarity. Only the main component of the disordered thf molecule (at O5) is drawn. Selected interatomic distances (Å): Ba1–Sn1 = 3.6668(8), Ba1–Sn2 = 3.7058(8), Ba1–O1 = 2.758(5), Ba1–O2 = 2.770(5), Ba1–O3 = 2.778(5), Ba1–O4 = 2.753(6), Ba1–O5 = 2.737(5), Sn1–Si1 = 2.5949(18), Sn1–Si2 = 2.5862(18), Sn1–Si3 = 2.603(2), Sn2–Si4 = 2.5987(18), Sn2–Si5 = 2.5907(19), and Sn2–Si6 = 2.6032(19). Selected angles (°): Sn1–Ba1–Sn2 = 158.101(16), O1–Ba1–O2 = 68.11(19), O2–Ba1–O3 = 66.18(19), O3–Ba1–O4 = 68.7(2), O4–Ba1–O5 = 79.2(2), O5–Ba1–O1 = 77.9(2), O1–Ba1–Sn1 = 86.72(11), O1–Ba1–Sn2 = 90.87(12), O2–Ba1–Sn1 = 99.17(11), O2–Ba1–Sn2 = 100.09(12), O3–Ba1–Sn1 = 101.78(12), O3–Ba1–Sn2 = 95.46(12), O4–Ba1–Sn1 = 86.08(14), O4–Ba1–Sn2 = 87.73(13), O5–Ba1–Sn1 = 78.85(11), O5–Ba1–Sn2 = 79.36(11), Si1–Sn1–Si2 = 96.49(6), Si1–Sn1–Si3 = 95.67(7), Si2– Sn1–Si3 = 101.22(7), Si4–Sn2–Si5 = 98.27(7), Si4–Sn2–Si6 = 98.22(6), and Si5–Sn2–Si6 = 94.63(6). | |
A summary of the most pertinent crystallographic data for 1′–3′, 4–5 and 6′, as well as for the known [Mg{Sn(SiMe3)3}2·(thf)2],17,18 is amalgamated in Table 2. This table and the preceding discussion highlight some subtle differences and peculiarities in the bonding patterns of the different complexes. As anticipated, the magnesium compound stands out in this series, due to the much smaller size of the metal. It can be seen that, expectedly, coordination numbers increase with the ionic radius from magnesium to barium. The interatomic distances around the central metal also increase accordingly, although, as already mentioned, the lengthening from Ca2+ to Sr2+ does not match the increase in ionic radii. Within a homologous series (i.e. SnPh3 and Sn(SiMe3)3), the geometry around the tin atoms varies very little, and maintain a geometry with little hybridisation between s and p valence orbitals. The Sii–Sn–Sij angles in the tris(trimethylsilyl)stannyls are slightly wider than the Ci–Sn–Cj ones in the triphenylstannyl analogues, presumably to minimise steric repulsion between the bulkier SiMe3 substituents. For a given Ae metal, the Ae–Sn interatomic distances also increase on switching from –SnPh3 to the bulkier –Sn(SiMe3)3 stannyls. Although it may also reflect to some extent the greater steric pressure, such bond elongation is compatible with weaker Ae–Sn bonds in 4, 5 and 6′ and suggest that the partial negative charge at the tin(II) atoms is better stabilised in these complexes than in 1′, 2′ and 3′ due to effective delocalisation in the multiple σ*(Si–C) orbitals.
Table 2 Summary of XRD structural data for 1′–3′, 4–6′ and related complexes
|
|
[Ca(SnPh3)2·(thf)4] |
[Sr(SnPh3)2·(thf)4] |
[Ba(SnPh3)2·(thf)5] |
[Ba(SnPh3)2·(thf)5] |
|
1′
|
2′
|
3′ (molecule 1) |
3′ (molecule 2) |
|
Ionic radius for the given metals.
Coordination number.
Ae–Sn interatomic distance in Å.
Ae–O interatomic distance in Å.
Sn–C interatomic distance in Å.
Angle in degrees.
Sn–Si interatomic distance in Å.
Not available due to large disorder over all SiMe3 sites.
|
|
r
ionic(Ae2+)a |
1.00 |
1.18 |
1.35 |
1.35 |
| C. N.b |
6 |
6 |
7 |
7 |
| Geometry |
Octahedral |
Octahedral |
Pentagonal bipyramidal |
Pentagonal bipyramidal |
| Ae–Snc |
3.3164(3) |
3.4293(4) |
3.6575(12)–3.6821(12) |
3.6366(11)–3.6496(11) |
| Ae–Othf.d |
2.341(4)–2.382(3) |
2.479(4)–2.511(3) |
2.686(4)–2.742(5) |
2.703(7)–2.785(9) |
| Sn–Cie |
2.199(3)–2.203(3) |
2.196(3)–2.200(3) |
2.189(14)–2.221(13) |
2.160(12)–2.218(9) |
| ∠Sn–Met–Sn′f |
164.91(3) |
163.504(15) |
176.65(3) |
169.20(3) |
| ∠Ci–Sn–Cjf |
96.71(11)–98.90(12) |
97.51(11)–99.53(11) |
95.5(6)–99.1(5) |
95.6(4)–100.3(5) |
|
|
[Mg{Sn(SiMe3)3}2·(thf)2]18 |
[Ca{Sn(SiMe3)3}2·(thf)4] |
[Sr{Sn(SiMe3)3}2·(thf)4] |
[Ba{Sn(SiMe3)3}2·(thf)5] |
|
|
4
|
5
|
6′
|
|
r
ionic(Ae2+)a |
0.72 |
1.00 |
1.18 |
1.35 |
| C. N.b |
4 |
6 |
6 |
7 |
| Geometry |
Tetrahedral |
Octahedral |
Octahedral |
Pentagonal bipyramidal |
| Ae–Snic |
2.817(1) |
3.3649(7)–3.3653(7) |
3.4550(11)–3.4600(11) |
3.6668(8)–3.7058(8) |
| Ae–Othf.d |
2.062(9) |
2.353(2)–2.392(3) |
2.507(8)–2.532(8) |
2.737(5)–2.778(5) |
| Sni–Sijg |
2.521(9)–2.584(14) |
2.5963(11)–2.6083(10) |
2.582(3)–2.599(4) |
2.5862(18)–2.6032(19) |
| ∠Sn–Ae–Sn′f |
130.83(8) |
178.29(2) |
179.33(4) |
158.101(16) |
| ∠Sii–Sn–Sijf |
n/ag |
96.93(3)–100.58(3) |
96.54(12)–101.03(12) |
94.63(6)–101.22(7) |
Bonding analysis
The electronic structure of the complexes discussed above was investigated by the means of Density Functional Theory (DFT) calculations at the TZP/PBE0-D3-ZORA level (see Computational Details). All the geometries were fully optimised (gas-phase considered), starting from their X-ray parents when available, otherwise from that of their closest match. The 6-coordinated tetra-solvated series [Ae(SnPh3)2·(thf)4] for Ae = Ca (1′), Sr (2′) and Ba (3, a complex isolated as a powder but so far not crystallographically characterised) is discussed first. Selected data are provided in Tables 3 and S1.† The fully optimised geometries are overall in good agreement with the X-ray structures of 1′ and 2′, with, however, a couple of differences that are mentioned here: (i) the computed Ae–Sn distances are somewhat shorter than their experimental counterparts, especially in the Ae = Ca case (by 0.16 Å). This is a tendency intrinsic to DFT for such metal–ligand types of bonds that is already documented in the literature.24 The particular discrepancy observed for Ae = Ca mainly originates from the Grimme's empirical corrections of dispersion forces that were found to specifically overestimate Ca–Sn interactions (see the ESI†);25 (ii) in the case of 1′, the optimised Sn–Ae–Sn′ angle (177°) indicates quasi-linearity, while the experimental value (164.91(3)°) shows significant bending. In the case of 2′, the computed and X-ray values of the bending angles are almost equal, and the computed bending angle decreases from 1′ to [Ba(SnPh3)2·(thf)4]. Nevertheless, the short intramolecular Cthf–H⋯π-arene contacts observed in the non-bent X-ray structure of 1′ (vide supra) are also found in the optimised structure of 1′, with one of the thf ligands and its two flanking aromatic rings lying almost parallel, thus allowing a minimal C(π)⋯H distance of 2.80 Å. The same feature is also present in the computed structure of 2′ (shortest C(π)⋯H contact = 2.72 Å), but not in that of [Ba(SnPh3)2·(thf)4], where the more pronounced Sn–Ae–Sn′ bending (139°) forces the three rings to rotate away from parallelism in order to avoid collision. In our DFT calculations, the non-covalent interactions are mainly considered through Grimme's D3 dispersion force empirical corrections.25 Optimisation of 2′ without D3 corrections leads to a Sn–Sr–Sn angle (163°) equal to that determined when D3 corrections are considered, although the metal–ligand distances are found to be somewhat larger. Still, the three-parallel-ring feature is present (shortest C⋯H contact = 2.82 Å). Overall, these results indicate that the non-bonding interligand contacts between one thf ligand and its two neighbouring phenyl rings are not the reason for the observed Sn–Ae–Sn′ bending; instead, it is quite possible that they actually are the consequence of this bending.
Simple AeX2 molecules (X = H, halogen) are also known to be subject to such structural bending.26 Such a feature was investigated at a high level of theory and interpreted as resulting from a pseudo Jahn–Teller effect24 originating from the mixing of an occupied σu orbital with a vacant d(Ae) combination of πg symmetry, and considered by the authors as imperfectly reproduced by DFT calculations. Such species with a flat potential energy surface upon bending have been described as floppy or quasilinear.27,28 Our DFT computations on AeF2 found bent structures with angles of 121, 131 and 145°, for Ae = Ca, Sr and Ba, respectively. These corresponding bent minima are more stable than the linear arrangements by 0.03, 0.12 and 0.27 eV. We also calculated the hypothetical thf-free [Ae(SnMe3)2] models for Ae = Ca, Sr, and Ba, and found Sn–Ca–Sn angle values of 180, 123 and of 110°, respectively. In the case of Sr and Ba, the bent minimum is more stable than the linear arrangement by 0.05 and 0.27 eV, respectively. Although only approximate, these data indicate small energy variations upon bending. This is also in line with our calculations on the two independent molecules found in the X-ray structure of the penta-solvated 3′ (Table 3). However their corresponding optimised Sn–Ba–Sn angles (166 and 175°, close to their experimental counterparts, 169.20(3) and 176.65(3)°, see Table 2) differ significantly from one another; their energy difference (0.01 eV) is negligible at our level of calculations. Thus, taken as a whole, these results indicate that the observed or calculated bending for the [Ae(SnPh3)2·(thf)4] (Ae = Ca, Sr Ba) series is mainly the result of a barely stabilising pseudo Jahn–Teller effect somewhat perturbed by weak intra- and intermolecular forces in the solid state.
Table 3 Relevant DFT-computed data for the octahedral and pentagonal bipyramidal complexes [Ae(SnPh3)2·(thf)x] and [Ae{Sn(SiMe3)3}2·(thf)x] (Ae = Ca, Sr, Ba)
|
|
[Ca(SnPh3)2·(thf)4] |
[Sr(SnPh3)2·(thf)4] |
[Ba(SnPh3)2·(thf)4] |
[Ba(SnPh3)2·(thf)5] |
[Ba(SnPh3)2·(thf)5] |
|
1′
|
2′
|
3
|
3′ (molecule 1) |
3′ (molecule 2) |
|
Compound not crystallographically characterised, instead the XRD structure of the pentasolvate 3′ was established.
In parentheses: relative energy between two different molecules, given in eV.
Averaged values.
WBI = Wiberg bond index.
|
| HOMO–LUMO gap/eVb |
4.50 |
4.48 |
4.31 |
4.33 (0.016b) |
4.28 (0.000b) |
| Ae–Sn/Åb [WBI]c,d |
3.159 [0.199] |
3.339 [0.190] |
3.469 [0.160] |
3.533 [0.139] |
3.538 [0.139] |
| Ae–Othf./Åb [WBI]c,d |
2.386 [0.034] |
2.542 [0.028] |
2.733 [0.024] |
2.771 [0.023] |
2.759 [0.022] |
| ∠Sn–Ae–Sn′/° |
177 |
163 |
139 |
175 |
166 |
| NAO charges |
Ae |
1.63 |
1.66 |
1.71 |
1.71 |
1.71 |
| Sn |
0.57 |
0.55 |
0.55 |
0.55 |
0.55 |
| O |
−0.61 |
−0.61 |
−0.60 |
−0.60 |
−0.60 |
|
|
[Ca{Sn(SiMe3)3}2·(thf)4] |
[Sr{Sn(SiMe3)3}2·(thf)4] |
[Ba{Sn(SiMe3)3}2·(thf)4] |
[Ba{Sn(SiMe3)3}2·(thf)5] |
[Mg{Sn(SiMe3)3}2·(thf)2] |
|
4
|
5
|
|
6′
|
|
| HOMO–LUMO gap/eV |
4.60 |
4.42 |
4.11 |
4.19 |
4.87 |
| Ae–Sn/Åb [WBI]c,d |
3.251 [0.159] |
3.357 [0.149] |
3.491 [0.134] |
3.565 [0.128] |
2.766 [0.342] |
| Ae–Othf./Åb [WBI]c,d |
2.386 [0.032] |
2.541d[0.026] |
2.725 [0.023] |
2.763 [0.022] |
2.076 [0.036] |
| ∠Sn–Ae–Sn′/° |
176 |
175 |
170 |
162 |
132 |
| NAO charges |
Ae |
1.71 |
1.73 |
1.75 |
1.74 |
1.47 |
| Sn |
−0.75 |
−0.72 |
−0.78 |
−0.75 |
−0.78 |
| O |
−0.61 |
−0.61 |
−0.60 |
−0.59 |
−0.64 |
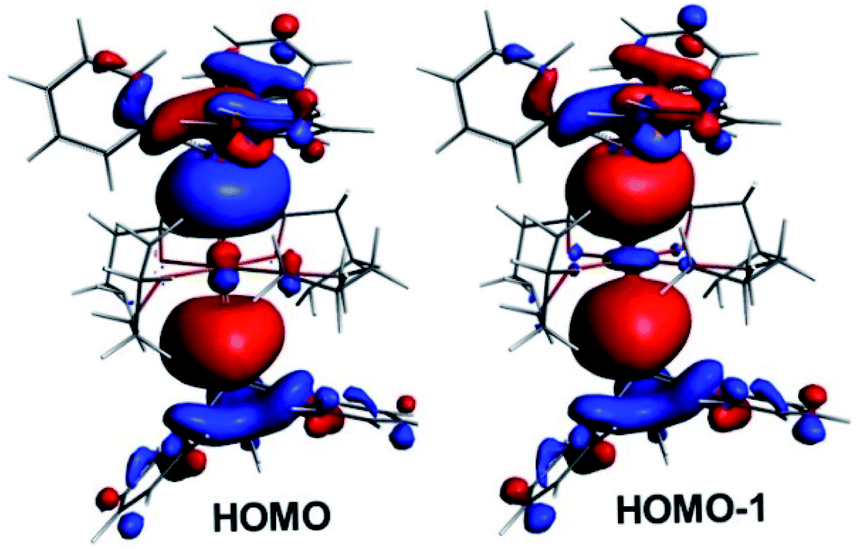
Within the tetra-solvate series, the HOMO–LUMO gap decreases upon going from Ca to Ba, as well as the Ae–Sn and Ae–O Wiberg bond indices (WBI), suggesting a lowering of covalency within the given Ae coordination spheres (Table 3). This is also in line with the Ae natural atomic charge variation within the series. This effect can be related to the decrease in the Ae electronegativity when descending group 2, which increases the energy difference between the Ae valence accepting orbitals and the ligand lone pairs, thus lowering the strength of their interaction. Whereas the small WBI for Ae–O bonds are consistent with a largely ionic bonding character, those for Ae–Sn bonds suggest some covalent character. This is exemplified by the composition of the HOMO and HOMO-1 of the complexes, which are respectively the out-of-phase and in-phase combinations of localised Ae–Sn σ-bonding orbitals (see Fig. 10 for the illustrative example of complex 1′). As expected, they are largely Sn-polarised, with, from Ca to Sr and Ba, Sn(%)/Ae(%) compositions of 73/11, 78/8 and 76/9 for the HOMO and 71/13, 71/15 and 71/13 for the HOMO-1, respectively.
 |
| | Fig. 10 The highest occupied Kohn–Sham orbitals for [Ca(SnPh3)2·(thf)4] (1′). | |
A deeper understanding of the nature of the Ae–Sn bonding in the [Ae(SnPh3)2·(thf)4] series can be obtained by an energy decomposition analysis (EDA) of the interaction between two frozen molecular fragments, according to the Morokuma–Ziegler procedure.29 The decomposition of the total bonding energy (TBE) between the “solvated” cation [Ae(thf)4]2+ and the [Ph3Sn⋯SnPh3]2− dimeric fragment in the three [Ae(SnPh3)2·(thf)4] complexes (Ae = Ca (1′), Sr (2′) and Ba (3) is observed; note that the XRD structure of the tetrasolvate 3 was not determined, instead that of 3′ was established, vide supra) is provided in Table 4. TBE is expressed as the sum of four components: Pauli repulsion (EPauli), the electrostatic interaction energy (Eelstat), the orbital interaction energy (Eorb) and the component associated with the dispersion forces (Edisp). TBE decreases when descending group 2 from Ca to Ba, following the prevailing Eelstat variation. This component, which dominates TBE, is about 4 times larger than the Eorb covalency component; these relative contributions are diagnostic of a mixed iono-covalent Ae–Sn bonding. Surprisingly, the Eorb value for Ba is intermediate between that of Ca and Sr. This seemingly contradicts the monotonous variation of the Ae–Sn WBIs within the series (see Table 3). However, it is not always pertinent to compare WBI's associated with bonds made out of different elements, especially as in the present scenario when the differences between values are small. Another point of view can be provided by the Quantum Theory of Atoms in Molecules (QTAIM) approach.30 Selected QTAIM data are collated in Table 5. The AIM charges suggest a slightly more ionic character when Ae = Sr. On the other hand, the Ae–Sn delocalisation index increases when descending the Ae column, which is in apparent contradiction with the WBI variation. All the Ae–Sn bond critical point (bcp) indicators have small absolute values. The positive sign of the Laplacian density, the negative sign of the (very small) energy density and the ∣V∣/G ratio somewhat larger than 1 are compatible with a bonding dominated by an ionic interaction with some very polar covalent character. The AIM charges, as well as the H and ∣V∣/G variation, are consistent with the slightly smaller∣Eorb∣value found in the case of Sr (Table 3).
Table 4 Morokuma–Ziegler energy decomposition analysis in complexes [Ae(SnPh3)2·(thf)n] (Ae = Ca, Sr, Ba).a
| Fragmentation |
[Ae(thf)n]2+ + [(SnPh3)2]2− |
|
All values in eV.
Total bonding energy (TBE) = EPauli + Eelstat + Eorb + Edisp.
|
| Ae |
Ca (1′) |
Sr (2′) |
Ba (3) |
Ba (3′) |
Ba (3′) |
| (molecule 1) |
(molecule 2) |
|
n
|
4 |
4 |
4 |
5 |
5 |
|
E
Pauli
|
4.05 |
3.73 |
4.05 |
3.76 |
3.99 |
|
E
elstat
|
−13.66 |
−13.32 |
−13.22 |
−12.56 |
−12.76 |
|
E
orb
|
−3.35 |
−3.11 |
−3.26 |
−2.87 |
−2.91 |
|
E
disp
|
−1.32 |
−1.23 |
−1.29 |
−1.34 |
−1.33 |
| TBEb |
−14.28 |
−13.92 |
−13.72 |
−13.01 |
−13.01 |
Table 5 QTAIM descriptors of the Ae–Sn bonds in complexes [Ae(SnPh3)2·(thf)n] (Ae = Ca, Sr, Ba)a,b
|
Averaged values.
ρ , ∇2ρ, H, V and G are the electron density, Laplacian of ρ density, energy density, potential energy density and kinetic energy density values at the bcp, respectively. All values in a.u.
|
| Ae |
Ca (1′) |
Sr (2′) |
Ba (3) |
Ba (3′) (molecule 1) |
Ba (3′) (molecule 2) |
|
n
|
4 |
4 |
4 |
5 |
5 |
| Atom charge |
Ae |
1.57 |
1.59 |
1.57 |
1.59 |
1.59 |
| Sna |
0.74 |
0.72 |
0.74 |
0.75 |
0.75 |
| Oa |
−1.07 |
−1.06 |
−1.06 |
−1.05 |
−1.05 |
| Delocalisation index |
δ
|
0.21 |
0.22 |
0.25 |
0.23 |
0.24 |
| bcp indicatorsa |
ρ
|
0.024 |
0.022 |
0.022 |
0.020 |
0.021 |
| ∇2ρ |
+0.037 |
+0.032 |
+0.027 |
+0.026 |
+0.026 |
|
H
|
−0.003 |
−0.002 |
−0.003 |
−0.002 |
−0.002 |
|
V
|
−0.015 |
−0.013 |
−0.012 |
−0.011 |
−0.011 |
| ∣V∣/G |
1.24 |
1.23 |
1.26 |
1.24 |
1.25 |
To complete the series of the triphenylstannyl derivatives, we compared the computed data of the barium tetra- and penta-solvate species, [Ba(SnPh3)2·(thf)4] (3) and its crystallographically characterised congener [Ba(SnPh3)2·(thf)5] (3′) (Tables 3–5) They are consistent with a moderate weakening of the Ba–Sn bond upon increasing the number of coordinated thf molecules, without any important change of the electronic parameters. Incidentally, although their respective bending angles differ substantially (166 and 175°, Table 3), the two optimised molecules of 3′ exhibit similar computed data in Tables 3–5. This infers that reasonable bending at the Ae centre does not significantly affect the electronic structure of this type of complex.
The selected computed data for the other series of 6-coordinated complexes [Ae{Sn(SiMe3)3}2·(thf)4] (Ae = Ca (4), Sr (5) and Ba (i.e.6, the thf tetrasolvate parent of 6′ and, so far, not structurally characterised)) are gathered in Tables 3, 6 and 7. With 4 and 5, the quasi-linear Sn–Ae–Sn′ arrangements of the simulated structures match those in their XRD-determined structures (Tables 2 and 3). On the other hand, the Ba analogue is predicted to be significantly bent (162°). The other major difference between the triphenylstannyl and tris(trimethylsilyl)stannyl series is the NAO and AIM charges of Sn (Tables 3, 5 and 7). They are positive in the former (NAO ∼0.6 and AIM ∼0.7) while they are negative in the latter (NAO ∼−0.7 and AIM ∼−0.3). This large difference stems from the different electronic effects of the phenyl and trimethylsilyl substituents: interestingly, the trimethylsilyl electron-donating effect is not transferred to Ae, and hence the electron accumulation at the tin atoms remains localised on the silyl side. As a result, no substantial differences in the Ae charge and Ae–Sn bonding can be found between the two series of complexes. The computed Ae–Sn interatomic distances are slightly longer in the tris(trimethylsilyl)stannyl series than in the triphenylstannyl one, in agreement with the crystallographic data. Nevertheless, the corresponding TBE values in both series are close (Tables 4 and 6). As a whole, the EDA data indicate slightly stronger covalent bonding for the tris(trimethylsilyl)stannyl series, whereas the NBO and QTAIM results (Tables 4 and 7) suggest the opposite, although on the whole these differences are rather marginal. Comparison of the tetra- and penta-solvate barium species [Ba{Sn(SiMe3)3}2·(thf)4] and 6′ leads to the conclusions identical to those for their triphenylstannyl analogues; that is, increasing the number of solvated thf slightly weakens the Ba–Sn bonds, with little perturbation of the whole electronic situation. For the sake of comparison, the magnesium complex [Mg{Sn(SiMe3)3}2·(thf)2]18 was included in the computed series. Unsurprisingly, its computed data (Tables 3, 6 and 7) indicate significantly stronger bonding to tin compared to its heavier homologues; covalency is in particular more substantial for Ae = Mg.
Table 6 Morokuma–Ziegler energy decomposition analysis in complexes [Ae{Sn(SiMe3)3}2·(thf)n] where Ae = Mg,18 Ca (4), Sr (5) and Ba (6 and 6′)a
| Fragmentation |
[Ae(thf)n]2+ + [{Sn(SiMe3)3}2]2− |
|
All values in eV.
Total bonding energy (TBE) = EPauli + Eelstat + Eorb + Edisp.
|
| Ae |
Mg |
Ca (4) |
Sr (5) |
Ba (6) |
Ba (6′) |
|
n
|
2 |
4 |
4 |
4 |
5 |
|
E
Pauli
|
3.46 |
3.83 |
3.63 |
3.73 |
3.68 |
|
E
elstat
|
−15.28 |
−13.04 |
−12.96 |
−12.90 |
−12.35 |
|
E
orb
|
−6.49 |
−3.54 |
−3.29 |
−3.15 |
−3.04 |
|
E
disp
|
−0.83 |
−1.38 |
−1.28 |
−1.22 |
−1.39 |
| TBEb |
−19.14 |
−14.14 |
−13.90 |
−13.53 |
−13.10 |
Table 7 QTAIM descriptors of the Ae–Sn bonds in complexes [Ae{Sn(SiMe3)3}2·(thf)n] (Ae = Mg, Ca, Sr, Ba)a,b
|
Averaged values.
ρ , ∇2ρ, H, V and G are the electron density, Laplacian of ρ density, energy density, potential energy density and kinetic energy density values at the bcp, respectively. All values in a.u.
|
| Ae |
Mg |
Ca (4) |
Sr (5) |
Ba (6) |
Ba (6′) |
|
n
|
2 |
4 |
4 |
4 |
5 |
| Atom charge |
Ae |
1.55 |
1.57 |
1.59 |
1.57 |
1.58 |
| Sna |
−0.49 |
−0.32 |
−0.33 |
−0.32 |
−0.30 |
| Oa |
−1.09 |
−1.06 |
−1.06 |
−1.05 |
−1.05 |
| Delocalisation index |
δ
|
0.27 |
0.20 |
0.22 |
0.27 |
0.24 |
| bcp indicatorsa |
ρ
|
0.032 |
0.021 |
0.021 |
0.0021 |
0.019 |
| ∇2ρ |
+0.050 |
+0.030 |
+0.030 |
+0.027 |
+0.024 |
|
H
|
−0.005 |
−0.002 |
−0.002 |
−0.003 |
−0.002 |
|
V
|
−0.023 |
−0.012 |
−0.012 |
−0.0012 |
−0.010 |
| ∣V∣/G |
1.29 |
1.21 |
1.22 |
1.27 |
1.24 |
NMR spectroscopy
Complexes 1–6 were characterised in solution by high resolution multinuclear NMR spectroscopy. The spectra for the poorly soluble 1–3 were recorded in thf-d8, while benzene-d6 was used for the more soluble 4–6. Representative NMR data for the two families of complexes are collated in Table 8 and Table 9. The relative integrations of the resonances for aliphatic and aromatic hydrogens in the 1H NMR spectra of 1–3 showed the presence of three thf molecules for 1 and 2, and four molecules for 3. NMR monitoring over the course of several weeks indicated that these complexes slowly decompose in solution at room temperature to generate different products in variable quantities. In particular SnPh4 and Ph3SnSnPh3 could be identified spectroscopically (δ119Sn = −128.8 and −143.6 ppm, respectively); the precipitation of a dark grey powder, assumed to be elemental tin(0), was also visible. Note that as the NMR data for the dry compounds 1–3 were recorded in thf-d8, it is likely that they will bind additional thf molecules in this solvent. It is legitimate to assume that the measured chemical shifts correspond to those for more solvated species akin to 1′, 2′ and 3′ with respectively four, four and five coordinated molecules of thf and/or thf-d8; they are considered as such hereafter, assuming that the presence of coordinated thf-d8 instead of non-deuterated thf bears no incidence on 119Sn NMR data.
Table 8 Summary of NMR spectroscopic data for complexes [Ae(SnPh3)2·(thf/thf-d8)x] (Ae = a, x = 4, 1′; Sr, x = 4, 2′; Ba, x = 5, 3′)a
|
|
119Sn{1H} NMR |
13C{1H} NMR |
|
ipso-C |
ortho-C |
meta-C |
para-C |
|
δ
119Sn |
Δν1/2 |
|1J119Sn–13C| |
δ
13C |
|1J13C–117/119Sn| |
δ
13C |
|2J13C–117/119Sn| |
δ
13C |
|3J13C–117/119Sn| |
δ
13C |
| [ppm] |
[Hz] |
[Hz] |
[ppm] |
[Hz] |
[ppm] |
[Hz] |
[ppm] |
[Hz] |
[ppm] |
|
NMR data recorded in thf-d8 from crystalline samples of 1–3, assumed to generate the higher solvates 1′, 2′ and 3′ in this solvent. Chemical shifts in ppm and coupling constants in Hz.
n.d. = not detectable.
|
| [Ca(SnPh3)2·(thf)4] (1′) |
−133.4 |
67 |
n.db |
157.97 |
88.9 |
138.93 |
43.5 |
127.76 |
13.4 |
125.87 |
|
| [Sr(SnPh3)2·(thf)4] (2′) |
−123.6 |
63 |
n.db |
160.26 |
134.6 |
139.01 |
45.6 |
127.52 |
10.9 |
125.44 |
|
| [Ba(SnPh3)2·(thf)5] (3′) |
−95.5 |
24 |
n.db |
160.78 |
117Sn = 138.9 |
139.02 |
46.1 |
127.60 |
10.0 |
125.49 |
|
119Sn = 143.1 |
Table 9 Summary of NMR spectroscopic data for complexes [Ae{Sn(SiMe3)3}2·(thf)x] (Ae = Mg, Ca, Sr, Ba)a
|
|
119Sn{1H} NMR |
29Si{1H} NMR |
|
13C{1H} NMR |
|
δ
119Sn |
|nJX–Y| |
δ
29Si |
|nJX–Y| |
δ
13C |
|nJX–Y| |
| [ppm] |
[Hz] |
[ppm] |
[Hz] |
[ppm] |
[Hz] |
|
NMR data recorded in benzene-d6 from crystalline samples. Chemical shifts given in ppm and coupling constants in Hz.
n.d. = not detectable.
|
| [Mg{Sn(SiMe3)3}2·(thf)2]17 |
−830.2 |
|1J119Sn–29Si| = 123 |
−12.3 |
|1J29Si–119Sn| = 123 |
6.55 |
|2J13C–117/119Sn| = 28 |
| |1J29Si–117Sn| = 117 |
|
|
| [Ca{Sn(SiMe3)3}2·(thf)4] |
(4) |
−856.8 |
|1J119Sn–29Si| = 82.1 |
−12.9 |
|1J29Si–119Sn| = 82.9 |
7.76 |
|1J13C–29Si| = 36.7 |
| |2J119Sn–117Sn| = 455.0 |
|1J29Si–117Sn| = 79.0 |
|2J13C–117/119Sn| = 19.3 |
| |1J29Si–13C| = 36.7 |
| |3J29Si–117/119Sn| = 2.7 |
|
|
| [Sr{Sn(SiMe3)3}2·(thf)4] |
(5) |
−848.2 |
|1J119Sn–29Si| = 98.8 |
−12.9 |
|1J29Si–119Sn| = 98.8 |
7.88 |
|1J13C–29Si| = 36.7 |
| |2J119Sn–117Sn| = 582.2 |
|1J29Si–117Sn| = 94.4 |
|2J13C–117/119Sn| = 20.8 |
| |1J29Si–13C| = 36.5 |
| |3J29Si–117/119Sn| = 3.6 |
|
|
| [Ba{Sn(SiMe3)3}2·(thf)4] |
(6) |
−792.7 |
|1J119Sn–29Si| = 116.7 |
−11.1 |
|1J29Si–119Sn| = 116.9 |
8.06 |
|1J13C–29Si| = 36.7 |
| |2J119Sn–117Sn| = 772.1 |
|1J29Si–117Sn| = 111.8 |
|2J13C–117/119Sn| = 20.8 |
| |1J29Si–13C| = 36.5 |
On the whole, the three complexes 1′–3′ give rise to easily detectable and sharp singlets (Δν1/2 = 24–67 Hz) by 119Sn{1H} NMR spectroscopy in thf-d8 (Table 8). A substantial downfield shift is observed as the electropositivity of the Ae metal increases (δ119Sn: Ca, −133.4 ppm; Sr, −123.6 ppm; Ba, −95.5 ppm). Small variations of δ119Sn were also detected in the homologous series of alkali stannyls [{18-c-6}MSn(SiMe3)3] for M = K, Rb and Cs (δ119Sn = −892.2, −890.3 and −899.4 ppm, respectively), but the magnitude of the shift in that latter case was much lower than for 1′–3′.17
The absolute values of the coupling constants |nJ119Sn–13C|31,32 could not be extracted from the 119Sn{1H} NMR spectra of 1′–3′, but they could be obtained from their 13C{1H} spectra, for n = 1–3. In particular, the indirect spin–spin coupling constant |1J119Sn–13C| to ipso increases from Ca (88.9 Hz) to Sr (134.6 Hz) and Ba (143.1 Hz). By comparison, the coupling constants to ortho and meta carbon atoms do not change to a significant level between the three complexes. Comparison of the data for 1′ and its methyl-substituted congener [Ca(SnMe3)2·(thf)4]10 indicate that in 1′, the singlet in the 119Sn{1H} NMR spectrum is considerably deshielded (δ119Sn = −133.4 vs. −203.3 ppm, respectively) while the 1J119Sn–13C coupling constant is lower (88.9 vs. 106.3 Hz).
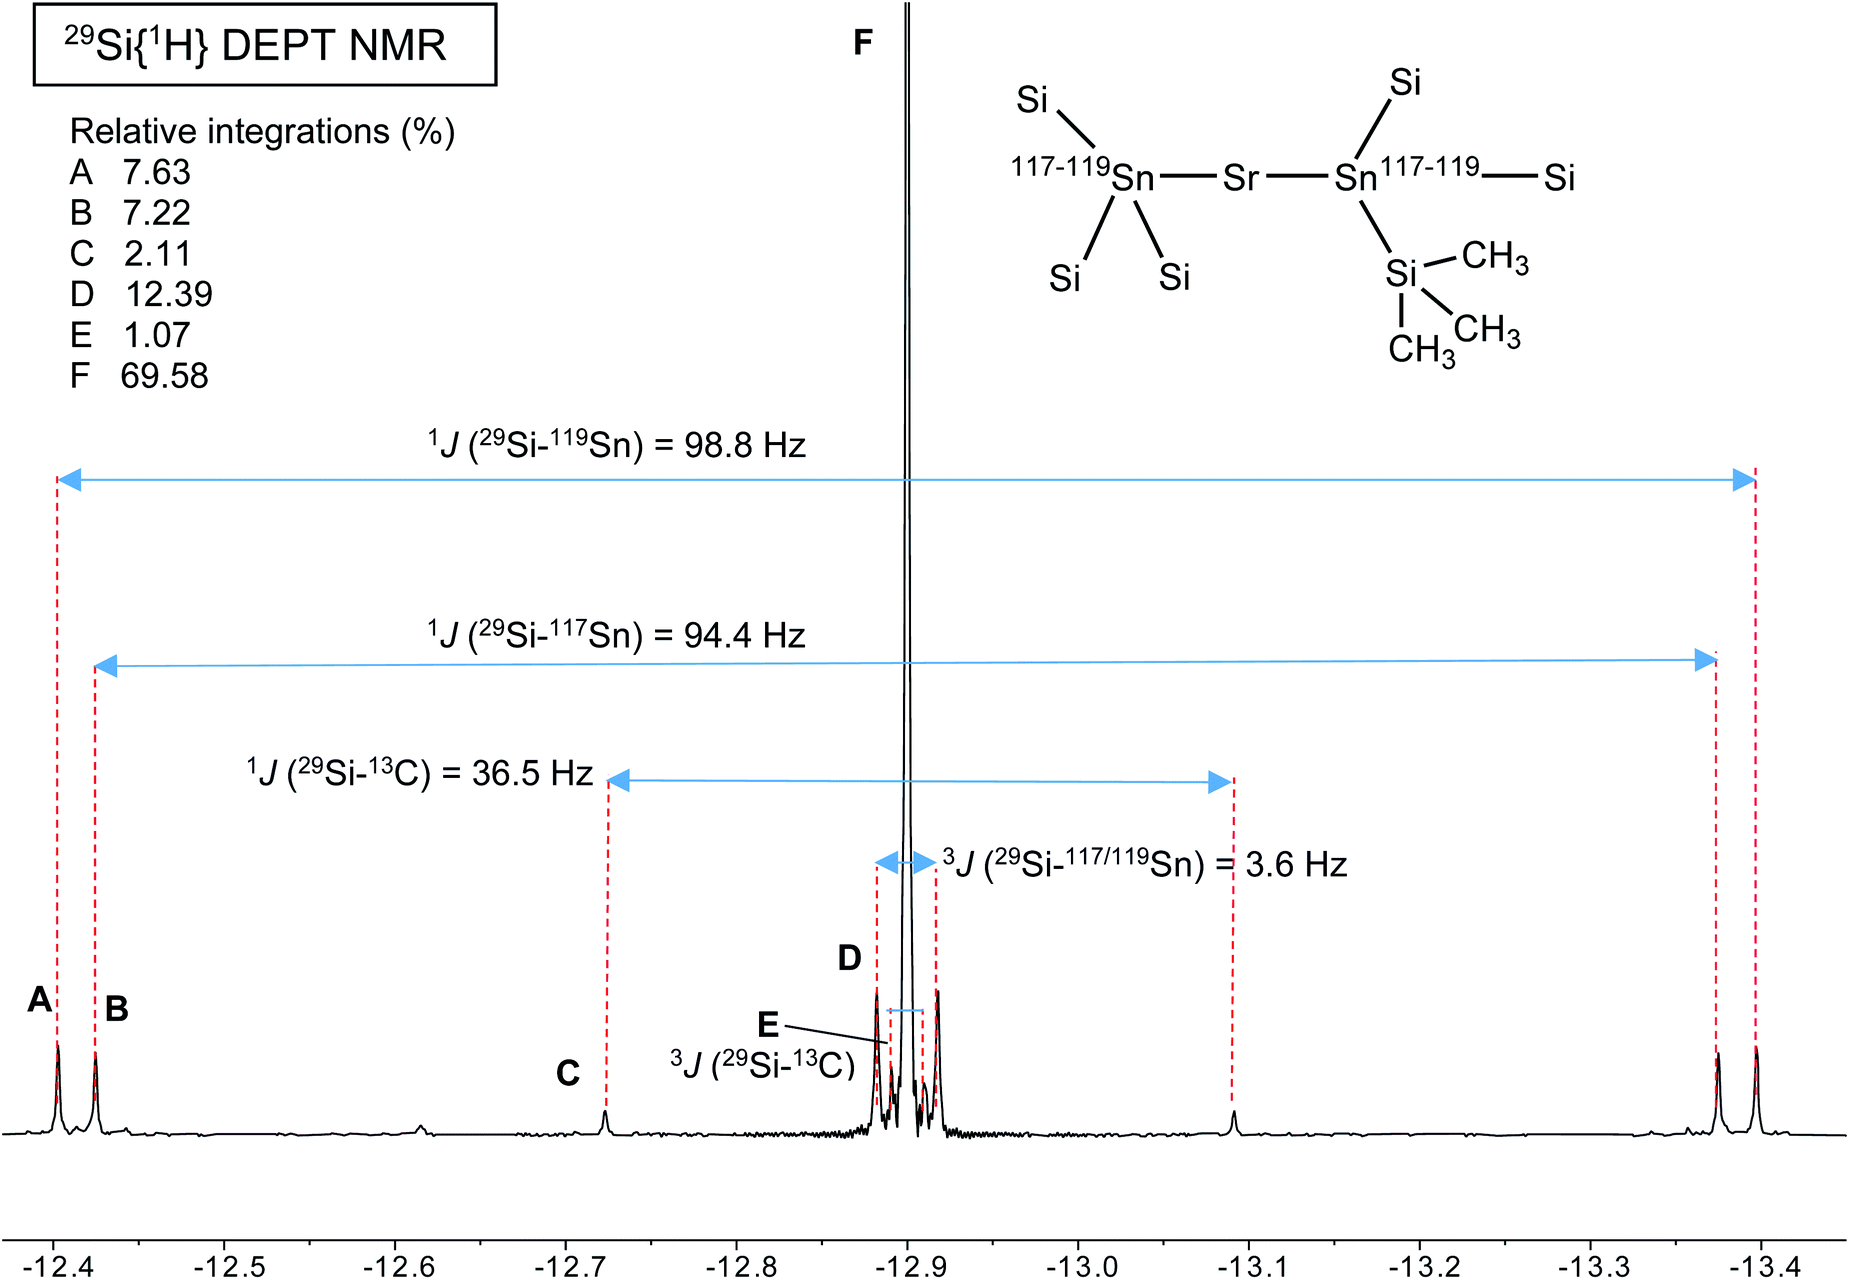
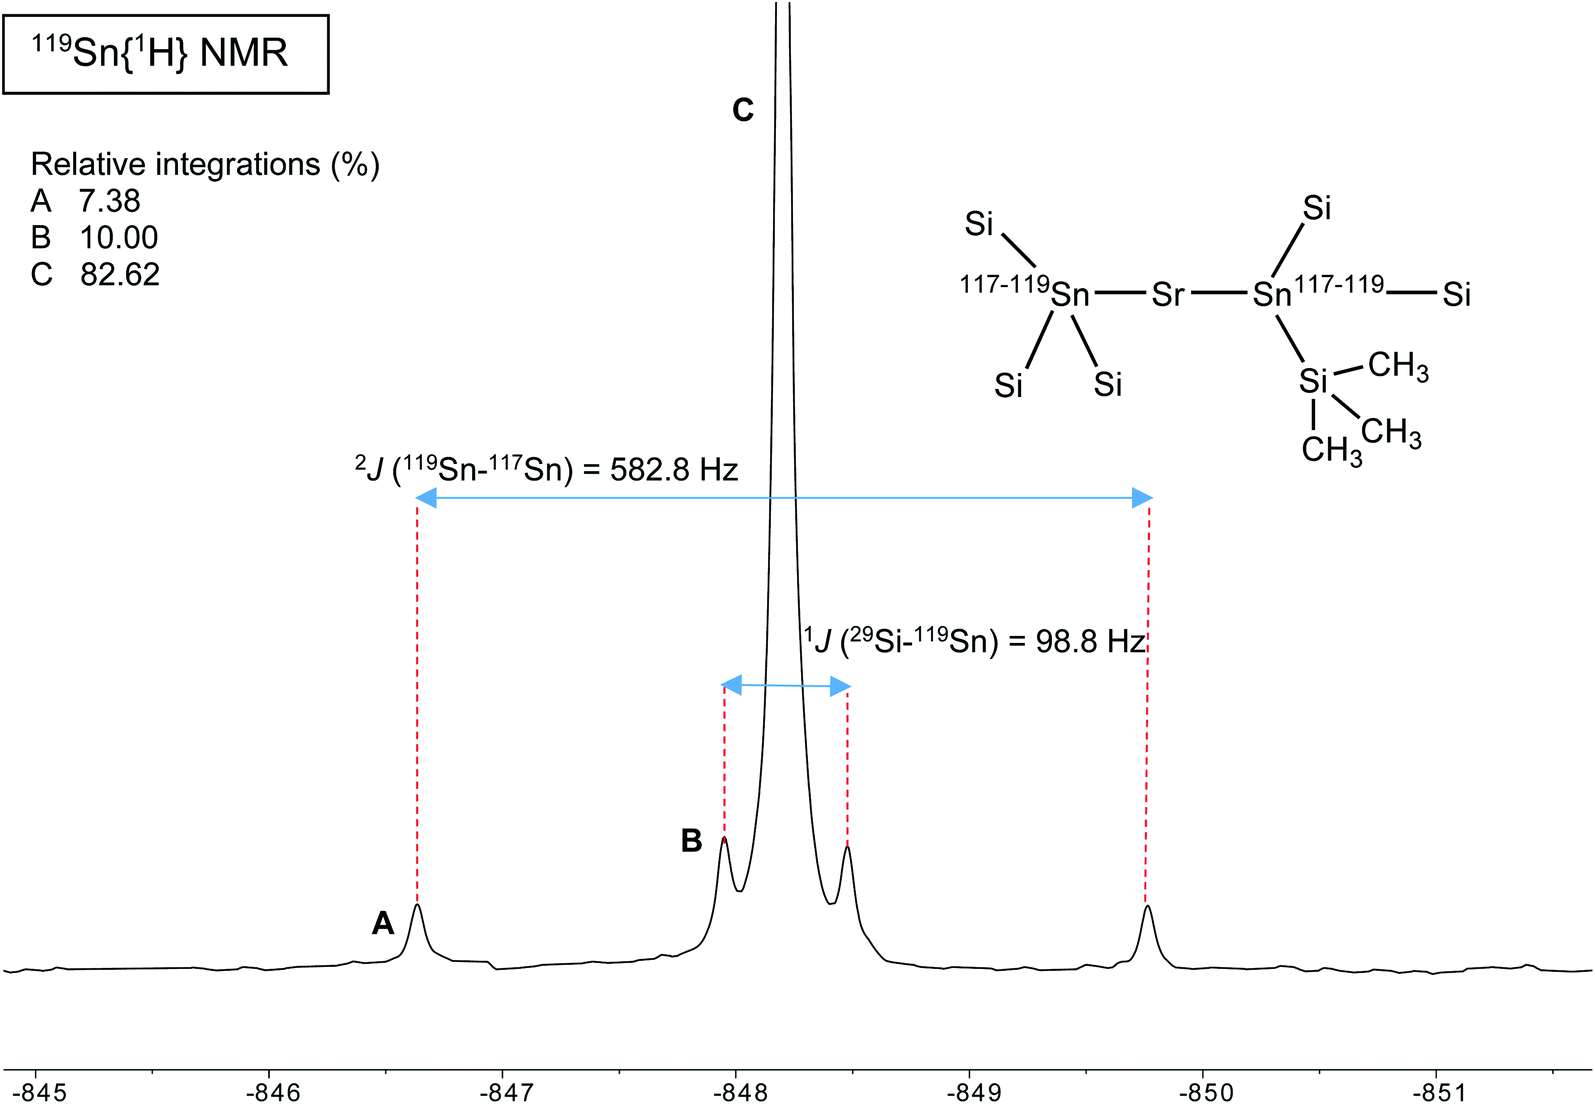
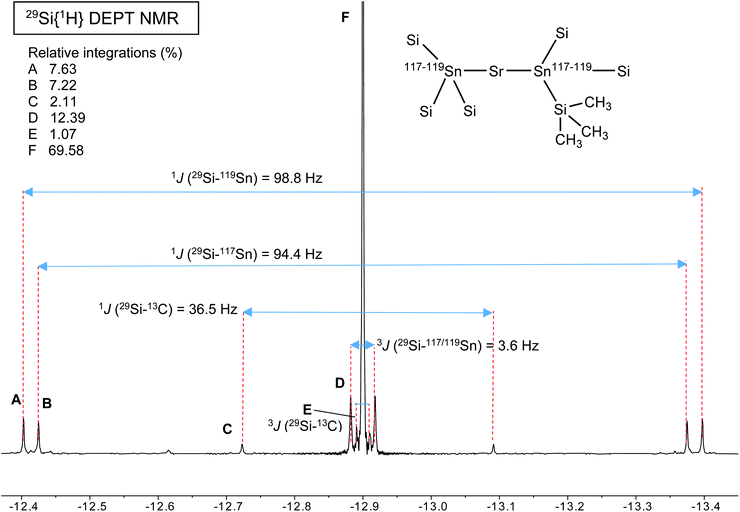
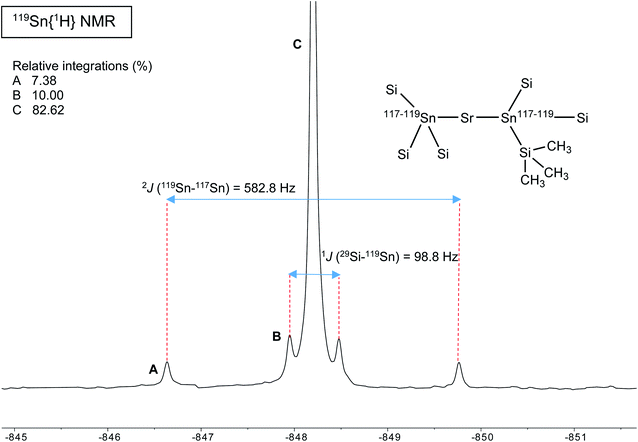
A different situation arises with the bulky distannyls [Ae{Sn(SiMe3)3}2·(thf)x] 4–6, for which the NMR data could be recorded in benzene-d6. Decomposition of 4–6 is significantly slower than for complexes 1–3. Solutions of 4–6 in C6D6 did precipitate small amounts of elemental tin over several weeks, though 1H and 119Sn NMR indicated that dismutation is slow. The other by-products, R6Sn2 and R4Sn, are only minor impurities (<5%) after 2 weeks in solution at 25 °C. All NMR spectra were recorded for the three compounds; note that the chemical shifts recorded in thf-d8 were very similar to those in benzene-d6 (see the ESI†). The most representative data are collected in Table 9, whereas illustrative 13C{1H} and 29Si{1H}-DEPT spectra for the strontium complex 5 are displayed in Fig. 11 and 12. The 119Sn{1H} NMR spectrum of this complex contains a single, sharp resonance at δ119Sn = −848.2 ppm. Its 1H NMR spectrum is not particularly informative, although it confirms the presence of four coordinated thf molecules per metal with resonances of the expected intensities at δ1H = 3.85 and 1.49 ppm. Table 9 shows that the 119Sn{1H} NMR chemical shifts are again increasingly low-field shifted when the size of the metal increases. Besides, the values δ119Sn for the [Ae{Sn(SiMe3)3}2·(thf)x] complexes 4–6 (−856.8, −848.2 and −792.7 ppm) are much more shielded than those for 1′–3′ (−133.4, −123.6 and −95.5 ppm). These variations agree with the known tendency of tin compounds to undergo large upfield shifts upon replacement of an alkyl or aryl group by alkylsilyl substituents, compare for instance δ119Sn for SnMe4 (0.0 ppm), SnPh4 (−128.8 ppm), Me3SnSiMe3 (−126.7 ppm), Me3Sn(cyclo-Si6Me11) (−168.5 ppm) and Ph3Sn(cyclo-Si6Me11) (−149.5 ppm).31,33 It is also consistent with the large change of the computed Sn atomic charges when going from the triphenylstannyl to the tris(trimethylsilyl)stannyl series (see Tables 3, 5 and 7). The DFT-calculated δ119Sn values for 4–6 are −898, −924 and −848 ppm, respectively. They agree well with the experimental data, including for the barium derivative 6. The values of the 119Sn{1H} and 29Si{1H} NMR chemical shifts for 4–6 (the latter also shift downfield on moving from Ca to Sr and Ba) are in the range of those measured for a variety of Lewis base adducts of the alkali stannyls MSn(SiMe3)3 where M = Li, Na, K, Rb, Cs.17 The absolute coupling constants |1J29Si–119Sn| (82.9, 98.8 and 116.9 Hz) and |1J29Si–117Sn| (79.0, 94.4 and 111.8 Hz) for 4–6 increase regularly from Ca to Ba; yet, they are much smaller than those for these alkali salts, found in the range 200–300 Hz. Finally, the intensity of the |2J119Sn–117Sn| coupling across the Ae metal increases noticeably from Ca (4, 455.0 Hz) to Sr (5, 582.2 Hz) and Ba (6, 772.1 Hz).
 |
| | Fig. 11
29Si{1H} DEPT NMR spectrum (99.36 MHz, benzene-d6, 298 K) of [Sr{Sn(SiMe3)3}2·(thf)4] (4). | |
 |
| | Fig. 12
119Sn{1H} NMR spectrum (186.36 MHz, benzene-d6, 298 K) of [Sr{Sn(SiMe3)3}2·(thf)4] (4). | |
Concluding remarks
Compounds [Ae(SnPh3)2·(thf)x] 1–3 and [Ae{Sn(SiMe3)3}2·(thf)x] 4–6 are available in high yields and purity. They represent the first families of homologous alkaline-earth stannylenes with the large Ae metals Ca, Sr and Ba, and complement the handful of related complexes that display Ae–Sn unsupported bonds.10–13 Beyond Westerhausen's seminal [Ca(SnMe3)2·(thf)4],10 they also are the sole sets of homoleptic Ae stannylides available to date. The compounds are highly air-sensitive but are nonetheless reasonably stable as solids under an inert atmosphere. However, storage at low temperature is recommended to avoid slow decomposition that may occur at room temperature, with, in particular, the potential release of elemental tin(0) through dismutation processes as suggested by the formation of the oxidised species R4Sn and R3SnSnR3 detected in solution.
The complexes have all been characterised by XRD crystallography. The crystallised complexes often contained additional coordinated thf molecules compared to the dry solids, as for instance in [Ba{Sn(SiMe3)3}2·(thf)5] (6′), obtained upon recrystallisation of the tetrasolvate [Ae{Sn(SiMe3)3}2·(thf)4] (6) in the presence of thf. [Ba{Sn(SiMe3)3}2·(thf)5] (3′) and 6′ crystallise as seven-coordinate complexes, with five metal-bound equatorial thf molecules; all other calcium and strontium complexes were recrystallised as the six-coordinate [Ae{SnR3}2·(thf)4] for R = Ph or SiMe3. This difference is assumed to result from the larger size and greater electropositivity of barium. The stannyl groups systematically occupy the two axial positions in structure of all complexes. Some unusual geometrical features were detected in the molecular structures of the octahedral [Ca(SnPh3)2·(thf)4] (1′) and [Sr(SnPh3)2·(thf)4] (2′), notably the peculiar parallel arrangement of thf and aromatic rings and unexpected intramolecular C–H⋯C(π) interactions. DFT calculations suggest that these properties are the outcome of the bending of the Sn–Ae–Sn′ angle away from linearity in these distorted octahedra.
The complexes were also fully characterised in solution by high-resolution NMR spectroscopy. Notably, clear and sharp resonances were detected in the 119Sn{1H} spectra, where the values of δ119Sn are deshielded upon going from Ca to Sr and Ba in both series of complexes. Yet, within a given series, the observed variations of chemical shifts (ca. 40–60 ppm) remain small with respect to the range of known chemical shifts (ca. +4000 to −2500 ppm) in 119Sn NMR. This is consistent with a large degree of charge separation between the Ae2+ cation and the two SnR3− ligands. The shifts observed between the resonances across the two families for [Ae(SnPh3)2·(thf)x] (in thf-d8: Ae = Ca, x = 4, 1′, δ −133.4 ppm; Sr, x = 4, 2′, δ −123.6 ppm; Ba, x = 5, 3′, δ −95.5 ppm) and for [Ae{Sn(SiMe3)3}2·(thf)4] (in benzene-d6: Ae = Ca, 4, δ −856.8 ppm; Sr, 5, δ −848.2 ppm; Ba, 6, δ −792.7 ppm; the chemical shifts recorded in thf-d8 are very similar) are perhaps more representative of the nature of the tin-bound substituents. Deconvolution of the corresponding isotropic shielding σ into its three components, the diamagnetic, paramagnetic and spin–orbit shieldings σP, σD and σSO,31 and detailed DFT analysis are required to extract the essence of these chemicals shifts. Although this is beyond the scope of the present work, we will endeavour to provide more insight in a future report. Note however that DFT computations reproduce reasonably well δ119Sn for complexes 4–6 (δcalc119Sn −898, −924 and −848 ppm), while the agreement was poorer for 1′–3′ (δcalc119Sn −159, −162 and −174 ppm, respectively), or at least for 3′, due to reasons that remain unclear at this stage.
A comprehensive DFT investigation, completed with NBO, EDA and QTAIM analyses, of the whole series of complexes found a primarily ionic character of the Ae–Sn bonding, whereas the weak covalent component of the bond decreases from (Mg and then) Ca to Ba. The Sn–Ae–Sn′ bond angle is associated with a particularly flat energy potential surface around its minimum, thus explaining the large range of experimental and computed values obtained for this angle within the whole series.
The work presented herein usefully complements the growing body of information regarding the structural and bonding features of the once frowned-upon large Ae metals. The main group elements, and in particular calcium, strontium and barium, are now being intensively investigated both for their reactivity, in particular for homogenous catalysis where they appear as viable alternatives to mainstream transition metal complexes, and for their burgeoning inorganic chemistry. Unsuspected electronic and bonding properties are now being unravelled with these metals,2,6,11–13,34–37 and this study of heterobimetallic compounds featuring Ae–Sn bonds constitutes the initial step in a wider research program aimed at exploring and exploiting the specificities of the bonding between s- and p-block metals.
Author contributions
P. M. Chapple performed synthetic experimental work and data analysis, and assisted in writing of the draft. M. Cordier performed the XRD analyses. J.-Y. Saillard, J. Cartron and S. Kahlal carried out all computational work and took part to the writing of the draft. J.-F. Carpentier participated to the design of experiments and analysis of experimental data. H. Oulyadi and G. Hamdoun performed NMR analysis on compounds 4, 5 and 6. Y. Sarazin was the lead investigator; he participated to the design of experiments, analysis of experimental data and writing of the draft.
Conflicts of interest
There are no conflicts to declare.
Acknowledgements
P.M.C, J.-F.C. and Y.S. are thankful to the Agence National de la Recherche for the provision of a research grant (ANR-17-CE07-0017-01). The GENCI (Grand Equipment National de Calcul Intensif) is acknowledged for HPC resources (Project A0050807367). HO and GH would like to thank the Region Normandie, Rouen University, CNRS, INSA of Rouen, ERDF and the Labex SynOrg (ANR-11-LABX-0029).
Notes and references
-
(a) S. Harder, Chem. Rev., 2010, 110, 3852 CrossRef CAS PubMed;
(b) M. R. Crimmin and M. S. Hill, Top. Organomet. Chem., 2013, 45, 191 CrossRef CAS;
(c) M. S. Hill, D. J. Liptrot and C. Weetman, Chem. Soc. Rev., 2016, 45, 972 RSC;
(d) Y. Sarazin and J.-F. Carpentier, Chem. Rec., 2016, 16, 2482 CrossRef CAS PubMed;
(e)
Early Main Group Metal Catalysis: Concepts and Reactions, ed. S. Harder, Wiley-VCH Verlag GmbH & Co, 2020 Search PubMed.
- A. S. S. Wilson, M. S. Hill, M. F. Mahon, C. Dinoi and L. Maron, Science, 2017, 358, 1168 CrossRef CAS PubMed.
-
(a) A. S. S. Wilson, C. Dinoi, M. S. Hill, M. F. Mahon and L. Maron, Angew. Chem., Int. Ed., 2018, 57, 15500 CrossRef CAS PubMed;
(b) A. S. S. Wilson, M. S. Hill and M. F. Mahon, Organometallics, 2019, 38, 351 CrossRef CAS;
(c) M. S. Hill, M. F. Mahon, A. S. S. Wilson, C. Dinoi, L. Maron and E. Richards, Chem. Commun., 2019, 55, 5732 RSC;
(d) B. Rösch, T. X. Gentner, H. Elsen, C. A. Fischer, J. Langer, M. Wiesinger and S. Harder, Angew. Chem., Int. Ed., 2019, 58, 5396 CrossRef PubMed;
(e) A. S. S. Wilson, C. Dinoi, M. S. Hill, M. F. Mahon, L. Maron and E. Richards, Angew. Chem., Int. Ed., 2020, 59, 1232 CrossRef CAS PubMed.
-
(a) L. H. Gade, Angew. Chem., Int. Ed., 2000, 39, 2658 CrossRef CAS;
(b)
Multiple Bonds Between Metal Atoms, ed.F. A. Cotton, C. A. Murillo and R. A. Walton, Springer, New York, 2005 Search PubMed;
(c)
Molecular Metal-Metal Bonds. Compounds, Synthesis, Properties, ed. S. Liddle, Wiley-VCH, Weinheim, 2015 Search PubMed.
-
(a) S. P. Green, C. Jones and A. Stasch, Science, 2007, 318, 1754 CrossRef CAS PubMed;
(b) C. Jones and A. Stasch, Top. Organomet. Chem., 2013, 45, 73 CrossRef CAS.
-
(a) M. P. Blake, N. Kaltsoyannis and P. Mountford, J. Am. Chem. Soc., 2011, 133, 15358 CrossRef CAS PubMed;
(b) M. P. Blake, N. Kaltsoyannis and P. Mountford, J. Am. Chem. Soc., 2015, 137, 12352 CrossRef CAS PubMed.
-
(a) C. Jones, D. P. Mills, J. A. Platts and R. P. Rose, Inorg. Chem., 2006, 45, 3146 CrossRef CAS PubMed;
(b) O. Bonello, C. Jones, A. Stasch and W. D. Woodul, Organometallics, 2010, 29, 4914 CrossRef CAS.
- Ga(I)→Ae dative bonds are found in [(η5-C5Me5)2Ca–Ga(η5-C5Me5)], [(η5-C5Me5)2(thf)Sr–Ga(η5-C5Me5)] and [(η5-C5Me5)2Ba{Ga(η5-C5Me5)}2], M. Wiecko, P. W. Roesky, P. Nava, R. Ahlrichs and S. N. Konchenko, Chem. Commun., 2007, 927 RSC.
- R. J. Schwamm, M. P. Coles, M. S. Hill, M. F. Mahon, C. L. McMullin, N. A. Rajabi and A. S. S. Wilson, Angew. Chem., Int. Ed., 2020, 59, 3928 CrossRef CAS PubMed.
- M. Westerhausen, Angew. Chem., Int. Ed. Engl., 1994, 33, 1493 CrossRef.
-
(a) L. J. Morris, M. S. Hill, I. Manners, C. L. McMullin, M. F. Mahon and N. A. Rajabi, Chem. Commun., 2019, 55, 12964 RSC;
(b) L. J. Morris, N. A. Rajabi, M. F. Mahon, I. Manners, C. L. McMullin and M. S. Hill, Dalton Trans., 2020, 49, 10523 RSC.
- P. M. Chapple, S. Kahlal, J. Cartron, T. Roisnel, V. Dorcet, M. Cordier, J.-Y. Saillard, J.-F. Carpentier and Y. Sarazin, Angew. Chem., Int. Ed., 2020, 59, 9120 CrossRef CAS PubMed.
- P. M. Chapple, M. Cordier, V. Dorcet, T. Roisnel, J.-F. Carpentier and Y. Sarazin, Dalton Trans., 2020, 49, 11878 RSC.
-
(a) W. Teng, U. Englich and K. Ruhlandt-Senge, Angew. Chem., Int. Ed., 2003, 42, 3661 CrossRef CAS PubMed;
(b) W. Teng and K. Ruhlandt-Senge, Organometallics, 2004, 23, 952 CrossRef CAS;
(c) W. Teng and K. Ruhlandt-Senge, Organometallics, 2004, 23, 2694 CrossRef CAS;
(d) V. Leich, T. P. Spaniol, L. Maron and J. Okuda, Chem. Commun., 2014, 50, 2311 RSC;
(e) N. L. Lampland, A. Pindwal, K. K. Yan, A. Ellern and A. D. Sadow, Organometallics, 2017, 36, 4546 CrossRef CAS.
- Elemental calcium was shown to react with a seven-fold excess of Me3SnSnMe3 in thf to yield [Ca{Sn(SnMe3)3}2·(thf)4], although structural data were not available; see ref. 10.
- U. Englich, K. Ruhlandt-Senge and F. Uhlig, J. Organomet. Chem., 2000, 613, 139 CrossRef CAS.
- R. Fischer, J. Baumgartner, C. Marschner and F. Uhlig, Inorg. Chim. Acta, 2005, 358, 3174 CrossRef CAS.
- D. Matioszek, N. Katir, S. Ladeira and A. Castel, Organometallics, 2011, 30, 2230 CrossRef CAS.
- Bond dissociation energies: Sn–Si, 233(7.8) kJ mol−1 in SiSn; Sn–Sn, 140–183 kJ mol–1 in Sn2 and Sn3 molecules. See: A. Ciccioli, G. Gigli and G. Meloni, Chem. – Eur. J., 2009, 15, 9543 CrossRef CAS PubMed.
- B. Liu, V. Dorcet, L. Maron, J.-F. Carpentier and Y. Sarazin, Eur. J. Inorg. Chem., 2012, 3023 CrossRef CAS.
- N. Muller and D. E. Pritchard, J. Chem. Phys., 1959, 31, 1471 CrossRef CAS.
- M. Veith, S. Weidner, K. Kunze, D. Käfer, J. Hans and V. Huch, Coord. Chem. Rev., 1994, 137, 297 CrossRef CAS.
- The unusual coordination number of 7 for the barium complex 3′ (as well as its Ba derivative 6′) can be seen in the light of the relatively long Ba-Sn interatomic distances. For highly ionic compounds, the overall balance between coordinative saturation (maximising stabilising attractive electrostatic interactions) and intramolecular steric repulsion is the driving force for the final coordination number; long Ba-Sn bonds make the Ba2+ cation accessible to a larger number of Lewis bases (thf in the present case) than other E-substituents with shorter Ba-E distances would..
- P. Garcia-Fernandez, I. B. Bersuker and J. E. Boggs, J. Phys. Chem. A, 2007, 111, 10409 CrossRef CAS PubMed.
- S. Grimme, J. Comput. Chem., 2006, 27, 1787 CrossRef CAS PubMed.
- M. Hargittai, Chem. Rev., 2000, 100, 2233 CrossRef CAS PubMed.
- J. B. Levy and M. Hargittai, J. Phys. Chem. A, 2000, 104, 1950 CrossRef CAS.
- K. J. Donald and R. Hoffmann, J. Am. Chem. Soc., 2006, 128, 11236 CrossRef CAS PubMed.
-
(a) K. Morokuma, J. Chem. Phys., 1971, 55, 1236 CrossRef CAS;
(b) T. Ziegler and A. Rauk, Inorg. Chem., 1979, 18, 1558 CrossRef CAS;
(c)
F. M. Bickelhaupt and E. J. Baerends, Rev. Comput. Chem., ed. K. B. LCowitz and D. B. Boyd, Wiley, New York 2000, vol. 15, p.
1 Search PubMed.
-
(a)
R. F. W. Bader, Atoms in Molecules-A Quantum Theory, Oxford University Press, Oxford, England, 1990 Search PubMed;
(b)
P. L. A. Popelier, in The Chemical Bond, ed. G. Frenking and S. Shaik, Wiley-VCH, 2014, vol. 1, pp. 271–308 Search PubMed.
-
Tin Chemistry: Fundamentals, Frontiers, and Applications, ed. M. Gielen, A. G. Davies, K. Pannell and E. Tiekink, John Wiley & Sons, Chichester, 2008 Search PubMed.
- Indirect nJ119Sn-X spin-spin coupling constants to a nucleus X can be either positive or negative. The gyromagnetic ratio γ(119Sn), −10.0318 × 10⁻⁷ rad s−1 T−1, is negative. For the determination of the sign of coupling, see: B. Wrackmeyer, Indirect nuclear 119Sn-X Coupling, in Advanced Applications of NMR to Organometallic Chemistry, ed. M. Gielen, R. Willem and B. Wrackmeyer, John Wiley & Sons, Chichester, 1996, pp. 87–122 Search PubMed.
- U. Englich, E. Hengge, U. Hermann, C. Marschner, K. Ruhlandt-Senge and F. Uhlig, J. Organomet. Chem., 2000, 605, 22 CrossRef CAS.
-
(a) X. Wu, L. Zhao, J. Jin, S. Pan, W. Li, X. Jin, G. Wang, M. Zhou and G. Frenking, Science, 2018, 361, 912 CrossRef CAS PubMed;
(b) P. Stegner, C. Färber, J. Oetzel, U. Siemeling, M. Wiesinger, J. Langer, S. Pan, N. Holzmann, G. Frenking, U. Albold, B. Sarkar and S. Harder, Angew. Chem., Int. Ed., 2020, 59, 14615 CrossRef CAS PubMed.
- S. Krieck, H. Görls, L. Yu, M. Reiher and M. Westerhausen, J. Am. Chem. Soc., 2009, 131, 2977 CrossRef CAS PubMed.
-
(a) A. Causero, H. Elsen, J. Pahl and S. Harder, Angew. Chem., Int. Ed., 2017, 56, 6906 CrossRef CAS PubMed;
(b) M. D. Anker, C. E. Kefalidis, Y. Yang, J. Fang, M. S. Hill, M. F. Mahon and L. Maron, J. Am. Chem. Soc., 2017, 139, 10036 CrossRef CAS PubMed;
(c) S. Brand, H. Elsen, J. Langer, S. Grams and S. Harder, Angew. Chem., Int. Ed., 2019, 58, 15496 CrossRef CAS PubMed;
(d) A. S. S. Wilson, C. Dinoi, M. S. Hill, M. F. Mahon, L. Maron and E. Richards, Angew. Chem., Int. Ed., 2020, 59, 1232 CrossRef CAS PubMed.
-
(a) G. Liu, N. Fedik, C. Martinez-Martinez, S. M. Ciborowski, X. Zhang, A. I. Boldyrev and K. H. Bowen, Angew. Chem., Int. Ed., 2019, 58, 13789 CrossRef CAS PubMed;
(b) S. Pan and G. Frenking, Angew. Chem., Int. Ed., 2020, 59, 8756 CrossRef CAS PubMed;
(c) G. Liu, N. Fedik, C. Martinez-Martinez, S. M. Ciborowski, X. Zhang, A. I. Boldyrev and K. H. Bowen, Angew. Chem., Int. Ed., 2020, 59, 8760 CrossRef CAS PubMed;
(d) P. Salvador, E. Vos, I. Corral and D. M. Andrada, Angew. Chem., Int. Ed., 2021, 60, 1498 CrossRef CAS PubMed.
Footnote |
| † Electronic supplementary information (ESI) available: synthetic procedures, spectroscopic data, XRD diffraction analysis for compounds 1′, 2′, 3′, 4, 5 and 6′. CCDC [2051213–2051218] and cartesian coordinates of the DFT-optimised geometries. For ESI and crystallographic data in CIF or other electronic format see DOI: 10.1039/d1sc00436k |
|
| This journal is © The Royal Society of Chemistry 2021 |
Click here to see how this site uses Cookies. View our privacy policy here. 
 Open Access Article
 This Open Access Article is licensed under a Creative Commons Attribution-Non Commercial 3.0 Unported Licence
 a,
Julien
Cartron
a,
Ghanem
Hamdoun
b,
Samia
Kahlal
a,
Marie
Cordier
a,
Hassan
Oulyadi
a,
Julien
Cartron
a,
Ghanem
Hamdoun
b,
Samia
Kahlal
a,
Marie
Cordier
a,
Hassan
Oulyadi