
 Open Access Article
 This Open Access Article is licensed under a Creative Commons Attribution-Non Commercial 3.0 Unported Licence
Iron phosphate mediated magnetite synthesis: a bioinspired approach†
Giulia
Mirabello‡§
 *a,
Matthew
GoodSmith‡¶
a,
Paul H. H.
Bomans
b,
Linus
Stegbauer||
c,
Derk
Joester
c and
Gijsbertus
de With
*a
*a,
Matthew
GoodSmith‡¶
a,
Paul H. H.
Bomans
b,
Linus
Stegbauer||
c,
Derk
Joester
c and
Gijsbertus
de With
*a
aLaboratory of Physical Chemistry, Department of Chemical Engineering and Chemistry, Eindhoven University of Technology, P.O. Box 513, 5600 MB Eindhoven, The Netherlands. E-mail: giulia.mirabello@gmail.com; G.deWith@tue.nl
bCenter for Multiscale Electron Microscopy, Department of Chemical Engineering and Chemistry, Eindhoven University of Technology, P.O. Box 513, 5600 MB Eindhoven, The Netherlands
cDepartment of Materials Science and Engineering, Northwestern University, Evanston, IL, USA
First published on 10th June 2021
Abstract
The biomineralization of intracellular magnetite in magnetotactic bacteria (MTB) is an area of active investigation. Previous work has provided evidence that magnetite biomineralization begins with the formation of an amorphous phosphate-rich ferric hydroxide precursor phase followed by the eventual formation of magnetite within specialized vesicles (magnetosomes) through redox chemical reactions. Although important progress has been made in elucidating the different steps and possible precursor phases involved in the biomineralization process, many questions still remain. Here, we present a novel in vitro method to form magnetite directly from a mixed valence iron phosphate precursor, without the involvement of other known iron hydroxide precursors such as ferrihydrite. Our results corroborate the idea that phosphate containing phases likely play an iron storage role during magnetite biomineralization. Further, our results help elucidate the influence of phosphate ions on iron chemistry in groundwater and wastewater treatment.
Introduction
Magnetite (Fe2+Fe23+O4), a magnetic mineral found in both geological and biomineralization contexts, has magnetic and biocompatible properties that allow for a wide range of applications.1–3 While there are many ways to synthesize magnetite, producing it with control over crystal habit, shape, and size usually requires high temperatures and environmentally harmful solvents.4,5 Magnetotactic bacteria (MTB), on the other hand, are able to form crystals of magnetite at room temperature and in aqueous media with exquisite control over their size, shape and organization, and thereby over their magnetic properties.6 This biological capability drives interest in developing biomimetic pathways, using peptides and proteins similar to those found within MTB, in an attempt to unravel and ultimately exploit their magnetite formation strategies.7–10MTB produce magnetite nanocrystals in specialized vesicles called magnetosomes. The mineralization process is regulated by a large number of proteins with specific functions that only now are beginning to be resolved.11–13 In particular, many questions remain regarding the role of precursor phases such as ferrihydrite,14,15 hematite,16–18 and ε-Fe2O3.19
Previous studies on the AMB-1 strain of Magnetospirillum magneticum20 and the MSR-1 strain of Magnetospirillum gryphiswaldense21 present evidence of a multi-step mechanism in which a disordered phosphate-rich ferric hydroxide precursor phase is formed first and subsequently converted into magnetite. Given its similarity to phosphate-rich ferritin, which is known to exist in many prokaryotes,22 this precursor phase is thought to act as storage for iron before the initiation of the magnetite formation process. A similar amorphous, hydrated ferric phosphate phase has also been described in the dermal granules of Molpadia intermedia,23 and ferric phosphates have been readily observed in many marine invertebrates.24 While the interplay of iron and phosphate clearly plays a significant role in many biomineralization contexts, exploring the precipitation chemistry of ferrous and ferric ions in the presence of phosphate is also crucial for understanding the fate of nutrients (e.g. phosphate)25 in groundwater and wastewater treatment.26,27
It has been proposed that inorganic phosphate (Pi) interacts with iron oxy-hydroxides by binding strongly to their surfaces, thereby stabilizing and favoring the formation of poorly crystalline iron phosphate precipitates.28–32 Thus, during in vivo magnetite formation, the role of Pi could be the sequestration of iron ions into precursor phases, which prevents the precipitation of iron oxides in neutral pH conditions. A similar strategy has been demonstrated in the case of crayfish gastroliths, where Pi plays an important role in stabilizing biogenic amorphous calcium carbonate,33–36 a mineral phase which stores CaCO3 during the skeleton formation process.
To help investigate the role that phosphate ions play in magnetite formation in MTB, we designed a method to form magnetite nanoparticles through the controlled formation and transformation of a phosphate precursor using a titration setup. We characterized the products formed at several stages of the reaction using cryogenic transmission electron microscopy (cryoTEM), selected area electron diffraction (SAED), X-ray absorption near-edge spectroscopy (XANES), and Raman spectroscopy. We demonstrate, for the first time, the transformation of an amorphous iron phosphate into magnetite at room temperature and in aqueous solution without evidence of other intermediate iron oxy-hydroxides.
Results
Synthesis of a mixed valence iron phosphate precursor
We present a titration-controlled mineralization system with 3 principal steps: (a) the formation of amorphous ferric phosphate, (b) the addition of Fe2+ ions to the system leading to the formation of a mixed valence iron phosphate precursor and (c) its conversion to magnetite. The products from each step of this synthesis were characterized using various spectroscopy and microscopy techniques.First, similar to the disordered phosphate-rich ferric phases noted in prior studies of MTB,20,21 an amorphous ferric phosphate was formed by increasing the pH of an acidic solution containing phosphate and Fe3+ ions to pH 3 (stoichiometric ratio Fe3+![[thin space (1/6-em)]](https://www.rsc.org/images/entities/char_2009.gif) :H3PO4 of 2:3, see the ESI for experimental details†). This process produced a yellow-white precipitate (Fig. S2c†), and Raman spectroscopy of this precipitate revealed a broad band at 1018 cm−1 (Fig. 1, black spectrum) in the region of the P–O stretching modes (900–1250 cm−1), in accordance with Raman spectra of amorphous iron and phosphate-containing phases noted in the literature.37
:H3PO4 of 2:3, see the ESI for experimental details†). This process produced a yellow-white precipitate (Fig. S2c†), and Raman spectroscopy of this precipitate revealed a broad band at 1018 cm−1 (Fig. 1, black spectrum) in the region of the P–O stretching modes (900–1250 cm−1), in accordance with Raman spectra of amorphous iron and phosphate-containing phases noted in the literature.37
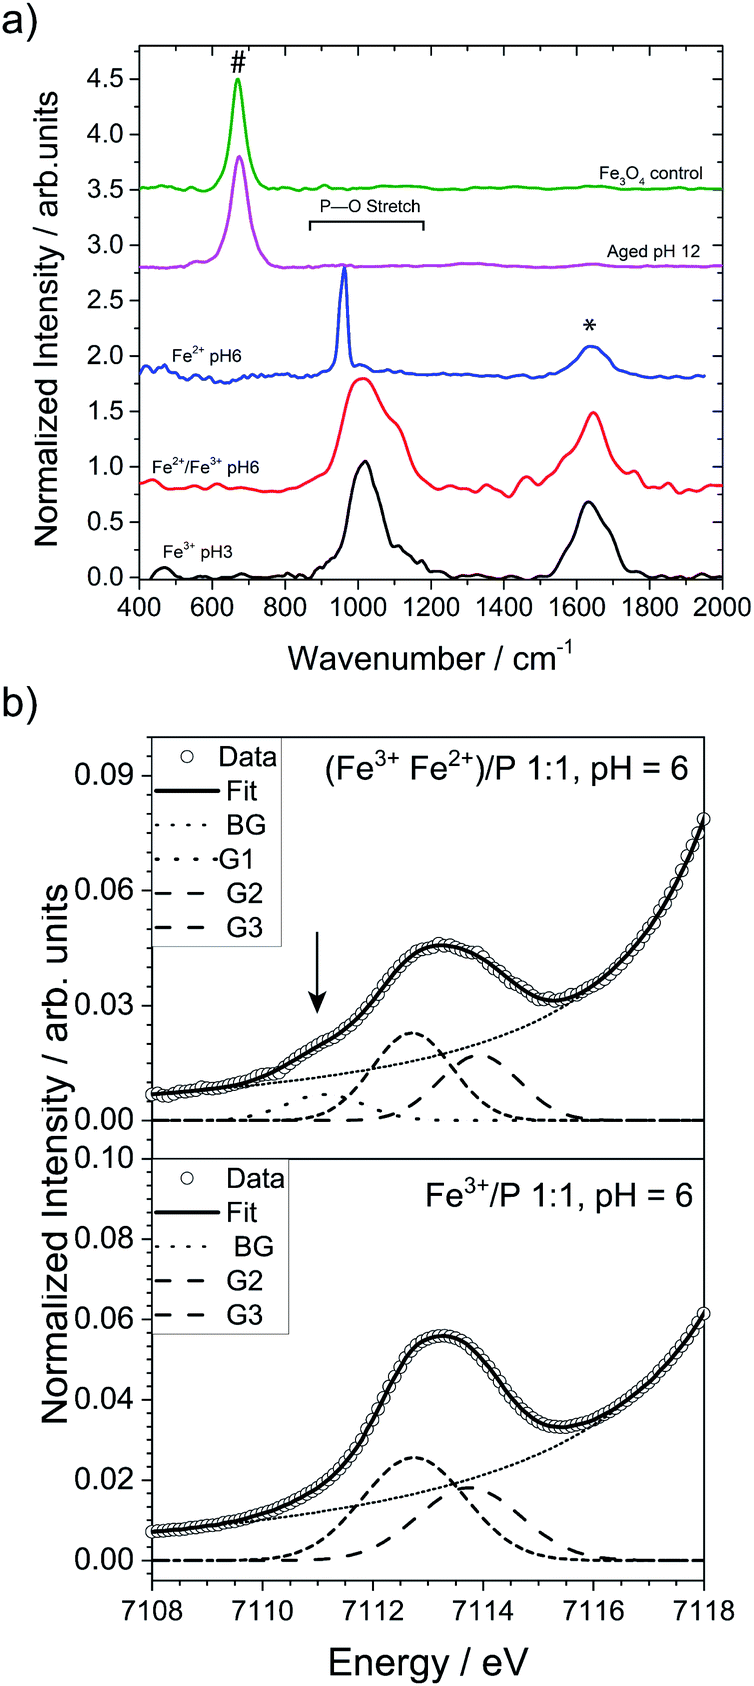 | ||
| Fig. 1 (a) Raman spectra of the ferric phosphate obtained at pH 3 (black), the mixed-valence iron phosphate obtained at pH 6 (red), the ferrous phosphate obtained at pH 6 (blue), the aged final product obtained at pH 12 (pink), and magnetite crystals synthesized as control (green). The band at 670 cm−1 (#) is typical for magnetite, while the band at 1645 cm−1 (*) is characteristic for water. (b) Comparison of the pre-edge XANES spectra of the co-precipitated Fe2+/Fe3+ phosphate at pH 6 (top) and Fe3+ phosphate at pH 6 (bottom). The arrow highlights the additional Gaussian component at 7111.1 eV, ascribable to the presence of Fe2+ in the precipitate. The acronym BG represents the background, while G1, G2 and G3 are the different Gaussian components for the Fe2+ and Fe3+ ions. Additional information on the meaning of G1, G2 and G3 and how they were determined can be found in the ESI in the Materials and methods section.† | ||
Since magnetite is a mixed valence iron oxide (Fe2+Fe23+O4), Fe2+ ions were added to the system at this point with a stoichiometric ratio for Fe3+:Fe2+:H3PO4 of 2:1:3, resulting in a mixed valence iron phosphate precursor phase. Initially, this precursor phase was attained in a stepwise reaction. Fe2+ ions were added to the isolated and washed ferric phosphate at pH 3 (to remove possible adsorbed phosphate ions) and the pH was then increased to ∼6, where the reduced solubility of the Fe2+ ions (Ksp(Fe(OH)2) = 7.1 × 10⁻¹⁶ M3) led to the formation of a green precipitate (Fig. S2d and e†). The Raman spectrum of this green precipitate showed a shoulder at 1100 cm−1 (Fig. 1a, red spectrum). Notably, simple co-precipitation of Fe3+ and Fe2+ ions at pH 6 in the presence of phosphate ions also formed a green precipitate with spectral features identical to the product from the above stepwise reaction (Fig. S3) (see Materials and methods in ESI†).
This finding suggests that co-precipitation allows for the synthesis of the mixed valence precursor in a direct, one-pot procedure without the need to isolate ferric phosphate in a stepwise reaction. Indeed, when the pH of a solution containing both Fe2+ and Fe3+ ions was increased in the co-precipitation reaction, the large difference in solubility between Fe2+ and Fe3+ ions at pH < 4 [Ksp(Fe(OH)2) = 7.1 × 10⁻¹⁶ M3; Ksp(Fe(OH)3) ≈ 10−39 M4] led to the selective precipitation of amorphous ferric phosphate. Co-precipitation of Fe2+ ions only started occurring when the pH was further increased to 4, which led to the formation of the green precipitate. For comparison, we examined the Raman spectra of ferrous phosphate and ferric phosphate synthetized in two separate batches (Fig. 1a, blue and black spectra) which show bands at ∼963 cm−1 and ∼1010 cm−1, respectively. Therefore, if a simple mixture of ferrous and ferric phosphate was formed, a shoulder would be expected at ∼960 cm−1 rather than 1100 cm−1. This observation further suggests that a mixed-valence phase was formed in both the stepwise and coprecipitation reactions. The broad nature of the bands noted in the ferric and the mixed valence phosphate phases suggests that these precipitates are poorly ordered, as a broad shape is typical of amorphous phosphates.37,38 In contrast, separately synthesized ferrous phosphate displayed a sharp band, suggesting either a more crystalline nature or a local symmetry of the phosphate group distinct from the amorphous compounds. Also, a deconvolution of the Raman band for the intermediate sample (green precipitate formed at pH 6) using dominant bands found in many mixed valence iron phosphates found in the literature was unfortunately inconclusive. This was mainly due to the amorphous nature of the intermediate samples we investigated, which were not easily compared to crystalline iron phosphate phases present in the literature.
XANES at the K-edge of iron is a useful tool to determine the oxidation states of iron containing samples (see ESI† for details). In direct comparison to ferric phosphate only containing Fe3+ ions (Fig. 1b, bottom graph), the XANES of the co-precipitated Fe2+/Fe3+ phosphate at pH 6 (Fig. 2b, upper graph) has an additional Gaussian component at 7111.1 eV (arrow in Fig. 2b and Table S1†), which clearly shows the presence of Fe2+ ions in the green precipitate.39 Quantitative evaluation of the pre-edge centroid positions (intensity-weighted average of the Gaussian components' positions)39 of the green precipitate indicates a ratio of 0.15 for Fe2+/Fe (see Table S2†). Additional XANES analysis of the 1st derivative (see ESI Fig. S4†) shows an additional hidden inflection point at E0 = 7120.3 eV in the onset of the white-line absorption indicating the presence of Fe2+.40 Direct comparison of the XANES spectra (see ESI Fig. S5, S6 and Table S3†) indicates a small shift of the absorption edge to lower energies for the Fe2+ co-precipitated sample. Moreover, quantification by assuming an absorption edge shift of 7 eV (ref. 39) going from complete Fe2+ to Fe3+ gives a ratio of 0.10 of Fe2+/Fe for the green precipitate (see Table S4†). All these findings further corroborate the hypothesis that a mixed-valence phase was formed. Analysis of the centroid positions (center of mass of the area below the peak) indicate that all iron species detected by XANES of both samples were in octahedral coordination environments.39
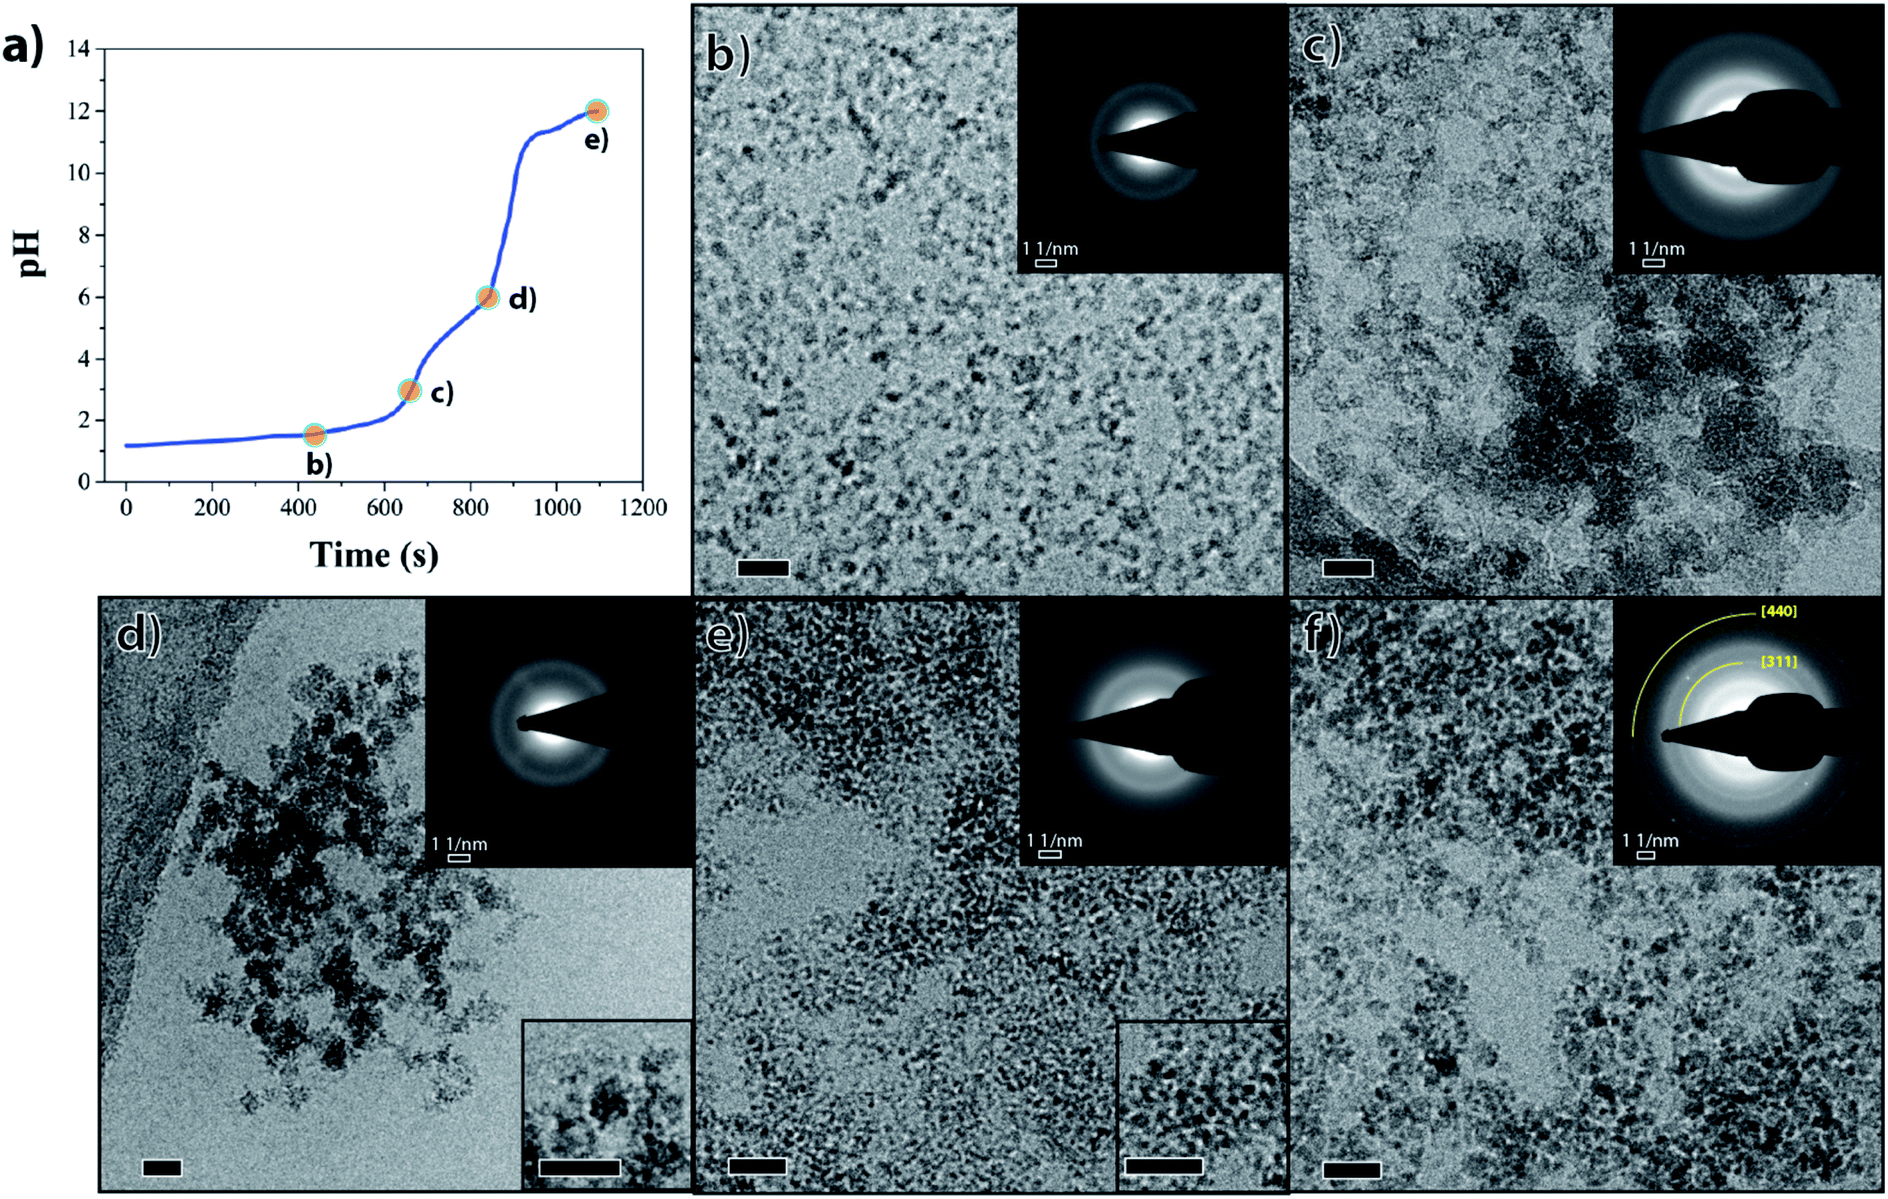 | ||
| Fig. 2 Magnetite formation through an iron phosphate precursor. (a) Representative pH profile of the reaction. (b–f) Cryo-TEM images of samples at (b) pH 1.6, (c) pH 3, (d) pH 6, (e) pH 12, and (f) the end product after aging 5 weeks. The upper insets in (b–f) correspond to the SAED patterns of each sample. The lower insets in (d) and (e) shows enlargement of the precipitate at (d) pH 6 and (e) pH 12. The SAED pattern in (f) shows the crystallinity of the final product after 5 weeks of the aging process. Scale bars 20 nm. | ||
Cryo-TEM showed that the amorphous ferric phosphate initially consisted of particles with well-defined sizes of 7–9 nm (Fig. 2b) that evolved to larger aggregates when increasing the pH to 3 (Fig. 2c). The mixed-valence iron phosphate precursor formed by pH 6 consisted of ∼10 nm aggregates which, in turn, were composed of even smaller particles (Fig. 2d, lower inset). Electron diffraction (ED) confirmed that both these iron phosphate phases were amorphous (Fig. S7†), as suggested by the broad nature of the Raman spectra discussed above.
Precursor-to-magnetite conversion
For the precursor-to-magnetite conversion to occur, iron ions needed to replace the phosphate ions in their coordination shell and the pH needed to be raised to drive the reaction towards magnetite formation. In our in vitro system, this was achieved through rapidly increasing the pH to higher values (pH > 11).Upon increasing the pH of the solution containing the mixed valance iron phosphate precursor, a black nanoparticulate dispersion was formed (Fig. S2g†) consisting of ∼2.5 nm nanoparticles (Fig. 2e, lower inset) that did not show any clear sign of crystallinity in ED (Fig. 2e, upper inset). However, the radial intensity profile of the ED pattern of these 2.5 nm nanoparticles showed a weak and broad signal around a 1.5 Å d-spacing (Fig. S7,† black arrow), indicating the ongoing conversion towards an ordered iron oxy-hydroxide phase. Indeed, 1.5 Å d-spacing is common to many iron oxy-hydroxides including magnetite.41 The broad reflections at ∼2.16 and 3.80 Å visible in all diffraction patterns (Fig. S7†) correspond to the signal of first and second diffuse diffraction rings of the vitrified water layer observed in cryo-TEM microscopy. After aging the black nanoparticle dispersion for 5 weeks in an oxygen-free environment, the initially formed 2.5 nm nanoparticles aggregated into 3–5 nm nanoparticles with an ED pattern consistent with magnetite (Fig. 2f, upper inset; Fig. S7,† black curve). The phase purity of the magnetite nanoparticles was confirmed using Raman spectroscopy which showed the expected peak at 673 cm−1 (Fig. 1a, green spectrum), while the absence of a peak at 705 cm−1 excluded the presence of significant contamination with maghemite (γ-Fe2O3) due to oxidation.42,43 Powder X-ray diffraction (PXRD) of the aged product showed multiple broad reflections corresponding to magnetite (Fig. S8†), indicating poor crystallinity and small domain sizes (<5 nm). The two most intense reflections in ED at approximately 1.5 Å and 2.5 Å (inset Fig. 2f and * symbol in Fig. S7†) are also noted in PXRD (arrows in Fig. S8,† reflections at 16.1° 2θ and 27.7° 2θ) and correspond to known crystallographic planes in magnetite (440 and 311, respectively). It should be noted that when attempting to measure the Raman spectra for the freshly synthesized final product, the spectra were inconclusive due to a low signal to noise ratio. This low ratio is likely due to a combination of poor crystallinity of the intermediate phase particles, and the product's extremely small crystalline domain size, as suggested by cryo-SAED patterns and cryo-TEM (Fig. S7,† black arrow and Fig. 2e, lower inset). However, a better signal was only obtained when the crystalline domains were larger (around 3–4 nm) after aging.
To further explore the role of phosphate, we performed a magnetite synthesis using the same titration set-up without the presence of phosphate (see ESI† for experimental details). In the absence of phosphate, magnetite was formed at ∼pH 8 (Fig. 3, ED pattern), consistent with observations from prior studies performing simple co-precipitation of magnetite.44 Further, the magnetite crystals obtained in the absence of phosphate were larger and had a wider size distribution (20 ± 16 nm) than the magnetite crystals obtained in the presence of phosphate (3.5 ± 1.2 nm).
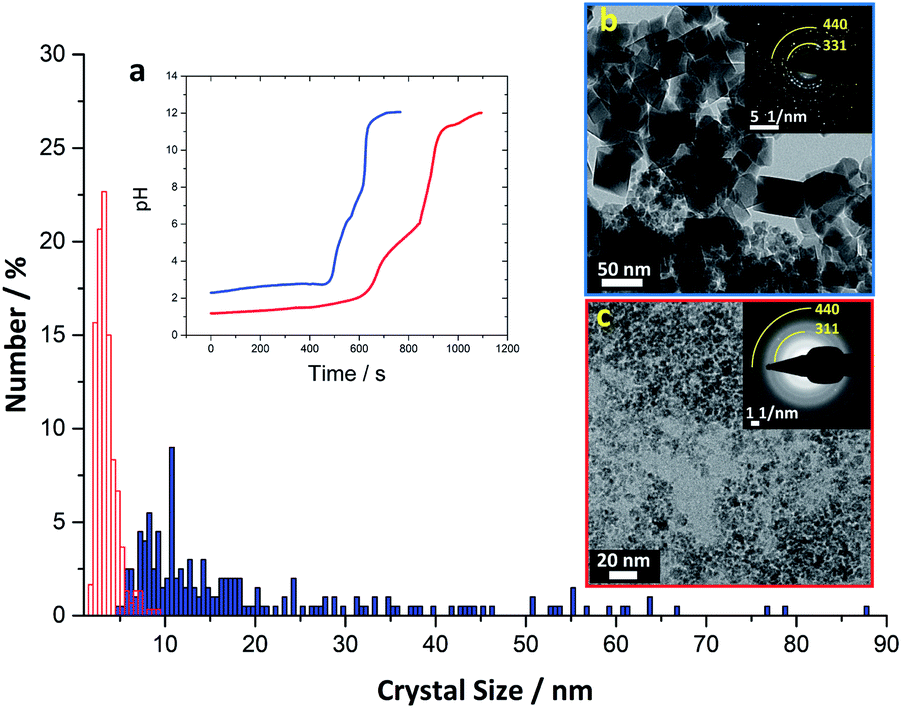 | ||
| Fig. 3 Crystal size distribution of magnetite synthesized in the absence (blue) and in the presence (red) of H3PO4. The average crystal size for magnetite synthesized in absence of H3PO4 is 20 ± 16 nm (±indicates the sample standard deviation for n = 200 individual crystals measured); average crystal size for magnetite synthesized in presence of H3PO4 is 3.5 ± 1.2 nm (n = 300). (a) The pH profile of magnetite synthesis via coprecipitation of Fe2+ and Fe3+ ions in the absence (blue) and in the presence (red) of H3PO4. (b) TEM image of magnetite obtained with the conventional coprecipitation method (absence of H3PO4, aged 1 week). (c) TEM image of aged (5 weeks) magnetite obtained from iron phosphate precursors. Insets in (b) and (c) SAED patterns with the representative 311 (inner arc) and 440 (outer arc) reflections of magnetite highlighted. | ||
Discussion
Here we have demonstrated, for the first time, an in vitro method to synthesize magnetite through an amorphous mixed valence iron phosphate precursor phase. The formation of this precursor phase was crucial to allow for the controlled formation of magnetite in our synthetic approach. When the reaction was performed with the same titration protocol in the absence of phosphate, the initial product was ferrihydrite,44 which was converted to magnetite already at pH ∼ 8, while in the presence of phosphate magnetite was formed above ∼pH 11 (Fig. 3). This shift to a higher pH value indicates that phosphate forms a stable precursor phase that inhibits the formation of all other iron oxides, which under many synthetic conditions compete with magnetite formation.32,45 Indeed, prior research has demonstrated that ferrous iron ions aerated in the presence of phosphate at near-neutral pH leads to the predominant formation of amorphous ferric phosphate, and even small amounts of phosphate in the system can prevent the formation of iron oxides such as goethite.29 In our system, the formation of magnetite was then triggered by the increase in pH, which favored the release of phosphate ions into solution due to competition with the hydroxide ions.46–48 Thus, with a rapid pH increase in our synthesis, we hypothesize that hydroxy ions replaced the phosphate ions and that magnetite was formed after the release of any associated water molecules. However, additional experiments are needed to verify this hypothesis by performing in situ analysis to follow the evolution of the sample during rapid pH increase.The fact that none of the other common iron oxides were observed in our synthesis suggests that by coordinating Fe2+ and Fe3+ in one mixed phase, it is possible to drive the conversion directly to magnetite upon removal of phosphate ions. We suggest that the small size of the magnetite crystals formed in our bioinspired experiment (Fig. 3) could have been caused by the presence of the phosphate ions that, despite the high pH, may still interact with developing crystals and inhibit their growth. Thus, if we had removed Pi as we increased pH in our experimental system, formation of larger magnetite crystals may have been possible.
Due to its presence in many fertilizers, phosphate is ubiquitous in the natural environment and present in high levels in groundwater and wastewater, contributing to eutrophication in many rivers and lakes.27,49 Iron oxide species have been used for many years in attempts to recover phosphate from wastewater given their propensity for phosphate adsorption,27,49 and iron has otherwise been used in groundwater systems in attempts to remove contaminants.26 The insights we have presented here regarding the interactions between iron and phosphate in an aqueous system contributes to the understanding of the interplay of these ions in complex groundwater and wastewater systems. Further, our work suggests a potential mechanism through which phosphorus existing in these systems can be leveraged to produce size-controlled magnetite nanoparticles.
This process could be particularly useful in places where groundwater comes from iron-rich aquifers and iron needs to be removed before the water can be used as drinking water.50 Currently, iron is usually removed from groundwater using aeration followed by rapid sand filtration. This process causes oxidation and ultimately hydrolysis of iron ions, resulting in a highly-hydrated ferric hydroxide sludge which has limited market value.50,51 If magnetite nanoparticles, which have many commercial applications,5,52,53 were to be formed instead of this sludge, there would be considerable economic rewards.54
Indeed, among many other uses, magnetite nanoparticles have been proposed for use in anti-cancer drug delivery systems,55,56 cancer-treatment processes including magnetic hyperthermia,57 and MRI contrast materials.58,59 Notably, many of the existing methods to produce size- and shape-controlled magnetite nanoparticles with specific magnetitic properties require high temperatures, high pressures, or organic solvents. Although we have not developed a mechanism for precise control over magnetite crystal shape and size, we have shown that it is possible to achieve a very narrow size distribution of magnetite nanoparticles through an amorphous phosphate precursor in an aqueous solution. Future iterations of this synthetic pathway could yield new, more environmentally friendly methods to produce magnetite for its many commercial applications.
In addition to serving as inspiration for new methods to produce magnetite, this synthesis also contributes to the understanding of the purpose of phosphate-rich precursors observed in some strains of MTB. Time-resolved studies have demonstrated phosphate-rich ferric oxy-hydroxide precursor phases in vivo early in the magnetite formation process in both the AMB-1 strain of Magnetospirillum magneticum20 and the MSR-1 strain of Magnetospirillum gryphiswaldense.21 These poorly ordered species are thought to be similar to bacterioferritin, which is an iron storage protein observed in other prokaryotes.22 In the RS-1 strain of Desulfovibrio magneticus, a most likely mixed valence (but predominantly ferrous) amorphous iron phosphate precursor phase has been observed.60 However, the exact role of these amorphous iron phosphate precursors in magnetite biomineralization remains unclear.
Of note, a recent study has suggested that since the absence of two ferritin-like proteins in MSR-1 strains did not affect magnetite formation, bacterioferritin-like species are not directly involved in magnetite biomineralization.61 However, the authors admit that other ferritin-like proteins that have yet to be characterized could still be involved directly in magnetite biomineralization. Further, they did not perform time-resolved studies to prove that no precursor phase was formed at any point in the absence of the two studied ferritin-like proteins. Even so, they showed that the two ferritin-like proteins they studied were useful in resisting oxidative stress.61 This finding suggests that sequestering iron in a stable precursor phase prior to magnetite biomineralization may help prevent the toxic effects of free intracellular iron.
Our synthesis supports the hypothesis that iron phosphate precursor phases function as a stable iron storage phase prior to magnetite biomineralization, as has been suggested in previous studies.20,21,60,62 As we have shown, iron ions were very stable in the phosphate containing phases during our synthesis. Thus, phosphate ions may act as a control agent that allows for accumulation and co-localization of Fe2+ and Fe3+ ions, while preventing the precipitation of unwanted iron oxide phases.32
The idea that iron is stored in a stable phase prior to magnetite formation is corroborated by a recent study looking at in vivo iron isotope measurements in AMB-1.63 In that study, bacterial lysates (representing everything in the cell besides the magnetosome) contained at least 50% of the total cellular iron when grown in media containing relatively high iron concentrations, which supports an iron reservoir besides magnetite in these cells. Further, these lysates showed enrichment in heavy isotopes, suggesting the predominant presence of Fe3+.63 Another study has found that magnetite crystals contain at most 30% of the total intracellular iron, and that another large pool of iron exists in MTB.64 These findings are consistent with a ferric iron containing precursor storage phase.
Further, magnetite formed in the iron isotope experiments showed depletion in heavy isotopes, suggesting that magnetite was formed following partial reduction of Fe3+ to Fe2+. Thus, the authors presented a model in which iron accumulates intracellularly as Fe3+ and is later reduced to Fe2+ prior to transport into the magnetosome. Similarly, another study has found evidence of reduced Fe2+ both within the magnetosome and in the cytoplasm.64 Whether this reduction happens at the magnetosome membrane or in another intracellular compartment remains unclear. As we have shown, iron ions can stably exist as part of a mixed-valence phosphate containing phase under pH conditions typically found intracellularly in MTB (7.0–7.6),65 which suggests that the reduction of Fe3+ to Fe2+ could occur outside of the magnetosome while the iron ions are stabilized within an iron phosphate precursor phase.
We have shown that magnetite can be formed directly from an iron phosphate species, which raises the question of whether magnetite could be formed directly from a phosphate containing precursor under appropriate conditions in MTB. Intriguingly, electron microscopy experiments in the RS-1 strain of Desulfovibrio magneticus have suggested that amorphous iron phosphate containing granules, which rapidly accumulate iron early in the biomineralization process, can convert directly to magnetite.60 However, there was evidence to suggest that iron was mostly transferred from this precursor phase to other iron reservoirs prior to magnetite formation. In addition, another study in RS-1 found evidence of amorphous, iron phosphate granules that are likely separate from magnetite and within separate bacterial organelles.62 Further, in our experiments, the high pH values necessary for the direct conversion of the iron phosphate precursor to magnetite (>11) is inconsistent with magnetosomal pH values (7.0–7.4).65 Thus, while it is worth considering the possibility of a direct conversion of iron phosphate precursors to magnetite, an iron storage function of the precursors is more likely.
Conclusions
Here, we present a new in vitro method of magnetite synthesis through an iron phosphate precursor phase that was initially inspired by prior observations of disordered phosphate-rich ferric hydroxides within MTB. Phosphate ions played a crucial role in the process by aiding in the co-localization of Fe2+ and Fe3+ ions while inhibiting the precipitation of iron oxides other than magnetite. The demonstrated utility of phosphate in favoring magnetite formation contributes to the understanding of where, how, and why the disordered phosphate-rich ferric hydroxide precursor phase in some strains of MTB may be formed and converted into magnetite. In particular, our synthesis suggests the importance of this phase as a potential storage mechanism for iron within MTB prior to magnetite biomineralization.More broadly, this study contributes to the understanding of iron chemistry in the presence of phosphate ions in alkaline conditions. We believe this work will encourage the development of new alternative approaches for the experimental design of magnetic nanoparticles with defined shapes and sizes that will have many useful commercial applications. Further, this work has implications in the fields of groundwater and wastewater treatment, and could potentially contribute to more efficient and cost-effective water purification strategies in these settings.
Data availability
All data that support findings of this study are available upon reasonable request from the authors.Author contributions
G. d. W. supervised the project and D. J. provided additional supervision. G. M. and M. G. conceived, designed and performed the synthetic experiments. G. M., P. H. H. B. and M. G. conceived and designed the TEM and cryo-TEM experiments. G. M. and M. G. performed the TEM and cryo-TEM acquisition and analysis. L. S. conceived and performed the XANES acquisition and analysis. L. S. performed the PXRD analysis. G. d. W., L. S. and D. J. offered valuable discussion. G. M. and M. G. wrote the original draft of the manuscript. All authors contributed to reviewing and editing the manuscript.Conflicts of interest
There are no conflicts to declare.Acknowledgements
We thank Drs Jessica Walker and Christos Malliakas for technical assistance. We thank Robert F. Free for setting up the XANES pre-edge Matlab script. The work of G. M. was supported by the Technology Foundation STW, the Applied Science Division of The Netherlands Organization for Scientific Research (Nederlandse Organisatie voor Weten-schappelijk onderzoek, NWO). The work of M. G. was supported through a NAF-Fulbright research grant. The work of L. S. was supported by a research fellowship of the Deutsche Forschungsgemeinschaft (STE2689/1-1). This work was in part supported by the National Science Foundation (DMR-1905982). This work made use of the IMSERC X-RAY facility at Northwestern University, which has received support from the Soft and Hybrid Nanotechnology Experimental (SHyNE) Resource (NSF ECCS-1542205), and Northwestern University. Portions of this work were performed at GeoSoilEnviroCARS (The University of Chicago, Sector 13), APS, Argonne National Laboratory. GeoSoilEnviroCARS is supported by the National Science Foundation – Earth Sciences (EAR – 1634415) and Department of Energy-GeoSciences (DE-FG02-94ER14466). This research used resources of the APS, a U.S. Department of Energy (DOE) Office of Science User Facility operated for the DOE Office of Science by Argonne National Laboratory under Contract No. DE-AC02-06CH11357.Notes and references
- R. S. Ribeiro, A. M. T. Silva, P. B. Tavares, J. L. Figueiredo, J. L. Faria and H. T. Gomes, Catal. Today, 2017, 280, 184–191 CrossRef CAS.
- Y. Qiu, S. Tong, L. Zhang, Y. Sakurai, D. R. Myers, L. Hong, W. A. Lam and G. Bao, Nat. Commun., 2017, 8, 15594 CrossRef CAS PubMed.
- A. Sood, V. Arora, J. Shah, R. K. Kotnala and T. K. Jain, Mater. Sci. Eng., C, 2017, 80, 274–281 CrossRef CAS PubMed.
- J. A. Darr, J. Zhang, N. M. Makwana and X. Weng, Chem. Rev., 2017, 117, 11125–11238 CrossRef CAS PubMed.
- S. Laurent, D. Forge, M. Port, A. Roch, C. Robic, L. Vander Elst and R. N. Muller, Chem. Rev., 2008, 108, 2064–2110 CrossRef CAS PubMed.
- D. Faivre and D. Schüler, Chem. Rev., 2008, 108, 4875–4898 CrossRef CAS PubMed.
- Y. Amemiya, A. Arakaki, S. S. Staniland, T. Tanaka and T. Matsunaga, Biomaterials, 2007, 28, 5381–5389 CrossRef CAS PubMed.
- A. Arakaki, F. Masuda, Y. Amemiya, T. Tanaka and T. Matsunaga, J. Colloid Interface Sci., 2010, 343, 65–70 CrossRef CAS PubMed.
- J. Baumgartner, M. Antonietta Carillo, K. M. Eckes, P. Werner and D. Faivre, Langmuir, 2014, 30, 2129–2136 CrossRef CAS PubMed.
- J. J. M. Lenders, H. R. Zope, A. Yamagishi, P. H. H. Bomans, A. Arakaki, A. Kros, G. De With and N. A. J. M. Sommerdijk, Adv. Funct. Mater., 2015, 25, 711–719 CrossRef CAS.
- R. Uebe and D. Schüler, Nat. Rev. Microbiol., 2016, 14, 621–637 CrossRef CAS PubMed.
- S. Barber-Zucker and R. Zarivach, ACS Chem. Biol., 2017, 12, 13–22 CrossRef CAS PubMed.
- D. Schüler, FEMS Microbiol. Rev., 2008, 32, 654–672 CrossRef PubMed.
- R. B. Frankel, G. C. Papaefthymiou, R. P. Blakemore and W. O'Brien, Biochim. Biophys. Acta, Mol. Cell Res., 1983, 763, 147–159 CrossRef CAS.
- S. Watanabe, M. Yamanaka, A. Sakai, K. Sawada and T. Iwasa, Mater. Trans., 2008, 49, 874–878 CrossRef CAS.
- S. Staniland, B. Ward, A. Harrison, G. Van Der Laan and N. Telling, Proc. Natl. Acad. Sci. U. S. A., 2007, 104, 19524–19528 CrossRef CAS PubMed.
- L. Le Nagard, X. Zhu, H. Yuan, K. Benzerara, D. A. Bazylinski, C. Fradin, A. Besson, S. Swaraj, S. Stanescu, R. Belkhou and A. P. Hitchcock, Chem. Geol., 2019, 530, 119348 CrossRef CAS.
- X. Zhu, A. P. Hitchcock, D. A. Bazylinski, P. Denes, J. Joseph, U. Lins, S. Marchesini, H. W. Shiu, T. Tyliszczak and D. A. Shapiro, Proc. Natl. Acad. Sci. U. S. A., 2016, 113, E8219–E8227 CrossRef CAS PubMed.
- T. Wen, Y. Zhang, Y. Geng, J. Liu, A. Basit, J. Tian, Y. Li, J. Li, J. Ju and W. Jiang, Biomater. Res., 2019, 23, 13 CrossRef PubMed.
- J. Baumgartner, G. Morin, N. Menguy, T. P. Gonzalez, M. Widdrat, J. Cosmidis and D. Faivre, Proc. Natl. Acad. Sci. U. S. A., 2013, 110, 14883–14888 CrossRef CAS PubMed.
- M. L. Fdez-Gubieda, A. Muela, J. Alonso, A. García-Prieto, L. Olivi, R. Fernández-Pacheco and J. M. Barandiarán, ACS Nano, 2013, 7, 3297–3305 CrossRef CAS PubMed.
- J. S. Rohrer, E. C. Theil, Q. T. Islam, D. E. Sayers and G. D. Watt, Biochemistry, 1990, 29, 259–264 CrossRef CAS PubMed.
- H. A. Lowenstam and G. R. Rossman, Chem. Geol., 1975, 15, 15–51 CrossRef CAS.
- H. A. Lowenstam, Chem. Geol., 1972, 9, 153–166 CrossRef CAS.
- A. Gunnars, S. Blomqvist, P. Johansson and C. Andersson, Geochim. Cosmochim. Acta, 2002, 66, 745–758 CrossRef CAS.
- Y. Furukawa, J. Kim, J. Watkins and R. T. Wilkin, Environ. Sci. Technol., 2002, 36, 5469–5475 CrossRef CAS PubMed.
- T. Clark, T. Stephenson and P. A. Pearce, Water Res., 1997, 31, 2557–2563 CrossRef CAS.
- A.-C. Senn, R. Kaegi, S. J. Hug, J. G. Hering, S. Mangold and A. Voegelin, Geochim. Cosmochim. Acta, 2015, 162, 220–246 CrossRef CAS.
- A. Voegelin, A.-C. Senn, R. Kaegi, S. J. Hug and S. Mangold, Geochim. Cosmochim. Acta, 2013, 117, 216–231 CrossRef CAS.
- A. Voegelin, R. Kaegi, J. Frommer, D. Vantelon and S. J. Hug, Geochim. Cosmochim. Acta, 2010, 74, 164–186 CrossRef CAS.
- T. Borch, Y. Masue, R. K. Kukkadapu and S. Fendorf, Environ. Sci. Technol., 2007, 41, 166–172 CrossRef CAS PubMed.
- J. P. Jolivet, C. Chanéac and E. Tronc, Chem. Commun., 2004, 477–483 RSC.
- A. Akiva-Tal, S. Kababya, Y. S. Balazs, L. Glazer, A. Berman, A. Sagi and A. Schmidt, Proc. Natl. Acad. Sci. U. S. A., 2011, 108, 14763–14768 CrossRef CAS PubMed.
- R. J. Reeder, Y. Tang, M. P. Schmidt, L. M. Kubista, D. F. Cowan and B. L. Phillips, Cryst. Growth Des., 2013, 13, 1905–1914 CrossRef CAS.
- S. Kababya, A. Gal, K. Kahil, S. Weiner, L. Addadi and A. Schmidt, J. Am. Chem. Soc., 2015, 137, 990–998 CrossRef CAS PubMed.
- A. Neira-Carrillo, M. S. Fernández, G. P. Hevia, J. L. Arias, D. Gebauer and H. Cölfen, J. Struct. Biol., 2017, 199, 46–56 CrossRef CAS PubMed.
- L. Zhang and R. K. Brow, J. Am. Ceram. Soc., 2011, 94, 3123–3130 CrossRef CAS.
- M. Shi, Y. Liang, L. Chai, X. Min, Z. Zhao and S. Yang, J. Mol. Struct., 2015, 1081, 389–394 CrossRef CAS.
- M. Wilke, F. Farges, P.-E. Petit, G. E. Brown Jr and F. Martin, Am. Mineral., 2001, 86, 714–730 CrossRef CAS.
- G. Pratesi, C. Cipriani, G. Giuli and W. D. Birch, Eur. J. Mineral., 2003, 15, 185–192 CrossRef CAS.
- R. M. Cornell and U. Schwertmann, in The Iron Oxides, 2003, pp. 139–183 Search PubMed.
- A. M. Jubb and H. C. Allen, ACS Appl. Mater. Interfaces, 2010, 2, 2804–2812 CrossRef CAS.
- O. N. Shebanova and P. Lazor, J. Raman Spectrosc., 2003, 34, 845–852 CrossRef CAS.
- J. J. M. Lenders, C. L. Altan, P. H. H. Bomans, A. Arakaki, S. Bucak, G. De With and N. A. J. M. Sommerdijk, Cryst. Growth Des., 2014, 14, 5561–5568 CrossRef CAS.
- T. Ahn, J. H. Kim, H. M. Yang, J. W. Lee and J. D. Kim, J. Phys. Chem. C, 2012, 116, 6069–6076 CrossRef CAS.
- K. Barthélémy, S. Naille, C. Despas, C. Ruby and M. Mallet, J. Colloid Interface Sci., 2012, 384, 121–127 CrossRef PubMed.
- R. Chitrakar, S. Tezuka, A. Sonoda, K. Sakane, K. Ooi and T. Hirotsu, J. Colloid Interface Sci., 2006, 298, 602–608 CrossRef CAS PubMed.
- N. Sleiman, V. Deluchat, M. Wazne, A. Courtin, Z. Saad, V. Kazpard and M. Baudu, RSC Adv., 2016, 6, 1627–1636 RSC.
- N. Y. Acelas, B. D. Martin, D. López and B. Jefferson, Chemosphere, 2015, 119, 1353–1360 CrossRef CAS PubMed.
- D. Vries, C. Bertelkamp, F. Schoonenberg Kegel, B. Hofs, J. Dusseldorp, J. H. Bruins, W. de Vet and B. van den Akker, Water Res., 2017, 109, 35–45 CrossRef CAS PubMed.
- C. G. E. M. van Beek, T. Hiemstra, B. Hofs, M. M. Nederlof, J. A. M. van Paassen and G. K. Reijnen, J. Water Supply: Res. Technol.--AQUA, 2012, 61, 1–13 CrossRef CAS.
- G. Mirabello, J. J. M. Lenders and N. A. J. M. Sommerdijk, Chem. Soc. Rev., 2016, 45, 5085–5106 RSC.
- M. Ashraf, I. Khan, M. Usman, A. Khan, S. S. Shah, A. Z. Khan, K. Saeed, M. Yaseen, M. F. Ehsan, M. N. Tahir and N. Ullah, Chem. Res. Toxicol., 2020, 33, 1292–1311 Search PubMed.
- L. Y. Novoselova, Appl. Surf. Sci., 2021, 539, 148275 CrossRef CAS.
- S. Guo, D. Li, L. Zhang, J. Li and E. Wang, Biomaterials, 2009, 30, 1881–1889 CrossRef CAS PubMed.
- X. N. Pham, T. P. Nguyen, T. N. Pham, T. T. N. Tran and T. V. T. Tran, Adv. Nat. Sci.: Nanosci. Nanotechnol., 2016, 7, 45010 Search PubMed.
- A. Espinosa, R. Di Corato, J. Kolosnjaj-Tabi, P. Flaud, T. Pellegrino and C. Wilhelm, ACS Nano, 2016, 10, 2436–2446 CrossRef CAS PubMed.
- C. Zhang, X. Xie, S. Liang, M. Li, Y. Liu and H. Gu, Nanomedicine, 2012, 8, 996–1006 CrossRef CAS PubMed.
- J. Wallyn, N. Anton and T. F. Vandamme, Pharmaceutics, 2019, 11, 601 CrossRef CAS PubMed.
- J. Baumgartner, N. Menguy, T. P. Gonzalez, G. Morin, M. Widdrat and D. Faivre, J. R. Soc., Interface, 2016 DOI:10.1098/rsif.2016.0665.
- R. Uebe, F. Ahrens, J. Stang, K. Jäger, L. H. Böttger, C. Schmidt, B. F. Matzanke and D. Schüler, mBio, 2019, 10, e02795 CrossRef CAS PubMed.
- M. E. Byrne, D. A. Ball, J. L. Guerquin-Kern, I. Rouiller, T. Di Wu, K. H. Downing, H. Vali and A. Komeili, Proc. Natl. Acad. Sci. U. S. A., 2010, 107, 12263–12268 CrossRef CAS PubMed.
- M. Amor, V. Busigny, P. Louvat, M. Tharaud, A. Gélabert, P. Cartigny, J. Carlut, A. Isambert, M. Durand-Dubief, G. Ona-Nguema, E. Alphandéry, I. Chebbi and F. Guyot, Geochim. Cosmochim. Acta, 2018, 232, 225–243 CrossRef CAS.
- M. Amor, A. Ceballos, J. Wan, C. P. Simon, A. T. Aron, C. J. Chang, F. Hellman and A. Komeili, Appl. Environ. Microbiol., 2020, 86, e01278 CrossRef CAS PubMed.
- Y. Eguchi, Y. Fukumori and A. Taoka, Biosci., Biotechnol., Biochem., 2018, 82, 1243–1251 CrossRef CAS PubMed.
Footnotes |
| † Electronic supplementary information (ESI) available: Full experimental details including synthetic and characterization procedures, supplementary figures (Fig. S1–S6) and table (Table S1). See DOI: 10.1039/d0sc07079c |
| ‡ These authors contributed equally to this work. |
| § Present address: Laboratory for Quantum Magnetism, Institute of Physics, Swiss Federal Institute of Technology Lausanne, CH-1015 Lausanne, Switzerland, and Department of Chemistry, University of Fribourg, Chemin du Musée 9, 1700 Fribourg, Switzerland. |
| ¶ Present address: Pritzker School of Medicine, University of Chicago, Chicago, IL, USA. |
| || Present address: Institute for Interfacial Process Engineering and Plasma Technology, University of Stuttgart, Stuttgart, Germany. |
| This journal is © The Royal Society of Chemistry 2021 |