 Open Access Article
New atomically precise M1Ag21 (M = Au/Ag) nanoclusters as excellent oxygen reduction reaction catalysts†
Xuejuan
Zou
ac,
Shuping
He
ac,
Xi
Kang
 ac,
Shuang
Chen
bc,
Haizhu
Yu
 ac,
Shan
Jin
 *bc,
Didier
Astruc
 *d and
Manzhou
Zhu
 *abc
*abc
aDepartment of Chemistry, Centre for Atomic Engineering of Advanced Materials, Key Laboratory of Chemistry for Inorganic/Organic Hybrid Functionalized Materials, Anhui University, Hefei, Anhui 230601, P. R. China. E-mail: zmz@ahu.edu.cn
bInstitutes of Physical Science and Information Technology, Anhui University, Hefei, Anhui 230601, P. R. China. E-mail: jinshan@ahu.edu.cn
cKey Laboratory of Structure and Functional Regulation of Hybrid Materials, Anhui University, Ministry of Education, Hefei, 230601, P. R. China
dUniversité de Bordeaux, 33405 Talence Cedex, France. E-mail: didier.astruc@u-bordeaux.fr
First published on 7th January 2021
Abstract
By introducing 1,1′-bis-(diphenylphosphino)ferrocene (dppf) as an activating ligand, two novel nanoclusters, M1Ag21 (M = Au/Ag), have been controllably synthesized and structurally characterized. The atomically precise structures of the M1Ag21 nanoclusters were determined by SCXC and further confirmed by ESI-TOF-MS, TGA, XPS, DPV, and FT-IR measurements. The M1Ag21 nanoclusters supported on activated carbon (C) are exploited as efficient oxygen reduction reaction (ORR) catalysts in alkaline solutions. Density functional theory (DFT) calculations verify that the catalytic activities of the two cluster-based systems originate from the significant ensemble synergy effect between the M13 kernel and dppf ligand in M1Ag21. This work sheds lights on the preparation of cluster-based electrocatalysts and other catalysts that are activated and modified by peripheral ligands.
1. Introduction
The increasing demand for energy and environmental sustainability has accelerated the research on efficient, low-cost and environmentally friendly alternative energy conversion systems.1,2 Therefore, the development of renewable energy technology becomes extremely important for which good oxygen reduction reaction (ORR) catalysts are key examples. 1,1′-Bis-(diphenylphosphino)-ferrocene (dppf),3–5 an excellent donor and bulky bisphosphine ligand as well as a derivative of ferrocene, has displayed excellent electrochemical performance in some dppf-containing complexes,6–9 indicating that dppf-functionalized complexes/nanoparticles may have more potential applications in electrochemistry.Metal nanoclusters, with small sizes and atomically precise structures,10 have attracted much attention in various fields, such as catalysis, sensing, optics, and electrochemistry.11–16 With the development of the synthetic chemistry of metal nanoclusters, a number of reports have indicated that it is possible to precisely control the size and shape of nanocluster structures, in other words, that means the surface ligands (i.e., thiolates, phosphines, alkynyls, etc.) could be of great relevance to the geometrical structures and potential performances of nanoclusters.17–24 For example, for different liganded-Au25 nanoclusters, spherical Au25(SR)18 (ref. 25 and 26) shows a larger total current density than rod-shaped [Au25(PPh3)10(SR′)5Cl2]2+ (ref. 27) for electrochemical CO2 reduction;28 however, higher conversion can be observed for rod-shaped Au25 than spherical Au25 in photocatalytic oxidation of benzyl amine reaction.29 In addition, Jin et al., observed that the Au25(SNap)18 nanoclusters exhibit significantly improved thermal stability, antioxidant properties and better catalytic activity and selectivity in the Ullmann heterocoupling reactions than Au25(PET)18 nanoclusters.17 Similar results can also be seen in Au28, Au38 and so on.30–32 Besides, the bisphosphine ligand can also be used for regulating the structures and properties in metal nanoclusters. Recently, Zhu's group reported ligand-exchange induced transformation from bi-icosahedral Pt2Ag23(PPh3)10Cl7 to monoicosahedral Pt1Ag24(SPhMe2)18, and then to bare-icosahedral Pt1Ag12(dppm)5(SPhMe2)2; by introducing the dppm diphosphine ligand, the surface rigidity of the clusters has increased and promoted the enhancement of luminescence further.20,33,34 In view of the unique advantages of dppf, will these stereo-electronic ligand properties strongly and favorably impact the sizes,35–37 and electronic properties6–8 of metal nanoclusters, and therefore their performances in catalysis?
Herein, by introducing dppf as an activating ligand, two novel nanoclusters, [Ag22(dppf)3(SAdm)12](BPh4)2 (Ag22) and [Au1Ag21(dppf)3(SAdm)12](BPh4)2 (Au1Ag21), are reported as their bis-BPh4 salts. The atomically precise structures of these two nanoclusters are determined by single crystal X-ray crystallography (SCXC), and further confirmed by electrospray ionization time-of-flight mass spectrometry (ESI-TOF-MS), thermogravimetric analysis (TGA), X-ray photoelectron spectroscopy (XPS), and Fourier transform infrared (FT-IR) measurements. Both nanoclusters have the typical icosahedral M13 (M = Au/Ag) kernel protected by three Ag3(SR)4 motifs and three dppf ligands. The incorporation of dppf not only regulates the structures of these two nanoclusters, but also drastically improves the ORR performances in alkaline media. Indeed, both nanoclusters supported on activated carbon (C) exhibit excellent ORR activity, and Au1Ag21(dppf)3(SAdm)12/C shows a better performance than Ag22(dppf)3(SAdm)12/C. To the best of our knowledge, this is the first study of the ORR properties of dppf-functionalized metal nanoclusters, and the observations in this work will provide some guidance for the future development of nanoclusters in catalysis and electrocatalysis.
2. Experimental methods
2.1. Materials
All the following reagents and solvents are commercially available, and all of them were used without further purification: silver nitrate (AgNO3, 99%), hydrogen tetrachloroaurate(III) (HAuCl4·3H2O, 99.99%), 1,1′-bis(diphenylphosphino)ferrocene (dppf, 97%, Sigma-Aldrich), 1-adamantanethiol (1-AdmSH, 97%, Sigma-Aldrich), sodium borohydride (NaBH4, 98%, Sigma-Aldrich), sodium tetraphenylborate (NaBPh4, 98%), methyl sulfide (C2H6S, 99%, Sigma-Aldrich), methanol (CH3OH, HPLC, Aldrich), acetonitrile (CH3CN, HPLC, Aldrich), dichloromethane (CH2Cl2, HPLC grade, Aldrich), toluene (Tol, HPLC grade, Aldrich), and n-hexane (hex, HPLC grade, Aldrich). Pure water was obtained from Wahaha Co. Ltd.2.2. Synthesis of Ag22(dppf)3(SAdm)12(BPh4)2 nanocluster
60 mg AgNO3 (0.35 mmol) was dissolved in 5 mL methanol using ultrasound treatment, and this solution was added into 15 mL toluene. After 15 min, 50 mg 1,1′-bis(diphenylphosphino)ferrocene (0.09 mmol) and 50 mg 1-adamantanethiol (0.3 mmol) were simultaneously added into the solution; 30 min later, 1 mL of an aqueous solution of NaBH4 (25 mg mL−1, (0.66 mmol)) was added, and the reaction mixture was stirred for 5 hours at room temperature. The crude product was obtained by rotary evaporation, then washed three times with n-hexane and dissolved in CH2Cl2 again. Then, 20 mg NaBPh4 (0.058 mmol) in 2 mL CH3OH was added to the solution in order to substitute the anion in the cluster for crystallization. A red precipitate was collected by centrifugation (5 min at ∼7000 rpm), then washed twice with excess n-hexane and again collected by centrifugation. Red crystals were formed from a CH2Cl2/hex (volume ratio = 1![[thin space (1/6-em)]](https://www.rsc.org/images/entities/char_2009.gif) :
:![[thin space (1/6-em)]](https://www.rsc.org/images/entities/char_2009.gif) 3) or toluene/methanol solution of the clusters at room temperature after three days. The yield of the Ag22 nanocluster (crystals) was 10% (about 9.7 mg) based on Ag atoms.
3) or toluene/methanol solution of the clusters at room temperature after three days. The yield of the Ag22 nanocluster (crystals) was 10% (about 9.7 mg) based on Ag atoms.
2.3. Synthesis of the dppf–Au complexes
Methyl sulfide (2 mL, 27 mmol) was slowly added to CH3OH solution (15 mL) of 1 mmol (400 mg) HAuCl4·3H2O until a milky white precipitation formed; then the solution was stirred for half an hour and dried for later use. This product was dissolved in 15 mL CH2Cl2 again, and 555 mg (1 mmol) of dppf was added to the solution. The reaction mixture was stirred for 2 h, then the dppf–Au complex obtained was dried, and about 280 mg of complex was obtained for use.2.4. Synthesis of the Au1Ag21(dppf)3(SAdm)12(BPh4)2 nanocluster
The experimental procedure for the synthesis of the Au1Ag21(dppf)3(SAdm)12(BPh4)2 nanocluster was the same as that used for the synthesis of Ag22(dppf)3(SAdm)12(BPh4)2 except that 20 mg dppf–Au was used instead of 50 mg dppf. Comparing with the Ag22 nanocluster, more impurities were present in the crude product, and the yield of pure Au1Ag21 nanocluster (crystals) was only 5% (about 5.2 mg) based on Ag atoms.2.5. Preparation of electrocatalysts of Ag22(dppf)3(SAdm)12/C and Au1Ag21(dppf)3(SAdm)12/C
100 mg of activated carbon was first dispersed into 20 mL CH2Cl2. Then, 10 mg Ag22 or 10 mg Au1Ag21 nanocluster was dissolved in 10 mL CH2Cl2, and this solution was added dropwise into the above activated carbon dispersion at constant stirring at ambient temperature for 10 h until the colour of the supernatant disappeared. CH2Cl2 was removed by rotary evaporation, forming catalysts for which the nanoclusters were supported on activated carbon with a loading of 10%. These catalysts are named Ag22(dppf)3(SAdm)12/C and Au1Ag21(dppf)3(SAdm)12/C.2.6. Preparation of electrocatalysts of Ag22 and Au1Ag21 nanoclusters with different loadings
100 mg of activated carbon was first dispersed into 20 mL CH2Cl2. Then, 5 mg or 20 mg or 30 mg Ag22 nanocluster was dissolved in 10 mL CH2Cl2, and this solution was added dropwise into the above activated carbon dispersion at constant stirring at ambient temperature for 10 h until the colour of the supernatant disappeared. CH2Cl2 was removed by rotary evaporation, forming catalysts for which the nanoclusters were supported on activated carbon with a loading of 5%, 20%, and 30%. These catalysts are named Ag22(dppf)3(SAdm)12/C-5%, Ag22(dppf)3(SAdm)12/C-20%, and Ag22(dppf)3(SAdm)12/C-30%. Also, the preparation of catalysts of Au1Ag21(dppf)3(SAdm)12/C-5%, Au1Ag21(dppf)3(SAdm)12/C-20%, and Au1Ag21(dppf)3(SAdm)12/C-30% is similar to the method above except for replacing Ag22 with Au1Ag21.2.7. Preparation of electrocatalysts of Ag22(dppf)3(SAdm)12/C and Au1Ag21(dppf)3(SAdm)12/C at different temperatures
Ag22(dppf)3(SAdm)12/C or Au1Ag21(dppf)3(SAdm)12/C was calcined in a tube furnace for two hours in Ar at different temperatures. These systems are named Ag22(dppf)3(SAdm)12/C-150 °C, Ag22(dppf)3(SAdm)12/C-200 °C, Ag22(dppf)3(SAdm)12/C-300 °C, Au1Ag21(dppf)3(SAdm)12/C-150 °C, Au1Ag21(dppf)3(SAdm)12/C-200 °C, and Au1Ag21(dppf)3(SAdm)12/C-300 °C.2.8. X-ray crystallography
The data collection for Ag22(dppf)3(SAdm)12(BPh4)2 and Au1Ag21(dppf)3(SAdm)12(BPh4)2 was carried out on a Stoe Stadivari diffractometer under a liquid nitrogen flow at 150 K (for Ag22(dppf)3(SAdm)12(BPh4)2) and 120 K (for Au1Ag21(dppf)3(SAdm)12(BPh4)2), using graphite-monochromatized Cu Kα radiation (λ = 1.54186 Å). Data reductions and absorption corrections were performed using the SAINT and SADABS programs, respectively. The structure was solved by direct methods and refined with full-matrix least squares on F2 using the SHELXTL software package. All non-hydrogen atoms were refined anisotropically, and all the hydrogen atoms were set in geometrically calculated positions and refined isotropically using a riding model.2.9. Electrochemical measurements for the oxygen reduction reaction
All electrochemical measurements were performed on the CHI700E electrochemical workstation in a standard three-electrode system at room temperature. A saturated Ag/AgCl electrode and platinum wire were used as the reference electrode and counter electrode, respectively. A rotating disk electrode (RDE, geometric area = 0.196 cm2) modified with catalyst ink was used as the working electrode in the ORR test. Catalyst ink was prepared by dispersing 10 mg catalyst in 1 mL ethanol with 10 μL Nafion, which was sonicated for 30 min to form a homogeneous solution. All potential values in this work were calibrated to the reversible hydrogen electrode (RHE) scale according to the following equation:| ERHE = E(Ag/AgCl) + 0.966. |
For the oxygen reduction reaction, the working electrode was prepared by dropping 10 μL catalyst ink on the RDE. 0.1 M KOH was used as the electrolyte and was saturated with pure Ar or O2. A scan rate of 0.05 V s−1 was used for all the experiments.
3. Results and discussion
3.1. Crystallization, structural analysis, and characterization of two nanoclusters
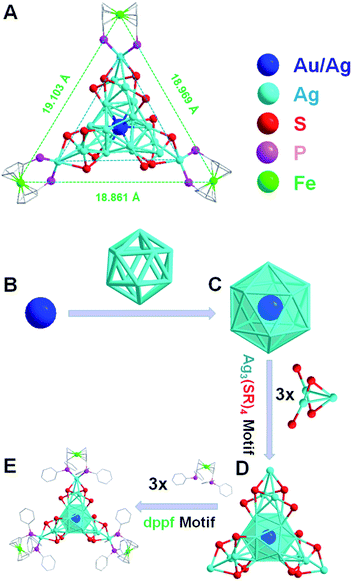
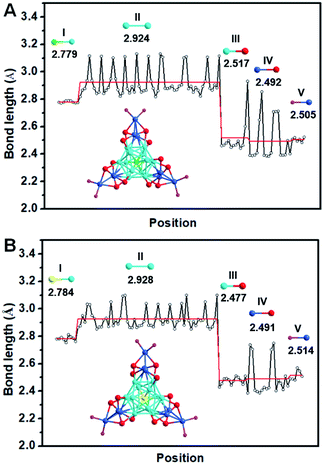
The detailed synthesis methods are provided in the Experimental methods, and the crystals of both Ag22(dppf)3(SAdm)12(BPh4)2 and Au1Ag21(dppf)3(SAdm)12(BPh4)2 nanoclusters were obtained via crystallization in toluene/methanol after three days. SCXC was applied to determine the structures of [Ag22(dppf)3(SAdm)12](BPh4)2 and Au1Ag21(dppf)3(SAdm)12(BPh4)2. The overall structures are shown in Fig. S1.† There are two PPh4-counterions in the unit cell of Ag22 or Au1Ag21, indicating the +2-charge state of both nanoclusters. The free electron counts of both nanoclusters are calculated as 8e (i.e., 22 (metal) −12 (thiol ligands) −2 (charge) = 8e).The detailed structural analysis is shown in Fig. 1; the icosahedral M1Ag12 (M = Au/Ag) kernel is protected by three Ag3(SR)4 motifs and three dppf ligands. Taking Ag22 as an example, the distances of the central Ag with the other 12 Ag atoms in the icosahedral kernel vary from 2.773 to 2.789 Å, with an average distance of 2.779 Å (Fig. 2A-I), and the average distance of the interlayer twelve Ag atoms is 2.924 Å (Fig. 2A-II). Both sets of three Ag3(SR)4 motifs and three dppf ligands are arranged in a trillion-shape mode (Fig. 1A). Detailed bond length comparison of Ag22 and Au1Ag21 is shown in Fig. 2. Two pairs of enantiomers of these nanoclusters are shown in Fig. S2 and S3.†
The UV-vis spectra of the purified Ag22 and Au1Ag21 nanoclusters are shown in Fig. 3a and b. Two broad optical absorptions at 406 and 448 nm, along with four shoulder peaks at 480, 515, 565 and 650 nm, are found for Ag22. By comparison, two main peaks at 387 and 430 nm, and two shoulder peaks at 483 and 615 nm are observed for Au1Ag21. The experimental optical absorption spectra are also used to calculate the optical energy gaps (Fig. S4 and S5†) that are 1.49 eV and 1.69 eV for Ag22 and Au1Ag21, respectively. The chemical formulas of both nanoclusters are confirmed by high-resolution ESI-TOF-MS, XPS, and TGA. Firstly, ESI-MS spectra confirmed the purity of Ag22 and Au1Ag21 (Fig. 3c and d). An intense peak at m/z of 3021.72 Da is shown in Fig. 3c, the magnification of this peak evidencing a +2-charge state of Ag22, because this set of peaks shows a characteristic isotopic pattern with peaks separated by an m/z of 0.5 Da. The complete match of experimental and simulated isotope patterns verifies the measured formulas of Ag22. Also, the intense peak of Au1Ag21 matches well with its theoretical value (Fig. 3d). TGA was also employed to test the purity of Ag22 and Au1Ag21 (Fig. 3e and f). The experimental value of 56.65% shows a little difference from the theoretical value of 58.45% for Ag22; for Au1Ag21, the experimental value is determined to be 56.33%, close to its theoretical value of 57.62%. The theoretical value of 58.45 wt% weight loss for [Ag22(dppf)3(SAdm)12]Cl2 was calculated via [M(12SR + 2Cl + 3dppf − 3Fe)/M(22Ag + 12SR + 2Cl + 3dppf)] × 100%. The theoretical value of 57.62 wt% weight loss for [Au1Ag21(dppf)3(SAdm)12]Cl2 was calculated via [M(12SR + 3dppf + 2Cl − 3Fe)/M(Au + 21Ag + 12SR + 3dppf + 2Cl)] × 100%. XPS was performed to probe the compositions of these nanoclusters (Fig. 3g and h), and all the elements in both nanoclusters have been clearly marked. FT-IR spectroscopy was used to characterize the nanoclusters (Fig. S6†). The peaks of 2848 cm−1 and 2905 cm−1 are assigned to 1-AdmSH, and the 3051 cm−1 peak belongs to dppf. DPV measurements were then conducted. For Ag22, two oxidation peaks at 0.869 (O1) and 1.334 V (O2), and three reduction peaks at −1.167 (R1), −1.392 (R2) and −1.770 V (R3) are observed (Fig. S7†). For Au1Ag21, two oxidation peaks at 0.738 (O1) and 1.253 V (O2), and two reduction peaks at −1.538 (R1) and −1.750 (R2) are detected. Generally, the HOMO–LUMO gap corresponds to the difference between O1 − R1 and O2 − O1.38 In this context, the electrochemical HOMO–LUMO gaps are 1.571 V (2.036 V − 0.465 V) and 1.761 V (2.276 V − 0.515 V) for Ag22 and Au1Ag21, respectively; they are consistent with the optical energy gaps.
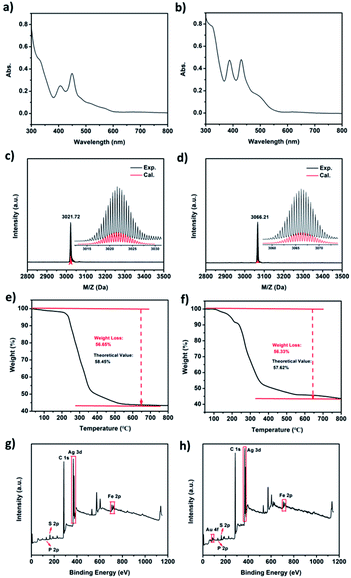 | ||
| Fig. 3 The (a and b) UV-vis spectra; (c and d) ESI-MS spectra; (e and f) TGA spectra and (g and h) XPS spectra of Ag22(dppf)3(SAdm)12(BPh4)2 and Au1Ag21(dppf)3(SAdm)12(BPh4)2. | ||
3.2. CV and LSV measurements for the two nanoclusters
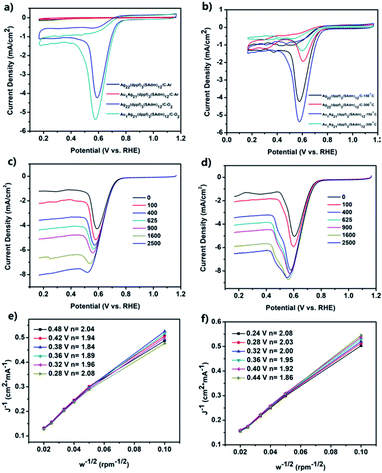
The peak potentials (Ep) and peak current density (jP), as well as the onset potential (Eonset) are the criteria to evaluate the ORR activity of a nanomaterial. Cyclic voltammetry (CV) and linear sweep voltammetry (LSV) measurements were then carried out to study the ORR performances of the activated carbon-supported Ag22 and Au1Ag21 nanoclusters (see the Experimental methods for the preparation of activated carbon-supported nanoclusters).Fig. 4a depicts CV measurements acquired with the catalyst-modified electrodes. In Ar-saturated KOH solution (black and red curves), no redox peak was observed within the potential range of 0.166 to 1.166 V. However, well-defined voltammetric peaks emerged in O2-saturated 0.1 M KOH solution, showing the obvious activity of Ag22(dppf)3(SAdm)12/C and Au1Ag21(dppf)3(SAdm)12/C in the ORR. The peak potentials (Ep) are about 0.59 and 0.57 V for Ag22(dppf)3(SAdm)12/C and Au1Ag21(dppf)3(SAdm)12/C, respectively. The peak current density (jP) of Ag22(dppf)3(SAdm)12/C (4.23 mA cm−2) and Au1Ag21(dppf)3(SAdm)12/C (5.38 mA cm−2) is also observed.
These features indicate the feasibility of exploiting activated carbon-supported nanoclusters as highly efficient ORR catalysts. Owing to the positive synergetic effect between metals, Au1Ag21(dppf)3(SAdm)12/C displays a better activity than Ag22(dppf)3(SAdm)12/C. The loading amount effect for ORR activity was then investigated. Based on the Ep and jP values, a general reactivity trend for both nanoclusters is that 10% loading amount results in the best ORR activity (Fig. S9 and Table S1†). Other contributing factors, such as capping ligands, were also probed. The corresponding test results are shown in Fig. 4b, S10–S12 and Table S2.† The nanoclusters were loaded on activated carbon with uniform dispersion, and typical TEM images of Ag22(dppf)3(SAdm)12/C and Au1Ag21(dppf)3(SAdm)12/C before and after calcination at 150 and 300 °C are shown in Fig. S12.† These results clearly indicate that the calcination processes induce the aggregation of nanoclusters and further result in decreasing ORR activity. Interestingly, this finding is opposed to previous reports on Pd5(C12H25S)13.39 The CV curve of commercial Pt/C is shown in Fig. S13.† The comparison of the ORR activity of M1Ag21(dppf)3(SAdm)12/C with materials in other reported studies in alkaline solutions is shown in Table S3;† the activities of M1Ag21(dppf)3(SAdm)12/C are better than those of most non-Pt ORR electrocatalysts.
In order to gain further insights into the ORR process of the two nanoclusters, linear sweep voltammetry (LSV) measurements were performed at different rotation rates with a scan rate of 0.05 V s−1 in O2-saturated 0.1 M KOH solution using a rotating disk electrode (RDE). All the LSV curves for Ag22(dppf)3(SAdm)12/C and Au1Ag21(dppf)3(SAdm)12/C are shown in Fig. 4c and d. A general observed trend is that the ORR current density increases with increasing electrode rotation rate. The onset potential (Eonset) is found at approximately 0.80 and 0.82 V for Ag22(dppf)3(SAdm)12/C and Au1Ag21(dppf)3(SAdm)12/C, respectively, close to that obtained in CV measurements (Fig. 4a; 0.79 and 0.80 V). Kinetic information on the ORR for both nanoclusters was obtained according to the Koutecky–Levich (K–L) equations. Fig. 4e and f depict the corresponding K–L plots (J−1vs. w−1/2) at various electrode potentials. The data exhibit good linearity, and the slopes remain approximately constant over the potential range of 0.28 to 0.48 V in Fig. 4e, thus suggesting consistent electron transfer for oxygen reduction at different electrode potentials for Ag22(dppf)3(SAdm)12/C. The linearity of the plots is usually taken as an indication of first-order reaction kinetics with respect to dissolved O2. The corresponding numbers (n) of transferred electrons vary from 1.84 to 2.08, indicating that the dominant two-electron ORR process occurs with Ag22(dppf)3(SAdm)12/C. This is the same for Au1Ag21(dppf)3(SAdm)12/C (Fig. 4f) for which the values of n are 1.86–2.08 at the potential range of 0.24–0.44 V, close to the theoretical value (n = 2). Moreover, the stability of these two systems has also been tested (Fig. S14–S17†). For Ag22(dppf)3(SAdm)12/C, after 1000 CV cycles, the limiting current density decreased by only 0.13 mA cm−2, and after another 1000 cycles, the current density decreased by 0.55 mA cm−2. The stability of Au1Ag21(dppf)3(SAdm)12/C is a little poorer than that of Ag22(dppf)3(SAdm)12/C, indicating a decrease of 1.17 mA cm−2 after 2000 cycles compared to the initial value. Meanwhile, the onset potential (Eonset) and half-wave potential (E1/2) remained unchanged after 1000 or 2000 cycles, which indicates that the electrocatalysts are recyclable and stable.
3.3. Possible mechanism rationalizing the increase of ORR activities
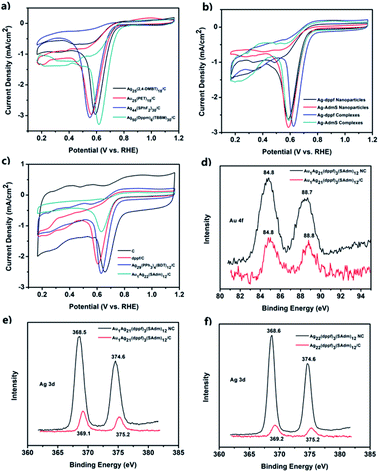
Then, several control experiments were carried out to investigate the origin of the higher catalytic activities of these two systems. CV curves of Ag25(2,4-DMBT)18/C, Au25(PET)18/C, Ag44(SPhF2)30/C, and Ag50(dppm)6(TBBM)30/C are shown in Fig. 5a; these nanoclusters possess sizes similar to that of M1Ag21. Their activities are not as good as that of M1Ag21(dppf)3(SAdm)12/C. In addition, the performances of the smaller complexes or larger nanoparticles were also compared (Fig. 5b and Table 1). These experiments exclude the effects of size on the ORR activity of these systems, i.e., M1Ag21 nanoclusters showed better performances than various other nanoclusters. In order to probe whether it is a cluster core or a ferrocenyl ligand that is responsible for the redox wave in ORR catalysis, the activities of dppf/C, activated carbon (C), Ag29(PPh3)4(BDT)12/C, and Au1Ag22(SAdm)12/C were further compared. As shown in Fig. 5c and Table 1, the blank support and individual dppf/C had poor activities, and the difference between AdmSH and PPh3 was negligible in light of the activities of Ag29(PPh3)4(BDT)12/C and Au1Ag22(SAdm)12/C. Moreover, the XPS spectra of Au 4f and Ag 3d in Au1Ag21 and Au1Ag21(dppf)3(SAdm)12/C (Fig. 5d and e), and Ag 3d in Ag22 and Ag22(dppf)3(SAdm)12/C (Fig. 5f) indicate that there is no charge transfer between the two metals. Notably, the XPS spectra of Ag 3d shift to higher energies upon deposition on C, which is ascribed to ionization of surface Ag (for example, formation of Ag–O oxide) as described in other reports. This shows an increase of electron density (upshift of the d-band center) in Ag, further resulting in improvement of the O2 reduction activities.40–42 The aforementioned experimental results clearly confirm that dppf does play an important role in improving the ORR performance. As a result, the activated carbon-supported Ag22 and Au1Ag21, with a loading of 10% and without pyrolysis, emerged as the optimal ORR catalysts, with better performance than other similar-sized nanoclusters without the dppf ligand (i.e., Ag29, Ag44, Ag50, Au1Ag22, Ag25, and Au25), larger Ag nanoparticles and dppf-containing complexes. Earlier, a large number of theoretical calculations have shown that the origin of the electrocatalytic activity is mainly due to the strain effect, ligand effect, geometric effect or ensemble effect based on various models (the micro-kinetic model, the activity volcano plots, origin of adsorbate scaling relationships).43,44 Taken together, in these two systems, not only in Ag with dppf ligands, but also in the nanocluster Au1Ag21, the ensemble effect is the key factor explaining the excellent ORR performances. The ensemble effect shifts the d-band center of the whole systems downward in energy, leads to weaker binding of intermediates and therefore increases the ORR activity. The parallel computational screening of Au(Rh) and Ag alloys as ORR electrocatalysts has been previously performed by the Henkelman group.45| Sample | E p (V) | j p (mA cm−2) | E onset (V) | E 1/2 (V) | j p (mA cm−2) at 0.57 V |
|---|---|---|---|---|---|
| a E p and jP were determined by CV (Fig. 4a and 5a–c). b E onset, E1/2, and jp at 0.57 V were determined from rotating disk voltammograms with a rotation speed of 2500 rpm (Fig. 4c and d, and ESI Fig. S18–S20). | |||||
| Ag22(dppf)3(SAdm)12/C | 0.59 | 4.23 | 0.82 | 0.63 | 6.75 |
| Au1Ag21(dppf)3(SAdm)12/C | 0.57 | 5.38 | 0.86 | 0.66 | 8.39 |
| Ag25(2,4-DMBT)18/C | 0.59 | 2.96 | 0.79 | 0.62 | 4.01 |
| Au25(PET)18/C | 0.56 | 2.98 | 0.80 | 0.63 | 4.58 |
| Au1Ag22(SAdm)12/C | 0.63 | 1.21 | 0.81 | 0.64 | 2.75 |
| Ag29(PPh3)4(BDT)12/C | 0.63 | 2.54 | 0.78 | 0.67 | 3.79 |
| Ag44(SPhF2)30/C | 0.55 | 3.06 | 0.77 | 0.62 | 5.37 |
| Ag50(dppm)6(TBBM)30/C | 0.61 | 3.28 | 0.81 | 0.66 | 5.27 |
| Ag–dppf complexes | 0.62 | 2.83 | 0.82 | 0.68 | 3.15 |
| Ag–dppf nanoparticles | 0.58 | 2.62 | 0.79 | 0.62 | 3.28 |
| Ag–SAdm complexes | 0.59 | 2.65 | 0.81 | 0.65 | 3.52 |
| Ag–SAdm nanoparticles | 0.59 | 2.85 | 0.78 | 0.63 | 4.59 |
| dppf/C | 0.61 | 2.23 | 0.80 | 0.66 | 3.93 |
| Activated carbon (C) | 0.66 | 2.51 | 0.82 | 0.70 | 3.27 |
| Commercial Pt/C | 0.70 | 5.12 | 0.98 | 0.81 | 8.40 |
Herein, DFT calculations were performed on the interaction of dioxygen and the modelling of Ag22 by simplifying bis(diphenylphosphino)ferrocene (dppf) and SAdm as bis(dimethylphosphino)ferrocene (dmpf) and SMe, respectively. The geometry optimization with DFT calculations (at the GGA:PBE/DND level of theory) on the DMol3 suite of programs implies an exothermic ligation of dioxygen to ferrocene by 2.1 kcal mol−1, as expected. Comparison of the optimized geometry of Ag22(dmpf)3(SMe)12 and Ag22(dmpf)3(SMe)12–O2 indicates opened cyclopentadienyl groups and a short Fe–O distance (3.154 Å, Fig. 6). In addition, the Mülliken charge analysis shows charge transfer from the Ag22(dmpf)3(SMe)12 cluster to the dioxygen moiety (the Mülliken charge of O2 in Ag22(dmpf)3(SMe)12–O2 is −0.135), supporting the reduction of dioxygen by the concerned Ag22 cluster.
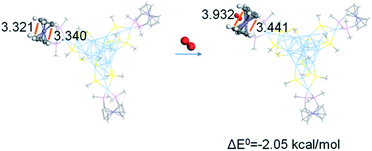 | ||
| Fig. 6 Corresponding distances in the optimized geometry of Ag22(dmpf)3(SMe)12 and Ag22(dmpf)3(SMe)12–O2. | ||
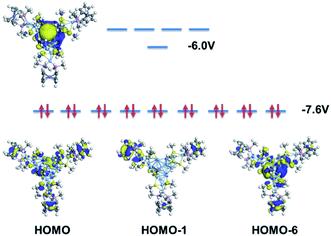
Meanwhile, according to the frontier orbital analysis (Fig. 7), the HOMO of Ag222+ shows 9 degenerate molecular orbitals. Three of them correspond to the supramolecular P orbitals (centered at the metallic core, see HOMO-6 for example), and the other 6 orbitals mainly distributed on the three ferrocene groups (see HOMO and HOMO-1 for example; the full details are provided in Fig. S21†). The extensive orbital contributions of the ferrocene group to the HOMOs support the proposal that the ferrocene-containing ligand enhances the ORR activity.
4. Conclusions
In summary, by introducing the dppf ligand, two novel nanoclusters, Ag22(dppf)3(SAdm)12(BPh4)2 and Au1Ag21(dppf)3(SAdm)12(BPh4)2, have been controllably synthesized. The atomically precise structures of the two nanoclusters were determined by SCXC and further confirmed by ESI-TOF-MS, TGA, XPS, DPV, and FT-IR measurements. Both nanoclusters supported on activated carbon (C) exhibited excellent ORR activity. DFT calculations have confirmed that the presence of the dppf ligand is the underlying cause of improved ORR activity of these two nanoclusters. This study provides new insights into the highly selective 2e-reduction of dioxygen to hydrogen peroxide in nanocluster-based catalysis, which hopefully provides some reference value for future catalytic and ORR studies utilizing nanoclusters.46Conflicts of interest
There are no conflicts to declare.Acknowledgements
Financial support by the National Natural Science Foundation of China (21901001, 21631001), CNRS and University of Bordeaux is gratefully acknowledged.Notes and references
- R. Borup, J. Meyers, B. Pivovar, Y. S. Kim, R. Mukundan, N. Garland, D. Myers, M. Wilson, F. Garzon, D. Wood, P. Zelenay, K. More, K. Stroh, T. Zawodzinski, J. Boncella, J. E. McGrath, M. Inaba, K. Miyatake, M. Hori, K. Ota, Z. Ogumi, S. Miyata, A. Nishikata, Z. Siroma, Y. Uchimoto, K. Yasuda, K. Kimijima and N. Iwashita, Chem. Rev., 2007, 107, 3904–3951 CrossRef CAS PubMed.
- M. K. Debe, Nature, 2012, 486, 43–51 CrossRef CAS PubMed.
- C. Wei, R. R. Rao, J. Peng, B. Huang, I. E. L. Stephens, M. Risch, Z. J. Xu and Y. Shao-Horn, Adv. Mater., 2019, 31, 1806296 CrossRef PubMed.
- D. Astruc, Eur. J. Inorg. Chem., 2017, 6–29 CrossRef CAS.
- A. Togni and T. Hayashi, J. Organomet. Chem., 1995, 498, C27–C28 CrossRef.
- D. G. MacDonald, C. Kübel and J. F. Corrigan, Inorg. Chem., 2011, 50, 3252–3261 CrossRef CAS PubMed.
- D.-S. Park, M. A. Jabbar, H. Park, H. M. Lee, S.-C. Shin and Y.-B. Shim, Bull. Korean Chem. Soc., 2007, 28, 1996–2002 CrossRef CAS.
- S. G. Kim, D. H. Kim, D. M. Kang, M. A. Jabbar, K. S. Min, Y.-B. Shim and S. C. Shin, Bull. Korean Chem. Soc., 2005, 26, 1603–1606 CrossRef CAS.
- S. H. Li, X. Liu, W. Hu, M. Chen and Y. Zhu, J. Phys. Chem. A, 2020, 124, 6061–6067 CrossRef CAS PubMed.
- X. Zou, S. Jin, S. Wang, M. Zhu and R. Jin, Nano Futures, 2018, 2, 045004 CrossRef CAS.
- Q. Tang, G. Hu, V. Fung and D.-e. Jiang, Acc. Chem. Res., 2018, 51, 2793–2802 CrossRef CAS PubMed.
- M. Cao, R. Pang, Q.-Y. Wang, Z. Han, Z.-Y. Wang, X.-Y. Dong, S.-F. Li, S.-Q. Zang and T. C. W. Mak, J. Am. Chem. Soc., 2019, 141, 14505–14509 CrossRef CAS PubMed.
- X. Kang and M. Zhu, Chem. Soc. Rev., 2019, 48, 2422–2457 RSC.
- B. Nieto-Ortega and T. Bürgi, Acc. Chem. Res., 2018, 51, 2811–2819 CrossRef CAS PubMed.
- K. Kwak and D. Lee, Acc. Chem. Res., 2019, 52, 12–22 CrossRef CAS PubMed.
- X. Du and R. Jin, ACS Nano, 2019, 13, 7383–7387 CrossRef CAS PubMed.
- G. Li, H. Abroshan, C. Liu, S. Zhuo, Z. Li, Y. Xie, H. J. Kim, N. L. Rosi and R. Jin, ACS Nano, 2016, 10, 7998–8005 CrossRef CAS PubMed.
- X. Wan, J. Wang, Z. Nan and Q.-M. Wang, Sci. Adv., 2017, 3, e1701823 CrossRef PubMed.
- T. Higaki, Y. Li, S. Zhao, Q. Li, S. Li, X.-S. Du, S. Yang, J. Chai and R. Jin, Angew. Chem., Int. Ed., 2019, 58, 8291–8302 CrossRef CAS PubMed.
- X. Kang, L. Xiong, S. Wang, Y. Pei and M. Zhu, Chem. Commun., 2017, 53, 12564–12567 RSC.
- T. Higaki, Q. Li, M. Zhou, S. Zhao, Y. Li, S. Li and R. Jin, Acc. Chem. Res., 2018, 51, 2764–2773 CrossRef CAS PubMed.
- W. Chang, P.-Y. Lee, J.-H. Liao, K. K. Chakrahari, S. Kahlal, Y.-C. Liu, M.-H. Chiang, J.-Y. Saillard and C. W. Liu, Angew. Chem., Int. Ed., 2017, 56, 10178–10182 CrossRef CAS PubMed.
- Y. Chen, C. Zeng, D. R. Kauffman and R. Jin, Nano Lett., 2015, 15, 3603–3609 CrossRef CAS PubMed.
- R. Qin, K. Liu, Q. Wu and N. Zheng, Chem. Rev., 2020, 120, 11810–11899 CrossRef CAS PubMed.
- M. Zhu, C. M. Aikens, F. J. Hollander, G. C. Schatz and R. Jin, J. Am. Chem. Soc., 2008, 130, 5883–5885 CrossRef CAS.
- M. W. Heaven, A. Dass, P. S. White, K. M. Holt and R. W. Murray, J. Am. Chem. Soc., 2008, 130, 3754–3755 CrossRef CAS PubMed.
- Y. Shichibu, Y. Negishi, T. Watanabe, N. K. Chaki, H. Kawaguchi and T. Tsukuda, J. Phys. Chem. C, 2007, 111, 7845–7847 CrossRef CAS.
- S. Zhao, N. Austin, M. Li, Y. Song, S. D. House, S. Bernhard, J. C. Yang, G. Mpourmpakis and R. Jin, ACS Catal., 2018, 8, 4996–5001 CrossRef CAS.
- H. Chen, C. Liu, M. Wang, C. Zhang, N. Luo, Y. Wang, H. Aroshan, G. Li and F. Wang, ACS Catal., 2017, 7, 3632–3638 CrossRef CAS.
- Y. Chen, C. Liu, Q. Tang, C. Zeng, T. Higaki, A. Das, D.-e. Jiang, N. L. Rosi and R. Jin, J. Am. Chem. Soc., 2016, 138, 1482–1485 CrossRef CAS PubMed.
- S. Tian, Y.-Z. Li, M.-B. Li, J. Yuan, J. Yang, Z. Wu and R. Jin, Nat. Commun., 2015, 6, 8667 CrossRef CAS PubMed.
- Z. Li, C. Liu, H. Abroshan, D. R. Kauffman and G. Li, ACS Catal., 2017, 7, 3368–3374 CrossRef CAS.
- X. Kang, S. Jin, L. Xiong, X. Wei, M. Zhou, C. Qin, Y. Pei, S. Wang and M. Zhu, Chem. Sci., 2020, 11, 1691–1697 RSC.
- Q. Li, T.-Y. Luo, M. G. Taylor, S. Wang, X. Zhu, Y. Song, G. Mpourmpakis, N. L. Rosi and R. Jin, Sci. Adv., 2017, 3, e1603193 CrossRef PubMed.
- Z.-R. Wen, Z.-J. Guan, Y. Zhang, Y.-M. Lin and Q.-M. Wang, Chem. Commun., 2019, 55, 12992–12995 RSC.
- X.-Y. Li, Z. Wang, H. Su, S. Feng, M. Kurmoo, C.-H. Tung, D. Sun and L.-S. Zheng, Nanoscale, 2017, 9, 3601–3608 RSC.
- L.-Y. Yao and V. W.-W. Yam, J. Am. Chem. Soc., 2016, 138, 15736–15742 CrossRef CAS PubMed.
- X. Kang, S. Chen, S. Jin, Y. Song, Y. Xu, H. Yu, H. Sheng and M. Zhu, ChemElectroChem, 2016, 3, 1261–1265 CrossRef CAS.
- Z. Zhuang and W. Chen, J. Colloid Interface Sci., 2019, 538, 699–708 CrossRef CAS.
- L. Wang, Z. Tang, W. Yan, H. Yang, Q. Wang and S. Chen, ACS Appl. Mater. Interfaces, 2016, 8, 20635–20641 CrossRef CAS PubMed.
- X. Xie, M. Wei, L. Du, Y. Nie, X. Qi, Y. Shaob and Z. Wei, J. Mater. Chem. A, 2017, 5, 15390–15394 RSC.
- L. Sumner, N. A. Sakthivel, H. Schrock, K. Artyushkova, A. Dass and S. Chakraborty, J. Phys. Chem. C, 2018, 122, 24809–24817 CrossRef CAS.
- J. A. Trindell, Z. Duan, G. Henkelman and R. M. Crooks, Chem. Rev., 2020, 120, 814–850 CrossRef CAS PubMed.
- Y. Jiao, Y. Zheng, M. Jaroniecb and S. Z. Qiao, Chem. Soc. Rev., 2015, 44, 2060–2086 RSC.
- H. Li, L. Luo, P. Kunal, C. S. Bonifacio, Z. Duan, J. C. Yang, S. M. Humphrey, R. M. Crooks and G. Henkelman, J. Phys. Chem. C, 2018, 122, 2712–2716 CrossRef CAS.
- Y. Du, H. Sheng, D. Astruc and M. Zhu, Chem. Rev., 2020, 120, 526–622 CrossRef CAS PubMed.
Footnote |
| † Electronic supplementary information (ESI) available: Synthesis, characterization, and electrochemical measurements. Details and crystal data of Ag22(dppf)3(SAdm)12(BPh4)2 and Au1Ag21(dppf)3(SAdm)12(BPh4)2 (cif). CCDC 2031749 and 2031750. For ESI and crystallographic data in CIF or other electronic format see DOI: 10.1039/d0sc05923d |
| This journal is © The Royal Society of Chemistry 2021 |

