
 Open Access Article
 This Open Access Article is licensed under a Creative Commons Attribution-Non Commercial 3.0 Unported Licence
Data-efficient machine learning for molecular crystal structure prediction†
Simon
Wengert
a,
Gábor
Csányi
 b,
Karsten
Reuter
ac and
Johannes T.
Margraf
*ac
b,
Karsten
Reuter
ac and
Johannes T.
Margraf
*ac
aChair of Theoretical Chemistry, Technische Universität München, 85747 Garching, Germany
bEngineering Laboratory, University of Cambridge, Cambridge CB2 1PZ, UK
cFritz-Haber-Institut der Max-Planck-Gesellschaft, Faradayweg 4-6, 14195 Berlin, Germany. E-mail: margraf@fhi.mpg.de
First published on 11th February 2021
Abstract
The combination of modern machine learning (ML) approaches with high-quality data from quantum mechanical (QM) calculations can yield models with an unrivalled accuracy/cost ratio. However, such methods are ultimately limited by the computational effort required to produce the reference data. In particular, reference calculations for periodic systems with many atoms can become prohibitively expensive for higher levels of theory. This trade-off is critical in the context of organic crystal structure prediction (CSP). Here, a data-efficient ML approach would be highly desirable, since screening a huge space of possible polymorphs in a narrow energy range requires the assessment of a large number of trial structures with high accuracy. In this contribution, we present tailored Δ-ML models that allow screening a wide range of crystal candidates while adequately describing the subtle interplay between intermolecular interactions such as H-bonding and many-body dispersion effects. This is achieved by enhancing a physics-based description of long-range interactions at the density functional tight binding (DFTB) level—for which an efficient implementation is available—with a short-range ML model trained on high-quality first-principles reference data. The presented workflow is broadly applicable to different molecular materials, without the need for a single periodic calculation at the reference level of theory. We show that this even allows the use of wavefunction methods in CSP.
1 Introduction
The capability to reliably predict the structure of molecular crystals is considered one of the holy grails of molecular modeling.1,2 Applications for such crystal structure prediction (CSP) methods range from finding new drugs with improved dissolution properties (and thus bioavailability) to organic semiconductors with novel optoelectronic properties.3,4 CSP for these molecular materials is so elusive because both their properties and stabilities are critically determined by the interactions of their molecular building blocks in the condensed phase. Indeed, the competition of different interaction types (e.g. dispersion and hydrogen bonding) within molecular crystals often leads to the coexistence of multiple similarly stable crystal structures—so-called polymorphs—each exhibiting different physical properties.5,6 The ability to predict these polymorphs from simulations would therefore allow the efficient exploitation of the great technological potential inherent in this structural diversity, but requires an unparalleled CSP accuracy/efficiency ratio to explore the vast configuration spaces with highest energetic precision.In practice, this search requires the reliable assessment of the relative stability of different structures, as measured by the lattice energy:
| Elatt = Ecrys/N − Eiso, | (1) |
In recent years, a range of methods have been developed for the approximate stability assessment in the initial screening step. Li et al.11 for instance evaluate stabilities of trial configurations by applying the Harris approximation to DFT, with crystal electron densities constructed from the superposition of frozen single molecule densities. Tailor-made empirical potentials have also been successfully used for the screening step, as demonstrated for instance by Neumann et al.12 in the blind tests of organic crystal structure prediction organized by the Cambridge Crystallographic Data Center9 (CCDC). Finally, semiempirical electronic structure methods like density-functional tight-binding (DFTB) have also emerged as promising tools to efficiently rank the stabilities of molecular crystal structures.13,14 Note that the initial screening can itself be hierarchical, so that the overall CSP workflow often resembles a funnel of increasingly narrow and accurate selection schemes. Nevertheless, regardless of how the most promising candidates are selected, the final step of a hierarchical CSP workflow requires an accurate first-principles method that allows resolving the subtle stability differences between competing polymorphs, presently typically semi-local or hybrid DFT with a many-body dispersion correction (DFT+MBD).10
There are essentially two sources of error in such hierarchical CSP schemes. First, the initial screening may either not consider the true lowest-energy structure in the first place or discard it erroneously. Second, the high-level method in the final layer may not produce the correct ranking of the remaining candidates. Unfortunately, the obvious solutions to these issues preclude each other: on the one hand, the selection issue can be mitigated by starting with a larger set of candidates and less severe filtering. On the other hand, better ranking can be achieved with more elaborate methods, at a higher computational cost per evaluation. For a fixed computational budget one cannot do both of these things. What is worse, in general it is not clear at the outset which of the two is more critical.
A potential way out of this conundrum is offered by modern machine-learning (ML) techniques, which have been found to combine the accuracy required in many chemical applications with affordable computational costs (most of which is associated with the generation of training data rather than the actual application of the potential).15–17 In particular, much progress has recently been made in the development of ML-models for high-dimensional potential energy surfaces such as Neural Network Potentials (NNPs) via the Generalized Neural-Network Representation of Behler and Parrinello18 or the Gaussian Approximation Potentials (GAP) framework developed by Bartók et al.19 A more comprehensive overview of ML techniques for the generation of interatomic potentials can be found elsewhere.20–22
The high flexibility of ML models—which can be considered the reason of their success—can also lead to unphysical results, however, if the model is forced to extrapolate beyond its training set. Consequently, robust and accurate ML potentials are often trained on tens of thousands of configurations, for which accurate reference data is required.23 Fortunately, interatomic potentials need not necessarily be created from scratch. Instead, ML models have also been used to improve the description of an underlying baseline.24,25 Ramakrishnan et al.26 coined the expression Δ-ML for this approach and showed that one needs significantly fewer training examples in this case, compared to learning a complete interatomic potential. In the context of CSP, there is a further strong argument for Δ-ML: most ML potentials are inherently local, meaning that the energy is composed of atomic contributions that only depend on the immediate environment of each atom. Yet, intermolecular interactions like electrostatics and (many-body) dispersion can be quite long ranged. A local ML potential will neglect those contributions, whereas a Δ-ML approach can incorporate them in the baseline model without altering the ML framework.
In this paper we therefore develop a Δ-ML approach to CSP, yielding accurate models for the description of individual molecules and the corresponding molecular crystals. The approach is characterized by high data efficiency, meaning that the workflow is designed to keep the computational effort for training data generation as low as possible. This is achieved by using a robust and computationally efficient baseline method, a diversity-driven selection of training points and the complete avoidance of periodic calculations at the target level of theory (here full-potential DFT with a many-body dispersion correction or spin-component-scaled second order perturbation theory).
2 Theory
2.1 Levels of theory
3ob is based on the expansion of the DFT total energy up to third-order in density-fluctuations (DFTB3), which provides a sophisticated description of electrostatics, charge transfer and polarization.28 This leads to marked improvements in the description of organic and biomolecular systems and hydrogen bonding, compared to earlier variants. Since DFTB uses a minimal basis set and tabulated matrix elements, it provides speedups up to three orders of magnitude compared with semi-local DFT. We further apply the Tkatchenko–Scheffler (TS) correction,14,29 which allows for an accurate incorporation of dispersion interactions at virtually no additional computational cost. Our baseline method is thus defined as DFTB3(3ob)+TS (called DFTB+TS in the following).
With the above definitions of the target (DFT+MBD) and baseline (DFTB+TS) methods and the Δ-ML approach (GAP) used to connect the two, the lattice energy as measure of crystal stability is written as:
| Etargetlatt ≈ Ebaseline+GAPlatt = Ebaselinecrys/N − Ebaselineiso + ΔEGAP | (2) |
In the following, we further separate this Δ-ML contribution into intra- (ΔEGAP(intra)) and intermolecular (ΔEGAP(inter)) contributions. This has both theoretical and practical reasons. Firstly, the energetic contribution of, e.g., stretching a covalent bond is orders of magnitude larger than the contribution of changing the distance between two molecules in a crystal by the same amount. Nonetheless, the intermolecular contributions are arguably much more important for CSP and final polymorph ranking, as evidenced by the wide application of CSP protocols with completely rigid molecules.11,39,40 By fitting separate models, the intermolecular contributions are not overshadowed by the intramolecular ones. Secondly, data generation for an intramolecular correction is very cheap, as it only requires calculations on the gas-phase molecule. It is therefore practical to separate the two training processes.
Using this separation, we can rewrite eqn (2) as
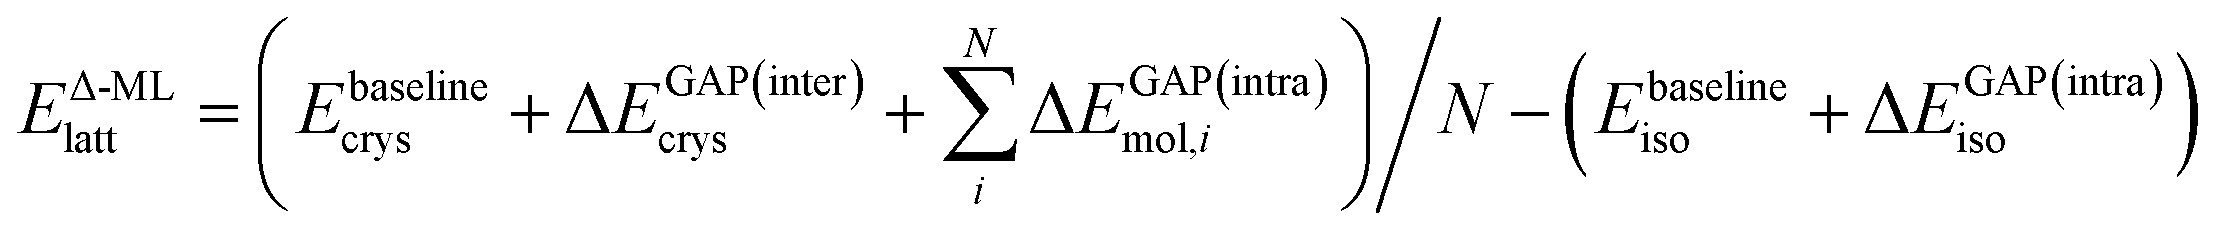 | (3) |
2.2 Training data
The generation of training data is a crucial part of constructing any ML model. This data represents all knowledge about the target function that will be integrated into the fit. The required calculations at the target level of theory, however, typically also make this the most expensive part of any ML workflow. It is therefore essential to strike a balance between covering a wide range of configurations and requiring a manageable number of calculations.To address this issue, we generate a large pool of trial configurations and subsequently select a maximally diverse subset using the farthest point sampling (FPS) method.21,41 This entails the iterative selection of configurations so that each new datapoint is maximally dissimilar to the previously selected structures. In this context, the similarity between configurations is measured using the averaged SOAP kernel.42
Clearly, the most straightforward training data for the Δ-ML correction would be obtained from periodic calculations on the FPS crystals at the target level of theory (DFT+MBD in this case). However, these are precisely the kinds of expensive calculations that we would like to avoid by fitting a Δ-ML model. Furthermore, it would in principle be interesting to use even higher levels of theory (e.g. Coupled Cluster or Symmetry Adapted Perturbation Theory) as the target method, for which periodic calculations are either impossible or extremely demanding.
Fortunately, we found that it is possible to fit accurate Δ-ML models without using periodic calculations at the target level of theory at all. Specifically, we use crystal structures as templates to generate molecular clusters (called X-mers in the following), which reflect the diverse relative orientations of the molecules in a crystal, in addition to providing realistic monomer configurations (see Fig. 1).
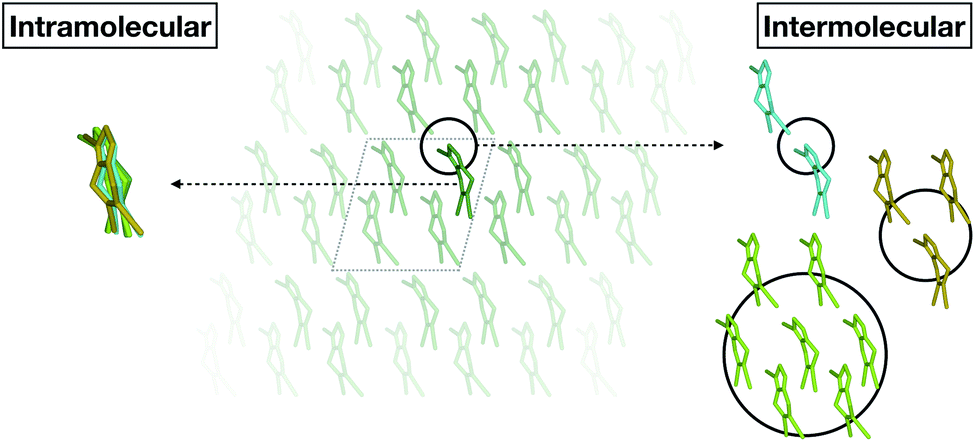 | ||
| Fig. 1 Schematic separation of a crystal into monomers (entering the GAP(intra) learning workflow) and X-mers of various sizes (entering the GAP(inter) learning workflow). | ||
The idea of using X-mer training data is reminiscent of a many-body expansion (MBE) of the lattice energy.43 This is, however, notoriously difficult to converge for (polar) organic crystals and liquids, both in terms of length-scale and body-order.44–46 For this reason, highly accurate MBE-based water models separate the description of long-range electrostatics from short-range interactions.47 It is therefore highly beneficial to work in a Δ-ML framework herein, where long-range interactions are covered by the baseline method. Indeed, a ML correction for force-field lattice energies based solely on two-body terms was recently reported by Day and coworkers.48 In our work, we found that a pure two-body correction still displays significant errors in predicted lattice energies, and thus opted for the X-mer approach.
To this end, an initial pool of crystals is generated via the Genarris package.11 Subsequently, we apply FPS to select 500 maximally diverse structures from this pool. These structures are then relaxed at the baseline level of theory, with fixed unit cells. Afterwards, a second FPS selection is performed on the relaxed crystals to obtain 250 training structures, while the rest are used for testing. Further details about training and test sets are given in the ESI.† Note that the training data for the intramolecular model is, inter alia, further supplemented with monomer configurations obtained from gas-phase MD simulations (see ESI† for details).
2.3 Model fitting
Using the above defined training data, we can now train separate GAP models for the intra- and intermolecular corrections. Specifically, we train the intramolecular correction on energy and force differences: | (4) |
The intermolecular correction is trained on differences in X-mer interaction energies:
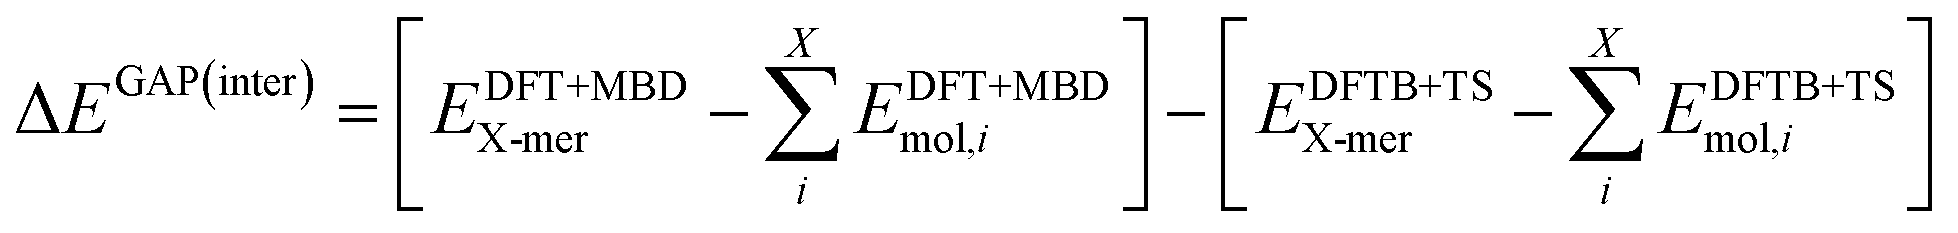 | (5) |
Details about the underlying concepts of SOAP and GAP are provided in the original literature.19,38,49 A detailed listing of all hyperparameters and computational settings used in this work can be found in the ESI.†
3 Results and discussions
To illustrate the accuracy and efficiency of our Δ-ML approach, we will first separately discuss the accuracy reached for the intra- and intermolecular corrections, relative to their training targets. We then consider the accuracy of predicted lattice energies. For this we employ a representative set of four molecules and their molecular crystals, namely water (H2O), pyrazine (C4N2), oxalic acid (C2O4H2) and tetrolic acid (C4O2H4).3.1 Model performance: intramolecular Δ-ML
The accuracy of the intramolecular correction is assessed on monomer configurations extracted from the test and training crystals. Fig. 2 (top) shows the mean absolute error (MAE) of relative energies, compared to the high-level target method (DFT+MBD). For the DFTB+TS baseline, this MAE can be as high as 150 meV (for oxalic acid). This is a serious liability for CSP, where energy differences between polymorphs are often only tens of meV. In contrast, after the Δ-ML correction, the MAEs are reduced by orders of magnitude. Even in the most challenging case (oxalic acid) the corrected MAE is below 2 meV. Moreover, the good agreement between training and test errors shows that the models are not overfitted. For the analysis on the accuracy of forces the reader is referred to the ESI.†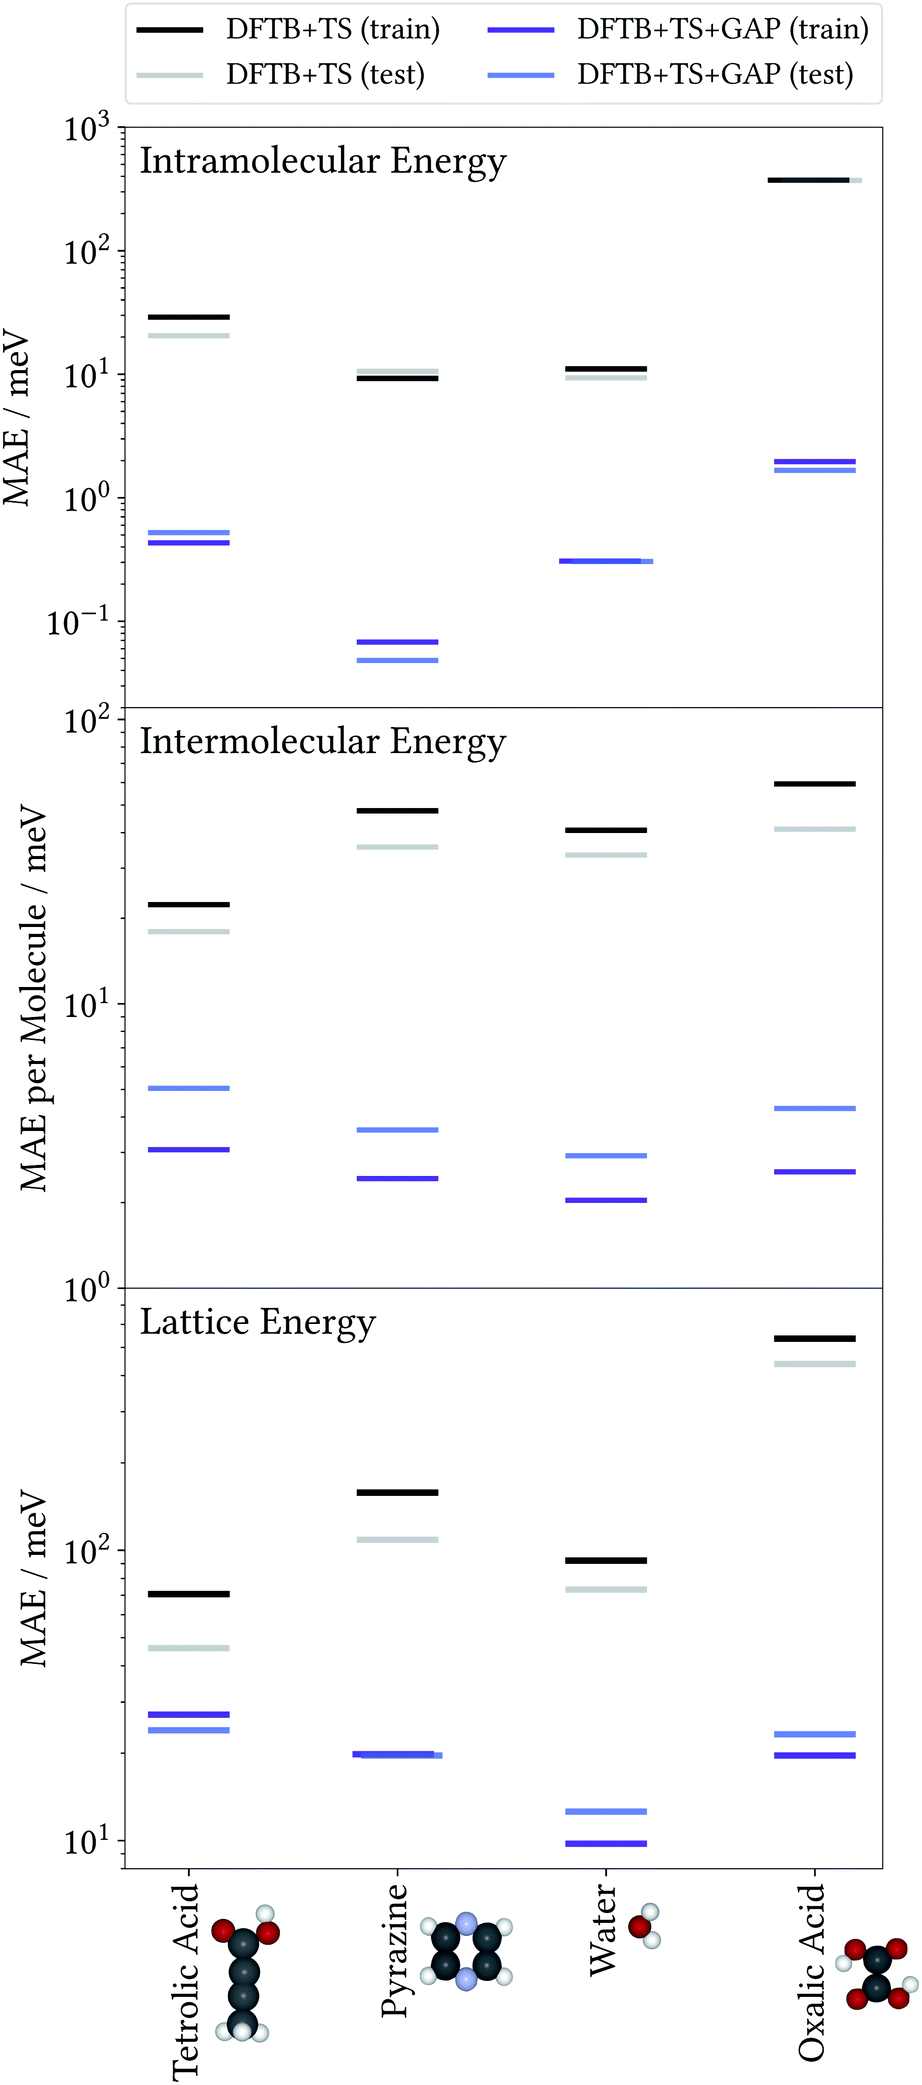 | ||
| Fig. 2 Mean absolute error (MAE) of relative energies—with respect to the individual gas-phase global minimum—obtained with the baseline (DFTB+TS) and Δ-ML corrected (DFTB+TS+GAP) methods, against the DFT+MBD reference for monomer conformations from training and test crystals (top). Mean absolute error of intermolecular energies per molecule obtained with DFTB+TS and DFTB+TS+GAP against DFT+MBD for training and test X-mers (center). Mean absolute error for lattice energies of crystals entering the training and test crystals against the DFT+MBD reference (bottom). For details see text. | ||
As a case in point, the excellent performance of the Δ-ML correction is confirmed when analyzing the seven predicted conformers of oxalic acid in detail. Indeed, conformer searches are themselves an integral part of molecular CSP studies, as gas-phase geometries are typically used as building blocks for the generation of trial crystals. Furthermore, the globally most stable gas-phase conformer is of special interest as the lattice energy is measured relative to it. Fig. 3 compiles the ranking of these seven conformers obtained at the different levels of theory, where we follow the nomenclature proposed in the literature50 and refer to the conformers with a capital C (cis) or T (trans) depending on the relative orientation of the carboxylic acid groups, framed by lowercase c or t indicating whether the hydrogen atoms point to the inside or the outside. For the twisted conformer, where this nomenclature is not applicable, we use the symbol X.
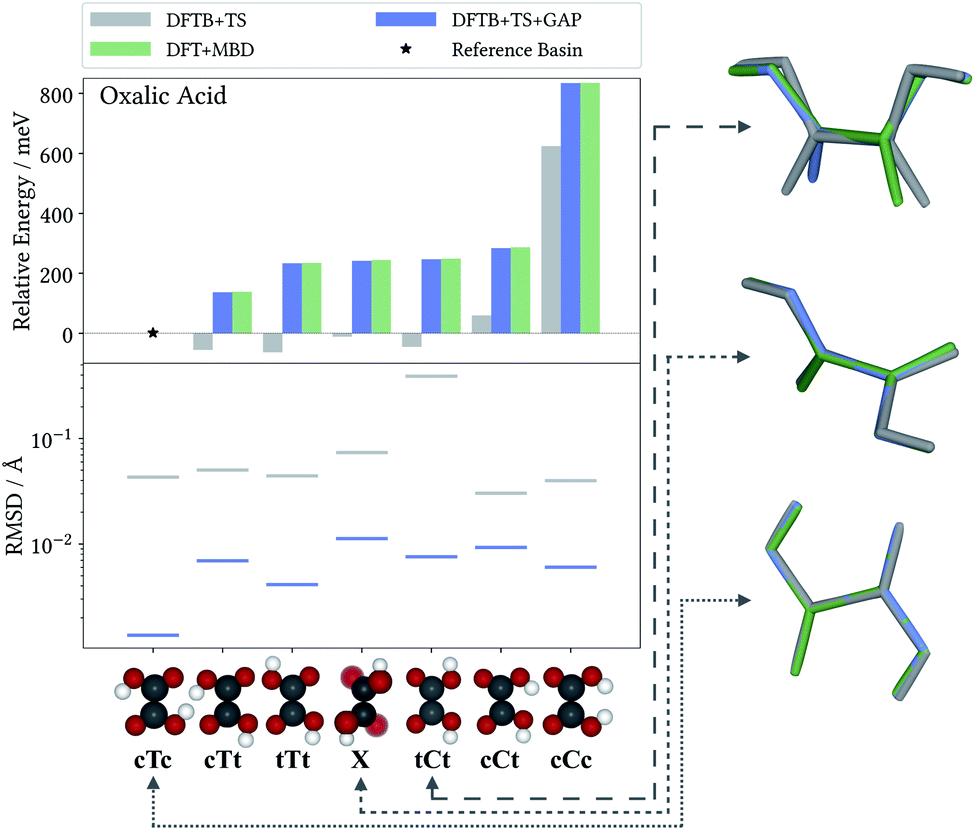 | ||
| Fig. 3 Relative energies (top) and RMSDs (bottom) for oxalic acid gas-phase configurations relaxed with the DFTB+TS baseline, the DFTB+TS+GAP Δ-ML correction and the DFT+MBD reference. Structural overlays (right) for three conformers comparing the geometries predicted at the different levels of theory (see text). | ||
For this highly sensitive test case, the Δ-ML method fully reproduces the energetic ordering of the target DFT+MBD method—which in turn is in agreement with the literature.50,51 In contrast, the baseline DFTB+TS energies differ significantly and not even the lowest-energy conformer is correctly identified (reflected by the negative relative energy). In particular, DFTB+TS erroneously predicts most conformers to be rather close in energy, which could have severe consequences for an intended use as an initial screening method.
It is further revealing to consider the quality of the predicted geometries (see Fig. 3, bottom). For each conformer, the differences between geometries optimized with the low-cost methods (DFTB+TS or DFTB+TS+GAP) and the respective DFT+MBD reference is measured in terms of their root-mean-square deviation (RMSD). Similarly to the energies, the GAP-correction strongly improves the RMSD of all conformers—in most cases by more than an order of magnitude. At the same time it can be seen that DFTB+TS alone already provides quite accurate geometries in most cases. Here, the GAP correction cures only some subtle structural differences with respect to the DFT+MBD reference, as can be seen from the cTc overlay in Fig. 3, where the C–O–H angle in DFTB+TS is slightly too large. The exception to this is the tCt conformer. Here, DFTB+TS predicts a considerably different structure, which is brought into excellent agreement with the reference by the GAP-correction. This is again illustrated by the overlayed geometries, where DFT+MBD and DFTB+TS+GAP are almost indistinguishable.
3.2 Model performance: intermolecular Δ-ML
To evaluate the accuracy of the intermolecular Δ-ML contribution, we consider the intermolecular energies of X-mers, which are the training targets of this correction (see ESI† for a corresponding analysis of crystals). To this end, we consider X-mers of various sizes, again obtained from the training and test crystals. Fig. 2 (center) summarizes these results, in terms of the MAE, normalized by the number of molecules per X-mer. The Δ-ML method yields MAEs between 3 and 5 meV per molecule for test systems and slightly lower values for the training systems (1–2 meV per molecule). Again, the good agreement between test and training errors indicates that the proposed workflow yields Δ-ML models which generalize well beyond the training set.Interestingly, tetrolic and oxalic acid show slightly larger MAEs, compared to pyrazine and water. We speculate that this is due to the higher flexibility of these molecules (see e.g. the oxalic acid conformers of Fig. 3), which causes a more diverse range of intermolecular arrangements. Overall, the GAP correction nevertheless improves the MAE per molecule by an order of magnitude (except for the tetrolic acid case, where the pure DFTB+TS description already yields a low MAE of around 20 meV per molecule).
3.3 Lattice energies
So far, we have analysed the accuracy of the intra- and intermolecular corrections on their respective training targets, and found large improvements relative to the baseline. However, the goal of the proposed method is to improve the description of crystal lattice energies. To evaluate this, we now benchmark the baseline and Δ-ML methods against the DFT+MBD target method for the lattice energies of molecular crystals. We again consider the crystals used to generate training and test sets separately. Note however, that even for the “training” crystals, the lattice energies were not used to fit the models. In this sense, all predictions in this section can be considered a validation of the Δ-ML model. Note that the lattice energies are referenced to the global gas-phase minimum of the molecule, calculated with the respective method. In the case of oxalic acid, the DFTB+TS lattice energies are therefore given with respect to a different gas-phase geometry.The results are summarized in Fig. 2 (bottom). This figure shows that the improved description of intra- and intermolecular interactions also translates to an improved description of lattice energies, as expected. Specifically, the MAEs of the Δ-ML model lie between 12 and 24 meV per molecule, which in most cases corresponds to about an order of magnitude improvement. The exception is again tetrolic acid, which is already well described at the DFTB+TS level (but still improved by the GAP correction). These small MAEs also confirm our initial assumption, namely that the DFTB+TS baseline we employ adequately describes long-range interactions. This is further substantiated by considering the intermolecular contributions to the lattice energy separately, as shown in the ESI.†
From a CSP perspective, the lattice energies are arguably less important than the energetic ordering of the crystal structures, since we are more interested in which is the most stable crystal, rather than how stable it is in absolute terms. Fig. 4 therefore also includes the coefficients of determination (R2) for the ranking order of the structures, which maps the correlation between reference and predicted data in a range between 0 (no correlation) and 1 (perfect correlation). Again, these are significantly improved by the GAP correction, with values between 0.967 and 0.995 indicating an excellent correlation between the energetic orderings of our Δ-ML model and the DFT+MBD target.
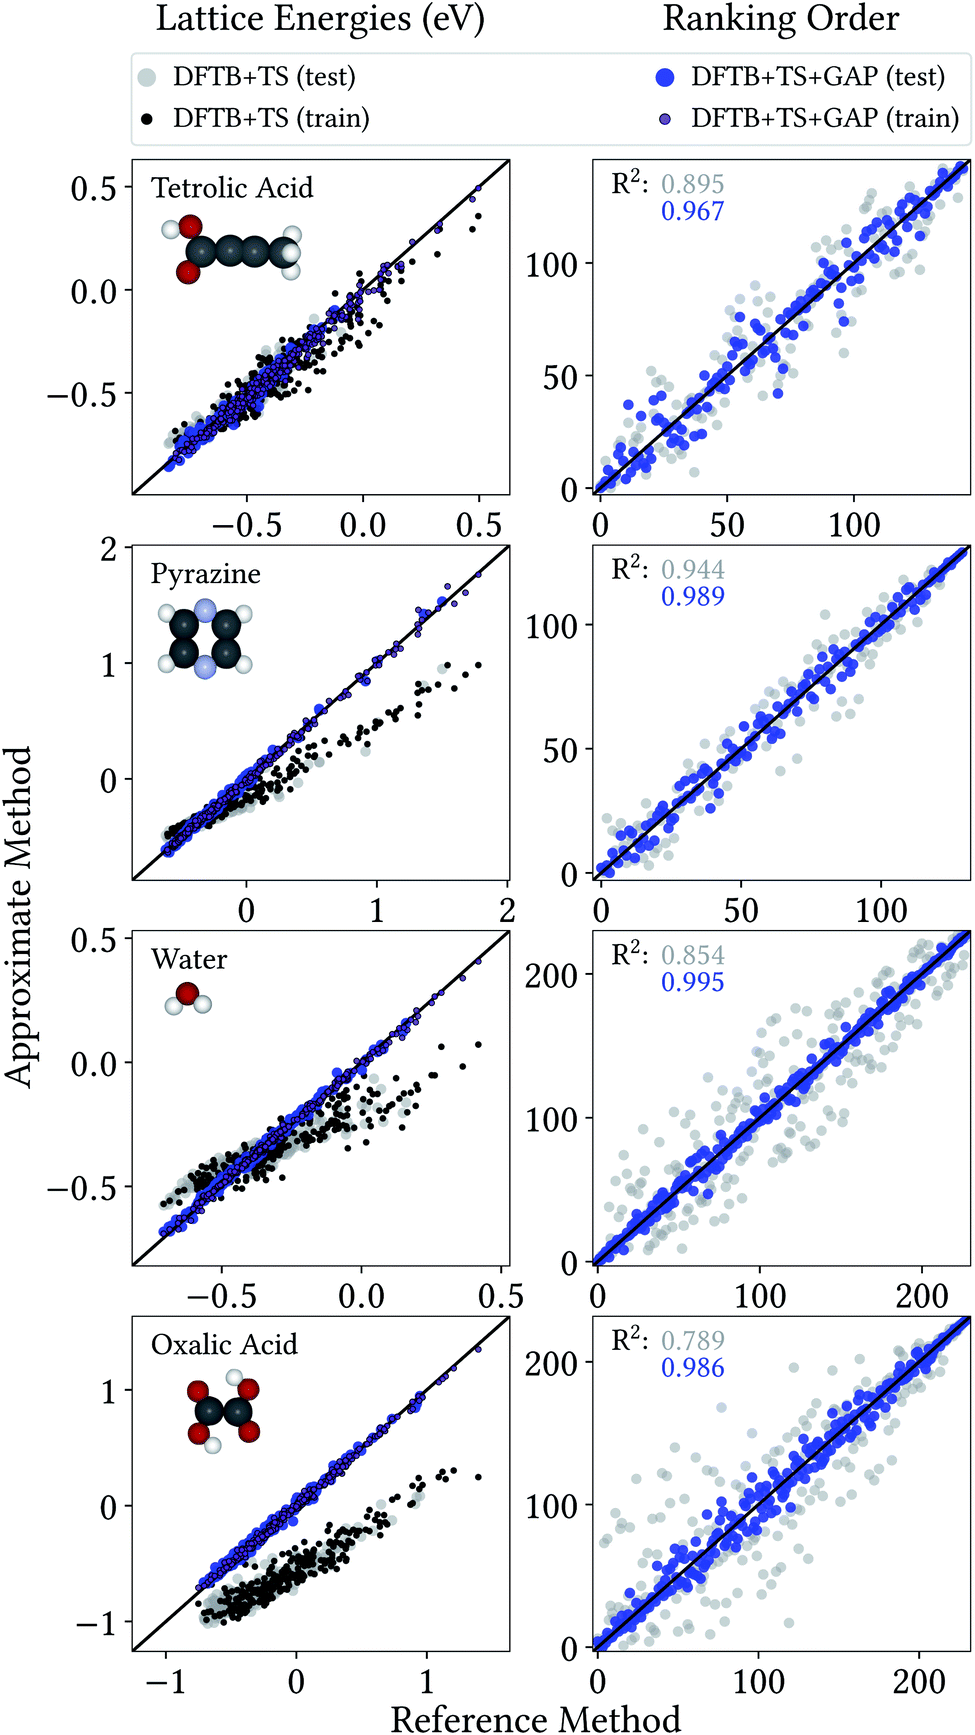 | ||
| Fig. 4 Correlation plot for lattice energies of crystals entering the training and test crystals (left) and ranking order of test crystals (right), both with respect to DFT+MBD. | ||
Importantly, errors for test crystals and the ones that (implicitly) enter the training are also in excellent agreement. This indicates a good generalization of the Δ-ML models beyond their training sets, also for the application to periodic systems. It is further notable that the MAEs for the baseline method are consistently larger for the training than the test set. This confirms that the workflow for training data selection leads to a set of particularly challenging and diverse systems. This can also be seen from the lattice energy correlation plots in Fig. 4, where the training structures cover the full range of lattice energies. In this context, it should be noted that the sampled range covers both negative and positive lattice energies. Although the focus of CSP is obviously on the systems with the most negative lattice energies, there are many trial crystals that need to be evaluated in the process. As these are not necessarily stable, creating a model that covers both ranges is actually desired, not least to be able to confidently discard unstable structures.
Fig. 4 provides more detailed insight into the performance of the baseline and Δ-ML models for the individual systems. As mentioned above, the baseline already provides a reasonable description of tetrolic acid. Nonetheless, there is significant scatter in the DFTB+TS correlation plot, which is also reflected in the energy ranking. Here, the GAP correction accounts for the subtle differences between baseline and target, leading to significant improvement.
In contrast, the lattice energy correlation plot for pyrazine displays a large systematic error, reflected in an erroneous slope (and consequently a large MAE). This deviation can be traced back to the fact that, for this system, unfavourable intermolecular interactions are less repulsive at the baseline level, compared to DFT+MBD (see ESI†). These systematic errors do not affect the ranking, however, which is in good agreement with DFT+MBD (R2 = 0.944). The GAP correction is able to correct the systematic error in the lattice energies, leading to a strongly improved MAE. Importantly, however, the correction also further improves the energy ranking (R2 = 0.989).
For water and oxalic acid, we observe both systematic errors and significant scatter in the predictions of the baseline method. Here, the GAP corrections need to account for a mixture of different effects simultaneously. The lattice energy correlation plots indicate different types of systematic deviations for these systems. While the slope for the water lattice energies is too small, oxalic acid additionally shows an offset of roughly 200 meV with respect to the DFT+MBD values. As with pyrazine, the erroneous slopes are explained by a systematic underestimation of repulsive intermolecular interactions (see ESI†). Meanwhile, the offset for oxalic acid is due to differences in intramolecular interactions at the baseline and target levels (compare Fig. 3). Here, the different predicted global minimum conformers result in a discrepancy of the intramolecular contributions to the lattice energy. As shown in Section 3.1 the GAP correction is very well suited to account for this situation. More generally, the GAP corrections lead to strongly improved lattice energies and ranking orders for both systems.
To quantify the error introduced by the X-mer approach, we further created an alternative set of Δ-ML models (see ESI†). Here, the intermolecular corrections were trained on FPS-selected crystals instead of the X-mers. Compared to the X-mer approach, these models display slightly improved lattice energies for most cases (by 4–6 meV per molecule) and are slightly worse in one case. The error incurred by the X-mer approach is thus small or non-existent for the systems considered herein.
3.4 Crystal structure prediction
To allow for a pointwise comparison of interaction potentials, the lattice energies in the previous section were computed via single point energy evaluations for frozen geometries (relaxed at the baseline level). Indeed, this strategy has also been employed in ‘real’ CSP applications.14 However, the results in Section 3.1 show that the DFTB+TS baseline used herein can yield significantly erroneous geometries. This is an uncontrolled source of error, which will propagate through the entire CSP workflow. Fortunately, GAP models are differentiable, so that geometry relaxations at the Δ-ML corrected DFTB+TS+GAP level are also possible, at essentially no added cost. In this section, we will illustrate the benefit of this feature.For this purpose, we consider target XXII of the most recent blind test of organic CSP.9 It corresponds to the crystallized form of the tricyano-1,4-dithiino[c]-isothiazole (C8N4S) molecule. Notably, the six-membered ring in this molecule can be hinged, which induces a chiral-like character to the molecule and, thus, affects the number of space groups allowed in the solid state.
A Δ-ML model for target XXII was generated following the method detailed in Section 2. All results discussed in the following are for randomly generated trial crystal structures not included in the training process. Additionally, the known experimental crystal structure of the molecule is included,52 to test whether it would have been correctly identified. Unlike in the previous section, all trial structures are relaxed at the baseline DFTB+TS and Δ-ML corrected DFTB+TS+GAP levels of theory, and validated with single point calculations at the target DFT+MBD level (see ESI† for an analysis as in Section 3.3). Fig. 5 shows the corresponding lattice energy correlation plot, as well as the ranking order.
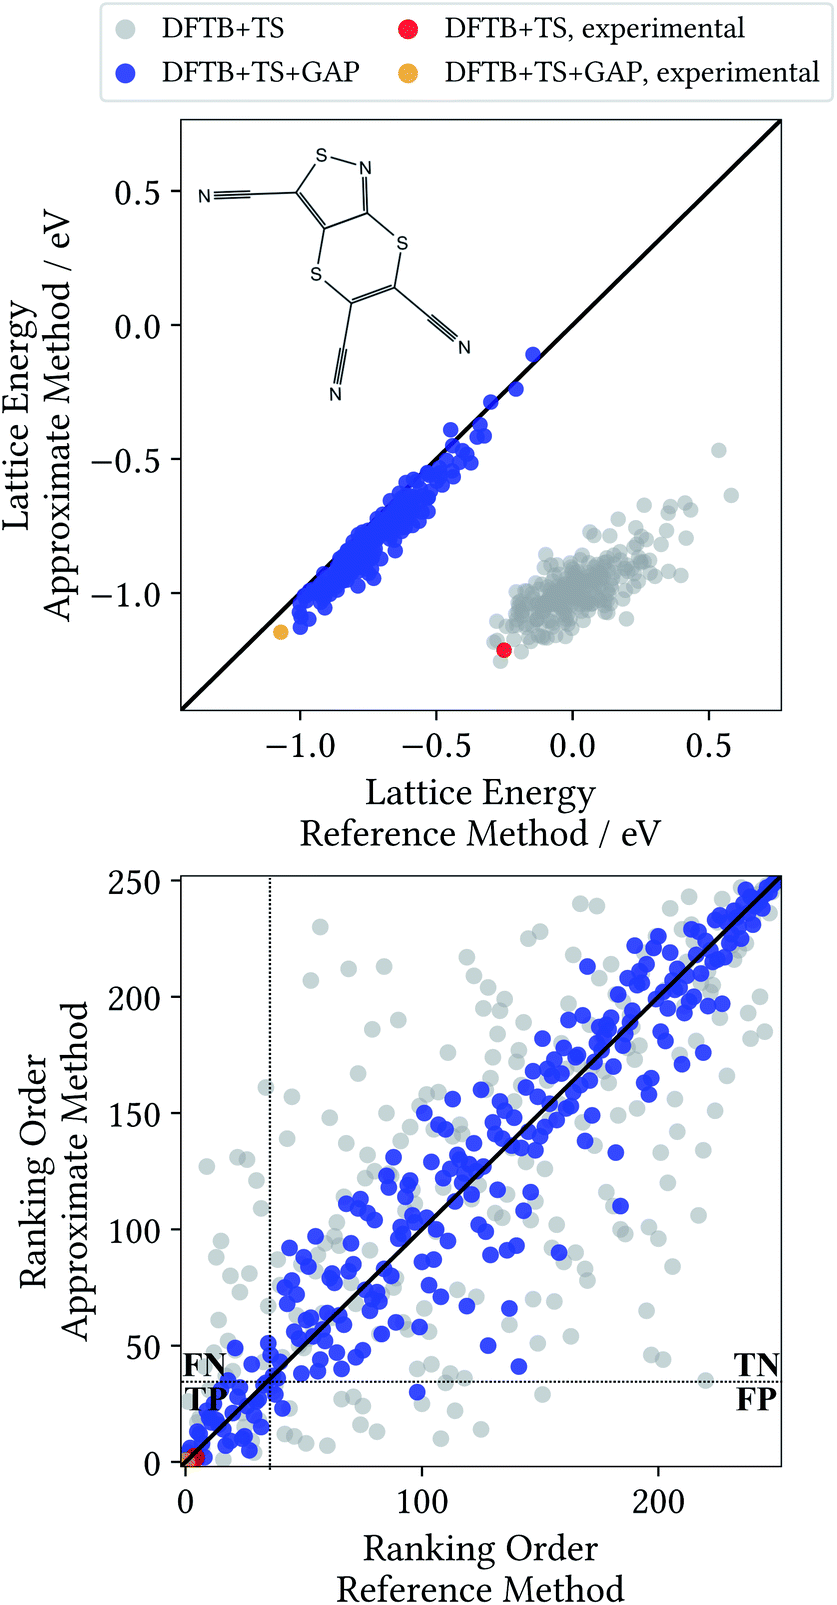 | ||
| Fig. 5 Correlation plot for lattice energies of XXII crystals relaxed with the DFTB+TS baseline and the Δ-ML corrected DFTB+TS+GAP method against the respective DFT+MBD target level values (top) and corresponding ranking order (bottom) with separation into the four parts True-Positive (TP), True-Negative (TN), False-Positive (FP) and False-Negative (FN) – see text. | ||
The most striking feature of the lattice energy plot is a large offset between the baseline and target predictions. Similar to the oxalic acid case, this is—at least partly—explained by deviations in the intramolecular descriptions. DFT+MBD favours the two symmetry-equivalent conformations that exhibit a kink in the six-membered ring. Fig. 6 shows the DFT+MBD minimum energy path for the interconversion of these structures, obtained from a nudged elastic band (NEB) calculation. Here, the flat conformation of the molecule is found to be a saddle point, in agreement with previous reports.9
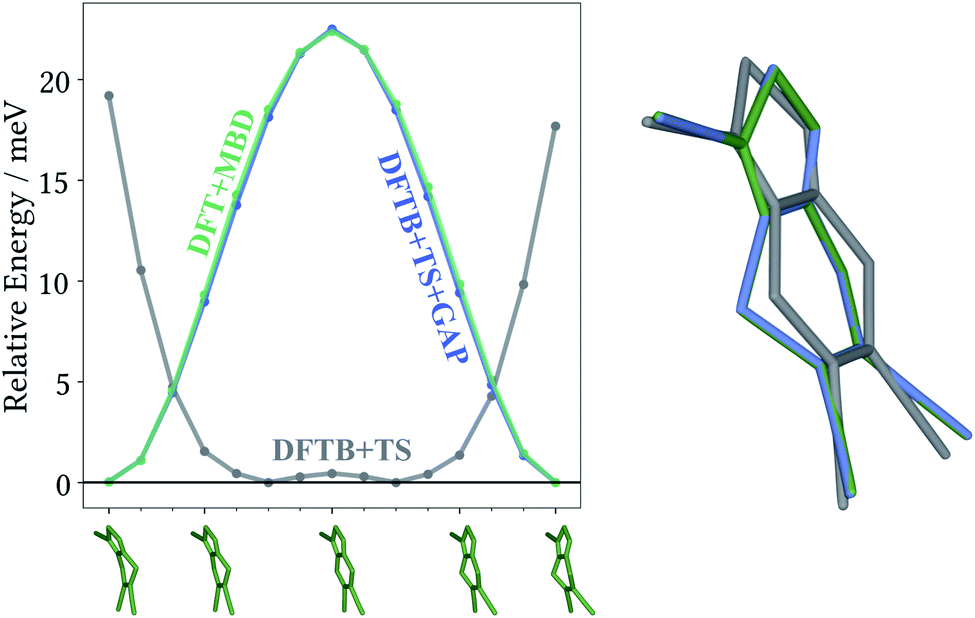 | ||
| Fig. 6 Target DFT+MBD climbing image nudged elastic band results with baseline DFTB+TS and Δ-ML corrected DFTB+TS+GAP single-point evaluation (left). Energies are relative to the individual image with the lowest energy. Overlay of the gas-phase minimum geometries (right) obtained with DFT+MBD (green), DFTB+TS (gray) and DFTB+TS+GAP (blue). | ||
This profile changes dramatically when the minimum energy path is reevaluated with the baseline DFTB+TS method: the barrier turns into a broad valley. In fact, the gas-phase optimum found with DFTB+TS corresponds to the flat conformer, as can be seen from the overlay on the right-hand of Fig. 6. In combination with additional geometric deviations (e.g. a more acute C–S–N angle of the five-membered ring), this causes an energy difference of 670 meV between the gas-phase minima of the baseline and target methods (when evaluated at the DFT+MBD level). As can be seen in Fig. 5 and 6, the Δ-ML correction cures these discrepancies and largely eliminates the offset. More importantly, the correction also strongly improves the correlation in the energy ranking and correctly identifies the experimental structure to be the most stable.
In the CSP context, the most pertinent comparison of the two methods is provided by the ranking order plot in Fig. 5. Here, the baseline method displays a large scatter, with some structures that are deemed among the most stable by DFT+MBD being assigned high ranks (and vice versa). This results in a low coefficient of determination of 0.483. In contrast, the energetic ordering predicted by the Δ-ML model correlates very well with the DFT+MBD reference (R2 = 0.907). This good agreement makes DFTB+TS+GAP a very promising method for CSP, particularly as a pre-screening method in hierarchical schemes. In this context, the most stable structures from the pre-screening would be further investigated with highly accurate (and expensive) methods, e.g. including vibrational contributions to the lattice free energy at the DFT+MBD level.
To illustrate the benefits of the GAP correction for this purpose, the ranking plot in Fig. 5 is divided in the style of a confusion matrix for the selection of the 35 most stable candidates. The resulting sectors indicate the true positive (TP), true negative (TN), false positive (FP) and false negative (FN) predictions. The quality of the selections made with the baseline and Δ-ML methods can now by visualized by the populations of the four sectors. DFTB+TS+GAP populates the most important sector, TP, with 32 out of 35 crystals. Uncorrected DFTB+TS, on the other hand, only yields 16 samples in this block. Furthermore, out of the three false positive predictions of DFTB+TS+GAP, two are very close to the dividing line.
As mentioned above, the experimentally determined crystal structure is indeed found to be the most stable structure at the Δ-ML level. Furthermore, the corresponding Δ-ML geometry is also found to be the most stable at the DFT+MBD level. In contrast, the baseline method predicts several other structures to be more stable than the experimental one. Critically, the experimental structure is not even the lowest energy one when DFT+MBD single point calculations are performed on DFTB+TS geometries. This is again due to significant deviations in the predicted geometries of DFTB+TS. Meanwhile there is excellent agreement between the predicted DFTB+TS+GAP crystal structure, and the one relaxed at the DFT+MBD level (see ESI†).
Finally, we return to the question of computational efficiency. As stated above, the main motivation for the presented Δ-ML approach is to avoid the large computational effort of calculations at the target level of theory. Most importantly, the savings of the Δ-ML model at prediction time should significantly outweigh the cost of generating the training data. To this end, the computational effort for generating the Δ-ML models and performing 10![[thin space (1/6-em)]](https://www.rsc.org/images/entities/char_2009.gif) 000 crystal relaxations (a reasonable number for a CSP application)9 is shown in Fig. 7. It can be seen that the cost of the training procedure is almost exclusively determined by reference calculations at the target level of theory (in particular for the X-mers).
000 crystal relaxations (a reasonable number for a CSP application)9 is shown in Fig. 7. It can be seen that the cost of the training procedure is almost exclusively determined by reference calculations at the target level of theory (in particular for the X-mers).
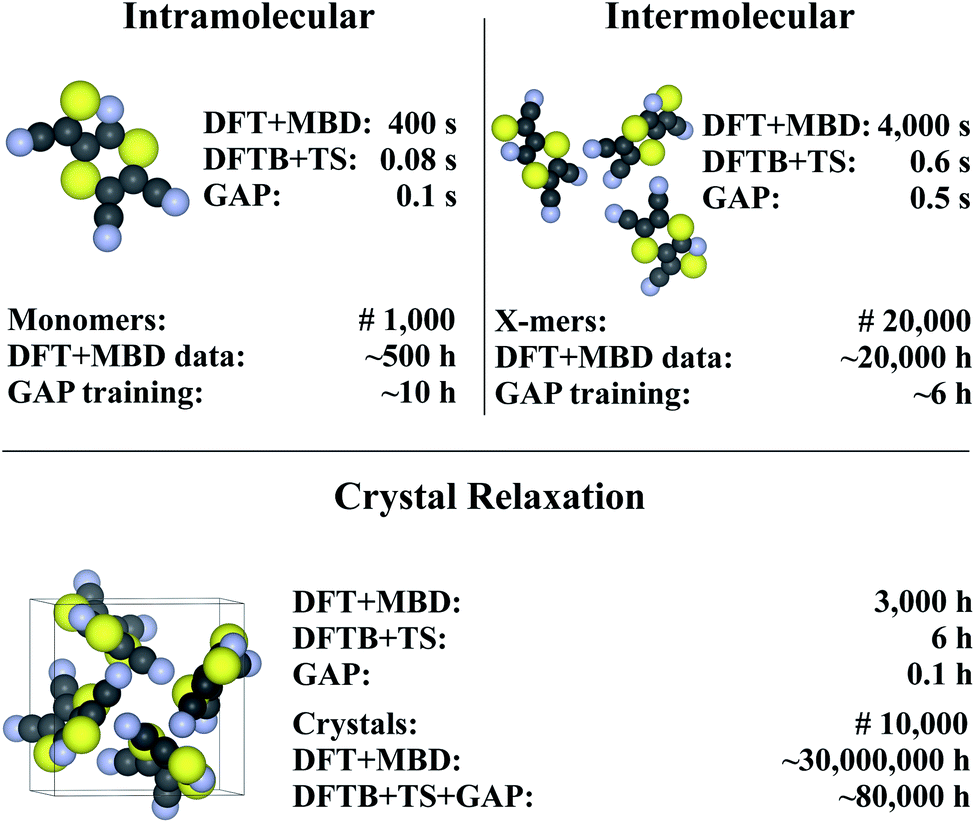 | ||
| Fig. 7 Timings for generating the (intra- and intermolecular) model for XXII and crystal relaxations (as obtained on a Intel® Xeon® CPU E5-2697 v3 @ 2.60 GHz processor). The upper part in each of the tree sections illustrates timings for a single unit (monomer, X-mer or crystal), while the lower part corresponds to the time required for the specified number of training configurations (top) and an exemplary number of crystal relaxations (bottom). The costs for relaxations are included in the intramolecular timing (see text). Values are rounded to one significant digit (both in terms of time and number of geometries). For details see ESI.† | ||
For comparison, a Δ-ML model that exclusively uses the underlying crystals instead of X-mers requires ca. 5000 CPU hours for performing DFT+MBD reference calculations. At this level of theory, the cost for training with periodic crystal data is thus actually somewhat lower than with the X-mer approach. Note, however, that the accuracy of this model is actually slightly inferior to the X-mer approach (see ESI†). Furthermore, the growth in computational costs when including more training data will be steep, especially when considering higher reference levels of theory, as shown below.
Fig. 7 further shows that (once trained), the savings of the Δ-ML model at prediction time are substantial: 10000 crystal relaxations at the target level of theory would require a staggering 30 million CPU hours, compared to just 80000 CPU hours with the Δ-ML model. Furthermore, the costs for training the Δ-ML models are roughly equivalent to the cost of explicitly relaxing just seven crystals at the DFT+MBD target level—an insignificant number compared to the requirements of a full-blown CSP study.
3.5 Crystal structure prediction beyond density functional theory
Dispersion corrected semi-local DFT is known to be quite accurate for noncovalent interactions, but it nevertheless displays some pathologies that can be problematic for CSP.53 Most prominently, the self-interaction error in most functionals causes the over-delocalization of electrons, which leads to errors in the description of electrostatic potentials and charge transfer.54In contrast, correlated wavefunction (WF) methods do not suffer from this problem. Furthermore, with these methods convergence to the exact result is, at least in principle, possible. Consequently, there has been much interest in applying WF theory to molecular crystals. This has been prohibitively expensive until recently, but new algorithms and hardware have made some benchmark calculations possible.55–57 In this context, highly accurate (sub-kJ mol−1) lattice energy predictions have been demonstrated, e.g. by Yang et al.43via a fragment strategy and by Zen et al. via diffusion quantum Monte Carlo.58 While this highlights their potential for CSP, applying such methods to periodic systems is still far from routine and will not be feasible in a high-throughput context for the foreseeable future. The X-mer approach presented herein does not require periodic reference calculations, however, and thus opens the door to WF-based CSP.
To illustrate this, a modified version of the model from the previous section was developed, for which the intermolecular GAP was trained using spin-component-scaled second-order Møller–Plesset theory (SCS-MP2).35,59 This highlights an additional feature of the presented approach, namely that different reference methods can be used for the intra- and intermolecular models. This can be particularly useful for flexible molecules, where an accurate prediction of torsional barriers, e.g. at the CCSD(T) level, may be required.53
To evaluate the new intermolecular model, the interaction energies for a test set of X-mers was considered. This reveals a MAE of 7 meV, slightly lower than the one obtained with the DFT+MBD reference (see ESI† for details). The corresponding full model was then used to relax the 251 trial crystals used in Section 3.4. While no periodic MP2 data is available for benchmarking in this case (for the reasons outlined above), the model correctly identifies the experimental geometry to be the most stable (see ESI† for details). The possibility of crystal relaxations with the ML model is particularly attractive in the context of WF methods, where gradients are much more expensive than single-point energy evaluations.60
As a final note, it should be mentioned that SCS-MP2 is not necessarily more accurate than DFT+MBD for this application. While the former offers a better description of electrostatics and Pauli repulsion (because the method is self-interaction free), the latter offers a true many-body description of dispersion, which is lacking at the (SCS-)MP2 level.61 Nonetheless, this example demonstrates that the presented scheme can be used to apply correlated wavefunction methods in a CSP context. The computational costs to produce the SCS-MP2 X-mer training data lies at 190000 CPU hours, while the direct application of SCS-MP2 for crystal relaxations in a molecular CSP study is simply not feasible.
4 Conclusions
In this work, we have presented a computationally efficient and accurate Δ-ML approach to CSP, using a low-cost baseline (DFTB+TS) that adequately describes long-range interactions. The method is characterized by addressing intra- and intermolecular corrections separately and features a high efficiency in terms of training costs. In particular, this is achieved by selecting diverse training configurations and completely avoiding periodic calculation for training data generation. The overall accuracy of lattice energies and relative stability rankings has been demonstrated on a representative set of test systems. Importantly, the approach yields models that allow for reliable structure relaxations, with a computational effort that is orders of magnitude smaller than the high-level target method (PBE+MBD or SCS-MP2), even taking training costs into account. To the best of our knowledge, this is the first generally applicable ML approach that allows structure relaxations in the context of CSP. This opens the door to a CSP workflow that allows screening large candidate pools with unprecedented accuracy.We further note that the accuracy of the Δ-ML can, in principle, be further refined by including more data. Beyond this, the fact that no periodic calculations are required means that higher levels of theory, such as hybrid DFT or (correlated) wavefunction methods, can be used as the target method. Finally, having a differentiable model also allows the calculation of vibrational zero-point and free energy contributions to the crystal stability. This will be explored in future work.
5 Computational details
All DFT calculations were performed with FHI-aims,62 using the PBE functional,30 tier2 basis sets, tight integration grids and the MBD dispersion correction. DFTB3 calculations were performed using DFTB+63 together with the 3ob parametrization27 and TS dispersion correction.14,29 For periodic calculations at both levels of theory, the k-grids were converged to obtain energetic accuracies of 1.5 meV per atom. SCS-MP2 (ref. 35 and 59) calculations were performed with ORCA64,65 using the resolution of identity approximation.66 GAP potentials were trained and evaluated with the QUIP package.49 Candidate crystal structures were obtained with the Genarris package.11 Additional tasks such as FPS and hyperparameter optimization were performed with the MLtools package available at https://github.com/simonwengert/mltools.git.Conflicts of interest
G. C. is listed as an inventor on a patent filed by Cambridge Enterprise Ltd. related to SOAP and GAP (US patent 8843509, filed on 5 June 2009 and published on 23 September 2014).Acknowledgements
S. W. and K. R. acknowledge funding from Deutsche Forschungsgemeinschaft (DFG) under project RE1509/18-2.References
- K. N. Houk and F. Liu, Acc. Chem. Res., 2017, 50, 539–543 CrossRef CAS.
- S. L. Price, Chem. Soc. Rev., 2014, 43, 2098–2111 RSC.
- J. Hachmann, R. Olivares-Amaya, S. Atahan-Evrenk, C. Amador-Bedolla, R. S. Sánchez-Carrera, A. Gold-Parker, L. Vogt, A. M. Brockway and A. Aspuru-Guzik, J. Phys. Chem. Lett., 2011, 2, 2241–2251 CrossRef CAS.
- A. Pulido, L. Chen, T. Kaczorowski, D. Holden, M. A. Little, S. Y. Chong, B. J. Slater, D. P. McMahon, B. Bonillo, C. J. Stackhouse, A. Stephenson, C. M. Kane, R. Clowes, T. Hasell, A. I. Cooper and G. M. Day, Nature, 2017, 543, 657–664 CrossRef CAS.
- A. J. Cruz-Cabeza, S. M. Reutzel-Edens and J. Bernstein, Chem. Soc. Rev., 2015, 44, 8619–8635 RSC.
- T.-Q. Yu and M. E. Tuckerman, Phys. Rev. Lett., 2011, 107, 015701 CrossRef.
- J. Nyman and G. M. Day, CrystEngComm, 2015, 17, 5154–5165 RSC.
- T. Beyer, T. Lewis and S. L. Price, CrystEngComm, 2001, 3, 178–212 RSC.
- A. M. Reilly, R. I. Cooper, C. S. Adjiman, S. Bhattacharya, A. D. Boese, J. G. Brandenburg, P. J. Bygrave, R. Bylsma, J. E. Campbell, R. Car, D. H. Case, R. Chadha, J. C. Cole, K. Cosburn, H. M. Cuppen, F. Curtis, G. M. Day, R. A. DiStasio Jr, A. Dzyabchenko, B. P. van Eijck, D. M. Elking, J. A. van den Ende, J. C. Facelli, M. B. Ferraro, L. Fusti-Molnar, C.-A. Gatsiou, T. S. Gee, R. de Gelder, L. M. Ghiringhelli, H. Goto, S. Grimme, R. Guo, D. W. M. Hofmann, J. Hoja, R. K. Hylton, L. Iuzzolino, W. Jankiewicz, D. T. de Jong, J. Kendrick, N. J. J. de Klerk, H.-Y. Ko, L. N. Kuleshova, X. Li, S. Lohani, F. J. J. Leusen, A. M. Lund, J. Lv, Y. Ma, N. Marom, A. E. Masunov, P. McCabe, D. P. McMahon, H. Meekes, M. P. Metz, A. J. Misquitta, S. Mohamed, B. Monserrat, R. J. Needs, M. A. Neumann, J. Nyman, S. Obata, H. Oberhofer, A. R. Oganov, A. M. Orendt, G. I. Pagola, C. C. Pantelides, C. J. Pickard, R. Podeszwa, L. S. Price, S. L. Price, A. Pulido, M. G. Read, K. Reuter, E. Schneider, C. Schober, G. P. Shields, P. Singh, I. J. Sugden, K. Szalewicz, C. R. Taylor, A. Tkatchenko, M. E. Tuckerman, F. Vacarro, M. Vasileiadis, A. Vazquez-Mayagoitia, L. Vogt, Y. Wang, R. E. Watson, G. A. de Wijs, J. Yang, Q. Zhu and C. R. Groom, Acta Crystallogr., Sect. B: Struct. Sci., Cryst. Eng. Mater., 2016, 72, 439–459 CrossRef CAS.
- J. Hoja, H.-Y. Ko, M. A. Neumann, R. Car, R. A. DiStasio and A. Tkatchenko, Sci. Adv., 2019, 5, eaau3338 CrossRef.
- X. Li, F. S. Curtis, T. Rose, C. Schober, A. Vazquez-Mayagoitia, K. Reuter, H. Oberhofer and N. Marom, J. Chem. Phys., 2018, 148, 241701 CrossRef.
- M. Neumann, F. Leusen and J. Kendrick, Angew. Chem., Int. Ed., 2008, 47, 2427–2430 CrossRef CAS.
- J. G. Brandenburg and S. Grimme, J. Phys. Chem. Lett., 2014, 5, 1785–1789 CrossRef CAS.
- M. Mortazavi, J. G. Brandenburg, R. J. Maurer and A. Tkatchenko, J. Phys. Chem. Lett., 2018, 9, 399–405 CrossRef CAS.
- V. L. Deringer and G. Csányi, Phys. Rev. B, 2017, 95, 094203 CrossRef.
- M. Rupp, Int. J. Quantum Chem., 2015, 115, 1058–1073 CrossRef CAS.
- J. S. Smith, B. T. Nebgen, R. Zubatyuk, N. Lubbers, C. Devereux, K. Barros, S. Tretiak, O. Isayev and A. E. Roitberg, Nat. Commun., 2019, 10, 2903 CrossRef.
- J. Behler and M. Parrinello, Phys. Rev. Lett., 2007, 98, 146401 CrossRef.
- A. P. Bartók, M. C. Payne, R. Kondor and G. Csányi, Phys. Rev. Lett., 2010, 104, 136403 CrossRef.
- C. M. Handley and J. Behler, Eur. Phys. J. B, 2014, 87, 152 CrossRef.
- M. Ceriotti, M. J. Willatt and G. Csányi, Handbook of Materials Modeling, 2018, pp. 1–27 Search PubMed.
- P. O. Dral, J. Phys. Chem. Lett., 2020, 11, 2336–2347 CrossRef CAS.
- C. Schran, J. Behler and D. Marx, J. Chem. Theory Comput., 2020, 16, 88–99 CrossRef.
- A. P. Bartók, M. J. Gillan, F. R. Manby and G. Csányi, Phys. Rev. B, 2013, 88, 054104 CrossRef.
- M. Stöhr, L. M. Sandonas and A. Tkatchenko, J. Phys. Chem. Lett., 2020, 11, 6835–6843 CrossRef.
- R. Ramakrishnan, P. O. Dral, M. Rupp and O. A. von Lilienfeld, J. Chem. Theory Comput., 2015, 11, 2087–2096 CrossRef CAS.
- M. Gaus, A. Goez and M. Elstner, J. Chem. Theory Comput., 2013, 9, 338–354 CrossRef CAS.
- M. Gaus, Q. Cui and M. Elstner, J. Chem. Theory Comput., 2011, 7, 931–948 CrossRef CAS.
- M. Stöhr, G. S. Michelitsch, J. C. Tully, K. Reuter and R. J. Maurer, J. Chem. Phys., 2016, 144, 151101 CrossRef.
- J. P. Perdew, K. Burke and M. Ernzerhof, Phys. Rev. Lett., 1996, 77, 3865–3868 CrossRef CAS.
- A. Tkatchenko, R. A. DiStasio, R. Car and M. Scheffler, Phys. Rev. Lett., 2012, 108, 236402 CrossRef.
- A. Ambrosetti, A. M. Reilly, R. A. DiStasio and A. Tkatchenko, J. Chem. Phys., 2014, 140, 18A508 CrossRef.
- A. M. Reilly and A. Tkatchenko, J. Chem. Phys., 2013, 139, 024705 CrossRef.
- A. G. Shtukenberg, Q. Zhu, D. J. Carter, L. Vogt, J. Hoja, E. Schneider, H. Song, B. Pokroy, I. Polishchuk, A. Tkatchenko, A. R. Oganov, A. L. Rohl, M. E. Tuckerman and B. Kahr, Chem. Sci., 2017, 8, 4926–4940 RSC.
- S. Grimme, J. Chem. Phys., 2003, 118, 9095–9102 CrossRef CAS.
- P. Koskinen and V. Mäkinen, Comput. Mater. Sci., 2009, 47, 237–253 CrossRef CAS.
- Y. Yang, H. Yu, D. York, Q. Cui and M. Elstner, J. Phys. Chem. A, 2007, 111, 10861–10873 CrossRef CAS.
- A. P. Bartók, R. Kondor and G. Csányi, Phys. Rev. B: Condens. Matter Mater. Phys., 2013, 87, 184115 CrossRef.
- S. L. Price, M. Leslie, G. W. A. Welch, M. Habgood, L. S. Price, P. G. Karamertzanis and G. M. Day, Phys. Chem. Chem. Phys., 2010, 12, 8478–8490 RSC.
- P. G. Karamertzanis and C. C. Pantelides, J. Comput. Chem., 2005, 26, 304–324 CrossRef CAS.
- A. P. Bartók, S. De, C. Poelking, N. Bernstein, J. R. Kermode, G. Csányi and M. Ceriotti, Sci. Adv., 2017, 3, e1701816 CrossRef.
- S. De, A. P. Bartók, G. Csányi and M. Ceriotti, Phys. Chem. Chem. Phys., 2016, 18, 13754–13769 RSC.
- J. Yang, W. Hu, D. Usvyat, D. Matthews, M. Schütz and G. K.-L. Chan, Science, 2014, 345, 640–643 CrossRef CAS.
- C. Müller, D. Usvyat and H. Stoll, Phys. Rev. B: Condens. Matter Mater. Phys., 2011, 83, 245136 CrossRef.
- C. Müller and D. Usvyat, J. Chem. Theory Comput., 2013, 9, 5590–5598 CrossRef.
- R. Podeszwa, B. M. Rice and K. Szalewicz, Phys. Rev. Lett., 2008, 101, 115503 CrossRef.
- E. Lambros and F. Paesani, J. Chem. Phys., 2020, 153, 060901 CrossRef CAS.
- D. McDonagh, C. K. Skylaris and G. M. Day, J. Chem. Theory Comput., 2019, 15, 2743–2758 CrossRef CAS.
- A. P. Bartók and G. Csányi, Int. J. Quantum Chem., 2015, 115, 1051–1057 CrossRef.
- A. Mohajeri and N. Shakerin, J. Mol. Struct.: THEOCHEM, 2004, 711, 167–172 CrossRef CAS.
- J. Higgins, X. Zhou, R. Liu and T. T.-S. Huang, J. Phys. Chem. A, 1997, 101, 2702–2708 CrossRef CAS.
- F. Curtis, X. Wang and N. Marom, Acta Crystallogr., Sect. B: Struct. Sci., Cryst. Eng. Mater., 2016, 72, 562–570 CrossRef CAS.
- J. Nyman, L. Yu and S. M. Reutzel-Edens, CrystEngComm, 2019, 21, 2080–2088 RSC.
- A. J. Cohen, P. Mori-Sanchez and W. Yang, Science, 2008, 321, 792–794 CrossRef CAS.
- J. McClain, Q. Sun, G. K.-L. Chan and T. C. Berkelbach, J. Chem. Theory Comput., 2017, 13, 1209–1218 CrossRef CAS.
- A. Grüneis, M. Marsman and G. Kresse, J. Chem. Phys., 2010, 133, 074107 CrossRef.
- I. Y. Zhang, A. J. Logsdail, X. Ren, S. V. Levchenko, L. Ghiringhelli and M. Scheffler, New J. Phys., 2019, 21, 013025 CrossRef CAS.
- A. Zen, J. G. Brandenburg, J. Klimeš, A. Tkatchenko, D. Alfè and A. Michaelides, Proc. Natl. Acad. Sci. U. S. A., 2018, 115, 1724–1729 CrossRef CAS.
- K. E. Riley, J. A. Platts, J. Řezáč, P. Hobza and J. G. Hill, J. Phys. Chem. A, 2012, 116, 4159–4169 CrossRef CAS.
- E. A. Salter, G. W. Trucks and R. J. Bartlett, J. Chem. Phys., 1989, 90, 1752–1766 CrossRef.
- P. Xu, M. Alkan and M. S. Gordon, Chem. Rev., 2020, 120, 12343–12356 CrossRef CAS.
- V. Blum, R. Gehrke, F. Hanke, P. Havu, V. Havu, X. Ren, K. Reuter and M. Scheffler, Comput. Phys. Commun., 2009, 180, 2175–2196 CrossRef CAS.
- B. Aradi, B. Hourahine and T. Frauenheim, J. Phys. Chem. A, 2007, 111, 5678–5684 CrossRef CAS.
- F. Neese, Wiley Interdiscip. Rev.: Comput. Mol. Sci., 2012, 2, 73–78 CAS.
- F. Neese, Wiley Interdiscip. Rev.: Comput. Mol. Sci., 2018, 8, e1327 Search PubMed.
- M. Feyereisen, G. Fitzgerald and A. Komornicki, Chem. Phys. Lett., 1993, 208, 359–363 CrossRef CAS.
Footnote |
| † Electronic supplementary information (ESI) available. See DOI: 10.1039/d0sc05765g |
| This journal is © The Royal Society of Chemistry 2021 |