Kinetic study of o-nitrotoluene nitration in a homogeneously continuous microflow†
Received
25th August 2021
, Accepted 28th September 2021
First published on 28th September 2021
Abstract
o-Nitrotoluene nitration can produce 2,4-dinitrotoluene and 2,6-dinitrotoluene simultaneously, which is also the common side-reaction of toluene mononitration. Kinetic study is helpful to deepen the understanding of nitration and control the reaction better. A homogeneously continuous microflow system was constructed to determine the kinetic parameters of 2-MNT nitration. A complete kinetic model was established and all kinetic parameters were obtained. In general, the observed reaction rate will increase with increasing H2SO4 mass fraction. However, when the H2SO4 mass fraction increases to a certain value, the observed reaction rate decreases. This is the first time to report the maximum observed reaction rate constant corresponding to the H2SO4 mass fraction at different temperatures in this work. Compared to previous reports on this reaction, the system provides more accurate kinetic parameters and can be developed into a reliable platform for the kinetic study of similar reactions.
1. Introduction
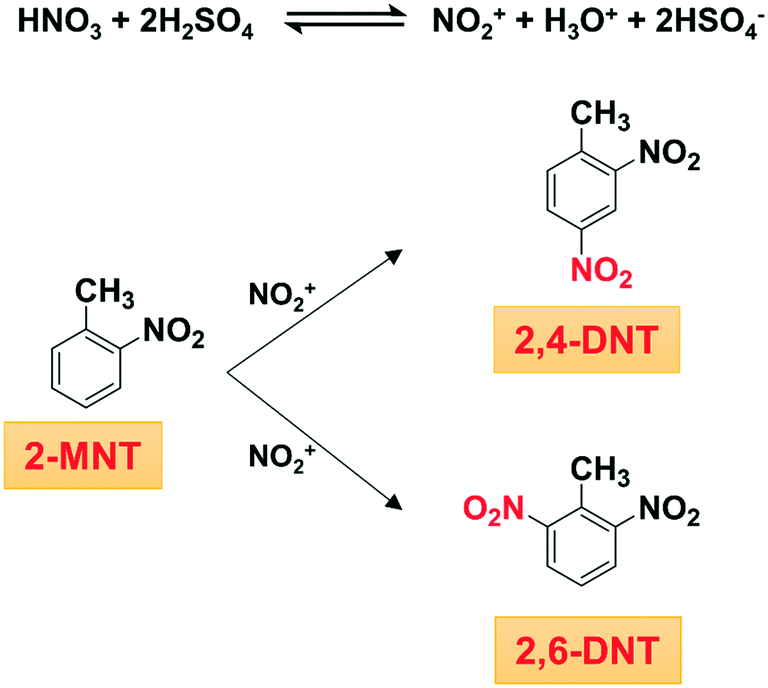
Both 2,4-dinitrotoluene (2,4-DNT) and 2,6-dinitrotoluene (2,6-DNT) are important intermediates, which can be obtained simultaneously through o-nitrotoluene (2-MNT) nitration with mixed acid (Scheme 1).1,2 In addition, this reaction is also a common side-reaction in the process of toluene mononitration, which has not been well controlled so far.3 Therefore, to optimize industrial production conditions and reduce the occurrence of side reactions in the process of toluene mononitration, a deep understanding of the kinetics of 2-MNT nitration is highly necessary. Some progress has been made in the kinetic study of the nitration of aromatic compounds, such as benzene,4–6 toluene,7–9 chlorobenzene,10 phenol,11–13etc. However, due to the characteristics of fast, highly exothermic and liquid–liquid heterogeneous reactions, in a traditional nitrification reactor, it is difficult to achieve accurate control of the reaction conditions such as temperature, residence time and uniform distribution of concentration.14 The accurate kinetic study of aromatic nitration has been hindered.
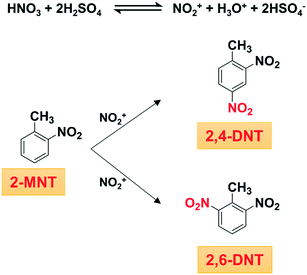 |
| | Scheme 1 Nitration of 2-MNT with mixed acid. | |
In recent years, microreactors have attracted considerable attention due to their excellent mass and heat transfer performance, rapid mixing rate, and the characteristic of intrinsic safety.15–18 The application of microreactors is expected to achieve accurate control of temperature in nitration kinetic study. The accurate control of residence time can be achieved by means of a continuous microflow system.19 For liquid–liquid heterogeneous and fast reactions, the reaction rate may be hindered by mass transfer resistance between phases. The small mass transfer distance and large specific surface area in the microchannel are beneficial to greatly improve the mass transfer performance.20–22 The application of microreactors is expected to eliminate the influence of mass transfer resistance as much as possible on the heterogeneous and fast reactions. Many research studies have suggested that due to the excellent mass transfer performance of microreactors, when the mass transfer rate is much larger than the reaction rate (Ha < 0.3), the aromatic nitrification step can be assumed to be the rate-determining step.23,24 However, the effect of mass transfer resistance cannot be completely eliminated for heterogeneous reactions, especially when the concentration of the reactants is low. It could lead to inaccurate determination of nitration kinetics. Accordingly, efficient and accurate methods for nitration kinetic study need to be developed.
Many aromatic compounds can be dissolved in high-concentration H2SO4 in a small amount, which is expected to construct a homogeneous nitration system.24–26 The effect of mass transfer on the reaction rate can be completely eliminated through the homogeneous nitration reaction.25,27 In addition, due to the low solubility of aromatic compounds in H2SO4 and the large specific heat capacity of H2SO4, the adiabatic temperature rise of the reaction system can be controlled below 0.5 °C by adjusting the mass ratio of H2SO4 to aromatic compounds. It is conducive to avoid the occurrence of local overheating in the reaction system.28 Therefore, it is reliable that accurate nitration kinetic parameters can be obtained by a homogeneous nitration reaction in a continuous microflow system. However, accurate 2-MNT nitration kinetics has not been reported so far.
In this work, a homogeneously continuous microflow system has been constructed to determine the kinetics of 2-MNT nitration. The accurate control of temperature and residence time can be achieved in this system. The effects of the molar ratio of HNO3 to 2-MNT, temperature, residence time and H2SO4 mass fraction on the conversion of 2-MNT and the selectivity to DNT were investigated in detail in this system. The observed reaction rate constants based on HNO3 and NO2+ were determined, respectively. The variation of the observed reaction rate constant based on HNO3 with the H2SO4 mass fraction at different temperatures has been investigated in detail. And the activation energies, preexponential factors and confidence intervals of the total reaction of 2-MNT nitration and the two parallel reactions were determined, respectively.
2. Experimental
2.1 Chemicals and materials
2-MNT (99%), 2,4-DNT (99%), 2,6-DNT (99%) and nitrobenzene (99.8%) were purchased from Aladdin. H2SO4 (98%), HNO3 (98%) and MeOH (99.5%) were supplied by Beijing Tong Guang Fine Chemicals Company, Sinopharm Chemical Reagent Beijing Co., Ltd. and Shanghai Titan Scientific Co., Ltd., respectively. H2SO4 (<98%) was prepared by diluting H2SO4 (98%) with deionized water.
2.2 Experimental procedures and equipment
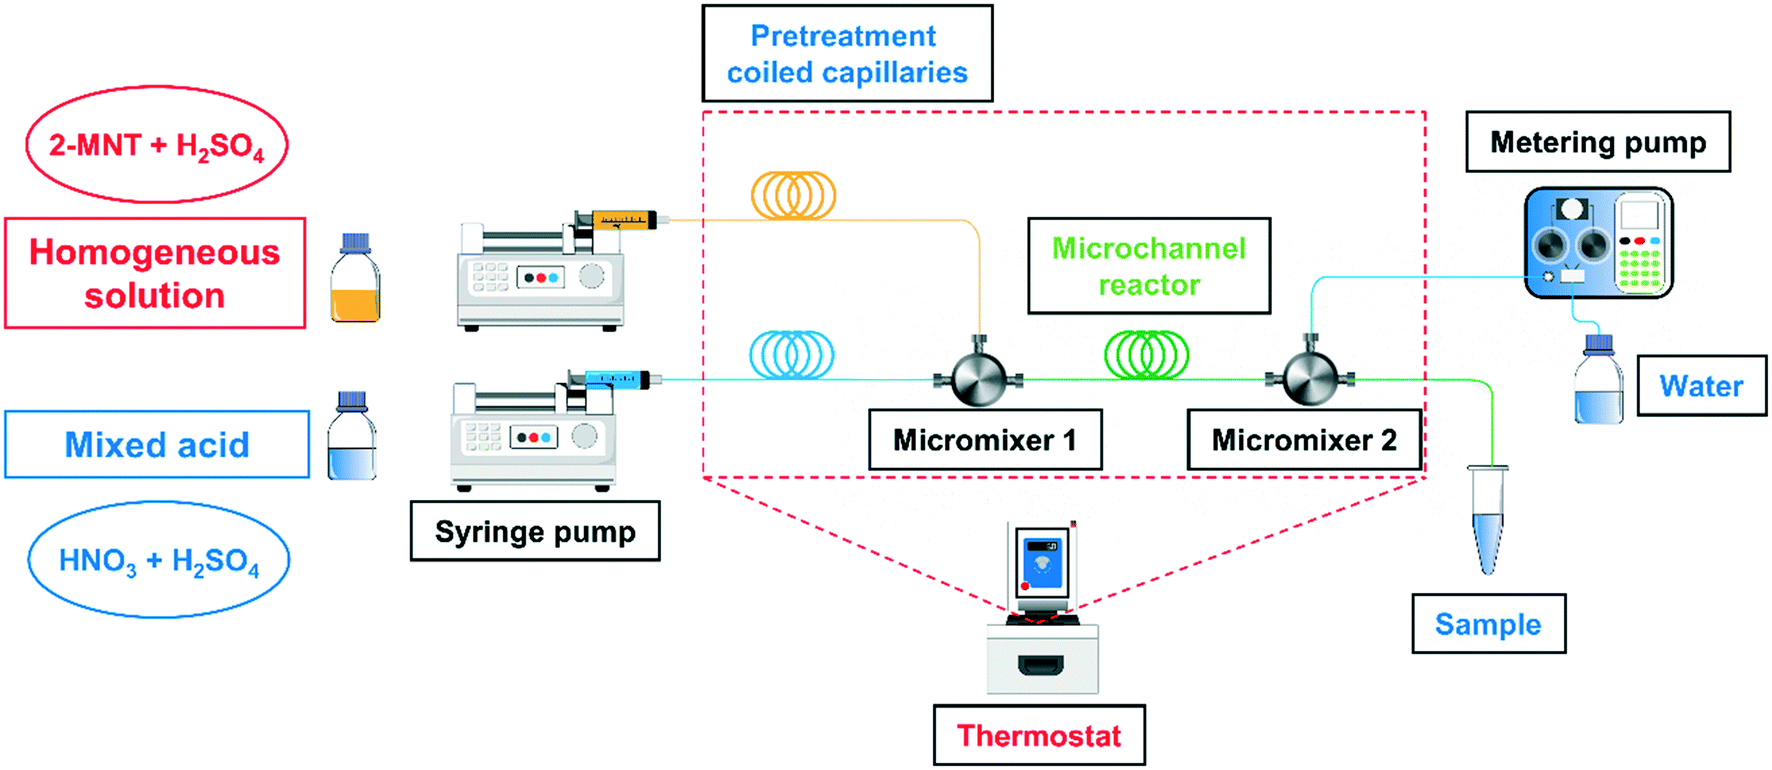
The schematic overview of the homogeneous continuous microflow system is shown in Fig. 1. The homogeneous solution was prepared by dissolving 2-MNT (0.5 g) in H2SO4 with a specific mass fraction (160 g) and stirring for 12 h. The mixed acid was prepared by dissolving a specific concentration of HNO3 in the same mass and mass fraction of H2SO4 solution.
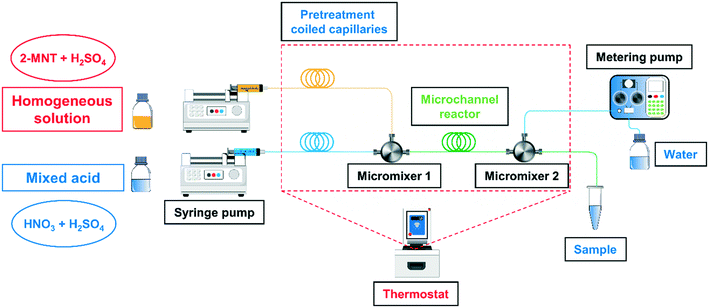 |
| | Fig. 1 Schematic overview of the experimental equipment. | |
The homogeneous solution and the mixed acid were delivered separately with two syringe pumps (Chemyx Fusion 6000, America) to pretreatment coiled capillaries to reach a preset temperature. Next, the two fluids flowed through a micromixer (stainless three-way, an inner diameter of 0.15 mm) to achieve sufficient mixing and the reaction was carried out in the subsequent microchannel reactor (PTFE, an inner diameter of 0.5 mm). The online quenching and sampling modules were connected with the microreactor using a micromixer (stainless three-way, an inner diameter of 0.5 mm). The pretreatment coiled capillaries, micromixers and microchannel reactor were immersed in a temperature-controlled bath (CORIO CD-200F, Julabo, Germany) to achieve a uniform reaction temperature. The variation of residence time was achieved by adjusting the length of the microchannel reactor. The effect of mixing performance on the reaction rate has been fully investigated in our previous work.29 All the experiments in this work were carried out under the optimal mixing conditions.
2.3 Analysis
An ultra-performance liquid chromatograph (Waters, ACQUITY UPLC I-CLASS System, column: PFP column, 1.8 μm, 3 mm × 50 mm, America, mobile phase: VH2O/VMeOH = 0.65/0.35, flow rate: 0.2 mL min−1) with an ultraviolet detector was used to analyze the sample contents and nitrobenzene was used as an internal standard. All these experiments were repeated at least three times to determine the reproducibility.
The conversion of 2-MNT was calculated by the following equation:
| |  | (1) |
where
X2-MNT is the conversion of 2-MNT and
c is the molar concentration of the substances in the sample.
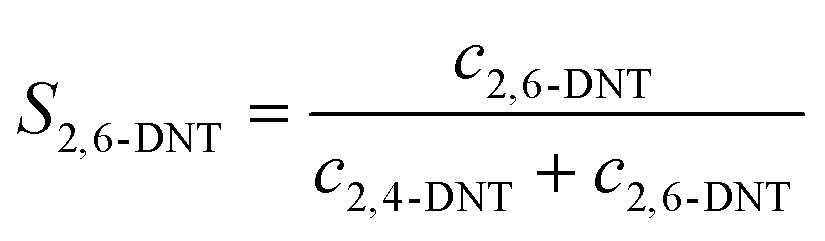
The selectivity to DNT was calculated by the following equations:
| |  | (2) |
| | 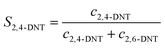 | (3) |
where
S is the selectivity to DNT.
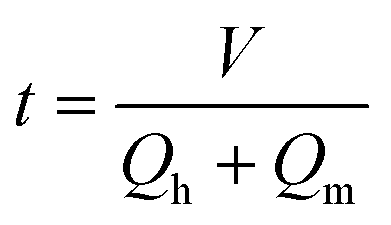
The residence time was calculated as follows:
| |  | (4) |
where
t is the reaction residence time and
V is the volume of the microchannel.
Qh and
Qm are the volume flow rates of the homogeneous solution and mixed acid, respectively.
3. Results and discussion
3.1 Solubility of 2-MNT in H2SO4
The solubility of 2-MNT in concentrated H2SO4 is an important parameter to ensure that the nitration can be carried out under homogeneous conditions. The solubility data under different mass fractions of H2SO4 have been reported in the literature.30 In this work, the concentration of 2-MNT in the homogeneous solution is about 0.044 mol L−1, which is much smaller than the solubility of 2-MNT at the same temperature and mass fraction of H2SO4. Therefore, the homogeneous nitration of 2-MNT is feasible under expected experimental conditions.
It is worth noting that the mass ratio of H2SO4 to 2-MNT in the homogeneous solution was kept at approximately 320. Because of the large specific heat capacity, the large amount of H2SO4 can be used to control the adiabatic temperature rise. The calculated temperature rise in all the processes was less than 0.5 °C and the calculation process has been discussed in our previous work.29 In addition, due to the excellent heat transfer performance of the microreactor, the heat released during the reaction can be continuously removed with the thermostat. Therefore, all the reaction processes in this work can be considered to meet the requirements of kinetics under constant temperature conditions.
3.2 Effects of molar ratio, temperature, residence time and H2SO4 mass fraction
In parallel reactions, the conversion of 2-MNT and the selectivity to DNT are important parameters to characterize the reaction performance. The selectivity is also the key to obtaining the respective reaction rate constants of parallel reactions. Therefore, it is important to investigate the effects of the reaction conditions on the selectivity to DNT. Generally, the conversion and selectivity of nitration are affected by the molar ratio, temperature, residence time and H2SO4 concentration. Therefore, all the above aspects have been investigated to explore their effects on the reaction performance, respectively.
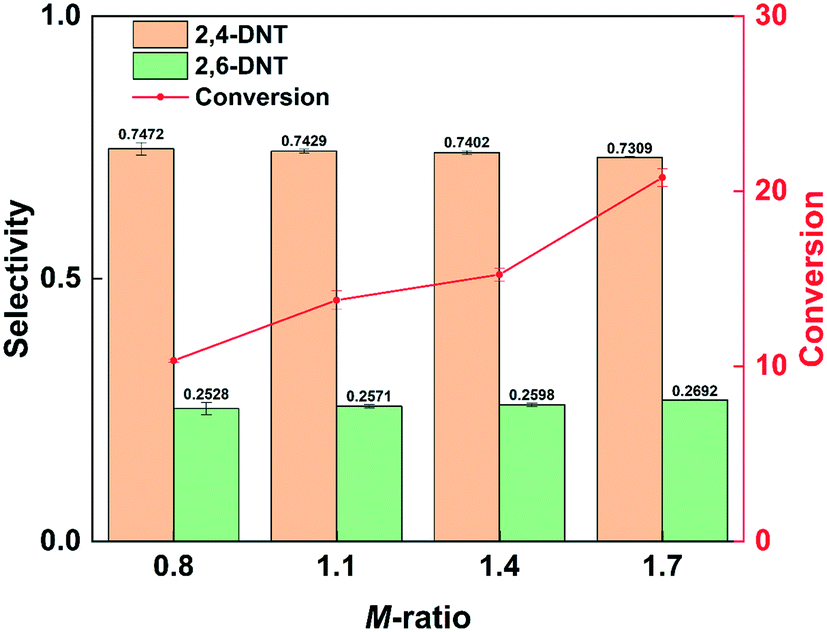
The conversion of 2-MNT increased by increasing the molar ratio of HNO3 to 2-MNT (M-ratio), as shown in Fig. 2. This is due to the higher concentration of NO2+ in the mixed acid caused by increasing the concentration of HNO3.31Fig. 2 also shows that the selectivity to 2,4-DNT decreases by increasing the molar ratio, but little effect is observed. It has been reported in the literature that the content of water in the mixed acid has a strong effect on the selectivity.30 In this work, the mass ratio of H2SO4 to HNO3 is large. With the addition of HNO3, the molar ratio increases, but it has almost no effect on the water content in the mixed acid. Therefore, it is reasonable that the variation of selectivity is not obvious with the change in the molar ratio in this work. In addition, it can be observed that the increase in molar ratio is more conducive to the generation of 2,6-DNT. The appropriate molar ratio is advantageous for controlling the reaction rate. And the further nitrification of the product can be avoided.
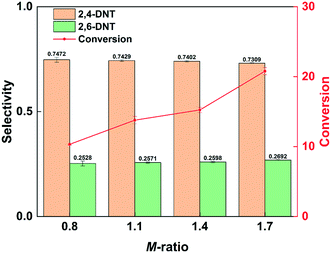 |
| | Fig. 2 Selectivity variation of DNT and conversion variation of 2-MNT with the molar ratio of HNO3 to 2-MNT. | |
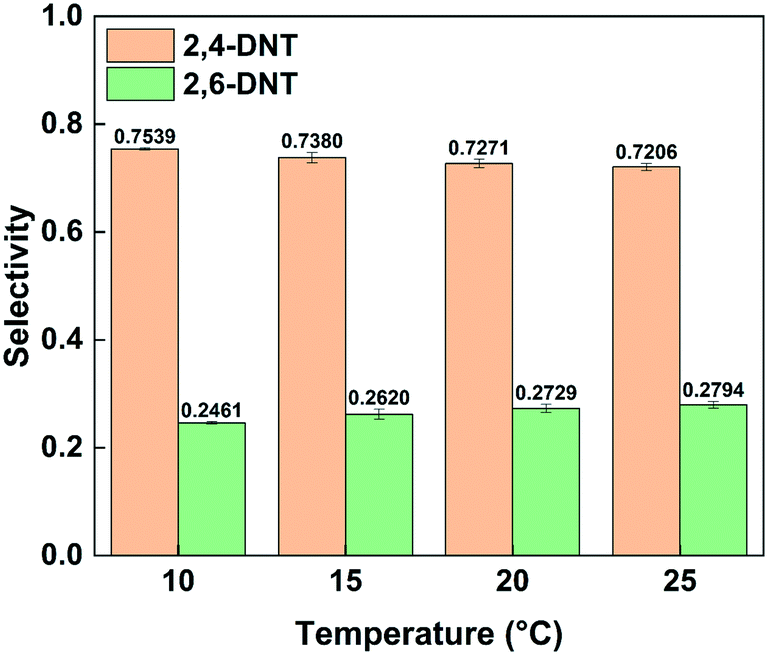
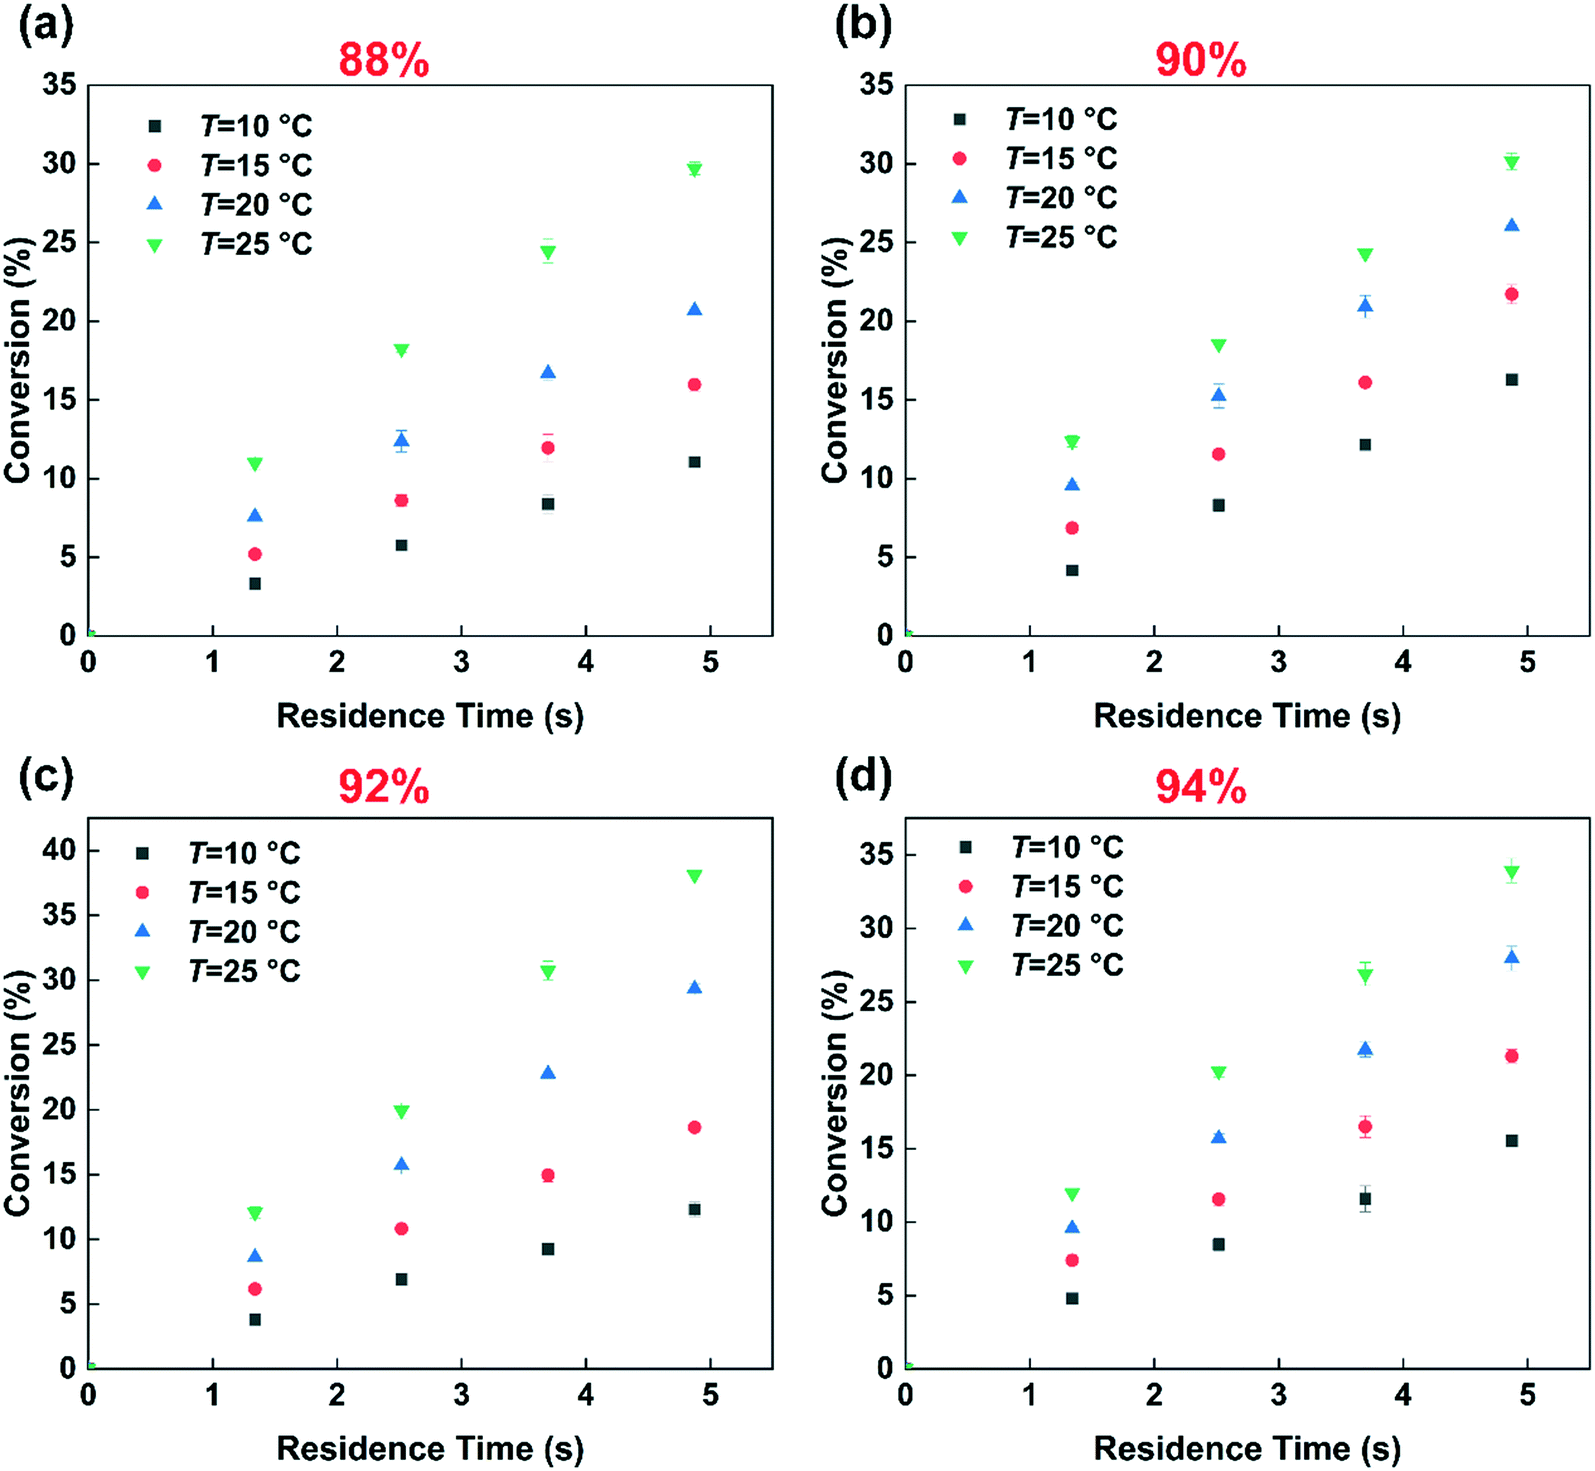
Fig. 3 shows the effect of temperature on the selectivity to DNT. It can be observed that with the increase of temperature, the selectivity to 2,6-DNT increases slightly under the same reaction conditions. This is due to the higher activation energy of the reaction to generate 2,6-DNT, which results in the reaction exhibiting a higher sensitivity to temperature. The slight variation of selectivity with temperature also shows that the difference of the activation energies of the two parallel reactions is not obvious, which can be confirmed by their respective activation energy data. And the result will be discussed in section 3.3. The effect of temperature on the observed reaction rate can be characterized by the variation of conversion with temperature, as shown in Fig. 4. The results show that a higher conversion can be obtained under the same residence time as the temperature increases, indicating that the reaction rate will increase by increasing the temperature. In addition, the variation of conversion is obvious when the temperature is increased by just 5 °C. This also indicates that the precise control of temperature is necessary to obtain accurate kinetic parameters for such a fast and highly exothermic reaction. When the 2-MNT conversion is low, the concentration of HNO3 did not decrease obviously and can be regarded as a constant. In this case, according to the reaction rate equation, the conversion of 2-MNT will increase linearly with the increase of residence time. This is consistent with the result shown in Fig. 4.
 |
| | Fig. 3 Selectivity variation of DNT with temperature. | |
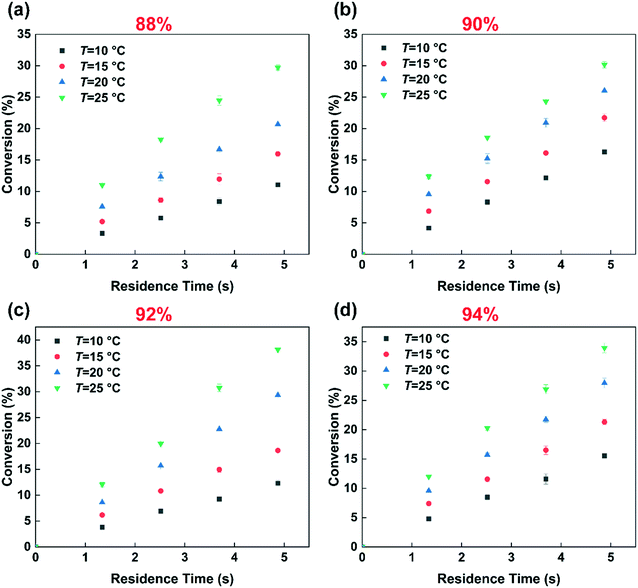 |
| | Fig. 4 Effects of the residence time, temperature and H2SO4 mass fraction on the conversion. (a) 88% H2SO4, (b) 90% H2SO4, (c) 92% H2SO4, and (d) 94% H2SO4. | |
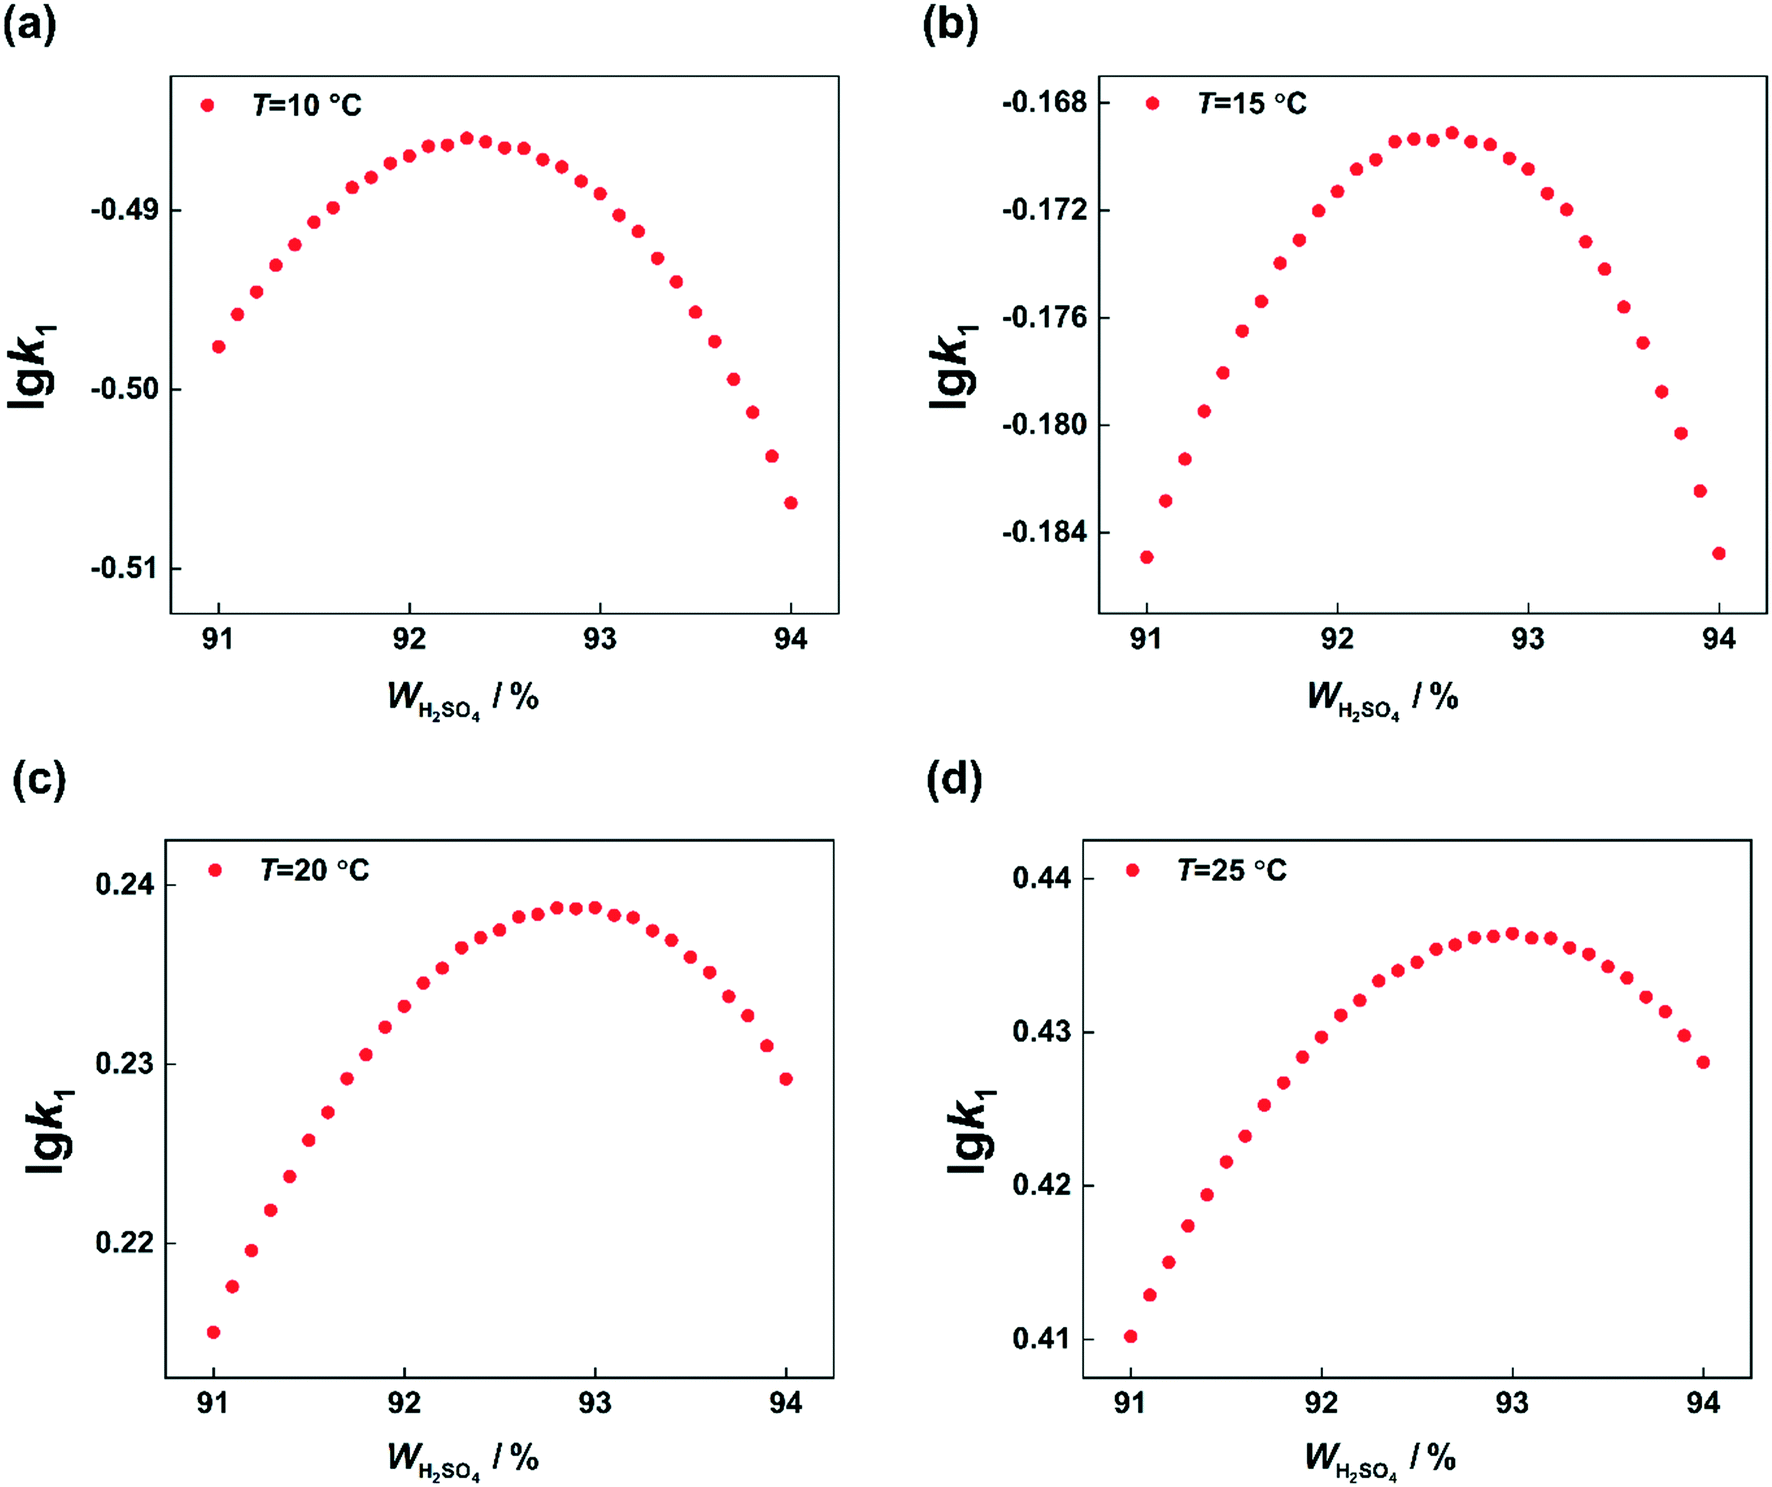
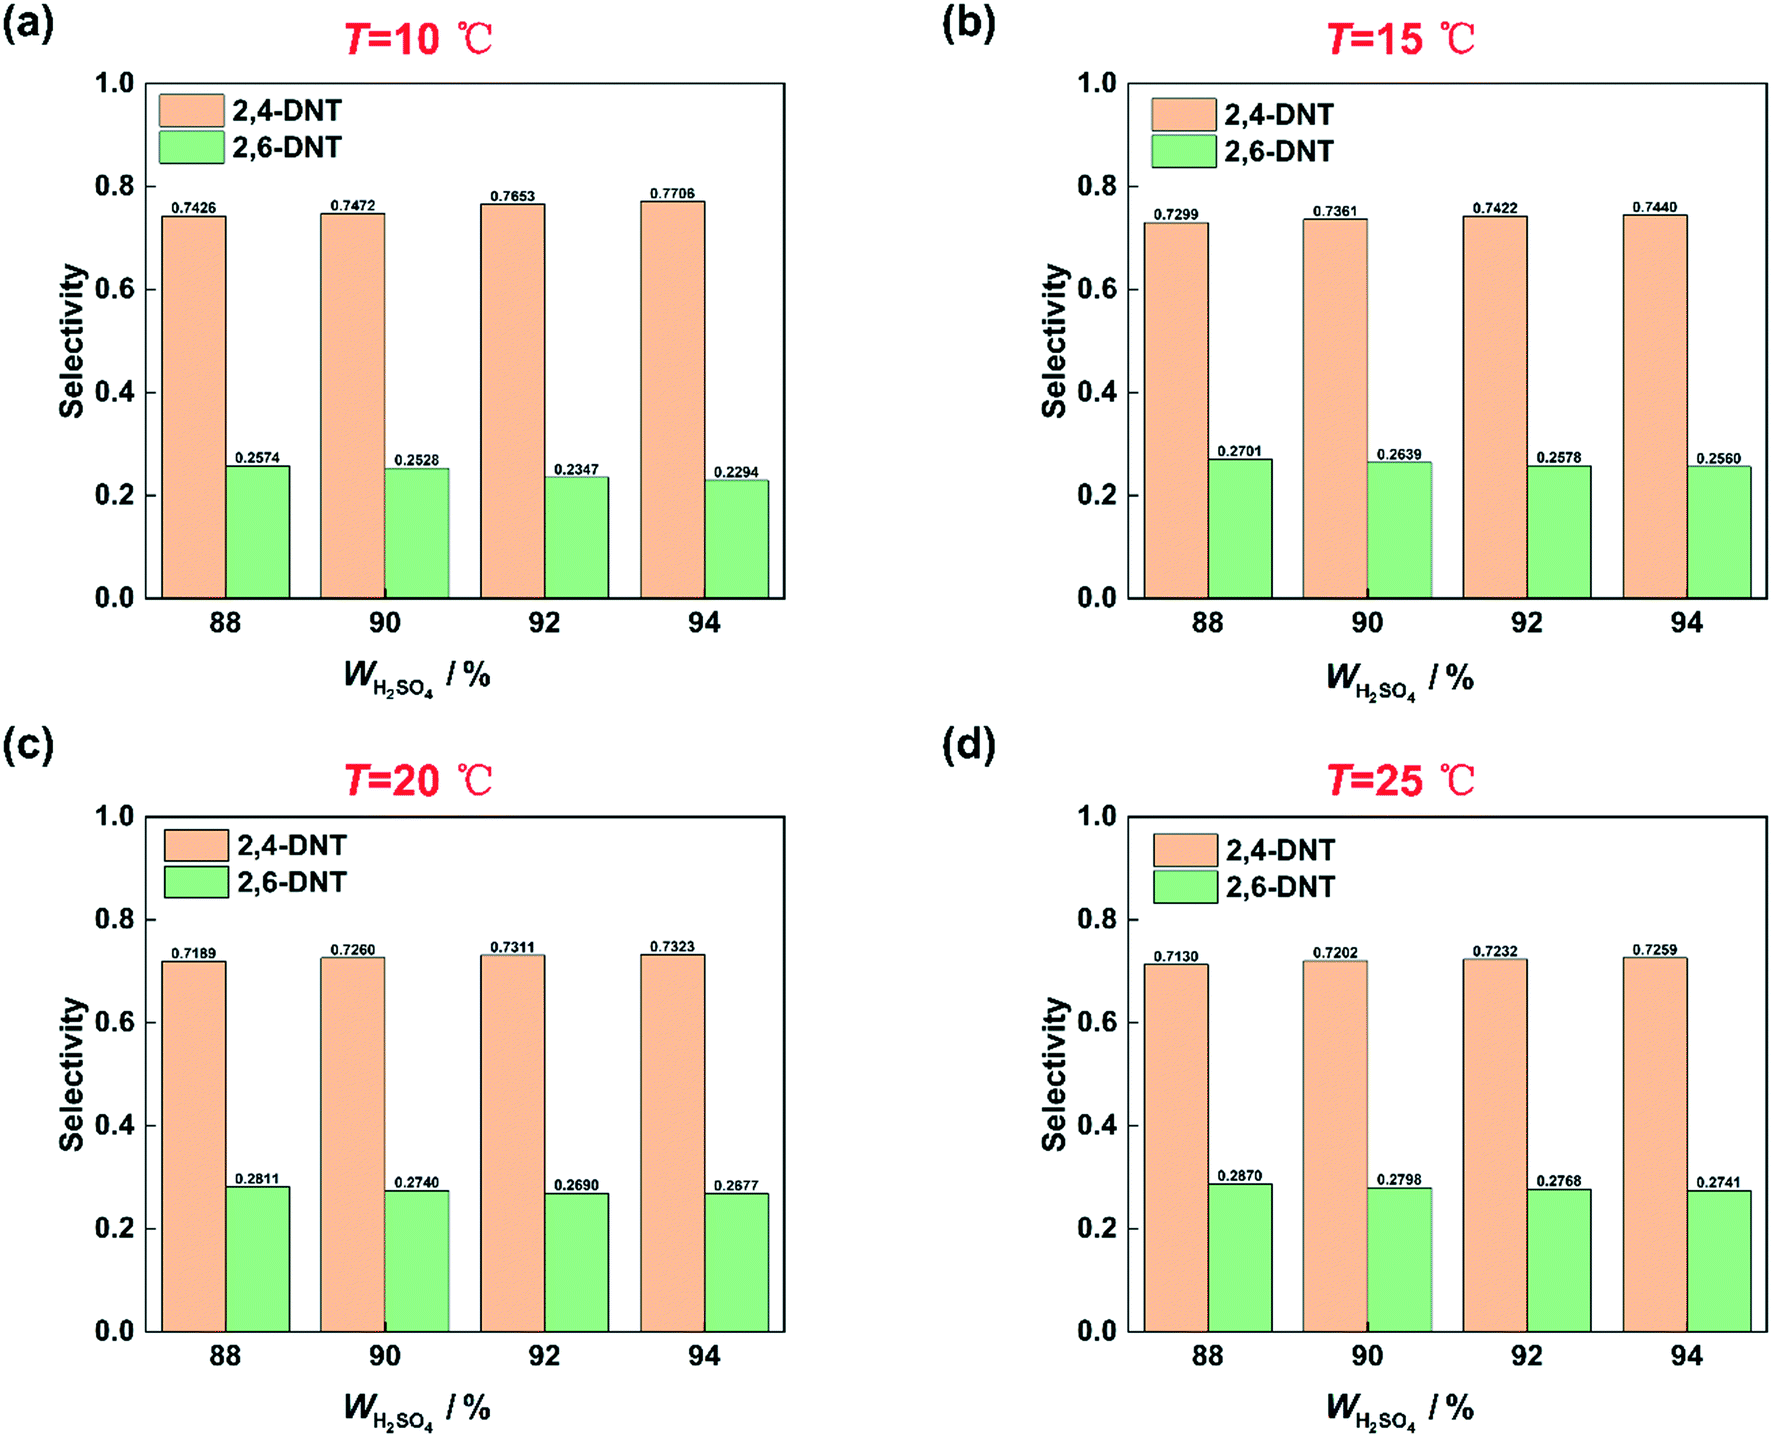
Many studies have proven that the reaction rate of nitration is affected by the concentration of H2SO4.23–25,27 And the higher the concentration of H2SO4 is, the faster the reaction rate of nitration could be. The concentration of H2SO4 and the content of water in the mixed acid have a great influence on the generation of NO2+.31–34 High concentration of H2SO4 and low content of water are conducive to the generation of NO2+.35 In this work, the conclusion that the reaction rate increases with increasing H2SO4 concentration is also achieved and shown in Fig. 4. When the mass fraction of H2SO4 was increased from 88% to 92%, under the same conditions, a higher conversion was obtained. However, the increase of the reaction rate with H2SO4 concentration is limited. When the mass fraction of H2SO4 increases to 94%, the conversion is lower than that at 92% under the same conditions. And the phenomenon will be discussed in detail in section 3.4. The effect of H2SO4 mass fraction on the selectivity of DNT also contributed to the difference of the content of water. The result is shown in Fig. 5. It can be observed that the selectivity of 2,6-DNT decreases with increasing H2SO4 mass fraction at different temperatures. This proves that the increase of the content of water is more conducive to the generation of 2,6-DNT. It is consistent with the conclusion reported in the literature.30 Therefore, the content of water in the reaction system and the temperature are important parameters that have a great effect on the selectivity to DNT.
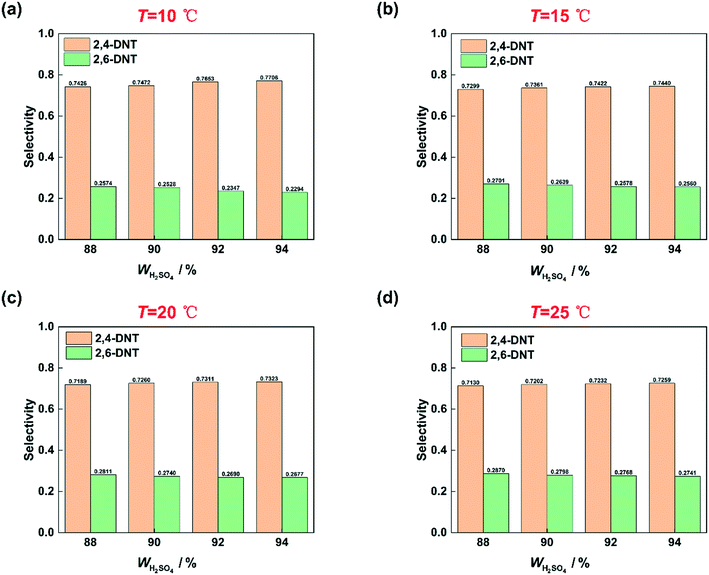 |
| | Fig. 5 Selectivity variation of DNT with the H2SO4 mass fraction. (a) T = 10 °C, (b) T = 15 °C, (c) T = 20 °C, and (d) T = 25 °C. | |
3.3 Determination of observed reaction rate constants based on HNO3 and NO2+
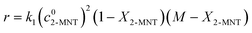
It has been widely recognized that the 2-MNT nitration with mixed acid follows the second-order kinetics in a homogeneous reaction system. And 2-MNT and HNO3 follows the first-order kinetics, respectively.1 Therefore, the reaction rate of 2-MNT nitration can be expressed as eqn (5):where k1 is the observed second-order reaction rate constant based on HNO3, c2-MNT and cHNO3 are the concentrations of 2-MNT and HNO3, respectively. The reaction rate equation can be transformed in terms of the initial concentration and conversion of 2-MNT as eqn (6) and (7):| |  | (6) |
| |  | (7) |
where  and
and  are the initial concentrations of 2-MNT and HNO3, respectively. X2-MNT is the conversion of 2-MNT and
  . Based on the relationship between the reaction rate and residence time, the reaction rate equation can be transformed into eqn (8):
| | 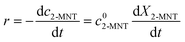 | (8) |
By integrating eqn (7) and (8), we can obtain:
| |  | (9) |
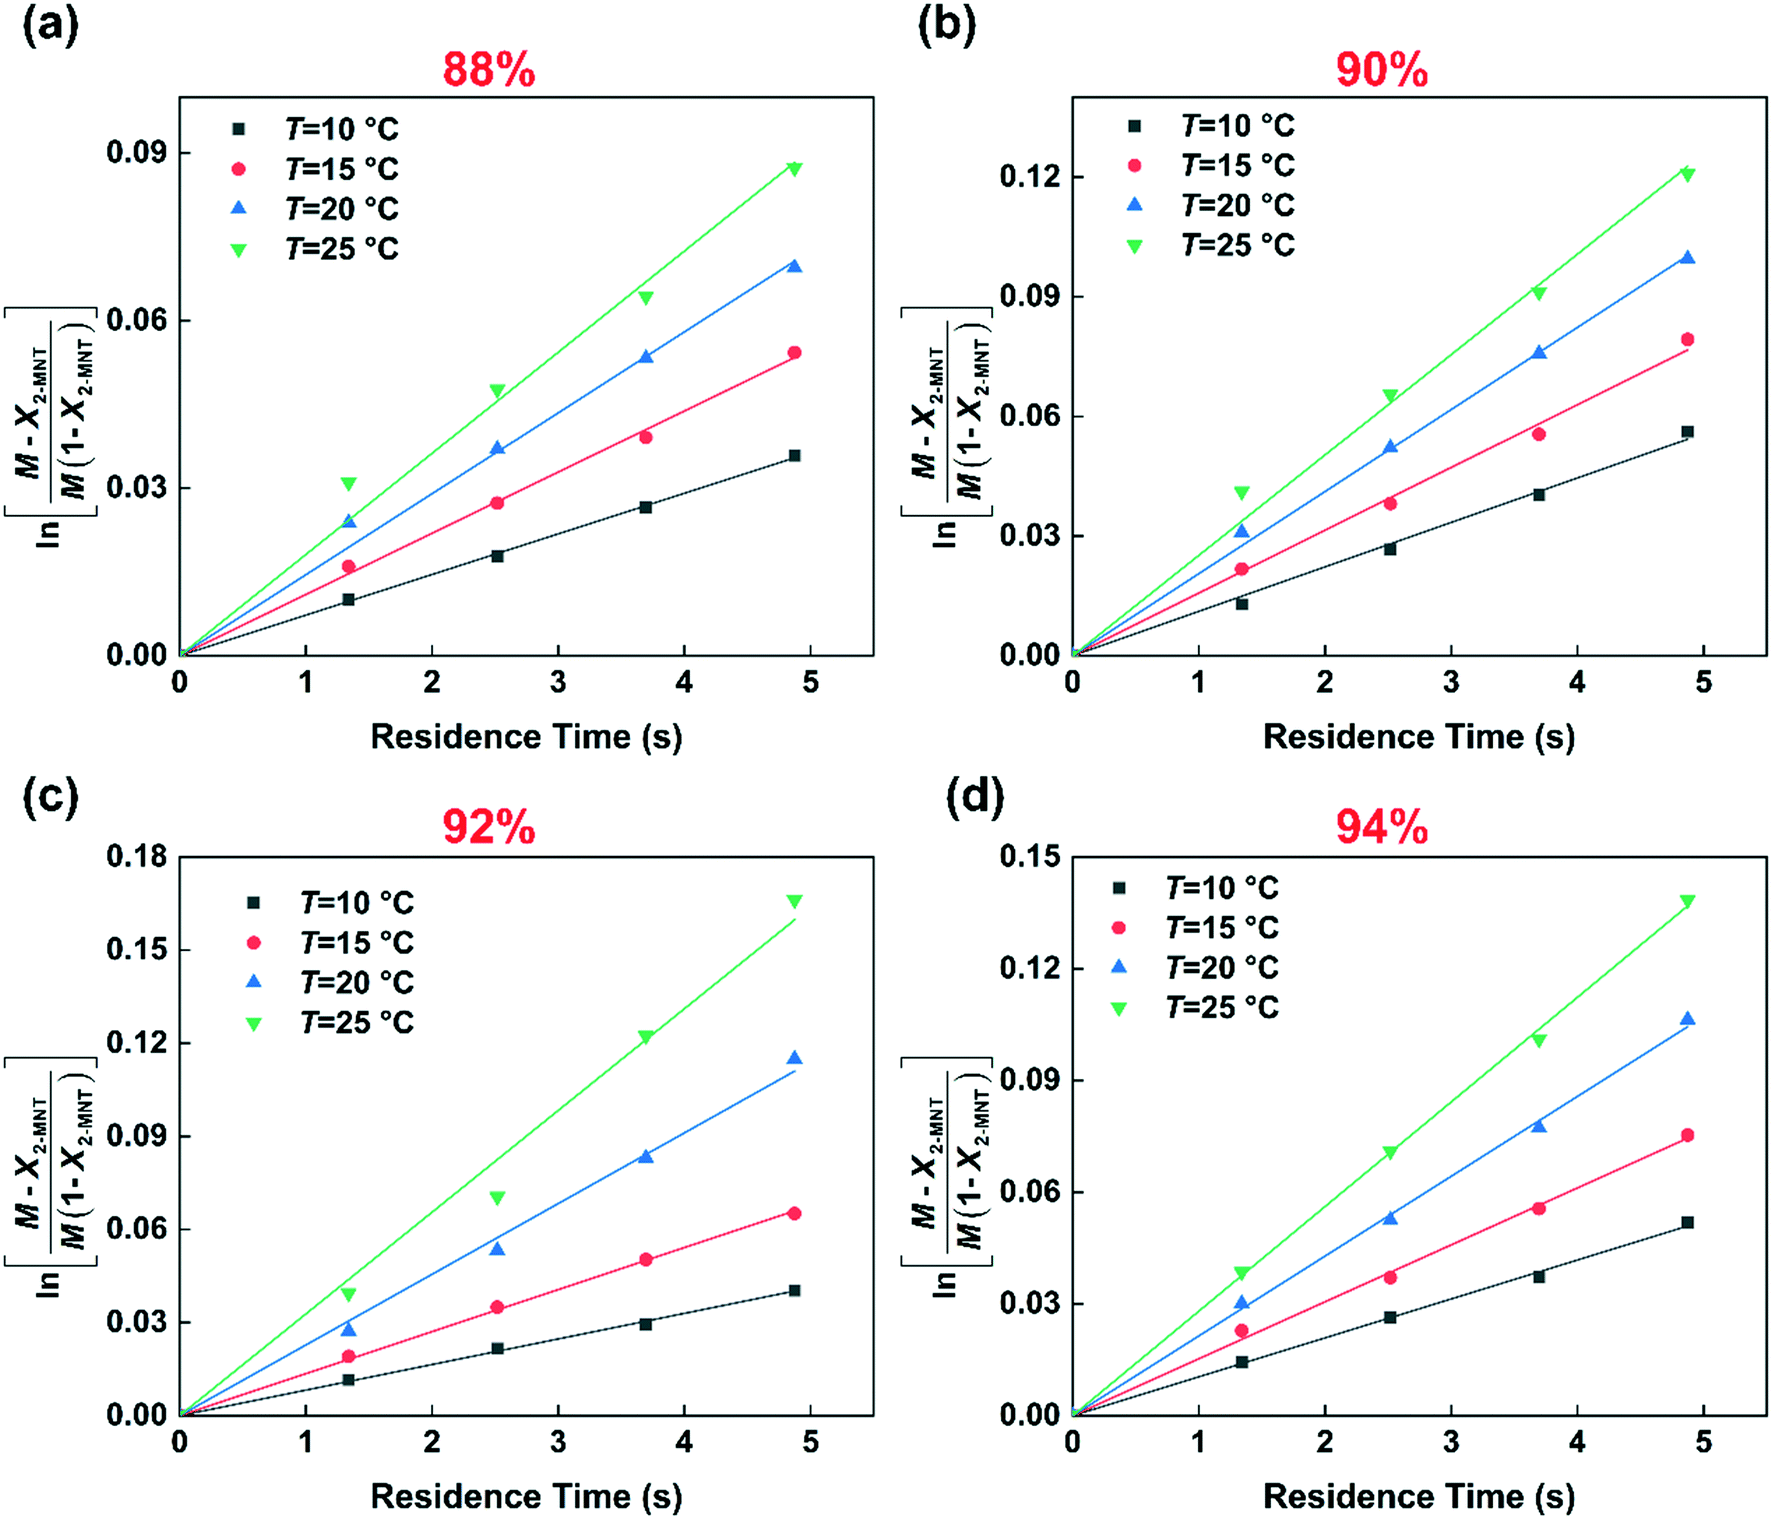
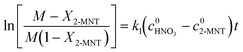
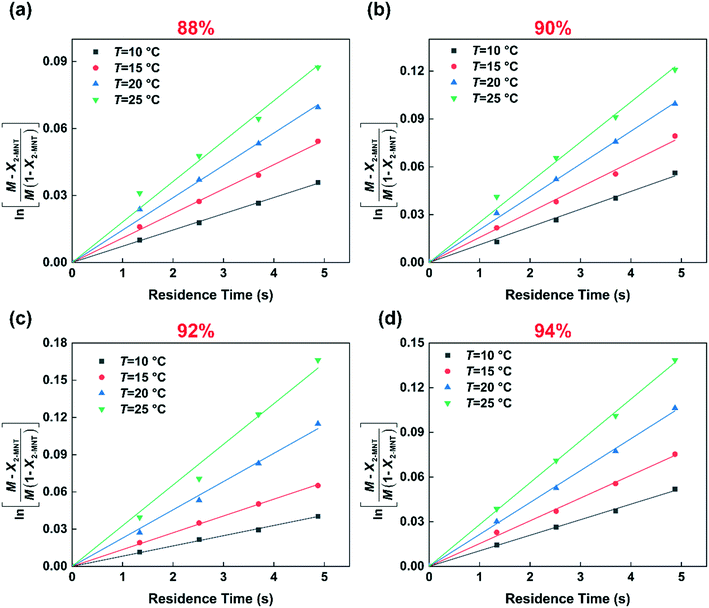
Based on eqn (9), the plot of  versus residence time (t) should be a straight line passing through the origin. Next, k1 can be calculated from the slope. The variation of X2-MNT with t at different temperatures (10, 15, 20 and 25 °C) and H2SO4 mass fractions (88, 90, 92 and 94%) is shown in Fig. 4. The corresponding plots of
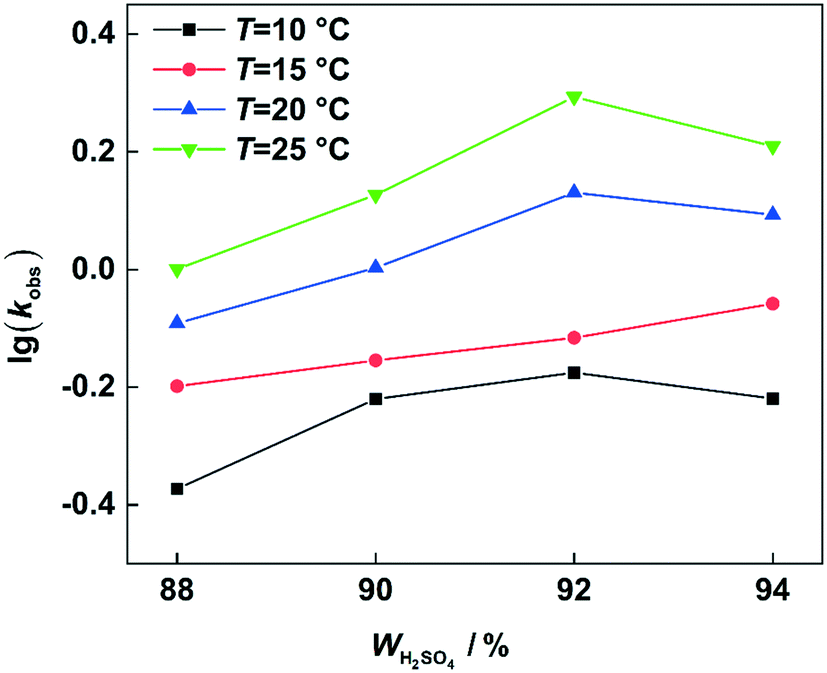
 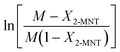 versus t are shown in Fig. 6. It can be observed that the data are fitted well by the straight lines, which is in good agreement with the hypothesis that the 2-MNT nitration is a second-order reaction. The values of k1 and their 95% confidence intervals are shown in the ESI† (Table S1). The variation of k1 with the H2SO4 mass fraction at different temperatures is shown in Fig. 7. The result demonstrates that the observed second-order reaction rate constant based on HNO3 is a strong function of the H2SO4 mass fraction. Generally, the observed reaction rate will increase with increasing H2SO4 concentration.1,23,24 However, it can be seen that k1 will decrease with increasing H2SO4 mass fraction when the H2SO4 mass fraction exceeds a certain value. The critical value is not a constant but changes with the variation of temperature. The reason for the phenomenon will be explained later in this section.
 |
| | Fig. 6 Determination of k1 at different temperatures and H2SO4 mass fractions. (a) 88% H2SO4, (b) 90% H2SO4, (c) 92% H2SO4, and (d) 94% H2SO4. | |
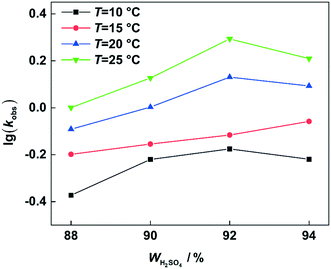 |
| | Fig. 7
k
1 variation with the H2SO4 mass fraction at different temperatures. | |
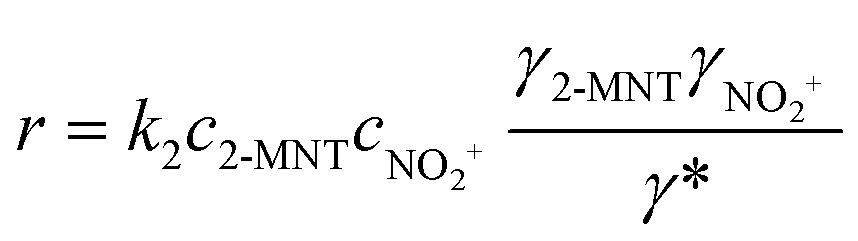
The observed reaction rate constant based on HNO3 is coupled strongly with the H2SO4 mass fraction. Therefore, it is necessary to study the reaction rate constant which is independent of the H2SO4 mass fraction. In fact, the rate-determining step of nitration with mixed acid in a homogeneous system is widely believed to be the attack of NO2+ on the aromatic compound. When the reaction rate is expressed by the concentration of NO2+, eqn (5) can be transformed into eqn (10):
| | | r = k2,expc2-MNTcNO2+ | (10) |
where
k2,exp is the observed second-order reaction rate constant related to the concentration of NO
2+ and
cNO2+ is the concentration of NO
2+.
k2,exp is a reaction rate constant related to the concentration of NO
2+. NO
2+ is an intermediate product and its concentration cannot be obtained directly. Therefore, the concentration of NO
2+ in the reaction rate equation should be expressed by the activity to characterize the effective concentration of NO
2+. The activity of NO
2+ can be expressed by its concentration and activity coefficient based on transition-state theory (Brønsted–Bjerrum rate law).
36 Therefore,
eqn (10) can be transformed into
eqn (11):
| | 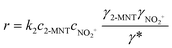 | (11) |
where
k2 is the observed reaction rate constant based on NO
2+ and related to the activity of NO
2+. And it is also a thermodynamic parameter that is a function of temperature and independent of the H
2SO
4 mass fraction.
γ2-MNT,
γNO2+ and
γ* are the activity coefficients of 2-MNT, NO
2+ and the transition intermediate, respectively. The values of the activity coefficients can be calculated by the activity coefficient function
Mc which was introduced by Marziano
et al.37–39Eqn (11) can be expressed by the
Mc function as follows:
| | | r = k2c2-MNTcNO2+10nMc | (12) |
where
n is a thermodynamic parameter which is unique to different aromatic compounds.
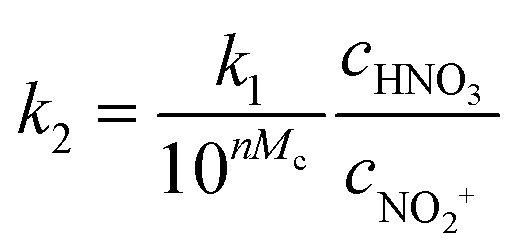
The relationship of the observed reaction rate constants based on HNO3 and NO2+ can be obtained by combining eqn (5) and (12) as follows:
| |  | (13) |
Taking the logarithm of eqn (13), we can obtain eqn (14):
| | lg![[thin space (1/6-em)]](https://www.rsc.org/images/entities/char_2009.gif) k1 − lg(cNO2+/cHNO3) = lgk2 + nMc k1 − lg(cNO2+/cHNO3) = lgk2 + nMc | (14) |
According to eqn (14), the plot of lgk1 − lg(cNO2+/cHNO3) versus Mc should be a straight line. The slope is equal to n and the intercept is equal to lgk2. To obtain the values of k2 and n, it is necessary to determinate the values of Mc and cNO2+/cHNO3. In our previous work, the method to determinate the values of Mc and cNO2+/cHNO3 has been discussed in detail. And the results are shown in the ESI† (Table S2).29
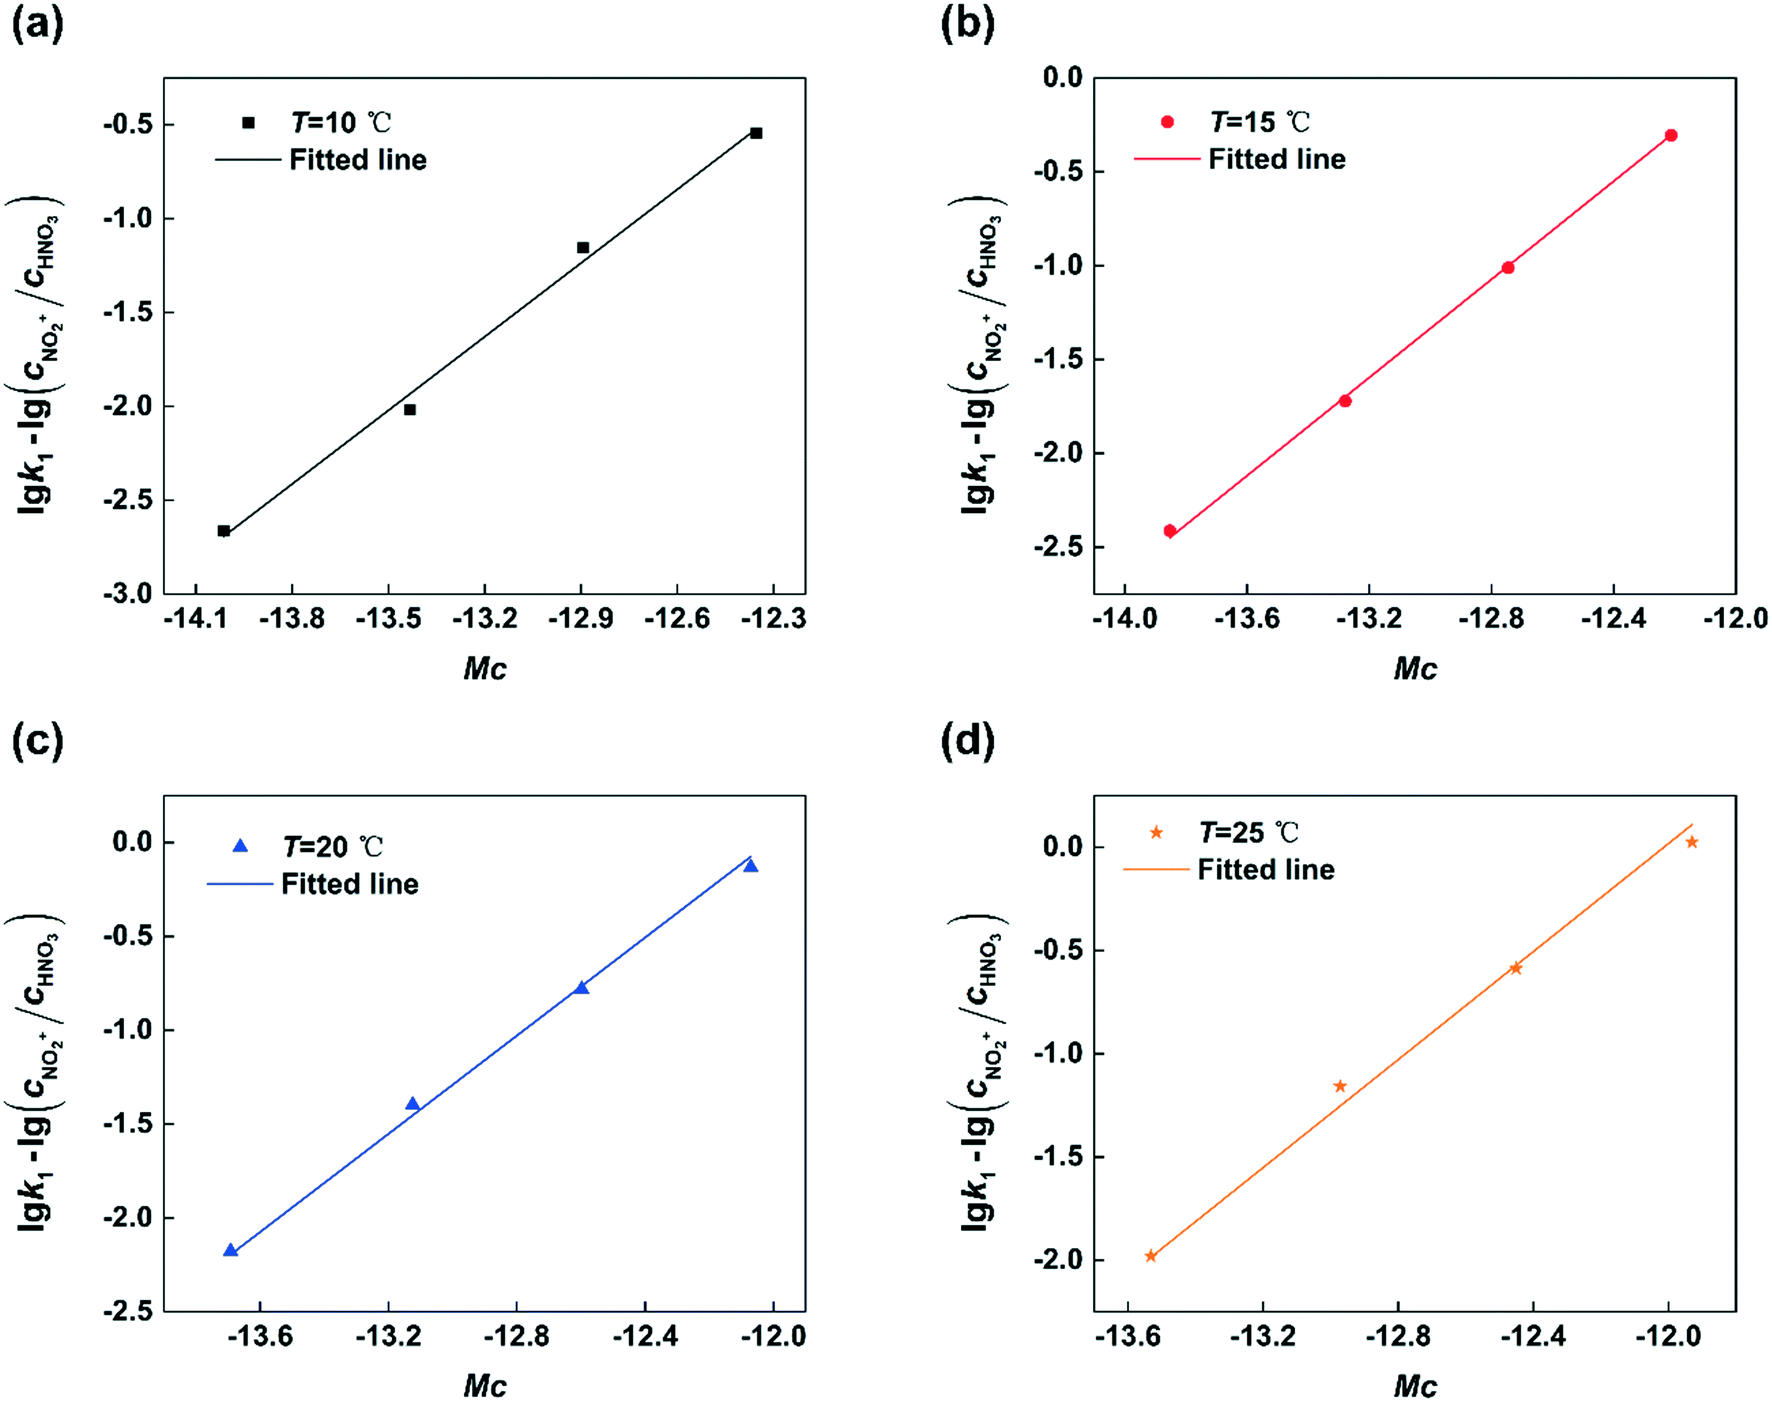
Next, by plotting lgk1 − lg(cNO2+/cHNO3) versus Mc at different temperatures, the results are shown in Fig. 8. It can be seen that the experimental data are fitted well by straight lines in all cases. The values of k2 and n at different temperatures are shown in Table 1. The value of k2 increases with increasing temperature. And the value of n nearly remains constant with the variation of temperature which is consistent with the conclusion reported in the previous literature.23,24
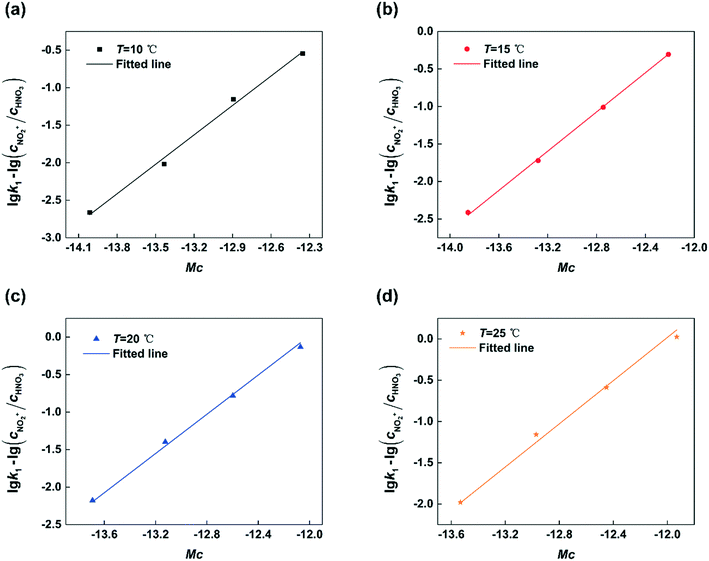 |
| | Fig. 8 Determination of n and k2 at different temperatures. (a) T = 10 °C, (b) T = 15 °C, (c) T = 20 °C, and (d) T = 25 °C. | |
Table 1 Values of k2 and n at different temperatures
| Temperature (°C) |
n
|
lgk2 |
|
The 95% confidence intervals of n and lgk2 are from the linear fit.
|
| 10 |
1.307 ± 0.008 |
15.627 ± 0.109 |
| 15 |
1.322 ± 0.003 |
15.858 ± 0.041 |
| 20 |
1.331 ± 0.008 |
16.099 ± 0.077 |
| 25 |
1.353 ± 0.011 |
16.296 ± 0.117 |
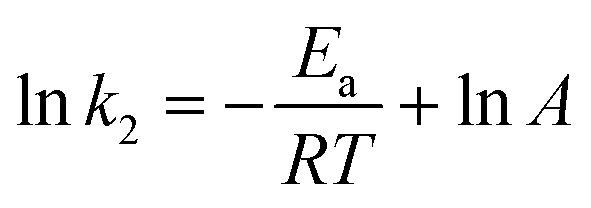
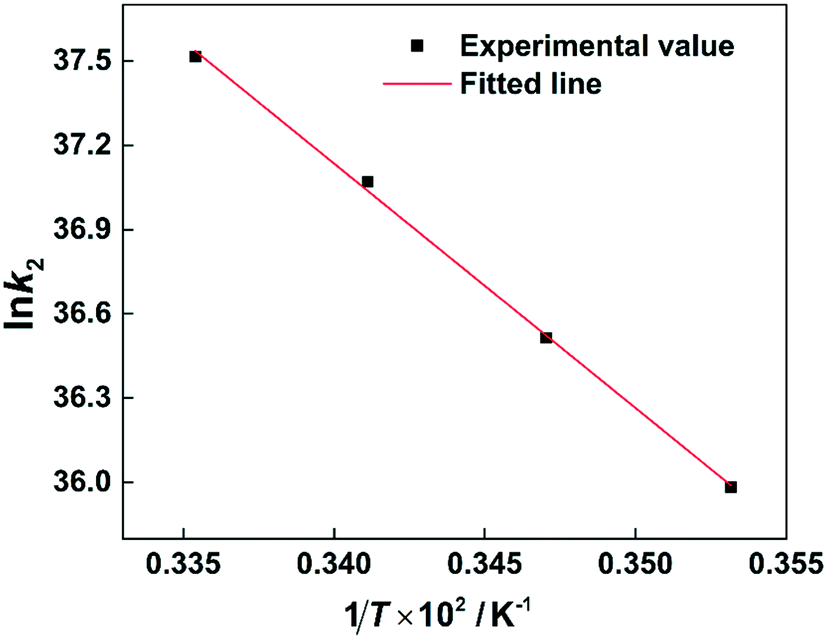
According to the values of k2 at different temperatures, the activation energy for the electrophilic attack of NO2+ on the 2-MNT molecule can be calculated by the Arrhenius equation:
| |  | (15) |
where
Ea and
A are the activation energy and preexponential factor of the total reaction of 2-MNT nitration.
R is the molar gas constant. The ln
k2versus 1/
T plot is shown in
Fig. 9. According to the slope of the straight line, the value of
Ea can be calculated to be 72.358 ± 2.075 kJ mol
−1 (
Table 2).
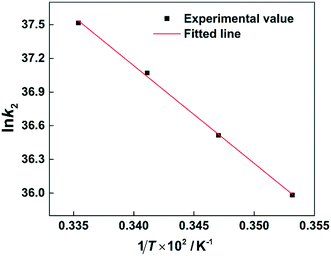 |
| | Fig. 9 Arrhenius plot of lnk2versus 1/T. | |
Table 2 Values and confidence intervals of the preexponential factor and activation energy
| Factors |
Values |
|
The 95% confidence intervals of Ea and lnA are from the linear fit.
|
|
E
a
|
72.358 ± 2.075 kJ mol−1 |
| lnA |
66.726 ± 3.074 |
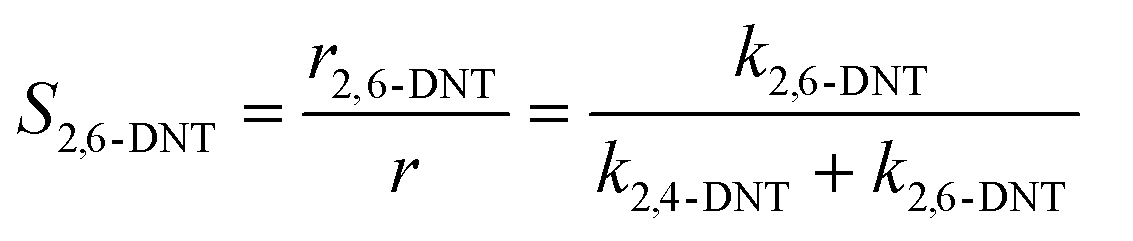
As mentioned earlier, there are two parallel reactions in the 2-MNT nitration process. The reaction rate equations of the two reactions can be expressed as follows:
| | | r2,4-DNT = k2,4-DNTc2-MNTcNO2+ | (16) |
| | | r2,6-DNT = k2,6-DNTc2-MNTcNO2+ | (17) |
where
r2,4-DNT and
r2,6-DNT are the reaction rates of two parallel reactions to generate 2,4-DNT and 2,6-DNT, respectively.
k2,4-DNT and
k2,6-DNT are the reaction rate constants based on NO
2+ of parallel reactions, respectively.
Generally, the ratio of the reaction rates of two first-order parallel reactions is equal to the ratio of the reaction rate constants. And according to the definition, the selectivity (S) can be expressed as follows:
| |  | (18) |
| |  | (19) |
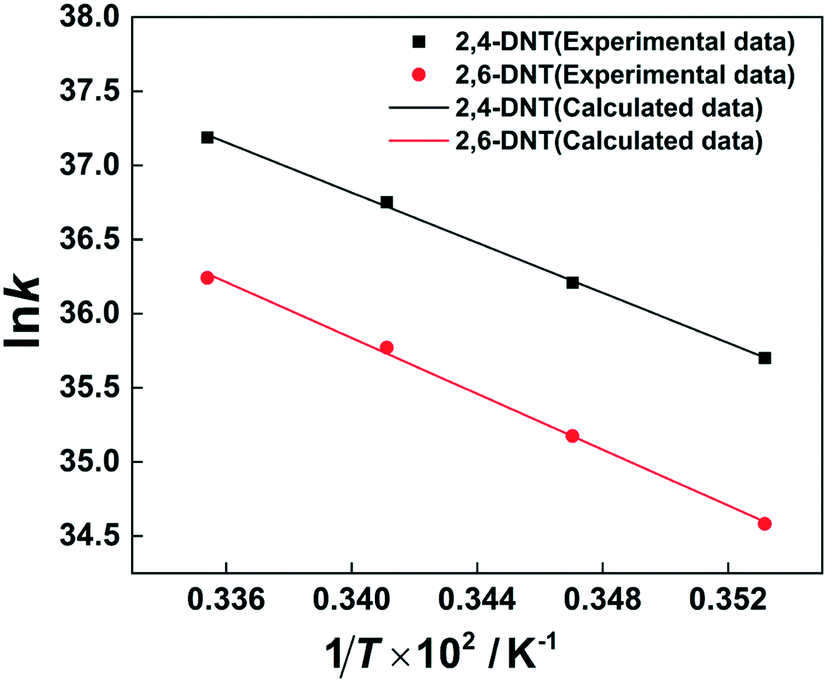
The selectivity to 2,4-DNT and 2,6-DNT at a given temperature is shown in Fig. 3. Therefore, after determining the values of k2 and S, the values of k2,4-DNT and k2,6-DNT can be calculated at specific temperatures. And according to the Arrhenius equation, the activation energies and preexponential factors of 2,4-DNT and 2,6-DNT can be obtained, respectively (Fig. 10). The activation energies for forming 2,4-DNT and 2,6-DNT are 70.239 ± 1.808 kJ mol−1 and 78.298 ± 1.252 kJ mol−1, respectively (Table 3).
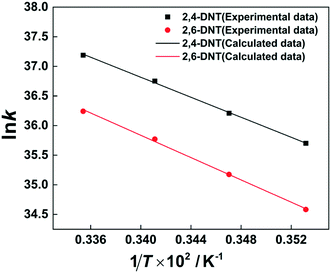 |
| | Fig. 10 Arrhenius plots of lnk versus 1/T for forming 2,4-DNT and 2,6-DNT. | |
Table 3 Values and confidence intervals of the preexponential factors and activation energies of the two parallel reactions
| Parallel reaction |
E
a
|
lnA |
|
The 95% confidence intervals of Ea and lnA are from the linear fit.
|
| 2,4-DNT |
70.239 ± 1.808 kJ mol−1 |
65.541 ± 2.818 |
| 2,6-DNT |
78.298 ± 1.252 kJ mol−1 |
67.856 ± 2.038 |
3.4 Determination of the H2SO4 mass fraction corresponding to the maximum value of k1 at different temperatures
After determining the values of k2 and n at different temperatures, eqn (14) can be transformed into eqn (20):| | | lgk1 = lg(cNO2+/cHNO3) + lgk2 + nMc | (20) |
For a certain aromatic nitration, n is a constant related only to the types of aromatic compounds and k2 is only related to temperature and independent of the H2SO4 mass fraction. At a specific temperature, the value of lg(cNO2+/cHNO3) will increase and Mc will decrease with increasing H2SO4 mass fraction, which can be used to explain the increase and decrease of k1 very well (Fig. 7). The values of nMc and lg(cNO2+/cHNO3) + lgk2 are shown in the ESI† (Table S3).
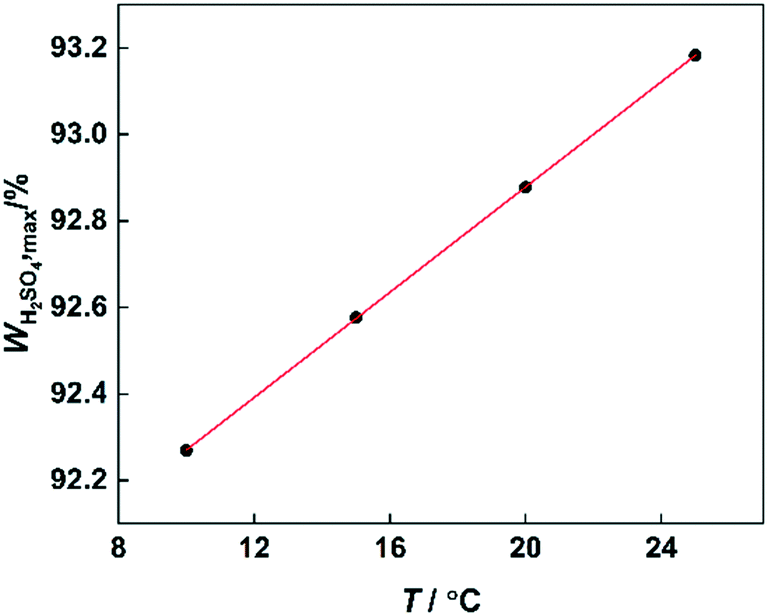
According to the reaction kinetic model, the values of k1 can be predicted at different temperatures and H2SO4 mass fractions. By plotting lgk1versus H2SO4 mass fractions, it can be seen that at each temperature, k1 first increases and then decreases with increasing sulfuric acid concentration (Fig. 11). However, the H2SO4 mass fraction (WH2SO4,max) corresponding to the maximum value of k1 is different at different temperatures. Therefore, the variation of WH2SO4,max with temperature is shown in Fig. 12.
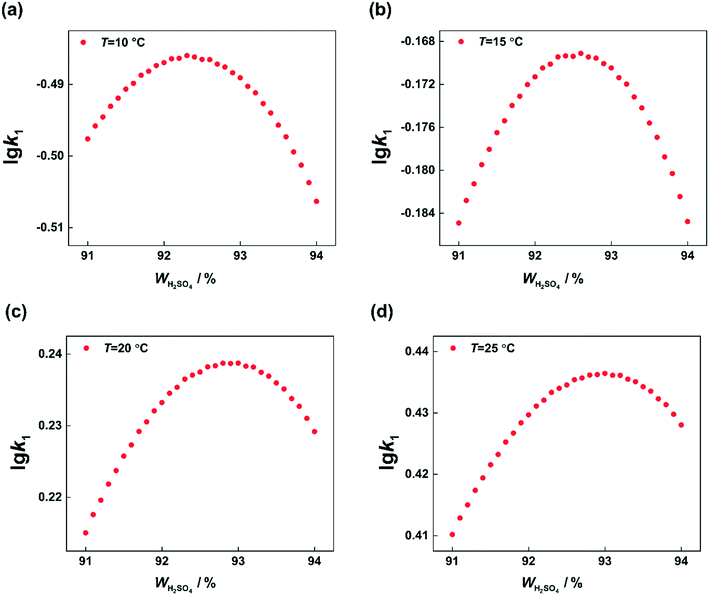 |
| | Fig. 11 Calculated values of k1 at different temperatures and H2SO4 mass fractions. (a) T = 10 °C, (b) T = 15 °C, (c) T = 20 °C, and (d) T = 25 °C. | |
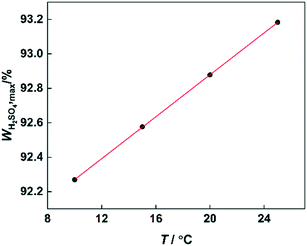 |
| | Fig. 12 Variation of WH2SO4,max with temperature. | |
It can be observed that the value of WH2SO4,max increases with increasing temperature, because the content of free water in the system will increase with increasing temperature. For the high-concentration H2SO4 solution, the content of water in the system is low. And the concentration of NO2+ would be greatly influenced by the content of water. Therefore, the increase of free water content will result in a decrease in the concentration of NO2+. The increase of the H2SO4 mass fraction will increase the concentration of NO2+.31,40 Therefore, when the temperature increases, a higher concentration of H2SO4 will be needed to provide a sufficient concentration of NO2+.
3.5 Verification of the reaction kinetics model
The reaction kinetics model has been verified by changing the residence time to predict the conversion of 2-MNT, as shown in Fig. 13. 92% H2SO4 was selected and the conversion of 2-MNT was investigated at different temperatures. It can be observed that the calculated data fit well with the experimental data under both the conditions of a short residence time and a long residence time. The validity of the model can be confirmed. Therefore, it is credible to predict the reaction performance under different reaction conditions through this kinetic model. By comparing with the result of 2-MNT nitration in the literature, a higher conversion of 2-MNT can be obtained in this work under the same experimental conditions, which shows that the reaction rate is faster with a homogeneous continuous microflow in this work.30 This also proves that the effect of mass transfer resistance between phases on the reaction rate cannot be eliminated completely. Therefore, the determination of the kinetic parameters of the nitration with a homogeneous continuous microflow can be more accurate (Table 4).
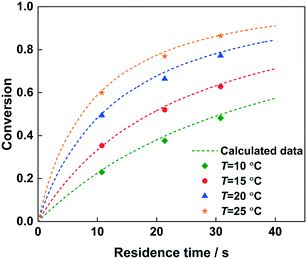 |
| | Fig. 13 Comparison of the experimental (data points) and predicted (dotted lines) values for 2-MNT conversion at different temperatures. | |
Table 4 Comparison of reaction performance
| Reactor type |
Temperature/°C |
Conversion/% |
Residence time/s |
Phase state |
| Micro-packed30 |
23 |
82 |
57.57 |
Liquid–liquid heterogeneous reaction |
| Continuous microchannel |
23 |
93.72 |
57.57 |
Homogeneous reaction |
4. Conclusion
In this work, the mass transfer resistance between two liquid phases in the heterogeneous reaction process was completely eliminated by constructing a homogeneous system. And the kinetics of 2-MNT homogeneous nitration were investigated with a continuous microflow. The effects of temperature, molar ratio, residence time, and H2SO4 mass fraction on the conversion of 2-MNT and selectivity to DNT were investigated. The results show that increasing the content of water is conducive to increase the selectivity to 2,6-DNT. Next, the observed reaction rate constants based on HNO3 and NO2+ were obtained, respectively. The observed reaction rate constant based on HNO3 has been proven to be highly dependent on the concentration of H2SO4. The reaction rate increases with increasing H2SO4 mass fraction. However, the increase is limited. When the H2SO4 mass fraction increases to a certain value, the reaction rate decreases with increasing H2SO4 mass fraction. The phenomenon was firstly explained in detail in this work. And to the best of our knowledge, this is the first time to report the maximum observed reaction rate constant corresponding to the H2SO4 mass fraction at different temperatures. Next, a complete kinetic model of 2-MNT nitration was established to describe the reaction performance. The activation energies and the preexponential factors of the mononitration of 2-MNT and the two parallel reactions were obtained, respectively. The activation energy of 2-MNT nitration is 72.358 ± 2.075 kJ mol−1. The activation energy of generating 2,4-DNT is 70.239 ± 1.808 kJ mol−1 and generating 2,6-DNT is 78.298 ± 1.252 kJ mol−1. And the validity of the kinetic model was proven by comparing the predicted data with the experimental data. By comparing with the results reported in the previous literature, it has been proven that the reaction rate is faster in homogeneous nitration than in a heterogeneous system under the same experimental conditions. The kinetic model can be proven to be more accurate. Therefore, this model can be utilized to understand the whole process of 2-MNT nitration and optimize the reactor design.
Nomenclature
|
X
2-MNT
| Conversion of o-nitrotoluene, % |
|
c
2-MNT
| Concentration of o-nitrotoluene in the sample, mol L−1 |
|
c
2,4-DNT
| Concentration of 2,4-dinitrotoluene in the sample, mol L−1 |
|
c
2,6-DNT
| Concentration of 2,6-dinitrotoluene in the sample, mol L−1 |
|
c
HNO3
| Concentration of HNO3 in the sample, mol L−1 |

| Initial concentration of o-nitrotoluene, mol L−1 |

| Initial concentration of HNO3, mol L−1 |
|
c
NO2+
| Concentration of NO2+ in the sample, mol L−1 |
|
S
2,4-DNT
| Selectivity to 2,4-dinitrotoluene |
|
S
2,6-DNT
| Selectivity to 2,6-dinitrotoluene |
|
t
| Residence time, s |
|
V
| Volume of the microchannel, cm3 |
|
Q
h
| Volume flow rate of homogeneous solution, mL s−1 |
|
Q
m
| Volume flow rate of mixed acid, mL s−1 |
|
M
| Molar ratio of HNO3 to o-nitrotoluene |
|
r
|
o-Nitrotoluene nitration reaction rate, mol L−1 s−1 |
|
r
2,4-DNT
| Reaction rate of parallel reaction to generate 2,4-dinitrotoluene |
|
r
2,6-DNT
| Reaction rate of parallel reaction to generate 2,6-dinitrotoluene |
|
k
2,4-DNT
| Reaction rate constants of parallel reaction to generate 2,4-dinitrotoluene |
|
k
2,6-DNT
| Reaction rate constants of parallel reaction to generate 2,6-dinitrotoluene |
|
k
1
| Observed second-order reaction rate constant based on HNO3, L mol−1 s−1 |
|
k
2,exp
| Experimentally observed second-order reaction rate constant related to the concentration of NO2+, L mol−1 s−1 |
|
k
2
| The observed reaction rate constant based on NO2+, L mol−1 s−1 |
|
γ
2-MNT
| Activity coefficients of o-nitrotoluene |
|
γ
NO2+
| Activity coefficients of NO2+ |
|
γ* | Activity coefficients of the transition intermediate |
|
n
| Thermodynamic parameter |
|
M
c
| Activity coefficient function |
|
T
| Temperature, °C |
|
E
a
| Activation energy, kJ mol−1 |
|
A
| Preexponential factor, L mol−1 s−1 |
|
R
| Molar gas constant, J mol−1 K−1 |
|
W
H2SO4,max
| H2SO4 mass fraction corresponding to the maximum observed reaction rate constant based on HNO3, % |
Funding information
National Natural Science Foundation of China, Grant/Award Number: 21991104.
Conflicts of interest
There are no conflicts to declare.
Acknowledgements
This work was financially supported by the National Natural Science Foundation of China (Grant No. 21991104).
References
- M. Yang, C. Liao, C. Tang, P. Zhang, Z. Huang and J. Li, Phys. Chem. Chem. Phys., 2021, 23, 4658–4668 RSC.
- M. Hossein Keshavarz, H. Reza Pouretedal, H. Sadeghi and A. Semnani, Propellants, Explos., Pyrotech., 2009, 34, 415–420 CrossRef.
- R. Halder, A. Lawal and R. Damavarapu, Catal. Today, 2007, 125, 74–80 CrossRef CAS.
- P. A. Quadros, N. M. C. Oliveira and C. M. S. G. Baptista, Chem. Eng. Sci., 2004, 59, 5449–5454 CrossRef CAS.
- P. A. Quadros, N. M. C. Oliveira and C. M. S. G. Baptista, Chem. Eng. J., 2005, 108, 1–11 CrossRef CAS.
- R. D. Biggs and R. R. White, AIChE J., 2010, 2, 26–33 CrossRef.
- P. R. Cox and A. N. Strachan, Chem. Eng. J., 1972, 4, 253–261 CrossRef CAS.
- P. R. Cox and A. N. Strachan, Chem. Eng. Sci., 1972, 27, 457–463 CrossRef CAS.
- J. W. Chapman, P. R. Cox and A. N. Strachan, Chem. Eng. Sci., 1974, 29, 1247–1251 CrossRef CAS.
- P. R. Cox and A. N. Strachan, Chem. Eng. Sci., 1971, 26, 1013–1018 CrossRef CAS.
- M. J. Thompson and P. J. Zeegers, Tetrahedron, 1989, 45, 191–202 CrossRef CAS.
- M. J. Hompson and P. J. Eegers, Tetrahedron, 1990, 46, 2661–2674 CrossRef.
- P. J. Zeegers, J. Chem. Educ., 1993, 70, 1036 CrossRef CAS.
- F. H. Westheimer and M. S. Kharasch, J. Am. Chem. Soc., 1946, 68, 1871–1876 CrossRef CAS.
- N. Kockmann, P. Thenée, C. Fleischer-Trebes, G. Laudadio and T. Noël, React. Chem. Eng., 2017, 2, 258–280 RSC.
- C. Du, Y. Hu, J. Zhang and G. Luo, React. Chem. Eng., 2019, 4, 1991–1999 RSC.
- Z. Yan, Z. Ma, J. Deng and G. Luo, Chem. Eng. Sci., 2021, 242, 116746 CrossRef CAS.
- M. Köckinger, B. Wyler, C. Aellig, D. M. Roberge, C. A. Hone and C. O. Kappe, Org. Process Res. Dev., 2020, 24, 2217–2227 CrossRef.
- K. Wang, L. Li, P. Xie and G. Luo, React. Chem. Eng., 2017, 2, 611–627 RSC.
- M. Magosso, M. van den Berg and J. van der Schaaf, React. Chem. Eng., 2021, 6, 1574–1590 RSC.
- L. Sheng, Y. Chen, K. Wang, J. Deng and G. Luo, Chem. Eng. Sci., 2021, 239, 116621 CrossRef CAS.
- L. Sheng, L. Ma, Y. Chen, J. Deng and G. Luo, Chem. Eng. J., 2022, 427, 132067 CrossRef CAS.
- L. Li, C. Yao, F. Jiao, M. Han and G. Chen, Chem. Eng. Process., 2017, 117, 179–185 CrossRef CAS.
- Z. Wen, M. Yang, S. Zhao, F. Zhou and G. Chen, React. Chem. Eng., 2018, 3, 379–387 RSC.
- M. Rahaman, B. P. Mandal and P. Ghosh, AIChE J., 2007, 53, 2476–2480 CrossRef CAS.
- R. Andreozzi, A. Insola, T. Aquila and V. Caprio, Int. J. Chem. Kinet., 1993, 25, 771–776 CrossRef CAS.
- M. Rahaman, B. Mandal and P. Ghosh, AIChE J., 2009, 56(3), 737–748 Search PubMed.
- E. Mielke, P. Plouffe, N. Koushik, M. Eyholzer, M. Gottsponer, N. Kockmann, A. Macchi and D. M. Roberge, React. Chem. Eng., 2017, 2, 763–775 RSC.
- J. Song, Y. Cui, L. Sheng, Y. Wang, C. Du, J. Deng and G. Luo, Chem. Eng. Sci., 2021, 117041, DOI:10.1016/j.ces.2021.117041.
- Y. Su, Y. Zhao, F. Jiao, G. Chen and Q. Yuan, AIChE J., 2011, 57, 1409–1418 CrossRef CAS.
- H. G. M. Edwards, J. M. C. Turner and V. Fawcett, J. Chem. Soc., Faraday Trans., 1995, 91, 1439–1443 RSC.
- N. C. Marziano, P. G. Traverso, A. De Santis and M. Sampoli, J. Chem. Soc., Chem. Commun., 1978, 873–874 RSC.
- N. C. Deno, H. J. Peterson and E. Sacher, J. Phys. Chem., 1961, 65, 37–43 CrossRef.
- H. Edwards and V. Fawcett, J. Mol. Struct., 1994, 326, 131–143 CrossRef CAS.
- N. C. Deno, H. J. Peterson and E. Sacher, J. Phys. Chem., 1961, 65, 199–201 CrossRef CAS.
-
G. A. Olah, R. Malhotra and S. C. Narang, Across Conventional Lines, 1989 Search PubMed.
- N. C. Marziano, M. Sampoli, F. Pinna and A. Passerini, ChemInform, 1984, 15(41), 1163–1166 Search PubMed.
- N. C. Marziano, G. M. Cimino and R. C. Passerini, Chem. Informationsdienst, 1973, 5, 1915 Search PubMed.
- N. C. Marziano, A. Tomasin and P. G. Traverso, ChemInform, 1981, 12, 1070–1075 Search PubMed.
- H. G. M. Edwards and V. Fawcett, J. Mol. Struct., 1994, 326, 131–143 CrossRef CAS.
Footnotes |
| † Electronic supplementary information (ESI) available. See DOI: 10.1039/d1re00362c |
| ‡ Jing Song and Yongjin Cui contributed equally to this work. |
|
| This journal is © The Royal Society of Chemistry 2022 |
Click here to see how this site uses Cookies. View our privacy policy here. 
 ,
Guangsheng
Luo
,
Guangsheng
Luo


 and
and  are the initial concentrations of 2-MNT and HNO3, respectively. X2-MNT is the conversion of 2-MNT and
  . Based on the relationship between the reaction rate and residence time, the reaction rate equation can be transformed into eqn (8):

 versus residence time (t) should be a straight line passing through the origin. Next, k1 can be calculated from the slope. The variation of X2-MNT with t at different temperatures (10, 15, 20 and 25 °C) and H2SO4 mass fractions (88, 90, 92 and 94%) is shown in Fig. 4. The corresponding plots of
 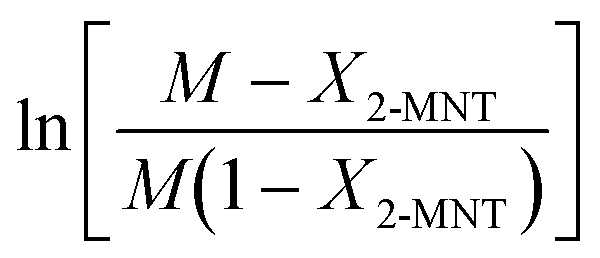 versus t are shown in Fig. 6. It can be observed that the data are fitted well by the straight lines, which is in good agreement with the hypothesis that the 2-MNT nitration is a second-order reaction. The values of k1 and their 95% confidence intervals are shown in the ESI† (Table S1). The variation of k1 with the H2SO4 mass fraction at different temperatures is shown in Fig. 7. The result demonstrates that the observed second-order reaction rate constant based on HNO3 is a strong function of the H2SO4 mass fraction. Generally, the observed reaction rate will increase with increasing H2SO4 concentration.1,23,24 However, it can be seen that k1 will decrease with increasing H2SO4 mass fraction when the H2SO4 mass fraction exceeds a certain value. The critical value is not a constant but changes with the variation of temperature. The reason for the phenomenon will be explained later in this section.