 Open Access Article
High-efficiency and energy-saving alternating pulse current electrocoagulation to remove polyvinyl alcohol in wastewater†
Jiepei Zhanga,
Junfeng Li *a,
Chengxiao Maa,
Lijuan Yib,
Tiantian Gub and
Jiankang Wanga
aSchool of Water Conservancy and Architectural Engineering, Shihezi University, Shihezi 832000, PR China. E-mail: ljfshz@126.com; Tel: +86-993-2055060 Tel: +86-152-9992-1362
bKey Laboratory for Green Process of Chemical Engineering of Xinjiang Bingtuan, School of Chemistry and Chemical Engineering, Shihezi University, Xinjiang 832003, PR China
First published on 16th December 2021
Abstract
Conventional direct current electrocoagulation (DC-EC) has disadvantages such as easy passivation of electrodes, high energy consumption, and large sludge production, which limit its use in polyvinyl alcohol (PVA) wastewater. Therefore, alternating pulse current electrocoagulation (APC-EC) has been developed to overcome these problems. In this study, the influencing factors and energy consumption of PVA treatment by APC-EC and DC-EC were explored, and the best operating conditions of APC-EC were obtained via the response surface method (RSM). The best process conditions for APC-EC were determined to be the electrode type of Fe/Fe, current density of 1.0 mA cm−2, initial pH of 7, electrode distance of 2.0 cm, supporting electrolyte of 0.08 mol L−1 NaCl, initial PVA concentration of 150 mg L−1, duty cycle of 30%, and frequency of 500 Hz. In addition, the floc properties of APC-EC and DC-EC were compared to explore the basic mechanism for the removal of PVA. Adsorption and co-precipitation with hydroxide iron complexes are the main methods for removing PVA from wastewater in the APC-EC process. Compared with DC-EC, the application of APC-EC can reduce electrode passivation and production of sludge and operating costs, and improve electrode stability and PVA removal efficiency. This study provides a new strategy and method for the PVA removal from wastewater by APC-EC with low cost and high efficiency, showing broad prospect for the applications of the APC-EC in removing PVA.
1 Introduction
Polyvinyl alcohol (PVA) is widely used in industry, commerce, medicine, agriculture, food, and other fields owing to its stability and high emulsifying ability.1–4 However, a substantial portion of PVA has been discharged into the natural environment with wastewater, which eventually harms the human well-being through the food chain.2 Moreover, PVA can accelerate the diffusion of heavy metals in the sediments of water, rivers and lakes.5 Therefore, it is urgent to explore effective methods for the treatment of PVA in water.At present, the commonly used technologies include biological,6 photocatalytic degradation,7 ultrasonic technology,8 Fenton method,9 radiation-induced degradation,10 adsorption methods11 and other methods.12 However, all these processes have limitations for practical applications in actual wastewater. For instance, the UV/H2O2 process has relatively high operational and capital costs.5 The biological method has a long running time and is difficult to manage.13,14 In photocatalytic processes, a pretreatment is required to avoid fouling of the active sites and destructive inhibition of the catalyst.15 The drawback of the Fenton process is the strict control of the pH range.3 Therefore, the development of low-cost and high-efficiency techniques are of great significance.
In recent years, electrocoagulation (EC) has been reported to be efficient in the treatment of potable water,16 municipal,17 smelting wastewater,18 restaurant wastewater,19 and textile wastewater,20 etc. This technology requires a simple equipment, convenient operation, and high stability.21 However, its disadvantages, such as high energy consumption and easy passivation of electrodes, limit their application in industrial wastewater. Alternating pulse current electrocoagulation (APC-EC) treatment technology is an effective wastewater treatment method based on conventional EC. Compared with direct current electrocoagulation (DC-EC), it can eliminate and reduce passivation, and can also reduce energy consumption and achieve high processing efficiency.22,23 APC-EC has been used to treat synthetic and real smelting wastewater,22 textile wastewater,24 brewery wastewater,25 dye wastewater,26 Cr(VI),23,27,28 antibiotics29 and natural organic matter.30 These studies have achieved relatively satisfactory results. Therefore, APC-EC has a very good application prospects for PVA wastewater treatment. However, it is still unclear how the utilisation of DC-EC and APC-EC in the removal of PVA wastewater will affects the removal efficiency, operating cost, electrode stability, and flocculation form. Therefore, these methods were assessed in this study to better understand the superiority of the APC-EC.
The main objectives of the present study were to (1) investigate the effects of electrode type, electrode spacing, current density, initial pH, electrolyte concentration, initial PVA concentration, duty cycle and frequency on the PVA removal from synthetic wastewater by the APC-EC and DC-EC processes. (2) Optimal operating conditions were determined. (3) The flocs produced in the two EC processes were characterised by scanning electron microscopy (SEM), X-ray fluorescence (XRF), Fourier transform infrared (FTIR), X-ray diffraction (XRD), and X-ray photoelectron spectroscopy (XPS), and a possible mechanism was proposed. (4) The molecular weight and iron ion concentration of the solution were discussed. (5) The energy, electrode consumption, and electrode stability of the EC process for PVA removal efficiency were also evaluated.
2 Materials and methods
2.1 Chemicals and equipment
In the present work, chemical reagents such as PVA (Table S1†), hydrochloric acid (HCl), boric acid (H3BO3), sodium chloride (NaCl), iodine (I2), potassium iodide (KI), sulfuric acid (H2SO4), sodium hydroxide (NaCl) were all analytically pure and purchased from Beijing Chemical Reagent Factory China. H2SO4 (1 mol L−1) and NaOH (1 mol L−1) were used to adjust the pH of the samples, as required.The pulse power supply was purchased from Hebei Cangzhou Company (Model DS-SMR-DP-CA). Direct power supply was purchased from Shenzhen Mai sheng Company (Model MS-155D). The magnetic stirrer was bought from Shanghai (Model MS-H-S).
2.2 Electrocoagulation process
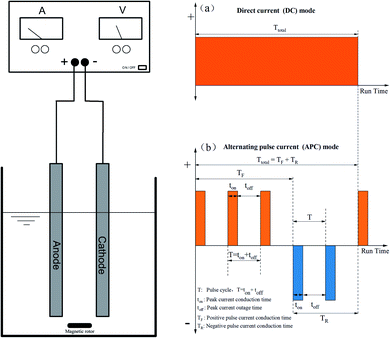
In this experiment, the EC process was carried out using a 0.5 L cylindrical glass as the batch reactor. The schematic diagram is shown in Fig. 1. Iron plates with dimensions of 120 mm × 10 mm × 2 mm were used as cathodes and anodes, with an effective area of 10 cm2. Prior to the experiments, the electrodes were chemically cleaned with HCl (1 mol L−1) and rinsed with ultrapure water three times for pre-treatment to remove the iron oxides and any passive film that may have formed. The electrode was then polished with sandpaper, cleaned, and dried in an oven at 60 °C. They were connected to an APC power supply. For each run, the PVA solution was filtered through a 0.4 μm micron filter and analysed with an ultraviolet and visible spectrophotometer (UV-VIS), (Ultima 2C, HACH). The COD concentration in the aqueous solutions was measured using a HACH Model DR2800 spectrophotometer (HACH Company, USA).2.3 Analysis
In 5 mL of PVA standard solution, 6 mL of colour reagent was added at a ratio of boric acid: iodine = 5![[thin space (1/6-em)]](https://www.rsc.org/images/entities/char_2009.gif) :
:![[thin space (1/6-em)]](https://www.rsc.org/images/entities/char_2009.gif) 1,31 and diluted to 30 mL. The mixture was shaken well and allowed to stand for 20 min, and its concentration was measured at 680 nm using UV-VIS. To reduce error, each group of experiments was repeated three times.
1,31 and diluted to 30 mL. The mixture was shaken well and allowed to stand for 20 min, and its concentration was measured at 680 nm using UV-VIS. To reduce error, each group of experiments was repeated three times.
The experimental removal efficiency of PVA can be calculated by eqn (1).
 | (1) |
The current efficiency (Φ) is a measure of an electrochemical process leading indicators, calculated by eqn (2).
 | (2) |
The energy consumption of DC-EC and APC-EC were calculated by eqn (3) and (4), respectively.
 | (3) |
 | (4) |
The theoretical electrode consumption was calculated by eqn (5).
 | (5) |
![[thin space (1/6-em)]](https://www.rsc.org/images/entities/char_2009.gif) 485 C mol−1). Experimentally, the consumed mass of electrodes can be calculated by measuring the difference between the anode before and after each run.
485 C mol−1). Experimentally, the consumed mass of electrodes can be calculated by measuring the difference between the anode before and after each run.
Duty cycle refers to the ratio of the ton time to the total time in a pulse cycle eqn (6).
 | (6) |
The pulse frequency was determined by the pulse on–off period eqn (7).
 | (7) |
2.4 Characterization
Morphological and elemental analysis of the flocs are performed by scanning electron microscopy (SEM) and X-ray fluorescence (XRF) (FEI Quanta 650, Thermo Fisher, U. S. A.) analysis. The floc is powdered after drying and prepared as KBr discs for characterization by Fourier transform infrared spectrometry (FTIR) (Thermo Scientific Nicolet 6700, Thermo Fisher Scientific, U. S. A.). 110-Phenanthroline spectrophotometric method (λmax, 510 nm)32 is used to measure the concentrations of total iron and ferrous, the concentration of Fe3+ is calculated as the Fe2+ ion concentration subtracted from the total iron concentration. Powder X-ray diffraction patterns were obtained from a diffractometer (XRD, Empyrean, PANalytical B.V., Holland) using Cu-Kα radiation (40 kV and 40 mA) in the 2θ ranges of 5–90°. X-ray photoelectron spectra (XPS, Escalab 250Xi, Thermo Scientific, U. S. A.) was obtained using monochromatic Al-Kα radiation (15 kV, 150 W). The molecular weight and distribution of the raw and processed PVA solution is determined by Gel Permeation Chromatography (GPC) (Waters 1515, Waters Ltd., U. S. A.) with a Waters 1515 isocratic HPLC pump and a Waters 2414 refractive index detector. The PVA solution (0.30 g) is added to a 5 mL sample bottle, and ultrapure water containing 0.1 mol L−1 sodium nitrate is added to the scale line. This mixed solution is ultrasonically dispersed and ready for testing. A water linear column of ULTRAHYDROGEL 120 PKGD, ULTRAHYDROGEL 250 PKGD and ULTRAHYDROGEL 500 PKGD are chosen. The mobile phase is ultrapure water containing 0.1 mol L−1 NaNO3, and the flow rate is 1 mL min−1. The relative molecular weight of Polymer Standards Service-U.S.A. Inc. 430–330![[thin space (1/6-em)]](https://www.rsc.org/images/entities/char_2009.gif) 000 is used to construct a standard curve.
000 is used to construct a standard curve.
2.5 Operating parameters for the APC-EC and DC-EC process
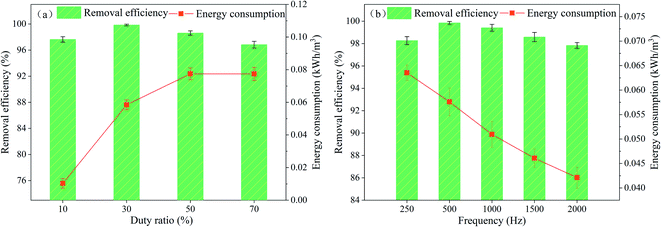
For the APC-EC and DC-EC to remove the PVA solution, the influence of electrode type (Fe/Fe, Al/Al, Fe/Al, and Al/Fe), electrode spacing (0.5–3.0 cm), current density (0.5–3.0 mA cm−2), initial pH (3–11), electrolyte concentration (0.02–0.10 mol L−1), initial PVA concentration (50–200 mg L−1), duty cycle (10–70%) and frequency (250–2000 Hz) on the removal effect of PVA in water was investigated.2.6 Response surface method
Based on the single-factor experiment and the principle of response surface, the central values of pH, current density, and electrode type were determined, which have significant effects on the removal rate of PVA. The PVA removal rate was considered the investigating factor. A test plan was designed with three factors and three levels. The test factors and levels are presented in Table S2.†3 Results and discussion
3.1 Treatment of PVA by EC
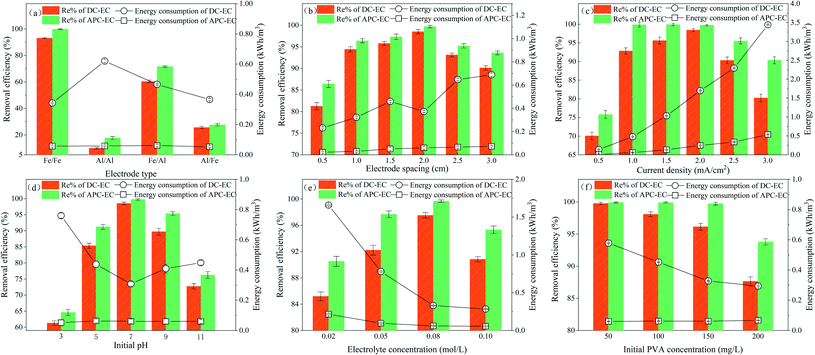 | ||
| Fig. 2 Effect of (a) electrode type; (b) electrode spacing; (c) current density; (d) initial pH; (e) NaCl concentration; and (f) initial PVA concentration on PVA removal and energy consumption. | ||
Fig. 2a shows that the change in electrode type has a greater impact on the removal of PVA by EC. It is well known the iron is superior to aluminium in terms of cost, stability, and magnetism. After 60 min, the removal rates of Fe/Fe, Al/Al, Fe/Al, and Al/Fe electrodes to PVA were 99.85, 17.73, 71.59, and 27.58% under pulsed electrical conditions, respectively. According to the experimental observations (Fig. S1†), the flocs produced by the Fe/Fe electrodes were large in size and fast in sedimentation. However, the flocs produced by the Al/Al electrode were relatively loose, and the produced microbubbles could not effectively float the flocs. This is not conducive to the subsequent solid–liquid separation treatment, and the removal efficiencies of Fe/Al and Fe/Fe PVA were higher than those of Al/Al and Al/Fe, similar to the results of Lu et al.34 This can be attributed to the chemical reaction that occurs between the aluminium anode and the iron anode, eqn (8) and (9), respectively.
| Al(s) → Al(aq)3+ + 3e− | (8) |
| Fe(s) → Fe(aq)2+ + 2e− | (9) |
According to the above equations, the electrochemical equivalent of aluminium and iron can be calculated. The electrochemical molar equivalents of aluminium and iron are 12.43 and 18.59 mmol A h−1, respectively. The electrochemical equivalent of iron is approximately three times that of aluminium.35 Theoretically speaking, more flocs will be produced when passing the iron anode with the same charge.36,37 Besides, some studies have demonstrated that the adsorption of dye molecules by hydrated alumina is much lower than that of hydrated iron oxide.38 In addition, the cost of aluminium electrodes is higher than that of iron electrodes. The energy consumption of Al/Al electrodes (0.059 kW h m−3) was higher than that of Fe/Fe electrodes (0.057 kW h m−3). Hence, from the experiments the Fe/Fe electrodes was selected as the best type of electrodes.
| 2Cl− → Cl2 + 2e− | (10) |
| Cl2 + H2O → HClO + H+ + Cl− | (11) |
| HClO → ClO− + H+ | (12) |
This demonstrates that the removal of PVA occurs quickly because of the ionic conductivity of the solution, which is enhanced with the various concentration of NaCl. The addition of chloride ions facilitate the passage of electric current by increasing the solution conductivity and destroying the passive films of iron electrodes.23,58,59 However, when the concentration of NaCl was higher than 0.10 mol L−1, the removal efficiency of PVA by APC-EC was 99.34%, which was not significantly improved. Therefore, we used 0.08 mol L−1 NaCl as the optimal electrolyte concentration for this experiment.
3.2 Response surface methodology
The single factor tests confirmed EC reaction complex and variable factors. However, single-factor experiments have certain limitations and lack of consideration of the interaction between each factor.67 In this experiment, based on a single-factor experiment, three factors that significantly influenced the PVA removal rate were selected: initial pH, current density, and electrode type. A total of 20 experiments were carried out in this work, and the centre point was repeated six times.| Y = 94.50 + 7.88X1 + 5.63X2 + 4.88X3 + 2.62X1X2 + 3.55X1X3 + 2.60X2X3 − 8.03X12 + 0.23X22 − 59.79X32 | (13) |
As shown in Table S4,† from the analysis of the variance test, P < 0.0001, indicating that the regression model equation is extremely significant and established model meaningful. The lack of fit value was P = 0.8113 > 0.05, which represents no significant difference, indicating that the regression equation fits well with the test, and test error was small. The models Adj R-Squared and Pred R-Squared sum are 0.9907 and 0.9695, respectively, with difference of 0.0212 (<0.2). The R2 value was 0.9951, indicating that the model equation fits well with the experiment results. This model can be used to analyse and predict the removal of PVA solution by APC. The analysis of variance of the regression equation shows that the primary term A of the regression model is the most significant factor of the model, and the primary terms B and C are significant factors. This indicates that the change in the initial pH has an extremely significant impact on the PVA removal rate, while the current density and electrode type significantly affect the PVA removal rate. The quadratic term C2 is the most significant factor in the model, and A2 is a significant factor of the model. The other items have no notable influence on the removal of PVA by EC. The effect of factors on the removal rate can be ordered as follows: pH > current density > electrode type.
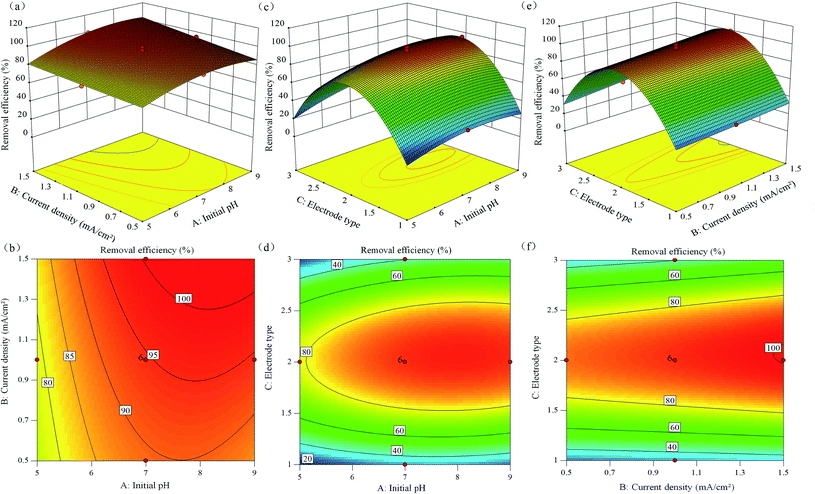 | ||
| Fig. 4 Response surface plot (a, c, e) and contour lines (b, d, f) of the combined effect of initial pH, current density, and electrode type on PVA removal. | ||
Fig. 4a and b shows the effect of current density and initial pH on the PVA removal efficiency. It can be seen from the figure that the slope of the response surface map is relatively flat, and the contour map is similar to an ellipse. It shows that the interaction between pH and current density is weak and not significant at the same time. Notably, when the initial pH was maintained at 6–8, the removal rate of PVA was higher. When the optimal pH was 7, the current density increased from 0.5 to 1.5 mA cm−2, and PVA removal rate increased from 88.54 to 99.89%. It can be seen from the Fig. 4c and d that the initial pH value has a more significant impact on the PVA removal rate than the electrode type. The slope of the response surface plot is steep, and the contour plot is elliptical. It shows that the interaction between electrode type and pH is stronger and more significant. When the initial pH was close to 5.5, the removal rates of Fe/Al, Fe/Fe, and Al/Fe to PVA were 20.03, 76.69, and 25.07%, respectively. This was most likely due to the aluminium anode performing its maximum performance near neutral pH.68,69 When pH = 8.5, the removal rate of PVA by the iron anode was slightly higher than that of aluminium anode. This may be because the optimal pH range of iron ions in EC was 5–9, and an initial pH of 8–9 was good for the complete oxidation of iron ions.70,71 Fig. 4e and f shows the effect of current density and electrode type on PVA removal rate. It can be seen that the response surface along the electrode type direction is steeper than the response surface along the current density direction, and the corresponding contour lines are also denser. It shows that the electrode type value has a more significant impact on the PVA removal rate than the current density, and the interaction between the two is stronger and significant. When the initial pH was constant, the removal efficiency of PVA was improved by increasing the current density. The current density increased from 0.5 to 1.0 mA cm−2, and the removal rates of PVA for the three electrode types Fe/Al, Fe/Fe, and Al/Fe were 30.12, 99.89, and 37.87%, respectively. The current density increased from 1.0 to 1.5 mA cm−2, and the removal rates of Fe/Al, Fe/Fe, and Al/Fe electrodes for PVA were 33.81, 99.49, and 49.12%, respectively. The results showed that for different electrode types, the higher the current density, the higher the removal efficiency of PVA.
According to the fitting model equation and response surface analysis, the optimal conditions for PVA removal by APC-EC were obtained: Fe/Fe electrode type, current density of 1.0 mA cm−2, initial pH of 7. Three sets of parallel experiments were performed using the above optimal reaction conditions to verify the predicted results. The average removal rate was 99.82%, which was close to the predicted value of 99.89% obtained by the fitting equation, indicating that the predicted value and experimental value were a good fit. Therefore, it was verified that the designed model successfully predicted the accuracy and precision of the PVA removal efficiency of the APC-EC method.
3.3 SEM and XRF analysis of flocs
The surface morphology and element content analysis of coagulation are shown in Fig. 5a, b, d, and e, under a magnification of 10k, the flocs were uniform in shape, with diameters of 1 μm and 500 nm.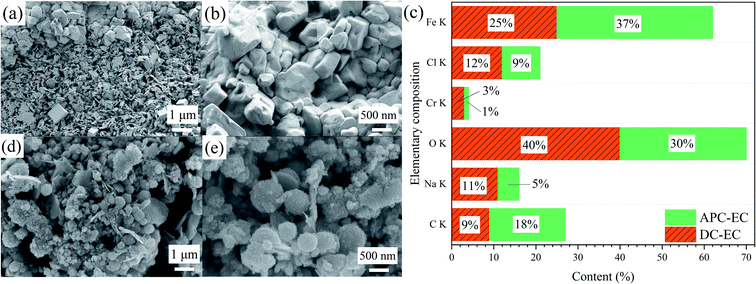 | ||
| Fig. 5 SEM and XRF of the produced flocs by (a, b) the DC-EC and (d, e) APC-EC SEM images and (c) XRF spectra. | ||
As shown in Fig. 5a and b, the massive surface of the DC-EC flocs was irregular cubic particles, without a porous structure and dense overlap. The flocs formed by APC-EC were spherical, had a loose structure, were rich in pores and cracks, and had a larger surface area, which is conducive to the adsorption of PVA (Fig. 5d and e).
XRF was used to determine the component elements and content in the floc as shown in Fig. 5c. The main elements of flocs were Fe, Cr, C, Cl, Na, O. The floc produced by APC-EC had a higher O content than DC-EC flocculation. The presence of Na and Cl indicates that the electrolyte in the solution was NaCl. The presence of Cr may be due to impurities in the iron electrode. The proportion of Fe in the floc was 37% of that in the APC-EC floc, while the DC-EC Fe occupies 25%. This indicates that APC-EC can produce more iron flocs, thereby increasing the removal rate of PVA. APC-EC produces less sludge, thereby reducing electrode consumption and cost.
3.4 FTIR and XRD analysis of flocs
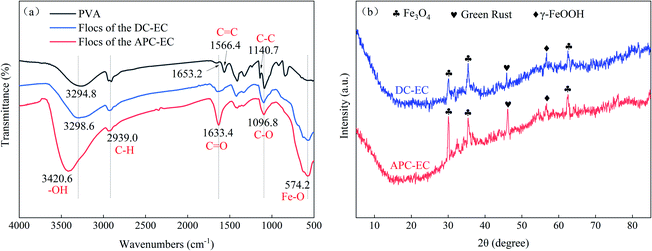
Infrared spectroscopy was used to characterize and analyse the flocs of the two processes, APC-EC and DC-EC to treat PVA. Fig. 6a shows that the characteristic peak of PVA was at 3294.8 cm−1, indicating that there was free –OH connected to the hydrogen bond in the substance. In the DC-EC flocs, the characteristic peak at 3298.6 cm−1 became stronger and wider, indicating that there was still –OH connected to the hydrogen bond in the product. Furthermore, from the infrared spectrum of the degradation product of APC-EC, the characteristic peak at 3420.6 cm−1 indicates that there was a hydrogen bond-OH in the product. The broad peak here may also be the double frequency peak of aldehyde, indicating the presence of aldehydes in the product. The peaks at 1653.2 and 1566.4 cm−1 are indicative of C![[double bond, length as m-dash]](https://www.rsc.org/images/entities/char_e001.gif) C in PVA. Molecules in this structure have a smaller vibrational dipole moment, so the band is weaker. The peak at 1140.7 cm−1 is caused by the crystalline carbon–carbon skeleton (C–C) in the substance. After processing, the characteristic peaks at these two locations almost disappeared. This shows that the carbon–carbon double bond of PVA is broken through the oxidation of oxidising substances. The characteristic peak of C
C in PVA. Molecules in this structure have a smaller vibrational dipole moment, so the band is weaker. The peak at 1140.7 cm−1 is caused by the crystalline carbon–carbon skeleton (C–C) in the substance. After processing, the characteristic peaks at these two locations almost disappeared. This shows that the carbon–carbon double bond of PVA is broken through the oxidation of oxidising substances. The characteristic peak of C![[double bond, length as m-dash]](https://www.rsc.org/images/entities/char_e001.gif) O generally appears in the range of 1650–1900 cm−1. However, if C
O generally appears in the range of 1650–1900 cm−1. However, if C![[double bond, length as m-dash]](https://www.rsc.org/images/entities/char_e001.gif) O is connected to the electron donor base, the stretching vibration frequency will decrease. In addition, the formation of hydrogen bonds will also shift the characteristic peaks of the carbonyl group to the low wavelength range. From the above analysis, it can be seen that the structure corresponding to the characteristic peak at 1633.4 cm−1 is the C
O is connected to the electron donor base, the stretching vibration frequency will decrease. In addition, the formation of hydrogen bonds will also shift the characteristic peaks of the carbonyl group to the low wavelength range. From the above analysis, it can be seen that the structure corresponding to the characteristic peak at 1633.4 cm−1 is the C![[double bond, length as m-dash]](https://www.rsc.org/images/entities/char_e001.gif) O bond, and it can be inferred that both DC-EC and APC-EC flocs have carbonyl compounds. The absorption of infrared light of APC-EC flocs at this wave number was stronger than that of DC-EC. Both flocs had a new peak at 574.2 cm−1, due to the Fe–O vibration of the Fe3O4 mineral.72,73 The peak at 1096.8 cm−1 was caused by the asymmetric stretching of Fe–C–O,73 indicating the formation of chemical bonds between the PVA and iron flocs. The flocs produced by APC-EC had stronger peaks than the flocs produced by DC-EC, demonstrating that APC-EC flocs contained more pure crystal components (magnetite Fe3O4). This is consistent with the results obtained by XRF.
O bond, and it can be inferred that both DC-EC and APC-EC flocs have carbonyl compounds. The absorption of infrared light of APC-EC flocs at this wave number was stronger than that of DC-EC. Both flocs had a new peak at 574.2 cm−1, due to the Fe–O vibration of the Fe3O4 mineral.72,73 The peak at 1096.8 cm−1 was caused by the asymmetric stretching of Fe–C–O,73 indicating the formation of chemical bonds between the PVA and iron flocs. The flocs produced by APC-EC had stronger peaks than the flocs produced by DC-EC, demonstrating that APC-EC flocs contained more pure crystal components (magnetite Fe3O4). This is consistent with the results obtained by XRF.
X-ray diffraction shown in Fig. 6b was employed to identify the structural and investigate the composition variations in the floc obtained using DC-EC and the APC-EC. The weak and dull diffraction peaks of the flocs produced by DC-EC indicate that the sample had low crystallinity. Three main reflections 2θ at 30.069°, 35.417° and 62.503° were indexed to the facets of magnetite Fe3O4 (PDF#89-0950), corresponding to (2 2 0), (3 1 1) and (4 4 0). The characteristic diffraction peak at 2θ = 56.728° corresponds to (2 1 1) planes of lepidocrocite γ-FeOOH (PDF# 76-2301). The conventional broad peak at 2θ = 46.108° was the characteristic diffraction peak of green rust (GR, PDF# 46-0098), corresponding to the (0 1 8) plane. The XRD signal intensity of the floc in the DC-EC case was lower than that of the floc from APC-EC. This difference is probably because the floc from the APC-EC was stronger in adsorbing organic pollutants during settling than that from DC-EC. The iron produced by APC-EC had a higher removal efficiency than the iron flocs produced by DC-EC, reflecting that the iron flocs produced by APC-EC had a strong adsorption capacity.
3.5 XPS analysis of flocs produced by APC-EC
An XPS analysis was performed to further detect the chemical state of the elements on the surface of the floc and the results are shown in Fig. 7.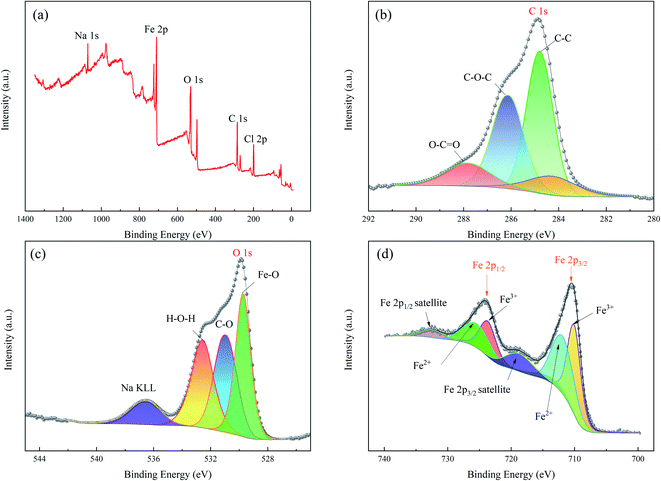 | ||
| Fig. 7 XPS spectrum of the flocs produced by APC-EC: (a) survey; (b) C 1s; (c) O 1 s; and (d) Fe 2p. | ||
Fig. 7a shows five elements in the full spectrum (Na 1s, C 1s, O 1s, Fe 2p, and Cl 2p). The C 1s XPS spectrum in Fig. 7b shows two peaks at 284.8 and 286.3 eV, corresponding to C–C and C–O–C, respectively. The other peaks of O–C![[double bond, length as m-dash]](https://www.rsc.org/images/entities/char_e001.gif) O were located at 287.9 eV, which may correspond to carboxylic acid. It can be seen from Fig. 7c that the XPS spectrum of O 1s can be divided into four peaks, and the Fe–O bond O 1s peak is located at 529.8 eV.74 The peak at 532.6 eV belonged to the C
O were located at 287.9 eV, which may correspond to carboxylic acid. It can be seen from Fig. 7c that the XPS spectrum of O 1s can be divided into four peaks, and the Fe–O bond O 1s peak is located at 529.8 eV.74 The peak at 532.6 eV belonged to the C![[double bond, length as m-dash]](https://www.rsc.org/images/entities/char_e001.gif) O peak of carbonyl compounds. The binding energy of C–O was 531.0 eV. The sodium Auger peak (Na KLL) is sometimes observed 536.2 eV.75 For the floc (Fig. 7d), two asymmetric peaks centred at binding energy of 710.4 and 724.2 eV were attributed to Fe 2p2/3 and Fe 2p1/2, respectively, and the raw Fe 2p spectra were composed of six peaks.76,77 Furthermore, magnetite (Fe3O4), lepidocrocite γ-FeOOH, or hematite (α-Fe2O3)78 are possible species corresponding to the peak of Fe2p3/2 at 710.4 eV. Namely, the peaks at 712.3 and 726.0 eV were assigned to bivalent iron (Fe2+),79 710.2 and 723.9 eV belongs to trivalent iron (Fe3+),80 peaks at 719.4 and 732.6 eV correspond to satellite peaks.81 The above results are consistent with those obtained by FTIR and XRD.
O peak of carbonyl compounds. The binding energy of C–O was 531.0 eV. The sodium Auger peak (Na KLL) is sometimes observed 536.2 eV.75 For the floc (Fig. 7d), two asymmetric peaks centred at binding energy of 710.4 and 724.2 eV were attributed to Fe 2p2/3 and Fe 2p1/2, respectively, and the raw Fe 2p spectra were composed of six peaks.76,77 Furthermore, magnetite (Fe3O4), lepidocrocite γ-FeOOH, or hematite (α-Fe2O3)78 are possible species corresponding to the peak of Fe2p3/2 at 710.4 eV. Namely, the peaks at 712.3 and 726.0 eV were assigned to bivalent iron (Fe2+),79 710.2 and 723.9 eV belongs to trivalent iron (Fe3+),80 peaks at 719.4 and 732.6 eV correspond to satellite peaks.81 The above results are consistent with those obtained by FTIR and XRD.
3.6 Mechanism of EC process in removing PVA
In order to test the contribution of free radicals to the system, experiments are performed with the addition of benzoic acid and i-PrOH.82,83 ˙OH can be quenched by both benzoic acid and i-PrOH, while ˙Cl can be quenched only by benzoic acid. But it is worth noting that benzoic acid is weakly acidic in the solution, which will affect the formation of iron hydroxide flocs in the EC system. The result is shown in Fig. 8a.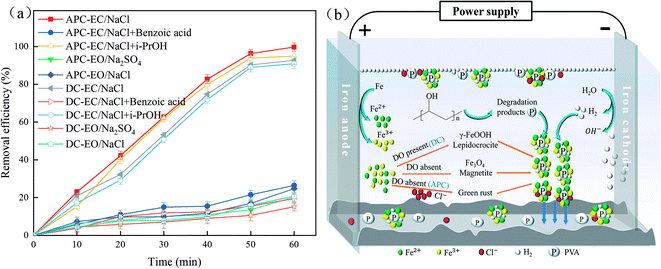 | ||
| Fig. 8 (a) Removal efficiency of PVA in different systems; (b) mechanism of the APC-EC process in removing PVA. | ||
As shown in Fig. 8a, the addition of isopropanol had basically no effect on the degradation of PVA. However, it should be noticed that this does not mean that there are almost no ˙OH radicals in the EC system. From the reaction in the first 10 min, it can be inferred that the hydroxyl radicals contribute to the reaction system. After adding excess benzoic acid, no flocs were produced in the solution. The degradation rates of APC-EC and DC-EC to PVA were 26.46% and 19.45%, respectively. Therefore, the contribution rates of free radicals and flocs to the removal of PVA by the two systems in this process were 73.27% and 73.35%, respectively. In the alternating pulse current electrochemical oxidation system (APC-EO/Na2SO4), using DSA as the anode as the cathode and 0.08 mol L−1 Na2SO4 as the electrolyte, verifying the cathode–anode degradation ratio of PVA, the result is 20.25%. Compared with APC-EO/Na2SO4, the removal rate of APC-EO/NaCl on PVA is 28.76%. Therefore, the degradation effect of ˙Cl in the APC-EC system on PVA is estimated to be 8.51%. However, the degradation effect of ˙Cl in the DC-EC system on PVA is 5.53%. This indicates that the EC reaction is mainly based on flocculation, followed by the oxidation of free radicals, as confirmed by the previous studies.84
The floc composition of Fe-EC is complicated when dissolved DO and Cl− are present.85 When DO is lacking, the mixed-valence iron phase transforms into GR, which is the general term for various green crystalline compounds.86 It can be seen from Fig. 8b that DC-EC has a longer ton time than that of APC-EC and can generate more oxygen. In the presence of oxygen, the mixed-valence iron phase is transformed into lepidocrocite (γ-FeOOH). Magnetite (Fe3O4) was produced due to the absence of DO, while GR was produced in the absence of DO and presence of Cl−. The previous studies also obtained similar results.87 From the results of XRF and XRD, it can be seen that the oxygen content in DC-EC flocs was higher than that in the APC-EC flocs. Thus, APC-EC produced less FeOOH and more Fe3O4 than DC-EC.
In the degradation products of PVA in the APC-EC and DC-EC processes, the active radicals attack a hydroxyl group attached to the carbon atom, leading to random chain scission. Electron rearrangement and hydrogen transfer lead to the formation of carbonyl compounds (likely carboxylic acid and aldehydes), as shown in previous studies.12,56,88 After applying a current, the iron anode loses electrons. Metal cations Fe2+ and Fe3+ are formed, which combine with the OH− in the solution to form lepidocrocite (γ-FeOOH), magnetite (Fe3O4), GR and highly active polymerized hydroxide iron complex. It has very strong adsorption capacity, and its flocculation effect is better than DC-EC. According to these evidences, it has been revealed that adsorption and co-precipitation with hydroxide iron complex are the main way to remove PVA from wastewater in the APC-EC process.
3.7 The molecular weight and iron ion concentration analysis of solution after APC-EC
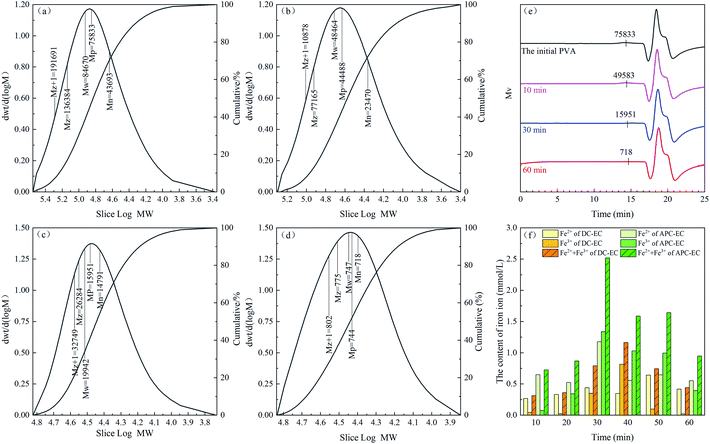
To further demonstrate the effect of APC-EC degradation of PVA, gel permeation chromatography (GPC) was used to qualitatively evaluate the molecular weight reduction and distribution of PVA. Fig. 9a–d illustrate the initial, 10, 30, and 60 min molecular weights and distributions of PVA, respectively, analysed by GPC. The number average molecular weight decreased from 43![[thin space (1/6-em)]](https://www.rsc.org/images/entities/char_2009.gif) 693 to 14
693 to 14![[thin space (1/6-em)]](https://www.rsc.org/images/entities/char_2009.gif) 791, and the weight average molecular weight considerably decreased from 84
791, and the weight average molecular weight considerably decreased from 84![[thin space (1/6-em)]](https://www.rsc.org/images/entities/char_2009.gif) 670 to 19
670 to 19![[thin space (1/6-em)]](https://www.rsc.org/images/entities/char_2009.gif) 942 for 30 min. It can also be seen from Fig. 9d that the relative molecular weight of GPC of the solution is significantly reduced after a reaction time of 30 min. The weight average molecular and relative molecular weights decreased to 718 and 747, respectively (Table S5†). This indicates that PVA with a higher molecular weight is degraded into substances with lower molecular weight through EC. In addition, the chromatograms shifted toward higher retention times, as shown in Fig. 9e. In GPC chromatogram, samples with lower molecular weights had higher retention times.89,90 Therefore, the results confirmed that the molecular weight of PVA decreased as the electrolysis time increased.
942 for 30 min. It can also be seen from Fig. 9d that the relative molecular weight of GPC of the solution is significantly reduced after a reaction time of 30 min. The weight average molecular and relative molecular weights decreased to 718 and 747, respectively (Table S5†). This indicates that PVA with a higher molecular weight is degraded into substances with lower molecular weight through EC. In addition, the chromatograms shifted toward higher retention times, as shown in Fig. 9e. In GPC chromatogram, samples with lower molecular weights had higher retention times.89,90 Therefore, the results confirmed that the molecular weight of PVA decreased as the electrolysis time increased.
In addition, the changing trends of the total concentrations of iron and Fe2+ are extremely important for EC, and their concentration after removing PVA with DC or APC supply were investigated. As shown in Fig. 9f, 0–30 min, Fe2+ is continuously oxidized to Fe3+, which produces flocs and performs flocculation. For a reaction time of 30 min, the ferric iron in the APC-EC accumulated to the maximum, while the DC-EC takes 40 min. The Fe3+ ions formed a large number of flocs. At this time, the content of Fe3+ ions in the solution dropped sharply until 40 min. Subsequently, the Fe2+ ions generated by the anode were oxidized due to the continuous reaction, and Fe3+ was continuously generated, so that the PVA in the solution was adsorbed by the flocs. The iron ion concentration in APC-EC were much higher than that in DC-EC. It may be due to the uniform dissolution of anode and cathode during EC in the case of APC.70 This further demonstrates that more Fe is produced in the APC-EC system, which agrees well with previous results.
3.8 Comparison of the performance of DC-EC and APC-EC
In order to understand the superiority of APC-EC more intuitively, the performance of the two kinds of EC methods were compared and analyzed. Under the same operating conditions, the removal rate of PVA by DC-EC and APC-EC were 92.8 and 99.7%, respectively. For the same removal efficiency, the theoretical electrode consumption of DC-EC and APC-EC were 0.237 and 0.174 kg m−3, with corresponding energy consumption of 0.480 and 0.049 kW h m−3, respectively, as shown in Fig. 10a. Under equal conditions, the material consumption of APC-EC was about reduced by approximately 26.6% compared with that of DC-EC. The energy consumption of APC-EC was about reduced by approximately 89.8% compared with that of DC-EC. The energy consumption of APC-EC and the electrode consumption were both smaller than those of the DC-EC. This may be due to the periodic commutation voltage applied during the APC-EC process. The obtained average amounts of electrode consumption for DC-EC and APC-EC were 0.190 and 0.105 g, respectively. The current efficiency can be used as an index to reflect the extent of passivation.23 The results showed that current efficiencies of 62.37% and 99.05% were achieved at a pH of 7.0 using DC and APC, respectively. The application of APC caused continuous changes in polarity to avoid or reduce the formation of passivation layers and increase the operational life of the sacrificial anodes.23 Furthermore, the flocs produced by APC-EC had a higher removal rate than those produced by DC-EC, indicating that the iron floc produced by APC-EC has a strong adsorption capacity. The flocs produced by the DC and APC for 1 h were 0.1193 and 0.0674 g, respectively. The flocs produced by the DC-EC and APC-EC for 2 h weighed 0.2123 and 0.1441 g. Less sludge is produced by APC-EC, which reduces the electrode consumption and cost (Fig. S2†). Compared with DC-EC, APC-EC has a higher removal and current efficiency, lower electrode consumption, and lower power consumption when treating PVA wastewater to achieve energy savings. Furthermore, there are some systems to remove PVA reported in recent years (Table S6†), and it is found that APC-EC is an efficient and low-cost method to remove PVA. | ||
| Fig. 10 Comparison of the (a) performance, (b) electrode corrosion, and (c) electrode stability of DC-EC and APC-EC. | ||
3.9 Electrode stability test
The service life and stability of the electrode affect the EC process to a certain extent. Fifty cycles of experiments were conducted to explore the stability and service life of the electrode. The removal efficiency and actual electrode loss under different power supply methods are compared in Fig. 10.As shown in Fig. 10b, the initial iron electrode was 10 mm wide, but after 50 cycles, the iron electrode under DC conditions was reduced by 4 mm. At the same time, the electrode under the APC condition was reduced by 1 mm. And the actual electrode loss of DC-EC is 10 g, while the electrode mass loss of APC-EC is only 4.8 g. The surface of the iron electrode was noticeably rougher after the APC-EC reaction, and the corrosion is more uniform. Conversely, in DC-EC, the iron electrode has limited corrosion parts, which clearly shows the phenomenon of uneven dissolution. Therefore, the pulse current can effectively eliminate anode passivation, which is beneficial for improving the current efficiency.91,92 As shown in Fig. 10c, the removal rate of DC-EC dropped by nearly 15.6% with an increase in the number of cycles. The removal rate of PVA by APC-EC was 5% lower than the initial removal rate. The actual electrode loss in the APC mode was less than that in the DC mode. Other research groups have reported similar results.28,93 This is due to the directed current in DC mode, which forms a non-uniform layer on electrodes due to oxidation. However, in the APC mode, the returning current causes a more uniform surface of electrodes, which enhances their lifetime.46 The utilization of iron electrodes was enhanced by the periodic polarity change of driving electrodes. Thus, the advantages of low electrode consumption include extended electrode life, improved stability, reduced sludge production and lower operating costs (Table S7†).
3.10 Removal of PVA in real wastewater
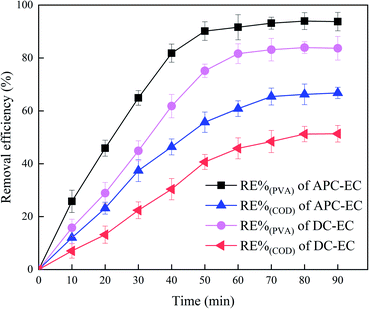
In order to evaluate PVA removal efficiency of the APC-EC system with real wastewater, experiments with wastewater from the effluent of the local chemical plant workshop with PVA contamination were carried out. PVA initial concentration in real wastewater was 117–253 mg L−1, COD of 300–483.89 mg L−1, initial pH 6.5–8.5 and a conductivity of 1746 μS cm−1. Experiments with real wastewater were performed with the same experimental procedure and at optimal operating conditions.It is a final goal that uses the APC-EC in real wastewater treatment. Therefore, experiments are conducted under the real surface water matrix. As shown in Fig. 11, the removal rate of PVA and COD by APC-EC was 93.74% and 66.78% after 90 min under the best experimental conditions. The removal rates of PVA and COD by DC-EC were 83.67 and 51.36%, respectively. An important reason is the complicated components contained in real water sample, which included natural organic matter and inorganic anions. The presence of different anions has different effects on the destabilization properties of metal ions.94 The APC-EC system under the real wastewater is still superior to the DC-EC system. In brief, the APC-EC system exhibited outstanding removal performances in both test samples.
4 Conclusions
The APC-EC process has been proposed for treating PVA wastewater. The effects of several factors on EC performance were systematically studied. Under the same removal efficiency, the material consumption of APC-EC is reduced by approximately 26.6% that of DC-EC, and the energy consumption of APC-EC is reduced by approximately 89.8% as compared with that of DC-EC. Meanwhile, the amount of sludge is reduced by about 32.1%, and the electrode efficiency is about 1.6 times higher than that of DC-EC. The optimal operating conditions optimized by RSM were determined to be Fe/Fe electrode type, current density of 1.0 mA cm−2, initial pH of 7, electrode distance of 2.0 cm, a supporting electrolyte of 0.08 mol L−1 NaCl, initial PVA concentration of 150 mg L−1, duty cycle of 30%, frequency of 500 Hz. Meanwhile, the model demonstrated APC-EC treated PVA optimised by the response surface method is feasible and effective. From the result of characterization, it is confirmed that adsorption and co-precipitation with hydroxide iron complex are the main way for removing PVA from wastewater in the APC-EC process. Therefore, APC-EC has significant development potential for practical wastewater treatment owing to its high efficiency, low cost and good electrode stability.Authors contribution
J. P. Zhang: Conceptualization, methodology, software, data curation, writing-original draft preparation; T. T. Gu, C. X. Ma, and J. K, Wang: visualization, investigation; J. F. Li: supervision, involved in conceptualization, methodology, software and English revising; L. J. Yi: involved in software and validation.Conflicts of interest
The authors declare that they have no conflict of interest.Acknowledgements
Financial support from the National Natural Science Foundation of China (22109106, 42107414) and the Key Production Innovative Development Plan of the Southern Bingtuan (2019DB007, 2020AB024) are gratefully acknowledged.References
- J. Veres, S. Ogier, G. Lloyd and D. de Leeuw, Chem. Mater., 2004, 16, 4543–4555 CrossRef CAS.
- Y. Tokiwa, G. Kawabata and A. Jarerat, Biotechnol. Lett., 2001, 23, 1937–1941 CrossRef CAS.
- J. A. Giroto, R. Guardani, A. C. S. C. Teixeira and C. A. O. Nascimento, Chem. Eng. Process., 2006, 45, 523–532 CrossRef CAS.
- Y. Mori, T. Honda, R. Lu, N. Hayakawa and T. Miyakoshi, Polym. Degrad. Stab., 2015, 114, 30–36 CrossRef CAS.
- D. Hamad, M. Mehrvar and R. Dhib, Polym. Degrad. Stab., 2014, 103, 75–82 CrossRef CAS.
- H. F. Wu, L. Z. Yue, S. L. Jiang, Y. Q. Lu, Y. X. Wu and Z. Y. Wan, Water Sci. Technol., 2019, 79, 2005–2012 CrossRef CAS PubMed.
- S. K. Behera, J. H. Kim, X. J. Guo and H. S. Park, J. Hazard. Mater., 2008, 153, 1207–1214 CrossRef CAS PubMed.
- A. Gronroos, P. Pirkonen, J. Heikkinen, J. Ihalainen, H. Mursunen and H. Sekki, Ultrason. Sonochem., 2001, 8, 259–264 CrossRef CAS PubMed.
- Y. Pan, Y. Liu, D. Wu, C. Shen, C. Ma, F. Li, Y. Zhang and H. Ma, J. Hazard. Mater., 2020, 389, 121866 CrossRef CAS PubMed.
- S. J. Zhang and H. Q. Yu, Water Res., 2004, 38, 309–316 CrossRef CAS PubMed.
- L. J. Hsu, L. T. Lee and C. C. Lin, Chem. Eng. J., 2011, 173, 698–705 CrossRef CAS.
- B. Ye, Y. Li, Z. Chen, Q.-Y. Wu, W.-L. Wang, T. Wang and H.-Y. Hu, Water Res., 2017, 124, 381–387 CrossRef CAS PubMed.
- H. Marusincova, L. Husarova, J. Ruzicka, M. Ingr, V. Navratil, L. Bunkova and M. Koutny, Int. Biodeterior. Biodegrad., 2013, 84, 21–28 CrossRef CAS.
- R. Solaro, A. Corti and E. Chiellini, Polym. Adv. Technol., 2000, 11, 873–878 CrossRef CAS.
- T. Ochiai and A. Fujishima, J. Photochem. Photobiol., C, 2012, 13, 247–262 CrossRef CAS.
- M. Kobya, F. Ulu, U. Gebologlu, E. Demirbas and M. S. Oncel, Sep. Purif. Technol., 2011, 77, 283–293 CrossRef CAS.
- H. Moreno, J. R. Parga, A. J. Gomes and M. Rodriguez, Desalin. Water Treat., 2013, 51, 2710–2717 CrossRef CAS.
- F. Chen, X. X. Li, Z. B. Luo, J. Ma, Q. L. Zhu and S. L. Zhang, Sep. Sci. Technol., 2018, 53, 2639–2646 CrossRef CAS.
- M. Ji, X. G. Jiang and F. Wang, Desalin. Water Treat., 2015, 55, 2044–2052 CrossRef CAS.
- A. G. Khorram and N. Fallah, J. Environ. Chem. Eng., 2018, 6, 635–642 CrossRef CAS.
- Y. Yavuz and U. B. Ogutveren, J. Environ. Manage., 2018, 207, 151–158 CrossRef CAS PubMed.
- L. Xu, Q. Huang, X. Xu, G. Cao, C. He, Y. Wang and M. Yang, Sep. Purif. Technol., 2017, 188, 316–328 CrossRef CAS.
- Z. H. Yang, H. Y. Xu, G. M. Zeng, Y. L. Luo, X. Yang, J. Huang, L. K. Wang and P. P. Song, Electrochim. Acta, 2015, 153, 149–158 CrossRef CAS.
- J. E. C. A. Martins, E. F. Abdala Neto, A. C. Alves de Lima, J. P. Ribeiro, F. E. Feitosa Maia and R. F. do Nascimento, Eng. Sanit. Ambiental, 2017, 22, 1055–1064 CrossRef.
- M. Eyvaz, Int. J. Electrochem. Sci., 2016, 11, 4988–5008 CrossRef CAS.
- Y. Chen, B. Zhou, L. Li, Y. Song, J. Li, Y. Liu and W. Cai, in Fundamental of Chemical Engineering, Pts 1–3, ed Z. Cao, L. Sun, X. Q. Cao and Y. H. He, 2011, vol. 233–235, pp. 444–451 Search PubMed.
- E. Keshmirizadeh, S. Yousefi and M. K. Rofouei, J. Hazard. Mater., 2011, 190, 119–124 CrossRef CAS PubMed.
- R. Zhou, F. Liu, N. Wei, C. Yang, J. Yang, Y. Wu, Y. Li, K. Xu, X. Chen and C. Zhang, J. Water Process Eng., 2020, 37, 101387 CrossRef.
- J. T. Oliveira, M. C. d. Sousa, I. A. Martins, L. M. G. d. Sena, T. R. Nogueira, C. B. Vidal, E. F. A. Neto, F. B. Romero, O. S. Campos and R. F. d. Nascimento, Electrochim. Acta, 2021, 388, 138499 CrossRef CAS.
- A. G. de Oliveira, J. P. Ribeiro, E. F. A. Neto, A. C. A. de Lima, A. A. Amazonas, L. T. V. da Silva and R. F. do Nascimento, Water Sci. Technol., 2020, 82, 56–66 CAS.
- S. K. Cui, Z. G. Wang, X. N. Qiang and Y. N. Guo, J. Xi’an Polytech. Univ., 2014, 28, 68–71 Search PubMed.
- L. Zhang, J. Cheng, X. You, X. Liang and Y. Hu, Environ. Sci. Pollut. Res., 2016, 23, 13531–13542 CrossRef CAS PubMed.
- L. S. Thakur and P. Mondar, J. Environ. Manage., 2017, 190, 102–112 CrossRef CAS PubMed.
- J. Lu, Z.-R. Wang, Y.-L. Liu and Q. Tang, Process Saf. Environ. Prot., 2016, 104, 436–443 CrossRef CAS.
- W. L. Chou, C. T. Wang and K. Y. Huang, J. Hazard. Mater., 2009, 167, 467–474 CrossRef CAS PubMed.
- E. Gatsios, J. N. Hahladakis and E. Gidarakos, J. Environ. Manage., 2015, 154, 117–127 CrossRef CAS PubMed.
- F. Ozyonar, Int. J. Electrochem. Sci., 2016, 11, 1456–1471 CAS.
- P. R. Kumar, S. Chaudhari, K. C. Khilar and S. P. Mahajan, Chemosphere, 2004, 55, 1245–1252 CrossRef PubMed.
- P. Aswathy, R. Gandhimathi, S. T. Ramesh and P. V. Nidheesh, Sep. Purif. Technol., 2016, 159, 108–115 CrossRef CAS.
- E. Bocos, E. Brillas, M. Angeles Sanroman and I. Sires, Environ. Sci. Technol., 2016, 50, 7679–7686 CrossRef CAS PubMed.
- X. M. Chen, G. H. Chen and P. L. Yue, Sep. Purif. Technol., 2000, 19, 65–76 CrossRef CAS.
- A. E. Yilmaz, R. Boncukcuoglu, M. M. Kocakerim, M. T. Yilmaz and C. Paluluoglu, J. Hazard. Mater., 2008, 153, 146–151 CrossRef CAS PubMed.
- J. Nepo Hakizimana, B. Gourich, M. Chafi, Y. Stiriba, C. Vial, P. Drogui and J. Naja, Desalination, 2017, 404, 1–21 CrossRef.
- I. Heidmann and W. Calmano, J. Hazard. Mater., 2008, 152, 934–941 CrossRef CAS PubMed.
- J. R. Parga, D. L. Cocke, J. L. Valenzuela, J. A. Gomes, M. Kesmez, G. Irwin, H. Moreno and M. Weir, J. Hazard. Mater., 2005, 124, 247–254 CrossRef CAS PubMed.
- M. Payami Shabestar, M. R. Alavi Moghaddam and E. Karamati-Niaragh, Environ. Sci. Pollut. Res., 2021, 28, 67214–67223 CrossRef CAS PubMed.
- S. Amrose, A. Gadgil, V. Srinivasan, K. Kowolik, M. Muller, J. Huang and R. Kostecki, J. Environ. Sci. Health, Part A: Toxic/Hazard. Subst. Environ. Eng., 2013, 48, 1019–1030 CrossRef CAS PubMed.
- A. Y. Goren and M. Kobya, Chemosphere, 2021, 263, 128253 CrossRef CAS PubMed.
- M. K. Kim, T. Kim, T. K. Kim, S. W. Joo and K. D. Zoh, Sep. Purif. Technol., 2020, 247, 116911 CrossRef CAS.
- M. Asselin, P. Drogui, H. Benmoussa and J.-F. Blais, Chemosphere, 2008, 72, 1727–1733 CrossRef CAS PubMed.
- A. K. Golder, A. N. Samanta and S. Ray, J. Hazard. Mater., 2007, 141, 653–661 CrossRef CAS PubMed.
- M. Kobya, M. Bayramoglu and M. Eyvaz, J. Hazard. Mater., 2007, 148, 311–318 CrossRef CAS PubMed.
- M. Kobya, O. T. Can and M. Bayramoglu, J. Hazard. Mater., 2003, 100, 163–178 CrossRef CAS PubMed.
- T. Xu, X. Lei, B. Sun, G. Yu and Y. Zeng, Environ. Sci. Pollut. Res., 2017, 24, 20577–20586 CrossRef CAS PubMed.
- O. Sahu, B. Mazumdar and P. K. Chaudhari, Environ. Sci. Pollut. Res., 2014, 21, 2397–2413 CrossRef CAS PubMed.
- Z. Wang, X. Teng, M. Xie, X. Cheng and J. Li, Chin. Chem. Lett., 2020, 31, 2864–2870 CrossRef CAS.
- K. M. Emran and A. K. Al-Harbi, J. Alloys Compd., 2018, 767, 753–762 CrossRef CAS.
- A. de Mello Ferreira, M. Marchesiello and P. X. Thivel, Sep. Purif. Technol., 2013, 107, 109–117 CrossRef CAS.
- E. S. Z. El-Ashtoukhy, N. K. Amin, M. M. A. El-Latif, D. G. Bassyouni and H. A. Hamad, J. Cleaner Prod., 2017, 167, 432–446 CrossRef CAS.
- D. Das and B. K. Nandi, J. Dispersion Sci. Technol., 2021, 42, 328–337 CrossRef CAS.
- L. Zhou, D. Liu, S. Li, X. Yin, C. Zhang, X. Li, C. Zhang, W. Zhang, X. Cao, J. Wang and Z. L. Wang, Nano Energy, 2019, 64, 103915 CrossRef CAS.
- P. Asaithambi, R. Govindarajan, M. B. Yesuf, P. Selvakumar and E. Alemayehu, J. Environ. Chem. Eng., 2021, 9, 104811 CrossRef CAS.
- J. Shu, R. Liu, Z. Liu, J. Du and C. Tao, Sep. Purif. Technol., 2016, 168, 107–113 CrossRef CAS.
- D. T. Chin, J. Electrochem. Soc., 1983, 130, 1657–1667 CrossRef CAS.
- O. Chene and D. Landolt, J. Appl. Electrochem., 1989, 19, 188–194 CrossRef CAS.
- N. Tantavichet and M. D. Pritzker, J. Electrochem. Soc., 2002, 149, C289–C299 CrossRef CAS.
- A. Hassani, P. Eghbali and O. Metin, Environ. Sci. Pollut. Res., 2018, 25, 32140–32155 CrossRef CAS PubMed.
- R. Katal and H. Pahlavanzadeh, Desalination, 2011, 265, 199–205 CrossRef CAS.
- E. Terrazas, A. Vazquez, R. Briones, I. Lazaro and I. Rodriguez, J. Hazard. Mater., 2010, 181, 809–816 CrossRef CAS PubMed.
- S. Vasudevan, J. Lakshmi and G. Sozhan, J. Hazard. Mater., 2011, 192, 26–34 CAS.
- M. Malakootian, H. J. Mansoorian and M. Moosazadeh, Desalination, 2010, 255, 67–71 CrossRef CAS.
- R. Balasubramaniam and A. V. R. Kumar, Corros. Sci., 2000, 42, 2085–2101 CrossRef CAS.
- J. S. Zhou, H. H. Song, L. L. Ma and X. H. Chen, RSC Adv., 2011, 1, 782–791 RSC.
- J. K. Du, J. G. Bao, X. Y. Fu, C. H. Lu and S. H. Kim, Appl. Catal., B, 2016, 184, 132–141 CrossRef CAS.
- H. Sun, G. Z. Zhu, X. T. Xu, M. Liao, Y. Y. Li, M. Angell, M. Gu, Y. M. Zhu, W. H. Hung, J. C. Li, Y. Kuang, Y. T. Meng, M. C. Lin, H. S. Peng and H. J. Dai, Nat. Commun., 2019, 10, 3302 CrossRef PubMed.
- C. Ma, P. F. Yuan, S. Y. Jia, Y. Q. Liu, X. J. Zhang, S. Hou, H. X. Zhang and Z. G. He, Waste Manage., 2019, 83, 23–32 CrossRef CAS PubMed.
- L. M. Hu, P. Wang, G. S. Liu, Q. Z. Zheng and G. S. Zhang, Chemosphere, 2020, 240, 124977 CrossRef CAS PubMed.
- J. N. Fiedor, W. D. Bostick, R. J. Jarabek and J. Farrell, Environ. Sci. Technol., 1998, 32, 1466–1473 CrossRef CAS.
- J. Wang, Z. F. Cao, H. S. Ren, C. Yu, S. Wang, L. Q. Li and H. Zhong, Appl. Surf. Sci., 2020, 500, 144045 CrossRef CAS.
- H. Chen and J. L. Wang, Chemosphere, 2019, 234, 14–24 CrossRef CAS PubMed.
- Y. Zhao, J. J. Wang, C. L. Ma, L. J. Cao and Z. P. Shao, Chem. Eng. J., 2019, 370, 536–546 CrossRef CAS.
- M. J. Watts and K. G. Linden, Water Res., 2007, 41, 2871–2878 CrossRef CAS PubMed.
- H. Zhao, Y. Wang, Y. Wang, T. Cao and G. Zhao, Appl. Catal., B, 2012, 125, 120–127 CrossRef CAS.
- A. Thiam, M. H. Zhou, E. Brillas and I. Sires, Appl. Catal., B, 2014, 150, 116–125 CrossRef.
- K. L. Dubrawski, C. M. van Genuchten, C. Delaire, S. E. Amrose, A. J. Gadgil and M. Mohseni, Environ. Sci. Technol., 2015, 49, 2171–2179 CrossRef CAS PubMed.
- R. A. Maithreepala and R. A. Doong, Environ. Sci. Technol., 2005, 39, 4082–4090 CrossRef CAS PubMed.
- J. Yang, F. Liu, Y. Bu, N. Wei, S. Liu, J. Chang, X. Chen, W. Zhang, R. Zhou and C. Zhang, Environ. Technol. Innovation, 2020, 20, 101123 CrossRef CAS.
- S. Y. Oh, H. W. Kim, J. M. Park, H. S. Park and C. Yoon, J. Hazard. Mater., 2009, 168, 346–351 CrossRef CAS PubMed.
- S. C. Hsu, T. M. Don and W. Y. Chiu, Polym. Degrad. Stab., 2002, 75, 73–83 CrossRef CAS.
- Q. Cai, Z. Gu, Y. Chen, W. Han, T. Fu, H. Song and F. Li, Carbohydr. Polym., 2010, 79, 783–785 CrossRef CAS.
- M. Eyvaz, M. Kirlaroglu, T. S. Aktas and E. Yuksel, Chem. Eng. J., 2009, 153, 16–22 CrossRef CAS.
- M. Ren, Y. Song, S. Xiao, P. Zeng and J. Peng, Chem. Eng. J., 2011, 169, 84–90 CrossRef CAS.
- E. Karamati-Niaragh, M. R. A. Moghaddam, M. M. Emamjomeh and E. Nazlabadi, J. Environ. Manage., 2019, 230, 245–254 CrossRef CAS PubMed.
- D. T. Moussa, M. H. El-Naas, M. Nasser and M. J. Al-Marri, J. Environ. Manage., 2017, 186, 24–41 CrossRef PubMed.
Footnote |
| † Electronic supplementary information (ESI) available. See DOI: 10.1039/d1ra08093h |
| This journal is © The Royal Society of Chemistry 2021 |

