 Open Access Article
Selective degradation of acetaminophen from hydrolyzed urine by peroxymonosulfate alone: performances and mechanisms†
Yiting Lina,
Xiting Moa,
Yamin Zhanga,
Minghua Nie *ab,
Caixia Yan*a and
Leliang Wua
aSchool of Geography and Environment, Key Laboratory of Poyang Lake Wetland and Watershed Research, Ministry of Education, Jiangxi Normal University, Nanchang 330022, China. E-mail: mhnie@jxnu.edu.cn; yancaixia@jxnu.edu.cn
bKey Laboratory of Eco-geochemistry, Ministry of Natural Resource, Beijing 100037, China
First published on 16th December 2021
Abstract
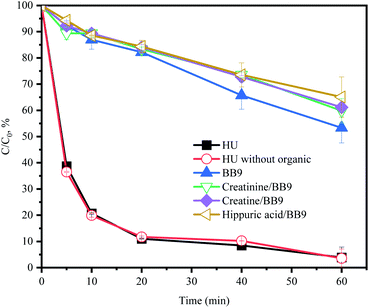
Owing to the high concentration of pharmaceuticals in urine, the degradation of these organic pollutants before their environmental release is highly desired. Peroxymonosulfate (PMS) is a desirable oxidant that can be applied to environmental remediation; however, the performance and mechanism of PMS for the degradation of pharmaceuticals in the urine matrix have not been investigated. Herein, PMS was first discovered to efficiently degrade typical pharmaceuticals in hydrolyzed urine (HU) by selecting acetaminophen (ACE) as a target compound. Quenching experiments revealed that singlet oxygen (1O2) and hydroxyl radicals (HO˙) were observed in the HU/PMS system, but the principal reactive species (RS) responsible for ACE removal was 1O2. The major constituents of HU, including SO42− and organics (creatine, creatinine and hippuric acid), hardly affected the elimination of ACE, whereas Cl−, H2PO4− and NH4+ would accelerate ACE degradation. Besides, HCO3− slightly inhibited this process. The ACE degradation efficiency was enhanced using photo-irradiation, including sunlight and visible light, although increasing the reaction temperature could, interestingly, hardly accelerate the degradation rate of ACE. Three-dimensional excitation–emission matrices (3D-EEMs) have indicated that other intermediates that have a higher fluorescence intensity might be generated in the HU/PMS system. Finally, nine intermediate products were determined and the degradation pathways of ACE were proposed. Overall, the results of this study illustrated that PMS is an efficient oxidant for the degradation of ACE in HU.
1 Introduction
A large proportion (64 ± 27%) of pharmaceuticals taken by humans is not completely metabolized and is consequently excreted via urine and usually washed into sewage systems.1 Precisely because human urine often contains high concentrations of pharmaceuticals, it is the major contributor of pharmaceuticals in wastewater, although it only accounts for 1% of the total volumetric flow.2 However, currently designed wastewater treatment plants (WWTPs) cannot treat pharmaceuticals well. In China, only 14.3% of pharmaceuticals were removed by more than 70%, while 51.4% had a removal percentage of less than 30%.3 In view of the harm caused by pharmaceuticals to humans and aquatic ecosystems, it is necessary to remove these compounds in urine. For example, acetaminophen (ACE) is one of the most frequently used analgesic and anti-inflammatory drugs to treat pain and headache, and is consumed at a rate of 1.45 × 10⁵ ton per year.4 58–68% of ACE is excreted by humans via urine with a concentration ranging from 3 μg L−1 to 1700 μg L−1.5 Various experiments have demonstrated that for fish, liver damage, abnormal embryonic development and death can result from exposure to ACE.6 Thus, new technologies must be developed with the objective of degrading ACE from urine.Hydroxyl radical (HO˙)- or sulfate radical (SO4˙−)-based advanced oxidation processes (AOPs) have attracted much attention owing to their high oxidizing power (E0 (HO˙/H2O) = 1.9–2.7 V and E0 (SO4˙−/SO42−) = 2.5–3.1 V).7,8 Additionally, these reactive species (RS) can be produced through a number of activation strategies that include UV irradiation,9 heat10 and transition metals.11 However, some activation methods require additional energy (e.g. UV irradiation and heat) or leach excessive metals into the environment, causing pollution, which restrains the further application of these techniques. Among these HO˙- and SO4˙−-based AOPs, UV/H2O2 and UV/peroxydisulfate (PDS) have been successfully applied for the elimination of pharmaceuticals from urine.1 However, large amounts of inorganic substances in urine may scavenge the HO˙ and SO4˙−, preventing pollutant degradation.2,12 Therefore, a highly promising approach would be to develop an AOP that would resist the urine matrix effects.
It has been reported that singlet oxygen (1O2), which has a high selectivity toward target pollutants, could be generated by the alkaline activation of PMS.13 It has been suggested that 1O2 might avoid the scavenger effects of high concentrations of coexisting components in urine.14,15 Interestingly, fresh urine (FU) would be transformed into hydrolyzed urine (HU) through a bacterial process, and the urea and citrate in the FU would be replaced by NH4+ and HCO3− in HU, resulting in an alkaline condition of HU (pH 9).2 Considering the buffer actions of HCO3− and H2PO4−, the solution pH would not change during the reaction. Consequently, we could speculate that an alkaline condition of HU is suitable for PMS oxidate ACE. This technology might avoid the negative effects of high concentrations of inorganic components in HU. Furthermore, some previous studies have proved that Cl− could generate Cl˙ or 1O2, which could suggest that a high concentration of Cl− in HU might enhance the oxidation of PMS.16,17
To the best of our knowledge, there has been no research yet on the use of PMS for organic pollutants removal from urine. Consequently, the aims of this study were as follows: (1) to assess the performance of PMS in the destruction of pharmaceuticals in HU; (2) to evaluate the impact of the PMS dosage, and the major components of HU; (3) to identify the dominant RS in the HU/PMS system; (4) to propose the degradation pathways of ACE.
2 Materials and methods
2.1 Chemicals
All the chemical reagents used in the experiment were of analytical grade or higher purity. ACE, ethanol (EtOH), tert-butyl alcohol (TBA), ascorbic acid (AA), Na3 citrate·2H2O, NaOH, urea, NaCl, KCl, NH4OH, NaH2PO4·2H2O, MgCl2·6H2O, CaCl2·2H2O, NH4HCO3, NaHCO3, H2SO4, Na2S2O3, Na2SO4, H3BO3, Na2B4O7·10H2O, and KI were obtained from Sinopharm (China). Creatine, creatinine, hippuric acid, nitrobenzene (NB), furfuryl alcohol (FFA), nitro blue tetrazolium (NBT), L-histidine (L-his), and trifluoroacetic acid were supplied by Aladdin Chemicals. Methanol and acetonitrile were purchased from CNW Technologies GmbH (Germany). The preparation of the matrices involved dissolution in ultrapure water (18.2 MΩ cm−1).2.2 Urine matrices
The recipes for FU and HU1,2 are provided in Table S1.† The FU and HU samples were filtered through a 0.45 μm filter to remove undissolved precipitates, and then stored in a refrigerator at 4 °C prior to use.2.3 Experimental setup
The objective of this study was to assess the efficacy of the HU/PMS system in degrading ACE, and the study was carried out by adopting the method of controlling the variables. The degradation experiments were carried out in a 40 mL brown glass bottle at ambient temperature (25 ± 1 °C). HU was spiked with ACE, then PMS was added immediately to initiate the oxidation process to determine the experimental optimal parameters. Sample aliquots were taken from the reaction solution at predetermined time intervals and quenched immediately by Na2S2O3 (50 mM). The effect of temperature was determined in a water bath.Considering the buffer action of HCO3− and H2PO4−, the solution pH should not change during the reaction. In order to evaluate the effect of the HU components, therefore, this study selected borate buffer (BB, 20 mM) at pH 7.4 (BB7.4) and at pH 9 (BB9) as the reaction environment to ensure the stability of the solution pH within the process. Specific HU components at various concentrations were added into BB9 and compared with the BB9 control matrix without HU components. NaOH and H2SO4 were used to adjust the pH of the reaction solution.
The generation of RS in the reaction was verified through quenching experiments with the addition of AA (for all RS), EtOH (for HO˙ and SO4˙−), TBA (for HO˙ but not for SO4˙−), FFA and L-his (for 1O2), and NBT (for superoxide radicals (O2˙−)), as the RS scavenger. Moreover, to detect the generation of 1O2, O2˙−, and HO˙, ACE was replaced by the probe molecules FFA (for 1O2), NBT (for O2˙−), and NB (for HO˙), respectively, and the rest of the process was similar to the ACE removal procedure.
To investigate the effect of the PMS addition modes on ACE degradation, PMS was divided equally and added periodically in the same time intervals at the predetermined reaction time. To evaluate the effect of simulated sunlight (λ > 300 nm) or visible light (λ > 400 nm) irradiation on the system of HU/PMS, the reaction solution was exposed to a 500 W metal halide lamp equipped with a 300 nm or a 400 nm cutoff filter, respectively.
All the experiments were performed in duplicate (n ≥ 2), and in most cases, the deviation of each experiment was less than 5%.
2.4 Analytical methods
ACE, FFA, and NB were analyzed by a 1260 Infinity II high-performance liquid chromatography (HPLC) system (Agilent, USA) equipped with a diode array detector (DAD) and an Athena C18 column (150 mm × 2.1 mm, 5 μm, at 40 °C). Details of the HPLC parameters for the analysis of the target organic compounds are described in Table S2.†The concentration of O2˙− was determined by NBT degradation as measured by a UV-3300 UV-vis spectrophotometer (Mapada Inc., China) at the wavelength of 259 nm, and the mole ratio of generated O2˙− and degraded NBT was found to be 4![[thin space (1/6-em)]](https://www.rsc.org/images/entities/char_2009.gif) :
:![[thin space (1/6-em)]](https://www.rsc.org/images/entities/char_2009.gif) 1.18 The PMS concentration of the reaction solution was measured at the wavelength of 352 nm by a UV-vis spectrometric method using potassium iodide solution as the indicator.
1.18 The PMS concentration of the reaction solution was measured at the wavelength of 352 nm by a UV-vis spectrometric method using potassium iodide solution as the indicator.
Three-dimensional excitation–emission matrices (3D-EEMs) of the reaction solution were measured by using a 3D fluorescence spectrometer (HITACHI, F7100). The scanning excitation wavelength (Ex) ranged from 230 to 450 nm in increments of 5 nm and the scanning emission wavelength (Em) ranged from 250 to 500 nm in increments of 2 nm, using a scanning speed of 12![[thin space (1/6-em)]](https://www.rsc.org/images/entities/char_2009.gif) 000 nm min−1 with 5 nm scan spacing.
000 nm min−1 with 5 nm scan spacing.
The intermediate products of ACE degradation were identified by an LC-MS system (Agilent 1100), equipped with a Welch Ultimate XB-C18 column (2.1 mm × 150 mm, 3 μm). Before the LC-MS analysis, the solid-phase extraction (SPE) technique with an HLB cartridge (CNW) was employed to concentrate the extracts from the ACE degradation. The target organics in the reaction solution (e.g. ACE or its intermediate products) were separated by the HLB cartridge, and then dissolved in methanol to obtain the concentrate. The LC-MS parameters were as follows: injection volume, 10 μL; testing temperature, 23 °C; LC-MS solvents A was 0.1% formic acid and B was acetonitrile. Details on the LC-MS solvents parameters for the ACE intermediate products are described in Table S3.† The mass spectrometry system was equipped with a Thermos TSQ Quantum Ultra system using the negative ion source mode for ESI. The operations were performed with a spray voltage of 3000 V and heater temperature of 450 °C, at a sheath gas pressure of 424 Arb, ion sweep gas pressure of 1 Arb, and aux gas pressure of 13 Arb. Besides, the analysis parameters were a capillary temperature of 350 °C, tube lens offset of 39 V, and source CID of 0 V.
In the present study, the calculation method for the pollutant degradation percentage was based on the following eqn (1), and the pseudo-first-order reaction kinetics (kobs) of ACE oxidation by PMS was described by eqn (2).
| Degradation (%) = (C0 − Ct)/C0 × 100 | (1) |
| −ln(Ct/C0) = kobst | (2) |
3 Results and discussion
3.1 ACE degradation under various systems
ACE degradation was tested with different systems, including BB7.4/PMS, BB9/PMS, FU/PMS, and HU/PMS. As shown in Fig. 1, the order of ACE degradation in the different systems was as follows: HU/PMS > FU/PMS > BB9/PMS > BB7.4/PMS. Taking into account the results, 7.1% ACE degradation was observed in the BB7.4/PMS system after 60 min reaction, indicating that PMS without activation had no obvious capability to degrade ACE.19 It has been reported that an alkaline condition could active PMS to remove pollutants (eqn (3)).20 Hence, ACE removal in the BB9/PMS system without HU substance addition was tested. The degradation of the BB9/PMS system was over 6.5-fold higher than that of the BB7.4/PMS system, which was expected. Interestingly, although the FU/PMS system was under an acid condition (pH 5.5), the removal of ACE was far higher than that in the BB7.4/PMS system, suggesting that other substances (e.g. up to 104 mM of Cl−)21 in the FU might enhance the degradation of ACE. Comparatively, HU/PMS treatment led to a faster removal of ACE than in the FU/PMS system, which might be due to the alkaline environment of HU, which was conducive to activating PMS to produce RS. In addition, compared with the BB9/PMS system, the degradation rate of ACE was significantly increased under the HU/PMS system. This was probably because substances such as Cl−, and NH4+ in HU may promote the degradation of ACE, and so their effects are discussed later. These results indicated that the HU/PMS system could effectively and rapidly degrade ACE and was proved to be a promising oxidization technique. Therefore, HU and BB9 were selected as the reaction solutions to degrade ACE by PMS and the factors influencing the degradation were analyzed in the subsequent experiments.| HSO5− + SO52− → SO42− + HSO4− + 1O2 k = 0.2 M−1 s−1 | (3) |
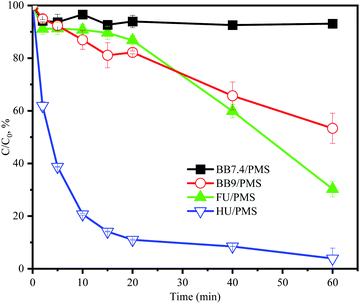 | ||
| Fig. 1 Degradation of ACE under different systems by PMS. Experimental conditions: [ACE]0 = 5 μM; [PMS]0 = 3 mM. | ||
3.2 Effect of PMS concentration
In the HU/PMS system, 79.4% of ACE was degraded in the initial 10 min stage and then the degradation rate decreased during the rest of the time (Fig. 2a). Hence, there existed a time node (10 min) that could divide the whole reaction process of ACE into two different stages: an initial stage for rapid degradation, and then a long stage for rate declining.18 When the concentration of PMS was increased from 0.5 mM to 7 mM, the kobs value in the initial 10 min was increased from 0.012 min−1 to 0.106 min−1. Because of the buffer action of HU, the solution pH did not decrease with the increase in PMS concentration. In addition, it should be pointed out that 1O2 could be produced by the alkaline activation of PMS, which might explain why the ACE removal was accelerated when the PMS dosage increased from 0.5 mM to 7 mM within the initial 10 min. However, within 60 min, at a PMS initial dosage of 0.5, 1, 2, 3, 4, 5, 6, and 7 mM, the ACE degradation efficiencies were 52.4%, 77.4%, 80.8%, 96.1%, 90.29%, 89.94%, 91.6%, and 92.8%, respectively. Hence, it could be indicated that the increasing of PMS dosage did not apparently improve the removal of ACE. Thus, considering the treatment cost and environmental risk, the dosage of 3 mM PMS was selected in the present study.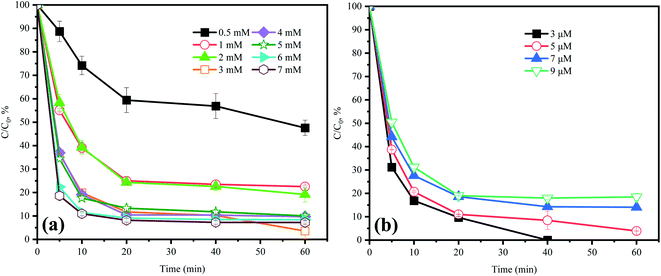 | ||
| Fig. 2 Effect of (a) PMS and (b) ACE concentration on ACE degradation. Experimental conditions: (a) [ACE]0 = 5 μM; [PMS]0 = 0.5–7 mM. (b) [PMS]0 = 3 mM; [ACE]0 = 3–9 μM. | ||
3.3 Effect of ACE concentration
Fig. 2b shows that the ACE degradation rate decreased with the increase in initial concentration. When the ACE concentration was 3, 5, 7, and 9 μM, the efficiencies of ACE removal were 100%, 96.1%, 85.9%, and 81.5%, respectively. This was probably because the dosage of the oxidant PMS remained constant, and therefore all the pollutant molecules could not be completely degraded when the pollutants were at a high concentration. Furthermore, there also existed competition for RS between the pollutants and their intermediates.223.4 Identification of RS
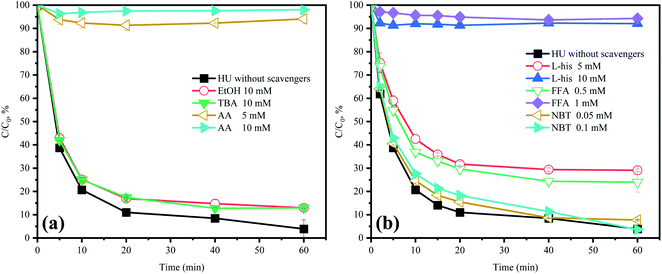
As the previously research reported, SO4˙−, HO˙, 1O2, and O2˙− are considered as the primary RS in PMS-based AOPs.23 Hence, AA was chosen to scavenge all the RS to verify the role of RS in the HU/PMS system.20 As depicted in Fig. 3a, the degradation of ACE was remarkably inhibited in the presence of AA, suggesting that RS plays a critical role in the removal of ACE.TBA could quench HO˙ (k = 3.8 × 10⁸ to 7.6 × 10⁸ M−1 s−1) and EtOH was a strong scavenger for both HO˙ (k = 1.2 × 10⁹ to 2.8 × 10⁹ M−1 s−1) and SO4˙− (k = 1.6 × 10⁷ to 7.7 × 10⁷ M−1 s−1).24,25 As shown in Fig. 3a, both TBA and EtOH could slightly inhibit the removal of ACE, whose degradation rate was reduced by 9.1% compared with HU without any scavengers. These results indicated that HO˙ presumedly assumed part of the responsibility for the ACE degradation, but not the dominant RS. Furthermore, NB was adopted to calculate the HO˙ production (eqn (4) and (5)).26 As shown in Fig. 4, [HO˙]ss (steady-state concentration of HO˙) could be calculated as 7.83 × 10⁻¹¹ M, since the second reaction rate constant kNB,HO˙ = 3.9 × 10⁹ M−1 s−1.26
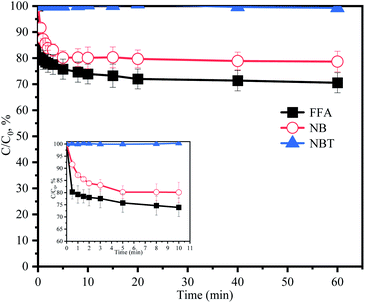 | ||
| Fig. 4 Degradation of NB, FFA and NBT without ACE by PMS in HU. Experimental conditions: [PMS]0 = 3 mM; [NB]0 = 100 μM; [FFA]0 = 50 μM; [NBT]0 = 5 μM. | ||
The degradation of NB can be expressed as follows:
 | (4) |
Integrating eqn (3) can yield:
 | (5) |
Here, FFA was employed to identify the generation of 1O2 because of the high reactivity toward 1O2 ( ).23,27 As shown in Fig. 3b, ACE removal was restrained by the addition of 0.5 mM FFA and with the increase of FFA dosage, the inhibition effect was enhanced. To further confirm the effect of 1O2, L-his was also selected as a scavenger for 1O2 (
 ),23 and the results showed that 1O2 should be the primary RS in the process of ACE degradation. Furthermore, the production of 1O2 in the HU/PMS system was determined by using FFA as the probe molecule.27 This process can be described with eqn (6) and (7). As shown in Fig. 4, 33.3% FFA was removed within the first 10 min, which seemed to support the production of 1O2 in the HU/PMS system. Moreover, based on the second reaction rate constant
  ,27 [1O2]ss (steady-state concentration of 1O2) in the first 10 min of the experiment could be calculated to be 3.5 × 10⁻¹⁰ M.
The addition of NBT as a quencher for O2˙− (k = 0.9 × 10⁹ M−1 s−1)18 led to no obvious inhibitory effect on ACE degradation. Besides, NBT was selected as a probe to further confirm the generation of O2˙−. The removal of NBT was hardly detected (Fig. 4), hence, it could be indicated that the HU/PMS system did not produce O2˙−. In conclusion, both 1O2 and HO˙ were present in this system, but 1O2 might play a more important role.
The degradation of NB can be expressed as follows:
 | (6) |
Integrating eqn (5) can yield:
 | (7) |
3.5 Effects of different components in HU
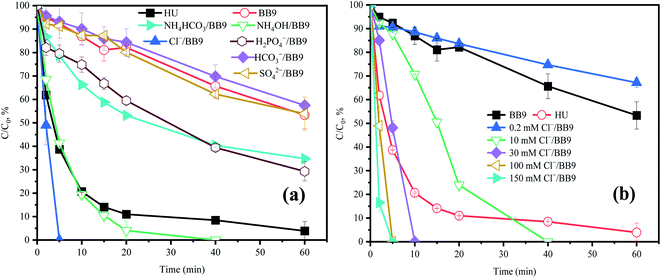
Cl− in the degradation system of PMS undergoes a relatively complex reaction process. Combining the previous literature and our experimental data, the following three explanations can be drawn: (1) Cl− can react with PMS to generate hypochlorous acid (HClO) and Cl˙,28 and the former can self-decompose or continue to react with PMS to generate 1O2, which would accelerate the removal of ACE (eqn (8)–(11));17 (2) the reactions of Cl− with RS produced Cl˙ (E0 = (Cl˙/Cl−) = 2.41 V),7,29 in which the oxidant power was higher than for PMS (1.82 V).30 Thus, the faster ACE degradation might be partly contributed to by the oxidation of Cl˙; (3) the ortho and para positions to the phenol moiety of ACE could be attracted by Cl˙.31 Therefore, the concentration of Cl− at 100 mM could evidently promote the degradation of ACE.
| HSO5− + Cl− → SO42− + HOCl | (8) |
| HSO5− + 2Cl− → SO42− + HClO + Cl˙ | (9) |
| 2HClO → 1O2 + 2H+ + 2Cl− | (10) |
| 2HClO + 2HSO5− → 2SO42− + 2Cl− + 2H2O + 1O2 | (11) |
| HO˙ + Cl− ⇌ ClHO˙− | (12) |
| ClHO˙− + H+ ⇌ H2O + Cl˙ | (13) |
| Cl˙ + Cl− ⇌ Cl2˙− | (14) |
The effect of SO42− on ACE degradation by PMS in BB9 is shown in Fig. 5a. The addition of SO42− did not manifest a significant influence on ACE degradation. This might be due to SO42− having no effect on the RS in the system.
| HSO5− + HCO3− → HCO4− + HSO4− | (15) |
| HCO4− + H2O → HCO3− + H2O2 | (16) |
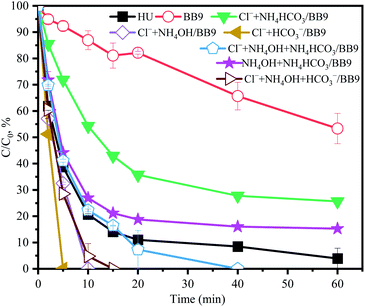
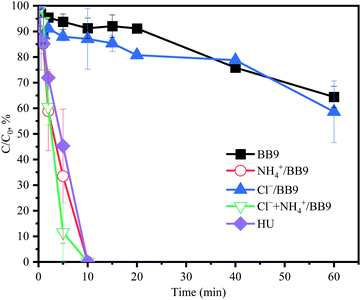
Compared with BB9, the addition of NH4OH led to a higher kobs (0.069 min−1) for the degradation of ACE. This result might profit from the RS (˙NH2 and ˙NO2) that may be produced by the reactions between NH4+ and HO˙ (eqn (17)–(19)).1,33 Also these RS mentioned above might react with compounds containing strong electron-donating substituents by electron transfer.34 Besides, Wu et al. proved that RNS has a high reactivity with phenolic compounds.35 Here, the kobs value of ACE oxidization (0.0091 min−1) was slower in the presence of NH4HCO3 than NH4OH. This result might be attributed to the inhibitory effect of HCO3−. Furthermore, the coexistence of NH4OH and NH4HCO3 accelerated the removal of ACE compared to that with BB9. Thus, NH4+ was supposed to lead to a significant positive effect on ACE degradation.
| NH3 + HO˙ → ˙NH2 + H2O | (17) |
| ˙NH2 + O2 → NH2O2 | (18) |
| NH2O2 → ˙NO + H2O | (19) |
There is an order for the reactions among RS, ACE, and other components, which would affect the degradation rate of ACE. Cl− (eqn (12)–(14)), NH4+ (eqn (17)–(19)), and HCO3− could react with HO˙ and the reaction rates were 4.2 × 10⁹, 9 × 10⁷, and 3.9 × 10⁸ M−1 s−1,29 respectively. Therefore, combined with the concentration of various components in the HU, the reaction order was Cl− > HCO3− > NH4+. As presented in Fig. 5a and 7, compared with BB9, the presence of Cl− (100 mM) appreciably promoted ACE degradation regardless of what kind of coexisting components there were with Cl−. This effect could probably be attributed to the rate of reaction between Cl− and RS being highest among the other reactions. On the other hand, Cl− could activate PMS to generate more 1O2 and Cl˙ to accelerate the ACE degradation. Compared with Cl− alone, when Cl− and HCO3− coexisted, the kobs value of ACE removal decreased from 0.155 min−1 to 0.145 min−1. However, when Cl− and NH4OH coexisted, the kobs was 0.10 min−1, which was lower than for Cl− and HCO3− concurrent (0.145 min−1). This was probably because NH4+ could be deprotonated to form NH3, which then might induce the formation of chloramines that have weak oxidation properties (eqn (20)–(22)).39 Consequently, it might be concluded that Cl−, NH4OH, and NH4HCO3 were the primary components involved in accelerating ACE degradation.
| NH3 + HOCl → NH2Cl + H2O | (20) |
| NH2Cl + HOCl → NHCl2 + H2O | (21) |
| NHCl2 + HOCl → NCl3 + H2O | (22) |
3.6 Variation of PMS concentration under different solutions
In order to elucidate the interactions among PMS and the HU components, especially Cl− and NH4+, the variation of the PMS concentration in different experimental solutions was determined.As shown in Fig. 8, in the HU, the PMS concentration was entirely consumed within 10 min. However, the degradation rate of ACE tended toward constant after 10 min, and so it could be speculated that the other active substances in HU would also contribute to the degradation of ACE. In the system of BB9 containing Cl−, rapid ACE degradation was observed (kobs = 0.155 min−1), but the PMS consumption was slower, which was almost consistent with BB9 without Cl−. This could be attributed to the presence of Cl−, whereby the reaction with PMS led to the formation of Cl˙ (E0 (Cl˙/Cl−) = 2.41 V)7 and 1O2, which could oxidize ACE. On the other hand, compared with Cl−, the presence of NH4+ led to higher PMS consumption, but the ACE degradation was lower (0.069 min−1). This result was presumably due to the relatively weak oxidant ˙NH2 (E0 (˙NH2/NH3) = 0.6 V).1 From the results above, it could be deduced that Cl− and NH4+ would react with PMS to produce the corresponding RS, which would presumably remove ACE.
3.7 Effect of different addition modes of PMS
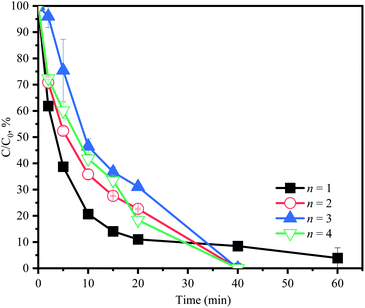
As discussed previously, in the first 10 min, the sharp consumption of PMS would cause the oxidation of ACE at a high speed. After PMS was consumed, the generation of RS rapidly decreased, resulting in the following slow degradation of ACE, which could lead to residual ACE. Therefore, different PMS addition modes were used to improve the efficiency of ACE degradation. PMS (3 mM) was divided into 1, 2, 3, or 4 equal portions, which were then added during the reaction process (60 min) at the corresponding time intervals. As shown in Fig. 9, 100% degradation efficiency of ACE could be achieved by adjusting the addition modes of PMS. Considering the simplified treatment, 1.5 mM PMS could be added at 0 min and 30 min, respectively, in practical operation to improve the degradation of ACE.3.8 Effect of the reaction temperature
Fig. 10a presents the effect of temperature on ACE degradation. Within the initial 10 min, the kobs value of ACE removal increased from 0.044 to 0.101 min−1 with the temperature increasing from 10 °C to 50 °C. The reason for this might be that the increase in reaction temperature could accelerate thermal movement toward the molecules and increase the probability of collision of molecules.40 Meanwhile, the rising temperature brought about a quicker PMS consumption, thus speeding up the production efficiency of RS. However, with the temperature increasing from 25 °C to 50 °C, the final degradation of ACE dropped to 86.4%, lower than at 25 °C (96.1%). This was probably because of the quicker PMS consumption within the initial 10 min, leading to the RS production efficiency to decline in the subsequent phases.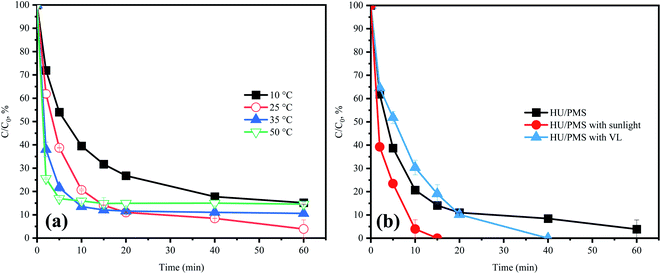 | ||
| Fig. 10 Effects of (a) reaction temperature and (b) photo-irradiation in HU on the degradation of ACE by PMS. Experimental conditions: [PMS]0 = 3 mM; [ACE]0 = 5 μM; (a) T = 10–50 °C. | ||
In fact, the final degradation of ACE within 60 min for all reached around 80%. This was probably because the alkaline activation of PMS could be achieved at lower energies.15 The results might indicate that the HU/PMS is a system that is less restricted by temperature change.
3.9 Effect of photo-irradiation
It has been asserted that sunlight demonstrates a redox ability, which appears to suggest excellent sustainability.41 Note that being a part of sunlight, UV irradiation (100–400 nm)42 could activate PMS to degrade pollutants.9 Therefore, it could be speculated that sunlight photo-illumination would be an environmentally friendly and efficient way to enhance ACE removal. Fig. 10b depicts the result showing the faster speed of ACE degradation in the HU/PMS system with sunlight irradiation, which was in line with expectations.Visible-light (VL) irradiation for removing pollutants has been gaining attention recently, with previous studies focusing on developing some catalysts, such BiFeO3, to activate PMS with the assistance of VL irradiation.43 However, no reports paid attention to the VL irradiation in alkaline conditions for the activation of PMS. As shown in Fig. 10b, the removal of ACE in the HU/PMS system was also increased under VL irradiation. This result might be attributed to the absorbance of the HU/PMS system (Fig. S2†). Besides, PMS activation could also be achieved by electron transfer from ACE, resulting in ACE oxidation.44 However, more mechanisms that bring about a quicker ACE degradation in the HU/PMS system with the assistance of VL need further study.
3.10 ACE degradation process characterized by 3D-EEMs
In order to gain further evidence of the process of ACE degradation, 3D-EEMs were applied to represent the change of ACE fluorescence spectroscopy during the reaction. Fig. 11 shows the record for the PMS removal of ACE in HU. It can be observed that ACE fluorescence spectroscopy was able to show significant changes in EEMs by PMS oxidization. As the process went on, another fluorescence intensity peak appeared and was enhanced, suggesting that ACE might degrade to generate other intermediates that have higher fluorescence intensity.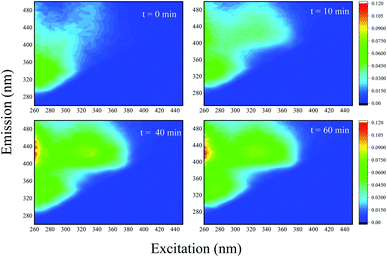 | ||
| Fig. 11 Normalized fluorescence excitation–emission matrices obtained at different times of ACE degradation by PMS in HU. Experimental conditions: [PMS]0 = 3 mM; [ACE]0 = 5 μM. | ||
3.11 Degradation products and pathways analysis
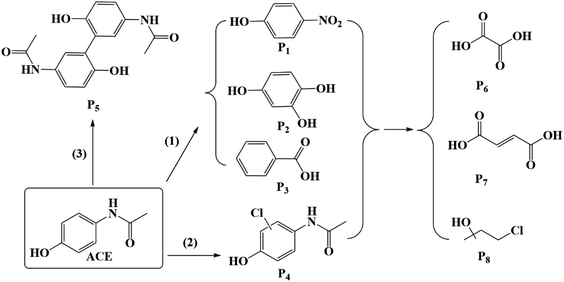
Because of the simultaneous involvement of 1O2, Cl˙, HO˙, there are various reactions occurring in the system of HU/PMS, including chlorine substitution and electron transfer.45 Eight major intermediate products are exhibited in Fig. 12 and the primary pathways of ACE degradation were assumed to be as follows:(1) 1O2 could break the amide bone between nitrogen and carbon in the benzene ring, and could be expected to lead to the formation of 4-nitrophenol (P1), 1,2,4-benzentriol (P2), and benzaldehyde (P3).46
(2) Cl˙ can be directly added to the benzene ring to form a mono-chlorine substitution product (P4).31
(3) In addition, an intermediate with m/z = 299 (P5) was detected, which was deduced to be a dimer of ACE.47
Moreover, ACE and its by-products decomposed into oxalic acid (P6), maleic acid (P7), and 4-chloro-2-methyl-2-butanol (P8) because of the breakage of the benzene ring.48
4 Conclusion
This study investigated the applicability of PMS for the removal of ACE in HU for the first time. The efficient degradation of ACE was observed in the HU/PMS system, when there was a constant alkaline condition (pH 9). Quenching experiments concluded that 1O2 and HO˙ were present in the HU/PMS system, and 1O2 was the predominant RS that was responsible for ACE removal. Different from the strong scavenging effects of Cl−, NH4+ and HCO3− on the RS reported with several previous AOPs, PMS application for removing ACE in HU exhibited promising results. Cl− and NH4+ would react with RS to generate reactive chlorine and/or reactive nitrogen species, which can accelerate ACE degradation. Besides, under alkaline conditions for HU, the presence of H2PO4− could activate PMS to facilitate the removal of ACE. On the other hand, HCO3− displayed a slight inhibition effect on the HU/PMS system. In addition, the effects of SO42− and organics (creatine, creatinine, and hippuric acid) could be ignored. In this study, two stages with different kobs of ACE removal were observed, which might be related to the sharp consumption of PMS within the first 10 min. Therefore, the addition modes of PMS could improve the effect of ACE degradation. Moreover, the oxidation ability of the HU/PMS system could be strengthened by photo-irradiation. With the increasing of temperature, the removal of ACE could hardly be enhanced. Furthermore, 3D-EEMs analysis demonstrated that ACE might degrade to generate other intermediates that have a higher fluorescence intensity. Based on the results of the intermediates experiments, the degradation pathways of ACE were proposed. Overall, the effective oxidation of pharmaceuticals in HU by applying PMS could be a promising option.Author contributions
Yiting Lin: Writing, methodology, conceptualization, validation, investigation. Xiting Mo: methodology, validation. Yamin Zhang: methodology. Minghua Nie: ideas, supervision, conceptualization, investigation, writing. Caixia Yan: investigation, writing-review & editing, supervision. Leliang Wu: validation.Conflicts of interest
The authors declare that they have no known competing financial interests or personal relationships that could have appeared to influence the work reported in this paper.Acknowledgements
This work was financially supported by the National Natural Science Foundation of China (42067034, 42067058), the Foundation for Academic and Technical Leaders of Major Disciplines of Jiangxi Province (20212BCJL23058), the Jiangxi Provincial Natural Science Foundation (20202BAB203015, 20202BAB203014), and the Open Fund of Key Laboratory of Eco-geochemistry, Ministry of Natural Resources (ZSDHJJ202004).References
- R. Zhang, P. Sun, T. H. Boyer, L. Zhao and C.-H. Huang, Environ. Sci. Technol., 2015, 49, 3056–3066 CrossRef CAS PubMed.
- C. Luo, M. Feng, V. K. Sharma and C.-H. Huang, Environ. Sci. Technol., 2019, 53, 5272–5281 CrossRef CAS PubMed.
- H.-Q. Liu, J. C. W. Lam, W.-W. Li, H.-Q. Yu and P. K. S. Lam, Sci. Total Environ., 2017, 586, 1162–1169 CrossRef CAS PubMed.
- S. Kumari and R. N. Kumar, Chemosphere, 2021, 273, 128571 CrossRef CAS PubMed.
- H. Modick, T. Weiss, G. Dierkes, T. Brüning and H. M. J. R. Koch, Soc. Reprod. Fertil., 2014, 147, R105–R117 CAS.
- M. Blieden, L. C. Paramore, D. Shah and R. Ben-Joseph, Expert Rev. Clin. Pharmacol., 2014, 7, 341–348 CrossRef CAS PubMed.
- Z. Wang, L. Ai, Y. Huang, J. Zhang, S. Li, J. Chen and F. Yang, RSC Adv., 2017, 7, 30941–30948 RSC.
- H. Zhang, L. Qiao, J. He, N. Li, D. Zhang, K. Yu, H. You and J. J. R. a. Jiang, RSC Adv., 2019, 9, 27224–27230 RSC.
- L. Zhang, R. Zhang, W. Wang, S. Han and P. J. R. A. Xiao, RSC Adv., 2021, 11, 20580–20590 RSC.
- Y. Fan, Y. Ji, D. Kong, J. Lu and Q. Zhou, J. Hazard. Mater., 2015, 300, 39–47 CrossRef CAS PubMed.
- Y. Wang, Y. Wu, Y. Yu, T. Pan, D. Li, D. Lambropoulou and X. Yang, Water Res., 2020, 186, 116326 CrossRef CAS PubMed.
- B. Sheng, Y. Huang, Z. Wang, F. Yang, L. Ai and J. J. R. a. Liu, RSC Adv., 2018, 8, 13865–13870 RSC.
- R. Yin, W. Guo, H. Wang, J. Du, X. Zhou, Q. Wu, H. Zheng, J. Chang and N. Ren, Chem. Eng. J., 2018, 334, 2539–2546 CrossRef CAS.
- M. Nie, Y. Deng, S. Nie, C. Yan, M. Ding, W. Dong, Y. Dai and Y. Zhang, Chem. Eng. J., 2019, 369, 35–45 CrossRef CAS.
- C. Qi, X. Liu, J. Ma, C. Lin, X. Li and H. Zhang, Chemosphere, 2016, 151, 280–288 CrossRef CAS.
- L. R. Bennedsen, J. Muff and E. G. Søgaard, Chemosphere, 2012, 86, 1092–1097 CrossRef CAS PubMed.
- S. Wang and J. Wang, Chem. Eng. J., 2020, 379, 122361 CrossRef CAS.
- L. Wu, Y. Lin, Y. Zhang, P. Wang, M. Ding, M. Nie, C. Yan and S. J. R. A. Chen, RSC Adv., 2021, 11, 33626–33636 RSC.
- Z.-Y. Li, L. Wang, Y.-L. Liu, Q. Zhao and J. Ma, Water Res., 2020, 168, 115093 CrossRef CAS PubMed.
- M. Nie, W. Zhang, C. Yan, W. Xu, L. Wu, Y. Ye, Y. Hu and W. Dong, Sci. Total Environ., 2019, 647, 734–743 CrossRef CAS PubMed.
- J. Ding, H. Nie, S. Wang, Y. Chen, Y. Wan, J. Wang, H. Xiao, S. Yue, J. Ma and P. Xie, Water Res., 2021, 189, 116605 CrossRef CAS PubMed.
- A.-U.-R. Bacha, I. Nabi, H. Cheng, K. Li, S. Ajmal, T. Wang and L. Zhang, Chem. Eng. J., 2020, 389, 124482 CrossRef CAS.
- Y. Ji, J. Lu, L. Wang, M. Jiang, Y. Yang, P. Yang, L. Zhou, C. Ferronato and J.-M. Chovelon, Water Res., 2018, 147, 82–90 CrossRef CAS PubMed.
- Y.-H. Guan, J. Ma, D.-K. Liu, Z.-f. Ou, W. Zhang, X.-L. Gong, Q. Fu and J. C. Crittenden, Chem. Eng. J., 2018, 352, 477–489 CrossRef CAS.
- Y. D. Shahamat, M. A. Zazouli, M. R. Zare and N. J. R. A. Mengelizadeh, RSC Adv., 2019, 9, 16496–16508 RSC.
- X. Ma, C. Ye, J. Deng, A. Cai, X. Ling, J. Li and X. Li, Sep. Purif. Technol., 2021, 274, 118982 CrossRef CAS.
- Y. Zhang, J. Lou, L. Wu, M. Nie, C. Yan, M. Ding, P. Wang and H. Zhang, Ecotoxicol. Environ. Saf., 2021, 221, 112422 CrossRef CAS PubMed.
- Z. Wang, M. Feng, C. Fang, Y. Huang, L. Ai, F. Yang, Y. Xue, W. Liu and J. J. R. a. Liu, RSC Adv., 2017, 7, 12318–12321 RSC.
- M. Nie, Y. Yang, Z. Zhang, C. Yan, X. Wang, H. Li and W. Dong, Chem. Eng. J., 2014, 246, 373–382 CrossRef CAS.
- M. Nihemaiti, R. R. Permala and J.-P. Croué, Water Res., 2020, 169, 115221 CrossRef CAS PubMed.
- J. Li, S. Zhou, M. Li, E. Du and X. Liu, Environ. Sci. Pollut. Res., 2019, 26, 25012–25025 CrossRef CAS PubMed.
- J. Cao, L. Lai, B. Lai, G. Yao, X. Chen and L. Song, Chem. Eng. J., 2019, 364, 45–56 CrossRef CAS.
- M. C. Dodd, S. Zuleeg, U. v. Gunten and W. Pronk, Environ. Sci. Technol., 2008, 42, 9329–9337 CrossRef CAS PubMed.
- P. Neta, P. Maruthamuthu, P. M. Carton and R. W. Fessenden, J. Phys. Chem., 1978, 82, 1875–1878 CrossRef CAS.
- Y. Wu, L. Bu, X. Duan, S. Zhu, M. Kong, N. Zhu and S. Zhou, J. Cleaner Prod., 2020, 273, 123065 CrossRef CAS.
- X. Lou, L. Wu, Y. Guo, C. Chen, Z. Wang, D. Xiao, C. Fang, J. Liu, J. Zhao and S. Lu, Chemosphere, 2014, 117, 582–585 CrossRef CAS PubMed.
- X. Lou, C. Fang, Z. Geng, Y. Jin, D. Xiao, Z. Wang, J. Liu and Y. Guo, Chemosphere, 2017, 173, 529–534 CrossRef CAS PubMed.
- G. P. Anipsitakis, T. P. Tufano and D. D. Dionysiou, Water Res., 2008, 42, 2899–2910 CrossRef CAS PubMed.
- Y. Huang, F. Yang, L. Ai, M. Feng, C. Wang, Z. Wang and J. Liu, Chemosphere, 2017, 179, 331–336 CrossRef CAS PubMed.
- J. Deng, Y. Shao, N. Gao, Y. Deng, S. Zhou and X. Hu, Chem. Eng. J., 2013, 228, 765–771 CrossRef CAS.
- N. Li, Y. Tian, J. Zhao, J. Zhang, W. Zuo, L. Kong and H. Cui, Chem. Eng. J., 2018, 352, 412–422 CrossRef CAS.
- W. Qi, S. Zhu, A. Shitu, Z. Ye and D. Liu, J. Water Process Eng., 2020, 36, 101362 CrossRef.
- F. Chi, B. Song, B. Yang, Y. Lv, S. Ran and Q. J. R. A. Huo, RSC Adv., 2015, 5, 67412–67417 RSC.
- W. Tan, W. Ren, C. Wang, Y. Fan, B. Deng, H. Lin and H. Zhang, Chem. Eng. J., 2020, 394, 124864 CrossRef CAS.
- P. Wang, L. Bu, Y. Wu, J. Deng and S. Zhou, Water Res., 2021, 194, 116938 CrossRef CAS PubMed.
- T. X. H. Le, T. V. Nguyen, Z. Amadou Yacouba, L. Zoungrana, F. Avril, D. L. Nguyen, E. Petit, J. Mendret, V. Bonniol, M. Bechelany, S. Lacour, G. Lesage and M. Cretin, Chemosphere, 2017, 172, 1–9 CrossRef CAS PubMed.
- M. Peñas-Garzón, A. Gómez-Avilés, C. Belver, J. J. Rodriguez and J. Bedia, Chem. Eng. J., 2020, 392, 124867 CrossRef.
- R. Mu, Y. Ao, T. Wu, C. Wang and P. Wang, J. Hazard. Mater., 2020, 382, 121083 CrossRef CAS PubMed.
Footnote |
| † Electronic supplementary information (ESI) available. See DOI: 10.1039/d1ra07891g |
| This journal is © The Royal Society of Chemistry 2021 |

