 Open Access Article
Liquid crystal behavior, photoluminescence and gas sensing: A new series of ionic liquid crystal imidazole and benzoimidazole bearing chalcone groups, synthesis and characterization†
AbdulKarim-Talaq Mohammad * and
Wahaj Raed Abbas
Chemistry Department, College of Science, University of Anbar, Ramadi, Iraq. E-mail: drmohamadtalaq@gmail.com; Tel: +9647832575081
First published on 30th November 2021
Abstract
Four new series of chalcones containing imidazole bromonium and benzimidazole bromonium salts with spacer alkyl chains (Cn, n = 2 and 4) were synthesized and the chemical structure, thermal behavior, photoluminescence and gas sensing were characterized by several technical methods. The studies have indicated similar mesomorphic properties of the synthesized compounds, dependent on the terminal alkyl-chain and lengths of the alkoxy-spacer. Almost compounds with shorter alky chains, 4a–4e, 5a–5c, 6a–6c and 7a–7d, did not show liquid crystal properties, while the results of other compounds confirm the existence of smectic A in cooling and heating cycles. Photoluminescence of compounds 5a–5i and 7a–7i was also studied. The emission in the blue region reveals that the material has blue light emission properties. Sensing behavior of compounds 4i and 5i was investigated for NH3 and NO2 gases. The sensors exhibited high sensitivity toward NH3, while sensitivity toward the oxidizing gas NO2 is lower.
1. Introduction
It has been shown that imidazolium and benzimidazolium salts are important in the field of ionic liquids (IL) and ionic liquid crystals (ILCs).1–7 A large number of these types containing imidazolium and benzimidazolium units have hitherto been synthesized and their application has been studied in liquid crystals,8 sensing,9,10 anticancer and other applications.11–17 Among an enormous variety of ionic mesogens studied so far, majority is derived from imidazolium cations.18 The study of imidazolium ILCs grew rapidly in the last 20 years as a result of the growing research in the field of imidazolium ILs, and because imidazolium salts can serve as N-heterocyclic carbene precursors, which are excellent ligands for transition-metal-based catalysts.19On the other hand, LC materials became very attractive for sensing application. LC-based sensing can be designed to possess sensor properties in different fields,20 such as bio-sensing, chemical-sensing, optical-sensing, gas-sensing and many others.21–24 The design of LC-compounds based sensors for chemical and biological species based on changes in the bulk properties of LCs. For example, cholesteric LC phases have been used to detect ethanol,22 water vapor,25 and vaporous analytes26 such as amines.21,23 ILCs are widespread in gas and liquid phase sensing. Thus, the interface of ILCs charges as a consequence of ion adsorption/dissociation, leading to the formation of electrical double layers at the interface of LC, which influences the ordering of LC.27 Moreover, to investigate the performance of materials in electro-optic devices, ionic conductivity influence, and the ion size on the stability of the smectic phase, a series of ILCs have been prepared and studied.28–31
Likewise, imidazole-based compounds have become an important part of pharmaceutical and medical chemistry, due to the unique desirable structural features of the imidazole ring which include being electron-rich, aromaticity, polarity, being ionizable and other characteristics.32,33 More importantly, multi-binding site imidazole rings are capable of coordination with a variety of inorganic metal ions or interaction with organic molecules through noncovalent bonds to create supramolecular drugs that may not only have the bioactivity of imidazole itself, but also the benefits of various supramolecular drugs, possibly exerting double-action mechanisms that are helpful to overcome drug resistance.34–37
In continuation of our work on imidazolium and benzimidazolium based mesogen compounds,38 we will describe in this paper the phase behavior, photoluminescence and sensing result obtained from the novel series of compounds containing the imidazolium and benzimidazolium salt moieties connected with chalcones by etherification. Enthalpy and phase transition of target compounds were studied by DSC and POM. Elemental analysis, Fourier-Transform Infrared (FT-IR) spectroscopy, and high resolution nuclear magnetic resonance (NMR) (1D and 2D) were used to study the physical properties of the title compounds.
2. Materials and synthesis
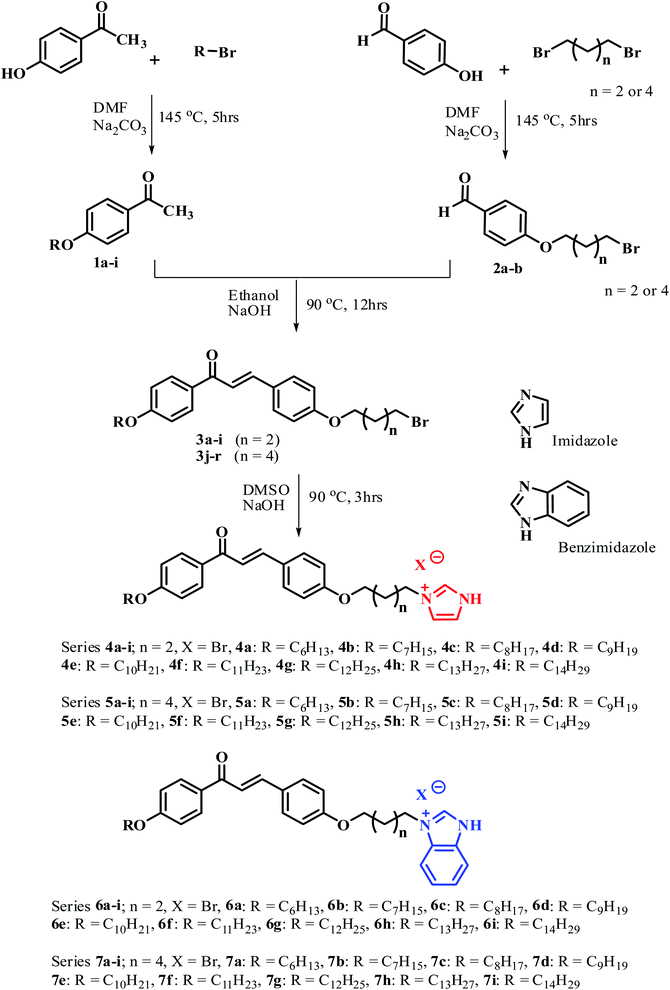
p-Hydroxyacetophenone, p-hydroxybenzaldehyde, 1,4-dibromoalkane, 1,6-dibromoalkanes, 1-bromoalkanes (C6–C14), imidazolium and benzimidazolium were purchased from Sigma-Aldrich. Sodium carbonate anhydrous was obtained from CDH and dimethylsulfoxide (DMSO) from BDH. 1,4-Bis(amino-methyl)-benzene, dimethylformamide (DMF), ethanol and hexane were obtained from Romil. For instrumentations and methods see ESI.†The preparative pathway toward the synthesis of title compounds is presented in Scheme 1. Compounds 1a–1i were obtained from Williamson's etherification between p-hydroxyacetophenone and various 1-bromoalkanes (C6–C14), while compounds 2a–2b were prepared by reaction of p-hydroxybenzaldehyde with 1,4-dibromoalkane, and 1,6-dibromoalkanes, respectively.39,40 Intermediate compounds 3a–3r were prepared by aldol condensation reaction between various 1a–1i and 2a–2b in the presence of NaOH in ethanol as the solvent for 12 h.41
Intermediate compounds 3a–3r were subsequently reacted with imidazolium and benzimidazolium respectively, to yield desired compounds 4a–4i, 5a–5i, 6a–6i and 7a–7i using the method reported in our previous work.38
Complete 1H-NMR and 13C-NMR assignments of target compounds were obtained and substantiated with the aid of DEPT, APT, two-dimensional 1H–1H (COSY), and 1H–13C heteronuclear multiple quantum correlation (HMQC). Details of discussions for the FT-IR and 1D and 2D NMR measurements for title compounds are provided and analytical data are also illustrated in the ESI section.†
2.1 Photoluminescence
Photoluminescence (PL) spectra of the prepared samples are recorded using a Fluo Time 300 Fluorescence Lifetime and Steady State Spectrometer by PicoQuanta, Germany. The wavelength of excitation was 350 nm. The PL measurements are performed at Nanotechnology Lab., Department of Physics, College of Science, University of Basrah, Iraq.2.2 Sensor testing
The sensing behavior of 3-(4-(4-(3-(4-(tetradecyloxy) phenyl)-3-oxoprop-1-enyl)phenoxy)butyl)-1H-imidazole-3-ium (4i) and 3-(4-(4-(3-(4-(tetradecyloxy) phenyl)-3-oxoprop-1-enyl)phenoxy)butyl)-1H-benzo[d]imidazol-3-ium (5i) compounds was studied by the method described below. The sensing behavior of LC compounds was tested by the same method. Compound 4i will be presented as an example.In order to prepare a thin film of compound 4i, 0.05 g of 4i was dissolved in 15 ml of DMF and then the drop-casting technique was applied to deposit the compound 4i onto a silica wafer substrate by taking a solution using a pipette and putting 5 drops onto a silica wafer substrate, which was first cleaned by the typical ultrasonic method to remove the impurities and organic materials on the surface.42
Interdigitated aluminum ohmic metal contacts are deposited on the 4i films by the thermal evaporation technique to fabricate the gas sensor.43
The experimental setup prepared for the gas sensor testing system is suitable to determine the sensitivity parameter mainly the response time and recovery time of the fabricated 4i gas sensor detector. It consists of a cylindrical stainless-steel test chamber with an effective volume of 2649 cm3, and it has an inlet for permitting the tested gas to flow in and an air admittance valve to permit the flow of atmospheric air after evacuation. The hotplate and K-type thermocouple were placed inside the chamber to control the operating temperature. The chamber was evacuated before pumping a mixture of gas and air as test gas into it. A multi-pin electric power feed through was used to transfer the electrical power to the hotplate, as well as to feed the electrical signals of a K-type thermocouple and tested sample to a PC-interfaced digital multi-meter. The mixed gas is fed by zero air and test gas through a flow meter and needle valve arrangement. The mixed gas is fed through a tube over the sensor inside the test chamber to give the real sensitivity.44,45
The operation of the test is as follows. The sensor was placed on the heater inside the chamber. The conductive aluminum sheet was used to make electrical connections between the pin feedthrough and the sensor. A bias voltage of 10 volts was applied between the electrodes. The tested sample was placed on a hotplate inside the chamber, and a temperature controller was used in order to set the sensor to a desired operating temperature. The test chamber was evacuated to approximately 1 mbar with a rotary pump. The flow rate of the air and tested gas was set using the needle valves, and the volumetric concentration of 3 ppm test gas in dry air was installed. In order to register the variation of the sensor conductance (reciprocal of resistance) exposed to a predetermined air-test gas mixing ratio, the PC-interfaced digital multi-meter of type UNI-UT81B was used. At the first time the digital multi-meter records the biasing current of air flow, after that the testing gas is switched on, and after several seconds the current has low variation, and then the test gas is switched off to record the recovery time.46
The testing gases used to study the sensing behavior of compounds 4i and 5i are a reducing gas (NH3) and oxidative gas (NO2).
3. Results and discussions
3.1 Liquid crystalline behavior
The mesomorphic properties of the prepared compounds were investigated by DSC and POM. The phase transition and the associated enthalpy changes were determined for the series of prepared compounds using DSC operating at a scanning rate of ±5 °C min−1 on the heating and cooling cycles. The corresponding detected mesophases were identified by observing their texture through POM. The phase transition temperature with the associated enthalpies and mesophase texture are tabulated in Table 1.| No. | Spacer/R | Heating/cooling scan (onest °C min−1 [°C]/ΔH kJ mol−1) |
|---|---|---|
| a Note: Cr1/Cr2 = crystal to crystal transition; SmA = smectic A phase; Iso = isotropic phase. | ||
| 4a | Butane/6 | Cr 156.1 (34.90) Iso 176.5 |
| Iso 160.9 (−29.90) Cr | ||
| 4b | Butane/7 | Cr 149.2 (26.20) Iso 174.7 |
| Iso 155.3 (−51.80) Cr | ||
| 4c | Butane/8 | Cr 145.2 (68.20) Iso 170.5 |
| Iso 151.7 (−29.90) Cr | ||
| 4d | Butane/9 | Cr 142.1 (26.67) Iso 162.7 |
| Iso 149.3 (−19.40) Cr | ||
| 4e | Butane/10 | Cr 129.0 (31.29) Iso 156.0 |
| Iso 140.2 (−51.20) Cr | ||
| 4f | Butane/11 | Cr1 118.5 (47.18) Cr2 146.1 (36.30) SmA 158.2 (4.61) Iso 164.2 |
| Iso 161.3 (−0.9) SmA 134.6 (−56.01) Cr2 121.3 (−41.10) Cr1 | ||
| 4g | Butane/12 | Cr1 109.2 (28.79) Cr2 128.9 (30.22) SmA 143.1(1.90) Iso 156.0 |
| Iso 150.3 (−4.5) SmA 133.4(-40.1) Cr2 115.6 (−37.18) Cr1 | ||
| 4h | Butane/13 | Cr1 108.20 (−35.61) Cr2 130.80 (−19.60) SmA 142.6 (6.8) Iso 158.7 |
| Iso 152.8 (−3.2) SmA 125.6 (−28.1) Cr2 99.56 (−41.1) Cr1 | ||
| 4i | Butane/14 | Cr1 84.0 (20.46) Cr2 96.6 (18.79) SmA 139.87 (0.91) Iso 150.5 |
| Iso 141.20 (−1.20) SmA 122.20 (29.01) Cr2 86.30 (−30.69) Cr1 | ||
| 5a | Hexane/6 | Cr1 140.1 (45.1) Cr2167.4 (30.9) Iso 181.3 |
| Iso 174.4 (−25.30) Cr2 153.2 (−68.9) Cr1 | ||
| 5b | Hexane/7 | Cr1 135.4 (59.23) Cr2 166.7 (89.80) Iso 179.1 |
| Iso 175.2 (−77.20) Cr2 150.7 (−60.23) Cr1 | ||
| 5c | Hexane/8 | Cr1 127.1 (50.12) Cr2163.9 (63.20) Iso 171.7 |
| Iso 167.5 (−40.90) Cr2 151.8 (−62.11) Cr1 | ||
| 5d | Hexane/9 | Cr1 120.4 (38.90) Cr2 144.9 (67.50) Iso 168.2 °C |
| Iso 162.4 (−3.57) SmA 140.7 (−72.90) Cr | ||
| 5e | Hexane/10 | Cr 121.45 (67.30) SmA 137.89 (7.81) Iso 154.7 |
| Iso 148.45 (−0.68) SmA 125.20 (−48.40) Cr | ||
| 5f | Hexane/11 | Cr1 125.6 (66.11) Cr2 138.9 (49.90) SmA 154.6 (8.90) Iso 167.0 |
| Iso 163.89 (−0.97) SmA 147.5 (−52.20) Cr2 122.16 (67.20) Cr1 | ||
| 5g | Hexane/12 | Cr1 98.9 (39.80) Cr2 119.70 (61.20) SmA 139.30 (2.89) Iso 158.2 |
| Iso 153.5 (−7.80) SmA 137.4 (41.03) Cr | ||
| 5h | Hexane/13 | Cr1 90.7 (80.90) Cr2114.70 (76.30) SmA 140.5 (5.12) Iso 160.2 |
| Iso 144.3 (−2.11) SmA 120.30 (40.89) Cr2 96.4 (70.40) Cr1 | ||
| 5i | Hexane/14 | Cr1 83.0 (65.46) Cr2 93.6 (70.34) SmA 143.87 (0.91) Iso 161.5 °C |
| Iso 137.20 (−13.56) SmA 118.89 (28.12) Cr2 81.30 (−29.19) Cr1 | ||
| 6a | Butane/6 | Cr1 130.8 (27.6) Cr2 148.8 (50.91) Iso 176.6 |
| Iso 162.5 (−47.10) Cr2 138.6 (−55.10) Cr1 | ||
| 6b | Butane/7 | Cr1 132.5 (69.20) Cr2 145.2 (73.90) Iso 174.5 °C |
| Iso 164.8 (−51.20) Cr2 144.8 (−72.20) Cr1 | ||
| 6c | Butane/8 | Cr1 121.4 (49.10) Cr2 142.5 (39.89) Iso 167.5 °C |
| Iso 143.7 (−78.90) Cr | ||
| 6d | Butane/9 | Cr 113.8 (56.10) SmA 147.3 (6.78) Iso 165.2 |
| Iso 161.4 (−2.18) SmA 142.3 (−66.90) Cr | ||
| 6e | Butane/10 | Cr 89.7 (29.45) SmA 134.7 (4.36) Iso 153.0 |
| Iso 148.3 (−0.91) SmA 130.4 (−70.3) Cr | ||
| 6f | Butane/11 | Cr1114.7 (61.20) Cr2 133.4 (30.18) SmA 142.1 (7.90) Iso 163.5 |
| Iso 159.8 (−6.10) SmA 137.9 (−67.80) Cr1 105.9 (−40.20) Cr1 | ||
| 6g | Butane/12 | Cr1 120.6 (87.20) Cr2 128.9 (66.90) SmA 146.3 (3.56) Iso 163.3 |
| Iso 160.8 (−2.60) SmA 113.4 (−45.10) Cr2 102.5 (−46.70) Cr1 | ||
| 6h | Butane/13 | Cr1 121.3 (73.20) Cr2 134.6 (38.40) SmA 144.6 (2.20) Iso 162.5 |
| Iso 158.3 (−1.80) SmA 137.5 (−58.9) Cr2 111.2 (−29.0) Cr1 | ||
| 6i | Butane/14 | Cr1 119.7 (65.9) Cr1 132.5 (70.11) SmA 138.7 (5.09) Iso 154.5 |
| Iso 150.3 (−0.97) SmA 131.2 (−57.80) Cr2 119.5 (−68.99) Cr1 | ||
| 7a | Hexane/6 | Cr 120.3 (37.80) Iso 178.7 |
| Iso 146.4 (−45.60) Cr | ||
| 7b | Hexane/7 | Cr 121.3 (70.20) Iso 177.2 |
| Iso 134.3 (−41.27) Cr | ||
| 7c | Hexane/8 | Cr 114.6 (50.34) Iso 176.5 |
| Iso 121.4 (−26.70) Cr | ||
| 7d | Hexane/9 | Cr1 112.6 (28.10) Cr2 149.8 (56.30) 173.2 °C |
| Iso 152.9 (−70.26) Cr2 134.2 (−41.30) Cr1 | ||
| 7e | Hexane/10 | Cr1 105.7 (37.32) Cr2 130.9 (60.20) SmA 151.7 (2.41) Iso 168.0 |
| Iso 165.2 (−0.97) SmA 143.7 (−81.74) Cr2 116.4 (40.11) Cr1 | ||
| 7f | Hexane/11 | Cr 107.5 (50.20) SmA 155.1 (4.20) Iso171.0 |
| Iso 166.2 (−2.11) SmA 143.2 (−40.07) Cr | ||
| 7g | Hexane/12 | Cr1 91.2 (36.50) Cr2 129.7 (61.07) SmA 138.6 (8.11) Iso160.0 |
| Iso 156.2 (−3.20) SmA 132.1 (−41.09) Cr | ||
| 7h | Hexane/13 | Cr1 94.2 (50.26) Cr2 119.2 (30.96) SmA 142.8 (6.81) Iso 166.5 |
| Iso 163.9 (−4.11) SmA 141.7 (38.07) Cr2 108.7 (26.15) Cr1 | ||
| 7i | Hexane/14 | Cr1 98.3 (41.90) Cr2 123.41 (41.06) SmA 147.8 (5.61) Iso 165.5 |
| Iso 161.5 (−2.78) SmA 144.2 (−26.50) Cr2 99.61 (−43.20) Cr1 | ||
In the prepared compounds 4a–4i, 5a–5i, 6a–6i, and 7a–7i, the lower members hardly exhibited mesomorphic properties, while the higher members tended to exhibit enantiotropic mesomorphic properties.
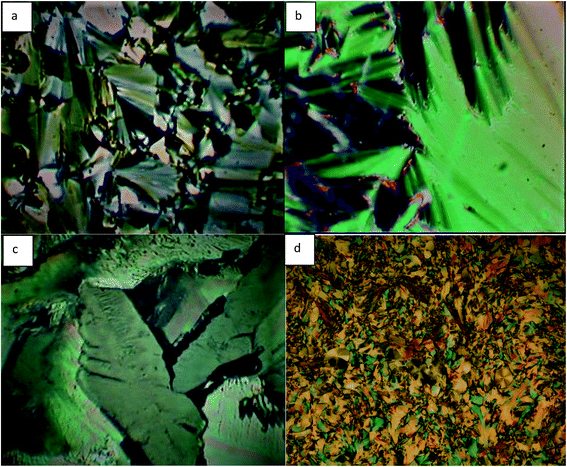
In the first set of compounds 4a–4i having a methylene spacer length n = 2 and terminal alkyl chain varying from C6 to C14, compounds 4a–4e (C6–C10) are hard to exhibit mesomorphic properties, whereas compounds 4f–4i exhibit the SmA mesomorphic property with a mesophase average range of about 20 °C on heating. The DSC thermogram of 4f–4i exhibits the transitions as Cr1–Cr2–SmA–Iso upon heating scan, and reverse as Iso–SmA–Cr2–Cr1 upon cooling scan. Representative DSC scans of compound 4f are depicted in Fig. 1(a), which show Cr1–Cr2 transition at 118.5 °C (ΔH = 47.18). With followed heating, it transformed to SmA mesophase at 146.1 °C (ΔH = 36.30) which indicates Cr2–SmA transition, and then it went to the isotropic state at 158.2 °C (ΔH = 4.61) in heating scans, with the clearing point at 164.2 °C. When cooled from the isotropic state it changed from the isotropic state to crystallized in a reverse sequence for the heating scan, which shows Iso–SmA transition at 161.3 °C (ΔH = −0.9), SmA–Cr2 transition at 134.6 °C (ΔH = −56.01), and Cr2–Cr1 transition at 121.3 °C (ΔH = −41.10), respectively. The optical photomicrograph of compound 4f displays a fan-shape texture of the SmA mesomorphic property during both cooling cycles as depicted in Fig. 2(a). All remained compounds 4g–4i show similar mesomorphic properties.
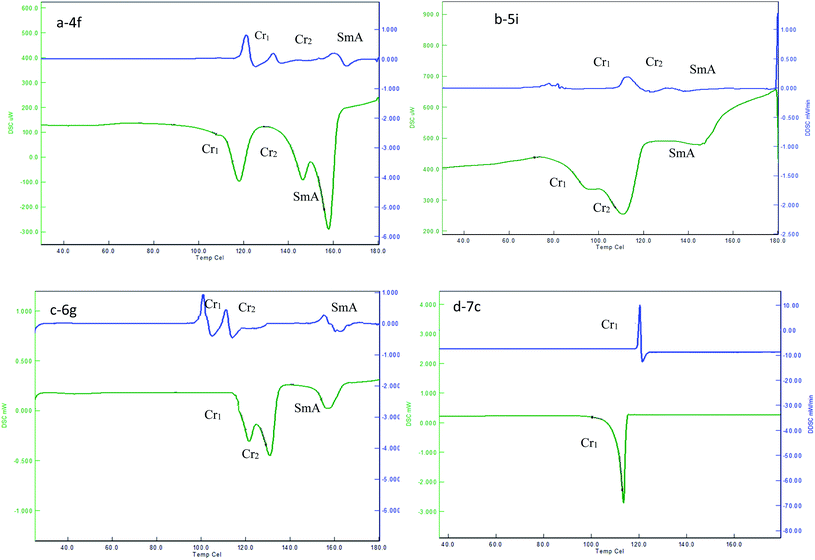 | ||
| Fig. 1 DSC plot showing the heating, and cooling transition temperatures and mesophase range of 4f, 5i, 6g and 7c. | ||
The second set of compounds 5a–5i have a methylene spacer length n = 4 with varied alkyl chain length (C6–C14), and compounds 5a–5c (C6–C8) show crystal–crystal and crystal–isotropic transitions in both heating and cooling scans as Cr1–Cr2–Iso and Iso–Cr2–Cr1, respectively. Compound 5d had Cr1–Cr2 transition at 120.4 °C (ΔH = 38.90), and then went to the isotropic state at 144.9 °C (ΔH = 67.50) on the heating scan, without showing any mesophase. However, when it was cooled from an isotropic state the SmA phase appeared at 162.4 °C (ΔH = −3.57). Compounds 5e–5i tended to exhibit enantiotropic SmA mesophase with a phase range of about 26 °C on heating. The clearing points are decreased from lower members to higher members. The representative DSC graph of compound 5i is shown in Fig. 1(b). For example, it shows a phase transitions sequence Cr1–Cr2–SmA–Iso on heating scan at 83.0 °C (ΔH = 65.46), 93.6 °C (ΔH = 70.34), and 143.87 °C (ΔH = 0.91), respectively, whereas, on cooling scan, it shows a reverse transition sequence as Iso–SmA–Cr2–Cr1. Compound 5e displays a fan-shape texture of SmA phase on heating scans, as depicted in Fig. 2(b). All remained compounds 5f–5h show similar mesomorphic properties.
The third set of compounds 6a–6i have a spacer chain length n = 2 with the terminal alkyl chain range C6–C14. The phase transition temperature and associated enthalpy changes indicated that compounds 6a–6c did not show any mesomorphic property, while compounds 6d–6i exhibit enantiotropic SmA phase. The fan-shape texture of SmA phase for compound 6g upon cooling scan is shown in Fig. 2(c). The DSC thermogram in Fig. 1(c) of compound 6g shows Cr1–Cr2 transition at 120.6 °C (ΔH = 87.20), Cr2–SmA transition at 128.9 °C (ΔH = 66.90), and SmA–Iso transition at 146.3 °C (ΔH = 3.56) in the heating scan, with a clearing point at 163.3 °C, whereas in the cooling scan, the adverse transition was observed at 160.8 °C (ΔH = −2.60), 113.4 °C (ΔH = −45.10), and 102.5 °C (ΔH = −46.70), which corresponds to the Iso–SmA–Cr2–Cr1 phase, respectively. The clearing points are decreased from lower members to higher members. Moreover, the transition temperature of SmA–Iso smoothly decreased with the increase in the terminal chains with an abnormal change for the 6e compound. The mesophase average range is about 20 °C. The remained compounds 6d–6i show similar mesomorphic properties.
In the fourth set of compounds 7a–7i, having a spacer chain length n = 4 and varied terminal alkyl chain length (C6–C14), compounds 7a–7d hardly exhibit mesomorphic properties. As a representative, DSC scans of compound 7c are shown in Fig. 1(d), which exhibit one endothermic peak at 114.6 °C (50.34) and one exothermic peak at 121.4 °C (−26.70). These peaks were detected for Cr-Iso transition in heating, and Iso-Cr transition in cooling. Compounds 7e–7i showed an enantiotropic SmA phase. An optical micrograph of compound 7g is depicted in Fig. 2(d); it displays a fan-shape texture during the heating cycle at 129.7 (61.07) and 156.2 °C (−3.20), respectively, with the mesophase average range of about 29 °C. The remained compounds 7e–7i show similar mesomorphic properties.
Plots of the transition temperature of series 4a–4i, 5a–5i, 6a–6i, and 7a–7i as a function of terminal alkyl chain length are shown in Fig. 3(a–d), indicating that the mesophase average ranges of compounds 5e–5i and 7e–7i are larger than the average ranges of the compounds 4a–4i and 6a–6i. This phenomenon of the four sets of prepared compounds is in agreement with the conventional behavior of liquid crystal dimers, where smectic behavior is favored with increasing spacer length.47,48 The variation in mesomorphic properties of compounds in the same series is observed with changing the number of carbon atoms in the terminal alkyl chain. The transition temperatures of the four sets of compounds are found to decrease with increasing terminal alkyl chain length. Due to the flexibility of alkyl chains, they tend to disrupt the lateral core–core interaction, which leads to a reduction of the transition temperature.49–51 Moreover, in the present four series, the lower member did not show LC properties, while the higher member showed smectic A mesophase enantiotropically. This phenomenon can be attributed to the magnitudes of anisotropic forces of intermolecular cohesion and closeness.52,53
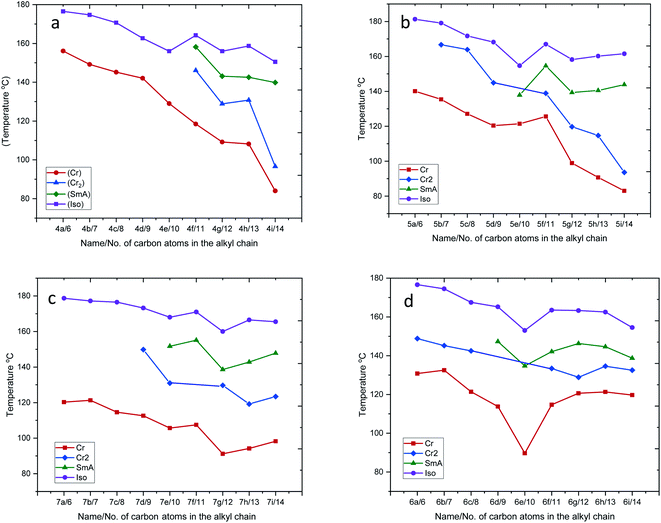 | ||
| Fig. 3 Plot of transition temperatures vs. numbers of carbon atoms in the alkyl chain for series 4a–4i, 5a–5i, 6a–6i and 7a–7i. | ||
3.2 Photoluminescence (PL) study
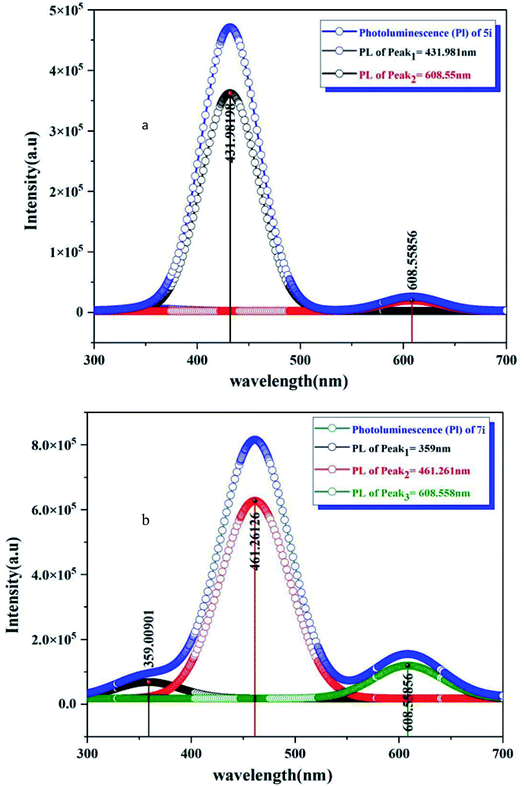
The PL spectra of the prepared compounds were recorded in DMF as a solvent, at a wavelength λ = 300–750 nm. The spectra of representative compounds 5i and 7i are shown in Fig. 4 (a) and (b), which were selected as an example because the PL spectra of compounds 5a–5i and 7a–7i are analogous. However, the varied terminal alkyl chain length has an insignificant influence on their emission bands.54The emission spectra of compounds 5i and 6i exhibit a strong band in the range of λ = 420–500 nm, which is centered at λ = 431 nm and λ = 461 nm for compounds 5i and 7i, respectively. These emission bands can be attributed to π–π* electronic transition involving the whole electronic system of the compounds. Here, the emission band of compound 7i was red-shifted by about 30 nm when compared to the emission band of compound 5i. These differences can be attributed to the different electronic structures between compounds 5i and 7i.55,56 Moreover, the PL spectra show two other weak emission bands at λ = 359 nm and λ = 608 nm. The band at 359 nm corresponds to the near band edge (NBE) and deep level emission (DLE),57 while the orange-red emission at λ = 608 nm can be attributed to intermolecular charge transfer (ICT) and π–π stacking in the dimer system.58,59
The emission in the blue region λ = 420–500 nm reveals that the material has blue light emission properties, which can be utilized in a potential application, such as OLED materials, fluorescent probes in biological applications, and biotags for biological sensing applications.60–62
3.3 Sensing behavior
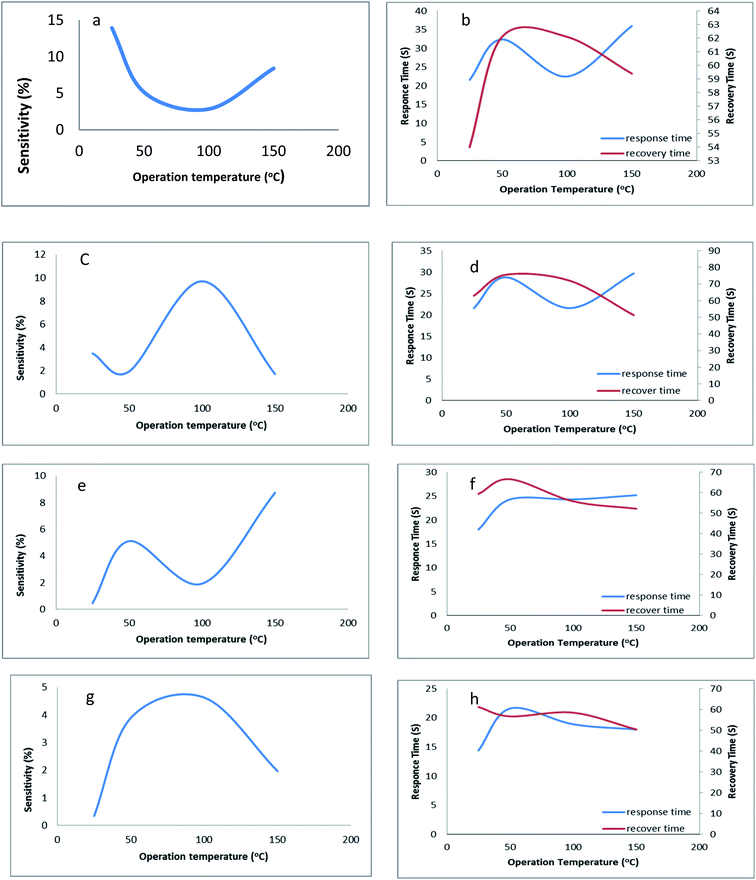
The sensing behavior of LC compounds (4i) and (5i) was investigated by measuring the sensing parameters. The resistance of the sensor, the sensitivity S%, the response time T90, and the recovery time were measured to study the sensing behavior of these LC-based sensors. The n-type silicon substrate was used to fabricate the thin films of the LC/n-Si chemi-resistive-gas sensor. The sensitivity of both 4i and 5i based sensors has been studied for the reduction of NH3 gas in addition to the oxidization of the NO2 gas.The change in the sensitivity of 4i/n-Si concerning the operating temperature is shown in Fig. 5(a). The exposure of a 4i-based sensor to the NH3 gas leads to a decrease in the resistance of the sensor (increase in the sensitivity). The sensitivity curve of the 4i/n-Si includes three main regions. In the first operating temperatures (25–50 °C), the sensitivity of the sensor is drastically decreased. After that, the sensitivity became approximately constant in the second region (operating temperature 50–100 °C). The minimum value of the sensitivity was recorded at 100 °C. On further heating up to 100 °C, the sensitivity increased again. In general, the 4i/n-Si sensors exhibit a maximum sensitivity of 13.97% and a minimum response time of 21.6 s. Also, the recovery time was 54 s, at room temperature (Fig. 5(b)).
In the case of a 5i-based sensor (Fig. 5(c)), the exposure to the reducing gas leads to a reduction in the resistance of the sensor, which reflects the increase in the sensitivity. The sensitivity of 5i/n-Si contains three main sensing regions. In the first region, which is operating at temperatures between 25 and 40 °C, the sensitivity decreased to reach the minimum value of 1.7%. After that, in the second region 40–100 °C, the sensitivity increases to reach a maximum value of 9.70%, while at the final operating temperatures (100–150 °C), the sensitivity was decreased again to hit the minimum value of 1.71% at 150 °C. In addition, the response and recovery times were 21.6 s and 72 s, respectively (Fig. 5(d)).
The sensing profile of 4i/n-Si contains the following three regions. In the first operating temperatures 25–50 °C, the sensitivity was observed to increase from its minimum value to reach the first peak of 5.11% at a temperature of 50 °C. Then with the increase in temperature from 50 °C to 100 °C, the sensitivity decreased to reach approximately 2% at 95 °C. In the final operating region from 100 to 150 °C, the sensitivity was significantly increased to hit its highest value of 8.73% at 150 °C. The sensitivity was observed at two temperatures as shown in Fig. 5(e). The first was at 50 °C where the sensitivity equals 5.11%, with a response time and recovery time of 24.3 s and 66.6 s respectively. The second is the maximum sensitivity with a response time of 24.2 s and recovery time of 52.2 s at 150 °C (Fig. 5(f)).
The exposure of a 5i-based sensor to an oxidizing gas leads to a decrease in the sensitivity. The sensitivity of 5c/n-Si increased significantly from its minimum value at an operating temperature of 25 °C to the temperature of 50 °C. Then in the second operating temperature range from 50 to 100 °C, the sensitivity slightly increased to reach its maximum value of 4.62% at a temperature of 85 °C. The response and recovery times were 18.9 s and 58.5 s (Fig. 5(g) and (h)). Finally, increasing the operating temperature over 100 °C leads to a decrease in the sensitivity to reach its final value of 1.96% at 150 °C.
The behavior of liquid crystal-based sensors is similar to that of other n-type semiconductor sensors in terms of obtaining broad selectivity. The broad selectivity provides the advantage of simultaneous response to all the reducing and oxidizing gases that are presented in the environment. The selectivity can be improved by modulation of operation temperature.
The mechanism of the LC-based gas sensor can be explained as follows. The reducing gas reacts with the surface of the n-type semiconductor and donates the electrons. This, in turn, increases the electron concentration of the n-type sensing material and then adsorbed on its surface. Therefore, the resistance of the sensor decreases because the majority of the charge carriers are electrons in the n-type semiconductor sensor, while when the oxidizing gas is exposed to the n-type semiconductor surface, it accepts electrons from the semiconductor material and adsorbs them over its surface. Then depletion of charge carriers takes place which increases the resistance.63
The easy change in the alignment of the LC molecules on the surface as a result of the presence of gas molecules leads to increasing the diffusion of gas molecules. This, in turn, increased the number/rate of the redox reactions. The change in the alignment of LC participants enhanced the sensitivity of the sensor. This is because the conductivity (and other physical properties) of LC molecules depends on the direction of performing the measurement. On the other hand, the presence of the imidazolium moiety in liquid crystal molecules leads to formation of hydrogen bonding with the ammonia gas molecules and increases the adsorption of gas molecules. Also, the formation of hydrogen bonds between NH3 and imidazolium moiety has a contribution to the change of LC alignment.64,65
The resistance measured across n-type semiconductor-based chemi-resistive sensors is the sum of three sources of electrical resistance. The first one is the electrical resistance of the individual grains to the flow of electrons. The second is the resistance/barrier through the grain boundaries of the material. These two electrical resistances decrease with temperature. Finally, the third is the electrical resistance of the surface region of the material covering the grains, which depends on the interaction between the n-type semiconductor material surface and the reducing or oxidizing gases that are exposed to the environment.66
The redox reaction, which occurs over the surface of the sensing material, is a thermally activated process that increases with temperature. Increasing the temperature leads to decreasing the residence-time/desorption of the gas molecules over the sensing material surface. This reduces the reaction due to the high thermal/kinetic energy imparted to the gas molecule. These competing processes result in a peak/maximum in the temperature dependence curve, which is dependent on the nature of the gas molecules and the sensing surface characteristics.67
In the current work, at room temperature, the sensing behavior of the 4i/n-Si sensor exhibited a high sensitivity toward NH3 with a short response and recovery time. Also, it showed an acceptable sensitivity to the lower concentration of ammonia gas compared to previous results obtained from similar ionic liquid crystals and other semiconductor metal oxide sensors.68 Furthermore, the 5i/n-Si sensor exhibited a lower sensitivity for ammonia gas compared to the 4i/n-Si sensor. This result might be due to the steric hindrance of the benzimidazole moiety. In addition, the hydrogen bonding of benzimidazole with gas molecules is stronger than the hydrogen bonding formed by the imidazole moiety.9,69 Moreover, the sensor can show sensitivity toward NO2 gas through the operation temperature change. However, the sensitivity toward the oxidizing gas NO2 is lower than the sensitivity toward the reducing gas NH3.
3.4 X-ray diffraction studies
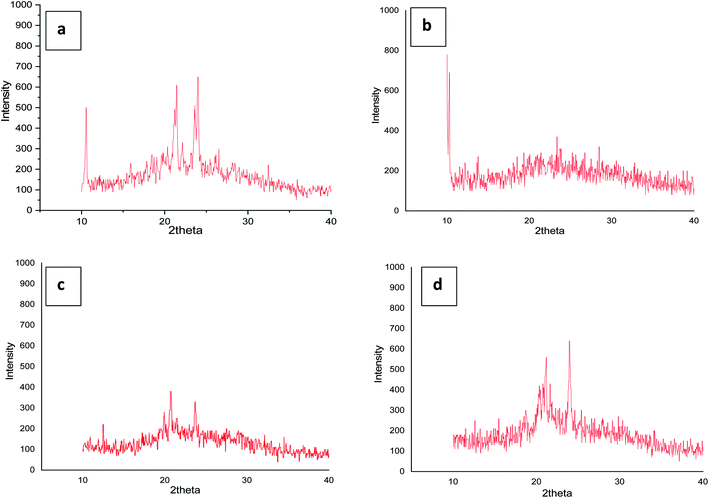
To confirm the mesophase type exhibited by the four series of compounds representative analysis of compounds (a) 4g, (b) 5e, (c) 6g and (d) 7g was carried out (Fig. 6) at their LC transition states respectively in a wide angle X-ray instrument. Compound 4g shows comparatively sharp reflections in the wide-angle region for the SmA phase. Compound 5e also resembles the SmA phase (data have been tabulated in the ESI†). In the same way for compounds 6g and 7g in respective series the same phenomena were observed. Moreover, the room temperature crystalline state gives many reflections which confirm the crystalline state and the liquid crystalline phase gives reflection peaks in the small angle region and two sharp diffused scattering peaks in the wide-angle region which established the more ordered arrangement of molecules. The strong reflection at °2Th = 21–28 was an important indicator for the existence of a positional order of the molecules within the smectic layer. Likewise, it's not unusual to find unclear patterns in the XRD of ionic liquid crystals since hydrophobic layers and ionic layers have different degrees of ordering and these phases are labelled SmX.70,71 However, the local optical images show that the mesophases exhibited by the ionic liquid crystal compounds in this study are SmA.4. Conclusion
In this paper the synthesis, characterization, liquid crystalline behavior and sensing of novel ionic liquid crystal imidazolium and benzimidazolium salts have been presented. Compounds with short terminal alkyl-chains reported in this paper are non-mesogenic. Compounds with longer terminal alkyl-chains exhibit liquid crystal properties and the smectic A phase is observed. The PL spectra of the prepared compounds were recorded. Sensing behavior for the two compounds was investigated and showed acceptable sensitivity toward NH3 and NO2 gases.Conflicts of interest
No potential conflict of interest was reported by the authors.Acknowledgements
The author AK-T. M would like to thank Professor John West, Liquid Crystal Institute, Kent State University, USA. We also would like to thank Dr Mazin Auny Mahdi for supporting us to measure PL spectra in Nanotechnology lab., Department of Physics, College of Science, University of Basrah, Iraq.References
- I. Zama, G. Gorni, V. Borzatta, M. C. Cassani, C. Crupi and G. D. Marco, J. Mol. Liq., 2016, 223, 749–753, DOI:10.1016/j.molliq.2016.08.101.
- Y. Fang, L. Chen, L. Gao and Z. Yan, J. Mol. Liq., 2019, 294, 111637, DOI:10.1016/j.molliq.2019.111637.
- K. M. Lee, Ch. K. Leeb and I. J. B. Lin, Cryst. Eng. Comm., 2010, 12, 4347–4351, 10.1039/c0ce00105h.
- A. E. Bradley, C. Hardacre, J. D. Holbrey, S. Johnston, S. E. J. McMath and M. Nieuwenhuyzen, Chem. Mater., 2002, 14, 629–635, DOI:10.1021/cm010542v.
- C. W. Yeap, R. A. Haque, W. S. Yam and M. R. Razali, Liq. Cryst., 2018, 45, 1210–1222, DOI:10.1080/02678292.2018.1426127.
- K. Goossens, K. Lava, Ch. W. Bielawski and K. Binnemans, Chem. Rev., 2016, 116, 4643, DOI:10.1021/cr400334b.
- K. Salikolimi, A. A. Sudhakar and Y. Ishida, Langmuir, 2020, 36, 11702–11731, DOI:10.1021/acs.langmuir.0c01935.
- Ch. J. Bowlas, D. W. Bruce and K. R. Seddon, Chem. Commun., 1996, 1625–1626, 10.1039/CC9960001625.
- J. Yan, M. F. Rodrigues, Z. Song, H. Li, H. Xu, H. Liu, J. Wu, Y. Xu, Y. Song, Y. Liu, P. Yu, W. Yang, R. Vajtai, H. Li, Sh. Yuan and P. M. Ajayan, Adv. Funct. Mater., 2017, 27, 1700653, DOI:10.1002/adfm.201700653.
- N. Gil-González, F. Benito-Lopez, E. Castaño and M. C. Morant-Miñana, Microchim. Acta, 2020, 187, 638, DOI:10.1007/s00604-020-04625-9.
- N. Rezki, F. F. Al-blewi, S. A. Al-Sodies, A. Kh. Alnuzha, M. Messali, I. Ali and M. R. Aouad, ACS Omega, 2020, 5, 4807–4815, DOI:10.1021/acsomega.9b03468.
- S. Celik, A. T. Albayrak, S. Akyuz and A. E. Ozel, J. Biomol. Struct. Dyn., 2020, 38, 1354–1364, DOI:10.1080/07391102.2019.1604263.
- K. S. Egorova, E. G. Gordeev and V. P. Ananikov, Chem. Rev., 2017, 117, 7132–7189, DOI:10.1021/acs.chemrev.6b00562.
- P. Bansode, P. Patil, P. Choudhari, M. Bhatia, A. Birajdar, I. Somasundaram and G. Rashinkar, J. Mol. Liq., 2019, 290, 111182, DOI:10.1016/j.molliq.2019.111182.
- A. Š. Vuk, V. Jovanovski, A. P. Villard, I. Jerman and B. Orel, Sol. Energy Mater. Sol. Cells, 2008, 92, 126–135, DOI:10.1016/j.solmat.2007.01.023.
- D. S. Kim and D. K. Yoon, J. Soc. Inf. Disp., 2018, 19, 7–23, DOI:10.1080/15980316.2017.1410500.
- S. C. Jeng, Liq. Cryst., 2020, 47, 1223–1231, DOI:10.1080/02678292.2020.1733114.
- T. Tian, Q. Hu, Y. Wang, Y. Gao and L. Yu, Interfaces, Langmuir, 2016, 32, 11745–11753, DOI:10.1021/acs.langmuir.6b02756.
- T. Cremer, C. Kolbeck, R. J. Kevin, N. Paape, R. Wolfel, P. S. Schulz, P. Wasserscheid, H. Weber, J. Thar and B. Kirchner, Chem. –Eur. J., 2010, 16, 9018–9033, DOI:10.1002/chem.201001032.
- R. J. Carlton, J. T. Hunter, D. S. Miller, R. Abbasi, P. C. Mushenheim, L. N. Tan and N. L. Abbott, Liq. Cryst. Rev., 2013, 1, 29–51, DOI:10.1080/21680396.2013.769310.
- H. Ma, Q. Kang, T. Wang and L. Yu, Colloids Surf., B, 2019, 173, 616–622, DOI:10.1016/j.colsurfb.2018.10.036.
- L. Sutarlie and K. L. Yang, Lab Chip, 2011, 1, 4093–4098, 10.1039/c1lc20460b.
- S. Residori, U. Bortolozzo, A. Peigne, S. Molin, P. Nouchi, D. Dolfi and J. P. Huignard, Liq. Cryst., 2016, 9940, 99400, DOI:10.1117/12.2237579.
- K. L. Yang, K. Cadwell and N. L. Abbott, Phys. Chem. B., 2004, 108, 20180–20186, DOI:10.1021/jp0470391.
- A. Saha, Y. Tanaka, Y. Han, C. M. W. Bastiaansen, D. J. Broer and R. P. Sijbesma, Chem. Commun., 2012, 48, 4579–4581, 10.1039/c2cc16934g.
- D. A. Winterbottom, R. Narayanaswamy and I. M. Raimundo, Sens. Actuators B., 2003, 90, 52–57, DOI:10.1016/S0925-4005(03)00021-2.
- N. Kirchner, L. Zedler, T. G. Mayerhofer and G. J. Mohr, Chem. Commun., 2006, 14, 1512–1514, 10.1039/b517768e.
- L. Pibiri, A. Beneduci, M. Carraro, V. Causin, G. Casella, G. Chidichimo, A. Pace, A. Riccobono and G. Saielli, J. Mater. Chem. C, 2019, 7, 7974–7983, 10.1039/c9tc01697j.
- P. K. Bhowmik, O. Noori, S. L. Chen, H. Han, M. R. Fisch, Ch. M. Robb and A. M. Felipe, J. Mol. Liq., 2021, 115370, DOI:10.1016/j.molliq.2021.115370.
- W. Cao, B. Senthikumar, V. Causin, V. P. Swamy, Y. Wang and G. Saielli, Soft Matter, 2020, 16, 411–420 RSC.
- R. Forschner, J. Knellen, K. Bader, C. Muller, W. Frey, A. Kohn, Y. Molard, F. Giesselmann and S. Laschat, Chem. –Eur. J., 2019, 25, 12966 CrossRef CAS PubMed.
- L. Zhang, X. Peng, L. Guri, V. Damu, R. Geng and C. Zhou, Med. Res. Rev., 2014, 34, 340–437, DOI:10.1002/med.21290.
- B. Narasimhan, D. Sharma and P. Kumar, Med. Chem. Res., 2010, 20, 1119–1140, DOI:10.1007/s00044-010-9472-5.
- Ch. H. Zhou, L. Gan, Y. Zhang, F. Zhang, G. Z. Wang, L. Jin and R. X. Geng, Sci. China, Ser. B: Chem., 2009, 52, 415–458, DOI:10.1007/s11426-009-0103-2.
- C. H. Zhou, Y. Y. Zhang, C. Y. Yan, K. Wan, L. L. Gan and Y. Shi, Anti-Cancer Agents Med. Chem., 2010, 10, 371–395 CrossRef CAS PubMed.
- M. J. Webber and R. Langer, Chem. Soc. Rev., 2017, 46, 6600–6620, 10.1039/c7cs00391a.
- D. A. Kuznetsova, D. R. Gabrakhmanov, S. S. Lukashenko, A. D. Voloshina, A. S. Sapunova, N. V. Kulik, I. R. Nizameev, M. K. Kadirov, R. R. Kashapov and L. Y. Zakharova, J. Mol. Liq., 2019, 289, 111058, DOI:10.1016/j.molliq.2019.111058.
- A. T. Mohammad, O. S. Khalefa, H. T. Srinivasa and W. A. Ameen, Liq. Cryst., 2021, 48, 1140–1150, DOI:10.1080/02678292.2020.1849834.
- G. Y. Yeap, A. T. Mohammad and H. Osman, J. Mol. Struct., 2010, 982, 33–44, DOI:10.1016/j.molstruc.2010.07.043.
- H. T. Srinivasa, B. S. Palakshamurthy, M. A. Venkatesha and A. T. Mohammad, Liq. Cryst., 2019, 92, 1043–1053, DOI:10.1080/01411594.2019.1669034.
- Ch. V. Yelamaggad, N. L. Bonde, A. S. Achalkumar, D. S. Shankar Rao, S. K. Prasad and A. K. Prajapati, Chem. Mater., 2007, 19, 2463–2472, DOI:10.1021/cm0625880.
- M. H. Hasan, F. T. Ibrahim and H. N. Abed, J. Eng. Appl. Sci., 2018, 13, 1175–1180, DOI:10.36478/jeasci.2018.11075.11080.
- A. A. Ramadhan, F. T. Ibrahim and E. M. Nasir, J. Phys.: Conf. Ser., 2020, 1660, 012093, DOI:10.1088/1742-6596/1660/1/012093.
- F. T. Ibrahim and S. E. Abdughani, Indian J. Phys., 2020, 94, 575–582, DOI:10.1007/s12648-019-01492-w.
- Q. G. Al-zaidi, A. M. Suhail and W. R. Al-azawi, Appl. Phys. Res., 2011, 3, 89–99, DOI:10.5539/apr.v3n1p89.
- A. N. Naje, R. R. Ibraheem and F. T. Ibrahim, Photonic Sens., 2016, 6, 153–157, DOI:10.1007/s13320-016-0304-1.
- R. W. Date, C. T. Imrie, G. R. Luckhurst and J. M. Seddon, Liq. Cryst., 1992, 12, 203–238, DOI:10.1080/02678299208030393.
- A. T. Mohammad, H. T. Srinivasa, S. Hariprasad and G.-Y. Yeap, Tetrahedron, 2016, 72, 3948–3957, DOI:10.1016/j.tet.2016.05.024.
- A. J. M. Al-Karawi, A. J. Hammood, A. A. Awad, A. B. OmarAli, S. R. Khudhaier, Dh. T. A. Al- Heetimi and S. Gh. Majeed, Liq. Cryst., 2018, 45, 1603–1619, DOI:10.1080/02678292.2018.1446553.
- X. Cheng, X. Bai, Sh. Jing, H. Ebert, M. Prehm and C. Tschierske, Chem. –Eur. J., 2010, 16, 4588–4601, DOI:10.1002/chem.200903210.
- M. Hagar, H. A. Ahmed, T. H. El-Sayed and R. Alnoman, J. Mol. Liq., 2019, 285, 96–105, DOI:10.1016/j.molliq.2019.04.083.
- H. T. Srinivasa and S. Kumar, Liq. Cryst., 2017, 44, 1506–1514, DOI:10.1080/02678292.2017.1290283.
- V. S. Sharma and R. B. Patel, Mol. Cryst. Liq. Cryst., 2017, 643, 52–61, DOI:10.1080/15421406.2016.1262689.
- T. N. Ahipa and A. V. Adhikari, New J. Chem., 2014, 38, 5018–5029, 10.1039/c4nj00911h.
- A. Ghouili, M. Dusek, V. Petricek, T. B. Ayed and R. B. Hassen, J. Phys. Chem. Solids, 2014, 75, 188–193, DOI:10.1016/j.jpcs.2013.09.011.
- D.-P. Gong, T.-B. Gao, D.-K. Cao and M. D. Ward, Dalton Trans., 2017, 46, 275–286, 10.1039/c6dt04091h.
- P. P. Vinaya, A. N. Prabhu, K. S. Bhatb and V. Upadhyaya, Opt. Mater., 2019, 89, 419–429, DOI:10.1016/j.optmat.2019.01.061.
- Y. Shen, Z. Zhang, H. Liu, Y. Yan, Sh. Zhang, B. Yang and Y. Ma, J. Phys. Chem. C, 2019, 123, 13047–13056, DOI:10.1021/acs.jpcc.9b02447.
- C. Shruthi, V. Ravindrachary, B. Guruswamy, D. P. Jagadeesh and J. Goveas, AIP Conf. Proc., 2020, 2244, 060005, DOI:10.1063/5.0009368.
- J. Ch. Jebapriya, D. R. Jonathan, S. Sh. Kirupavathy, R. Ragu and J. Ch. Prasana, Opt. Mater., 2020, 107, 110035, DOI:10.1016/j.optmat.2020.110035.
- L. Lin, M. Rong, F. Luo, D. Chen, Y. Wang and X. Chen, Trends Anal. Chem., 2014, 54, 83–102, DOI:10.1016/j.trac.2013.11.001.
- V. D. B. Bonifácio, V. G. Correia, M. G. Pinho, J. C. Lima and A. Aguiar-Ricardo, Mater. Lett., 2012, 81, 205–208, DOI:10.1016/j.matlet.2012.04.134.
- M. V. Nikolic, V. Milovanovic, Z. Z. Vasiljevic and Z. Stamenkovic, Design, and Application, Sensors, 2020, 20, 6694, DOI:10.3390/s20226694.
- X. Niu, Y. Zhong, R. Chen, F. Wang and D. Luo, Opt. Express, 2017, 25, 13549–13556, DOI:10.1364/oe.25.013549.
- N. Popov, L. W. Honaker, M. Popova, N. Usoltseva, E. K. Mann, A. Jákli and P. Popov, Materials, 2018, 11, 20, DOI:10.3390/ma11010020.
- H. Nazemi, A. Joseph, J. Park and A. Emadi, A Review. Sensors, 2019, 19, 1285, DOI:10.3390/s19061285.
- J. K. Radhakrishnan, M. Kumara and Geetika, Sensors International, 2021, 2, 100059, DOI:10.1016/j.sintl.2020.100059.
- Y. Tang, J. He, X. Gao, T. Yang and X. Zeng, Analyst, 2018, 143, 4136–4146, 10.1039/c8an00577J.
- Y. Chen, L. Li, Y. Yang, H. K. Bisoyi, Y. Jia, J. Ju, Sh. Huang, H. Yu, H. Yang and Q. Li, RSC Adv., 2020, 10, 35873–35877, 10.1039/d0ra06838A.
- M. R. Schenkel, R. Shao, L. A. Robertson, B. R. Wiesenauer, N. A. Clark and D. L. Gin, Liq. Cryst., 2013, 40, 1067–1081, DOI:10.1080/02678292.2013.798692.
- G. Casella, V. Causin, F. Rastrelli and G. Saielli, Phys. Chem. Chem. Phys., 2014, 16, 5048–5051 RSC.
Footnote |
| † Electronic supplementary information (ESI) available. See DOI: 10.1039/d1ra07731g |
| This journal is © The Royal Society of Chemistry 2021 |

