
 Open Access Article
 This Open Access Article is licensed under a Creative Commons Attribution-Non Commercial 3.0 Unported Licence
Study of pyrolysis product distribution characteristics of lignite in the context of electrochemical catalytic gasification
Fan Yang ,
Qingbo Yu*,
Zhenfei Qi and
Qin Qin
,
Qingbo Yu*,
Zhenfei Qi and
Qin Qin
School of Metallurgy, Northeastern University, Shenyang, Liaoning 110819, P.R. China. E-mail: yuqb@smm.neu.edu.cn
First published on 29th November 2021
Abstract
To support the effective utilization of lignite, which is abundant throughout China, and the problems associated with the existing common catalytic methods, electrochemical catalytic coal gasification (ECG) is proposed. As an important process in ECG, electrochemical catalytic pyrolysis (ECP) was studied. ECP experiments were performed on Fuxin coal. The influence of temperature and power (thermal electrons) on the generation of various pyrolysis products was studied. Char and tar production decreased as the temperature and power were increased. However, gaseous production increased with an increase in temperature and power. The thermal evolution and graphitization degree of coal char were increased as the temperature and power were increased. However, the degree of crystallite structure ordering of char and thermal evolution of coal char were still lower in ECP than in common coal pyrolysis (CCP). Unlike temperature, an increase in power increased the fractions of aliphatic and monocyclic aromatic compounds but decreased the fraction of fused-ring compounds. The proportions of CO and H2 in the gaseous products increased with temperature; those of other components decreased. However, the proportion of CO2 decreased with an increase in power, whereas the other components increased. Compared with CCP, ECP was more conducive to the full pyrolysis of coal and the formation of gaseous products. More aliphatic compounds and monocyclic compounds were present in tar produced by ECP than CCP; these were all beneficial to the subsequent gasification reaction. A deeper understanding of the action of thermal electrons on the whole ECG process would be useful.
1. Introduction
The dramatic expansion of the Chinese economy has resulted in an increase in energy demand. China's coal usage accounted for 58.24% of global energy consumption in 2018.1 Even though China's “14th Five-Year Plan” calls for the construction of a clean, low-carbon, safe, and efficient energy system alongside the control of total fossil energy, coal remains the country's principal energy source. In particular, low-rank coals, which are the most abundant coals in China, are important for utilization; however, there are issues with efficiency and CO2 emissions compared with high-rank coals. These coals are difficult to store and transport, and they cannot be burnt directly. At the same time, as an important chemical raw material, coal is a complex heterogeneous structure made up of organic and inorganic macromolecules that may be transformed into usable gases and liquids. As a result, the utilization of efficient coal conversion and cleaning still warrant further study as a means to help meet global criteria for energy saving and emissions reduction.2Gasification, rather than burning, is the most energy-efficient and environmentally friendly method of converting the energy contained in coal into clean fuels and value-added chemicals. It has been a focus of research for many years around the world.3 As a representative third-generation gasification technology, catalytic gasification has the potential to achieve efficient coal conversion at a low thermochemical reaction temperatures.4–6 Catalytic gasification research has largely focused on catalyst development; single-component catalysts, composite catalysts, and disposable catalysts are most common. Single-component and composite catalysts have good catalytic effects. However, high prices and recovery costs, as well as severe corrosion of equipment and secondary pollution of the environment, have hampered their industrialization. Furthermore, disposable catalysts have a lower catalytic efficiency than the typical composite catalysts. As a result, new, environmentally friendly and cost-effective catalytic gasification technology with the ability to improve coal gasification efficiency yet operate at low temperatures is required.
When alternating current flows through a metal wire, electrons flow through it, and some of them leave the metal surface, creating thermal electrons in the gas phase; this is referred to as thermal electron emission.7,8 These thermal electrons can participate in ionic processes on the surface of certain specific materials, such as Ca–Al–O materials.9–17 Thermal electrons can play a crucial role in reduction processes and can be used as an electrochemical catalytic agent. Electrochemical catalytic reforming (ECR), a highly efficient method for reforming bio-oil, was developed from similar experiments. During the ECR process, an electrified Ni–Cr wire is employed to heat the catalyst while simultaneously providing thermal electrons.8,16,18–23 The electric current facilitates the decomposition and reforming of the organic molecules in the bio-oil, as well as the reduction of Ni2+ in the catalyst in the ECR process. The use of thermal electrons significantly improved the carbon conversion rate and hydrogen production. Organic chemicals and inorganic metal compounds, such as XnOm and X-(Fe, Al, Ca, etc.) are abundant in coal and char. Thermal electrons can help to enhancing the gasification process if a current is applied to the coal.
Consequently, a coal electrochemical catalytic gasification (ECG) method has been proposed. The application of this method avoided the problems commonly encountered with conventional catalysts during industrial-scale development, such as extensive equipment corrosion and secondary pollution to the environment. This is an environmentally friendly catalytic method with major industrial advantages. We know that the power grid will produce excess electricity during periods of low demand and that this electricity will be wasted because it cannot be used in time. The electric energy required for electrochemical catalytic reactions could come from this electricity, solving the problem of energy waste during low-demand, and making catalytic methods economically feasible. Moreover, with the increase of the proportion of renewable energy power generation in the future, the applications of this method will become more extensive.
Our prior research24 confirmed the feasibility of ECG; however, it focused mainly on identifying the critical factors of the catalytic function in ECG. Therefore, the effects of thermal electrons on the ECG process need further research. It is well known that coal gasification involves two processes, coal pyrolysis and char gasification, which are well studied.25–28 The pyrolysis of coal is crucial to comprehending the entire coal gasification reaction. However, there has been no study of electrochemical catalytic pyrolysis (ECP). Knowledge of the impact of thermal electrons (power) on the coal char, liquid products, and gaseous products of the pyrolysis process of coal is crucial for a thorough understanding of the entire electrochemical catalytic gasification process.
Therefore, ECP experiments were analyzed in this study. The main aim was to investigate the influences of temperature and thermal electrons (power) on various pyrolysis products (char, tar, and gaseous products) in the ECP of coal. The structural characteristics of char and the composition of liquid products and gaseous products generated under different power conditions were studied.
2. Experimental
2.1 Coal sample preparation and characterization
To prepare the coal samples, Fuxin (FX) coal, which is low-grade lignite, was selected. The coal samples were dried at 50 °C for 24 h and then ground and sieved with standard sieves to obtain an average particle size of approximately 165 μm for the ECP experiments.The coal samples were analyzed with an automatic proximate analyzer (5E-MAG6700), Changsha Kaiyuan Instruments, China using a TGA technique. The temperature program was set in accordance with the guidelines of the China National Standard GB/T 212-2008. The temperature program comprised sample loading and weighing at 25 °C, heating to 110 °C, holding for 10 min (test of moisture in coal sample), and then heating to 950 °C with the temperature held until constant weight was achieved in nitrogen (test of volatile matter in coal sample). Then the sample atmosphere was switched to air. When the weight was again constant after the combustion of the fixed carbon component, the analysis was ended. The analysis results were output automatically. The ultimate analysis of coal samples was performed in the CHNS/O Elemental Analyzer (Vario EL III, Elementar, Germany). The principle of ultimate analysis was the dynamic combustion method. First, a certain mass of sample was weighed. Second, the test program was opened and the standard sample was selected: when CHNS mode was used, benzene sulfonic acid was selected as the standard sample; when O mode was used, benzoic acid was selected as the standard sample. Then, the furnace temperature of each section was set (CHNS mode: 1150 °C for furnace 1, 850 °C for furnace 2, 0 °C for furnace 3; O mode: 1150 °C for furnace 1, 0 °C for furnace 2, 0 °C for furnace 3). The weight of sample was input and the determination was started. The analysis results were output by computer. The inorganic chemical composition of coal was determined by using an X-ray fluoroscope (XRF, ZSX100e, Japan). The results of the proximate and ultimate analyses of coal samples are shown in Table 1. The chemical composition of coal is shown in Table 2.
| Sample | Proximate analysis (wt%) | Ultimate analysis (wt%) | |||||||
|---|---|---|---|---|---|---|---|---|---|
| Moisture | Volatile matter | Fixed carbon | Ash | C | H | O* | N | S | |
| a adAir-dried basis, *by difference. | |||||||||
| FX | 3.130 | 32.779 | 49.801 | 14.300 | 52.270 | 4.204 | 23.796 | 1.090 | 1.210 |
| Sample | Inorganic chemical composition (wt%) | ||||||||
|---|---|---|---|---|---|---|---|---|---|
| SiO2 | SO3 | Al2O3 | Fe2O3 | K2O | CaO | TiO2 | Na2O | MgO | |
| a adAir-dried basis. | |||||||||
| FX | 6.581 | 3.025 | 2.509 | 1.157 | 0.720 | 0.297 | 0.217 | 0.136 | 0.129 |
2.2 Reaction system and operating procedure
A schematic of the ECP system is shown in Fig. 1. It consists of a gas supply system, a mobile reactor, a Ni–Cr wire inside the reactor, a voltage regulator for controlling power given to the Ni–Cr wire, an external heater ensuring constant experiment temperature, and a gas analyzer. A computer was used to control, record, and analyze the experimental data.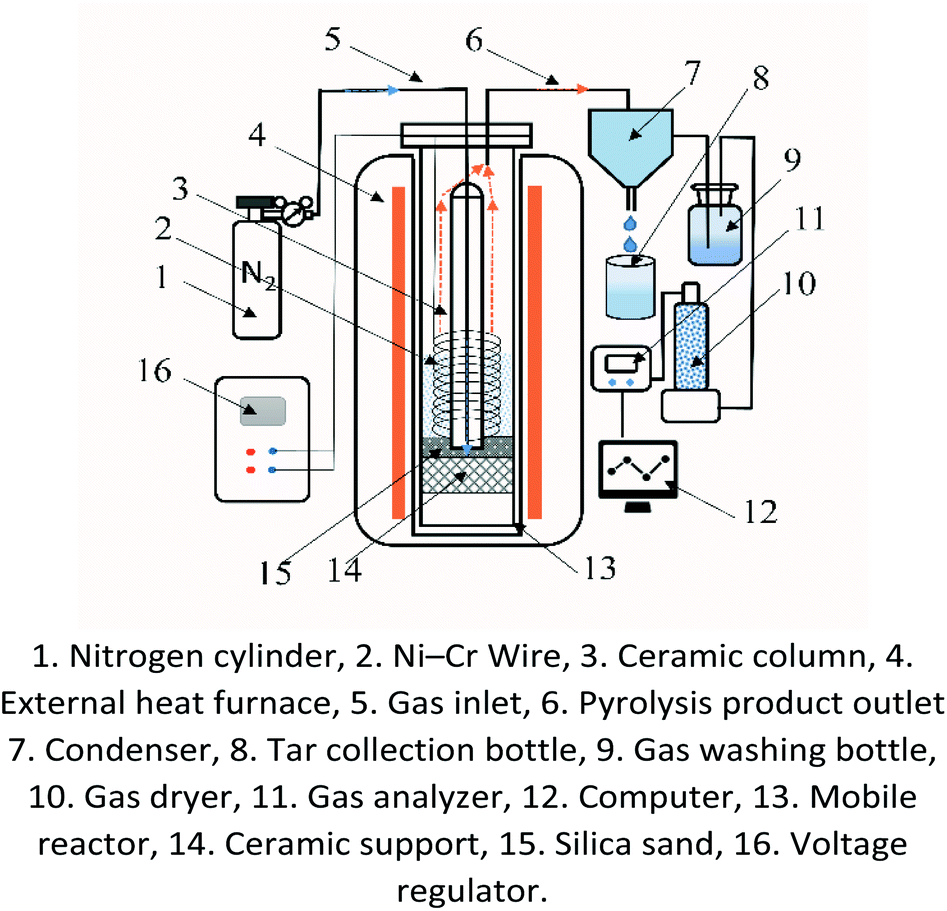 | ||
| Fig. 1 The schematic of the ECP system. | ||
As shown in Fig. 1, all the pyrolysis experiments in the ECP system were conducted under atmospheric pressure. The pyrolysis experiments were performed using either common coal pyrolysis (CCP) or electrochemical catalytic pyrolysis (ECP). In the ECP experiments, an annular Ni–Cr wire entwined around a ceramic column and installed in the reactor's center was used to heat the coal and synchronously provide thermal electrons onto the coal by passing through a given AC electronic current. Before the start of each pyrolysis experiment, the Ni–Cr wire needed to be replaced in the reactor, and then a coal sample (6 g) was fed into the reactor from the top inlet of the reactor. The coal fed into the reactor was uniformly distributed around the Ni–Cr wire between the outer wall of the ceramic column and the inner wall of the reactor. Subsequently, the top of the reactor was sealed. The carrier gas (N2) was fed into the reaction chamber using the mass flow controller to control the gas flow during the experiment; N2 was used to ensure the anaerobic conditions required for the pyrolysis reaction and to bring the pyrolysis product out of the reactor in time for collection and subsequent analysis. When the temperature of the external heating furnace reached the desired experimental temperature, the mobile reactor was put into the furnace, and the Ni–Cr wire was electrified at the desired experimental power setting. Then, the ECP experiment was performed. In the CCP experiments, the setup was similar to that of ECP, except that no annular Ni–Cr wire was installed in the center of the reactor and the coal was heated with only an auxiliary external furnace. The liquid and gaseous products produced during the pyrolysis process were separated by the condenser. The liquid products were collected for subsequent testing. The gaseous products were first passed through the gas scrubber and the dryer, and then passed through the gas analyzer for online composition detection. At the same time, the flow rate of the gaseous products was measured by a volume flow meter. The pyrolysis temperature was varied from 700 °C to 1000 °C. The power given to the Ni–Cr wire was varied from 0 to 400 W.
2.3 Characterization
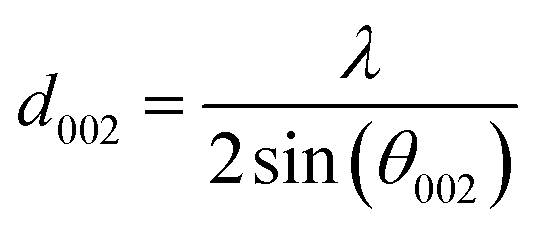
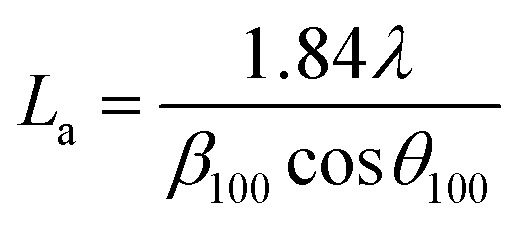
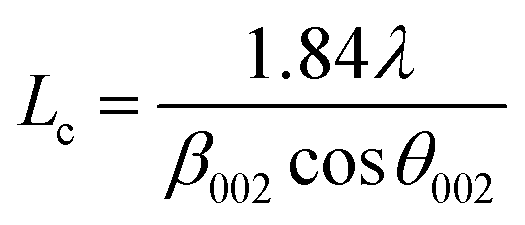
The structural changes in the char samples obtained from the experiments were investigated by X-ray diffraction measurements. The X-ray diffraction patterns of the char samples were recorded on an X'pert Pro Philips diffractometer (Bruker AXS D8 Advance, Germany) using Cu–Kα radiation. The voltage and current used were 40 kV and 40 mA, respectively. The 2θ range was from 10° to 85°. A nickel Kβ filter was used to eliminate any Kβ radiation. The interplanar spacing d002, the stacking height of the carbon crystal Lc, and the diameter of the layer structure La were the basic parameters used to analyze the carbon crystallite structure. As shown in eqn (1)–(3),29 the parameters Lc, La, and d002 were calculated as follows:
 | (1) |
 | (2) |
 | (3) |
The functional groups in the char samples obtained the from experiments were identified using a Fourier transform infrared (FTIR) spectrometer (Nicolet Magna760, USA). The instrument had a 1064 nm Nd: YVO4 excitation laser, an XT-KBr beam splitter, a He–Ne laser for sample alignment, an InGaAs detector, and a computer for automated spectra collection and analysis. The spectral range was 400–4000 cm−1, the resolution was 4 cm−1, and the scanning time was 32 s−1. To analyze the FTIR spectral data more extensively, the hydrogen-enrichment (IH), aliphatic-structural (IAl), and aromatization degree (IAr) parameters were calculated from these spectra. The IH parameter was used for characterizing aliphatic hydrocarbon contents and hydrocarbon generation potential, whereas the IAl parameter assessed the chain length and the degree of chain branching. The IAr parameter characterized the aliphatic structures on aromatic nuclei and indicated the degree of char thermal evolution. The detailed derivation process and calculation techniques are available in ref. 30.
The liquid product obtained from the pyrolysis experiments was examined by gas chromatography-mass spectrometry (GC-MS), using a Hewlett Packard 6890 GC system (USA) with the HP 5972 mass spectrometric detector. Helium (99.99% purity) was the carrier gas and the flow rate was 1 mL min−1. A quartz capillary column HP-5MS (30 m × 0.25 mm × 0.25 μm) was used for separation. The initial oven temperature was set at 40 °C and held for 3 min, and then increased at 2°C min−1 to 8 °C (held for 1 min), increased at 3°C min−1 to 240 °C (held for 1 min), and then increased at 3°C min−1 to 300 °C (held for 25 min). The carrier gas flow rate in the column was set at 1 mL min−1. The GC injector temperature was set at 300 °C, with a split ratio of 20![[thin space (1/6-em)]](https://www.rsc.org/images/entities/char_2009.gif) :1. The ion source temperature was set at 280 °C. The spectrometer was set to scan between 30 m/z and 500 m/z. The volume of the sample injected was 1 μL.
:1. The ion source temperature was set at 280 °C. The spectrometer was set to scan between 30 m/z and 500 m/z. The volume of the sample injected was 1 μL.
The composition of gas products obtained from CCP and ECP experiments was analyzed by an online NDIR gas analyzer.
3. Results and discussion
3.1 Analysis of char
The main pyrolysis products were char, tar, and pyrolysis gas. The percentage of char in the pyrolysis products generated under different conditions is shown in Fig. 2. Char production decreased by approximately 2.15–3.47% as the temperature was increased from 700 °C to 1000 °C under different power conditions. As pyrolysis reactions are endothermic, increasing the temperature is conducive to the cracking of organic matter in the coal char, which forms more volatile matter. This ultimately led to a reduction in the proportion of coal char in the pyrolysis products.31–33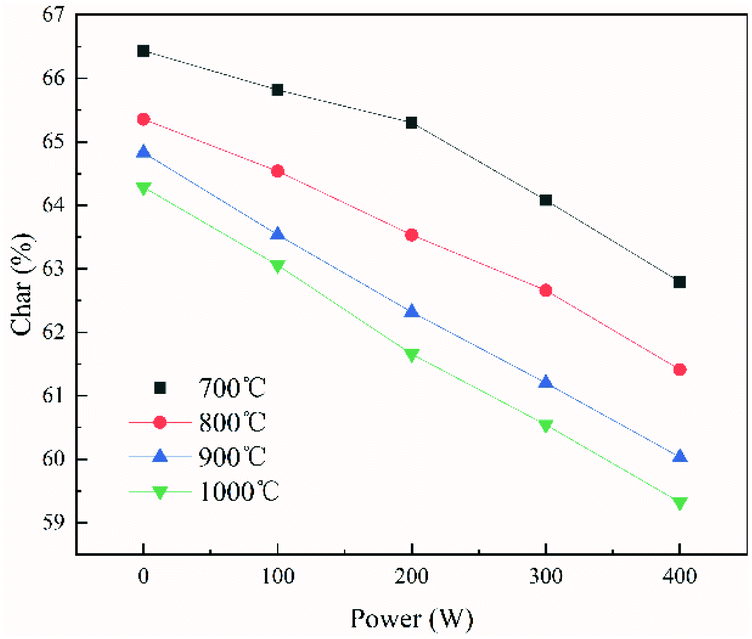 | ||
| Fig. 2 Char production in ECP/CCP under different temperature and power conditions. | ||
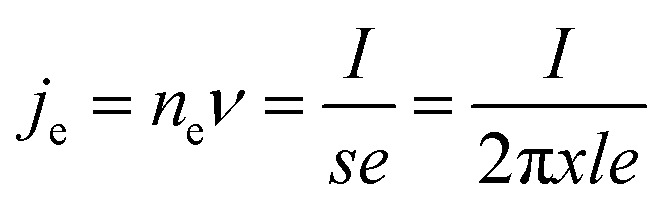
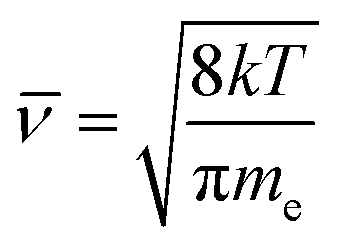
It can also be seen from the figure that char production decreased by approximately 3.64–4.96% as the power increased from 0 to 400 W under different temperatures. In the ECP process, thermal electrons are created over the electrified Ni–Cr wire. This has a major effect on the ECP process. Therefore, the corresponding relationship between power and thermal electron release in the ECP process should be first clarified. The release of these thermal electrons as charge carriers caused the current to be emitted from the Ni–Cr wire. The current emitted from the Ni–Cr wire (Ibed) was measured by a columned Au-coated Faraday plate and detected by a Keithley model 6485 amperometer. The results are shown in Fig. 3. The current emitted from the Ni–Cr wire was approximately 15–628 μA in the temperature range from 700 °C to 1000 °C under the Ni–Cr wire when no power was supplied to the Ni–Cr wire. When power was supplied to the Ni–Cr wire, the space current flowing through the coal bed (Ibed) increased significantly. We calculated the number density of thermal electrons flowing from the wire, based on Fick's law and the theory of molecular thermodynamic movement and thermal diffusion,20 as:
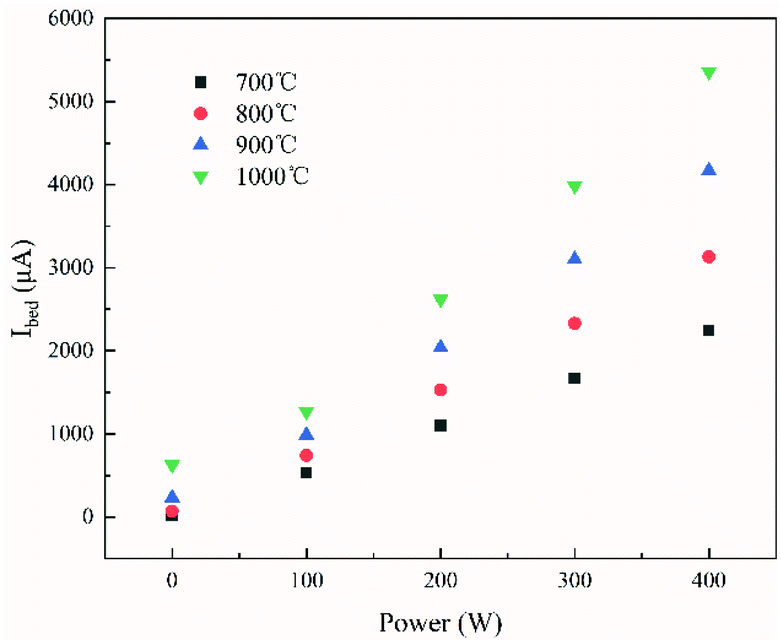 | ||
| Fig. 3 Effect of the power supplied to the Ni–Cr wire on the current emitted from the Ni–Cr wire surface at different temperatures. | ||
Fick's law:
 | (4) |
 | (5) |
 | (6) |
 | (7) |
We determined the number densities of thermal electrons corresponding to the different currents emitted from the Ni–Cr wire under different power and temperature conditions (Fig. 4). Similar to the trend seen in Fig. 3, the number density of the thermal electrons increased as the power supplied to the wire increased.
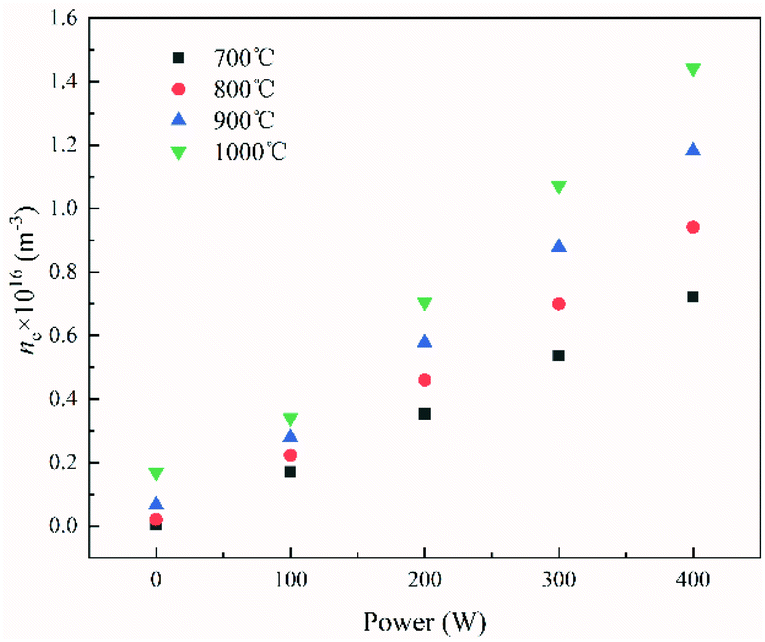 | ||
| Fig. 4 Effect of the power supplied to the Ni–Cr wire on the number density of electrons at a position 5 mm away from the Ni–Cr wire surface. | ||
It can be seen from Fig. 2 and 4 that the trend in the number density of thermal electrons as the supplied power increased was opposite to that of the percentage of char in the pyrolysis product. This showed that the pyrolysis product and the number density of thermal electrons in ECP were closely related and indicated that thermal electrons have an important role in ECP. Moreover, the greater the power, the more thermal electrons were released from the surface of the Ni–Cr wire, and the more thermionic electrons took part in the pyrolysis process. This resulted in a higher degree of coal pyrolysis and a lower proportion of coal char in the pyrolysis product.
The crystalline structural characterization of the char performed at 100 W under different temperature conditions was studied using X-ray diffraction. However, as shown in Fig. 5, the intensities of the (002) peak and the (100) peak of char increased as the temperature increased from 700 °C to 1000 °C. As the temperature increased from 700 °C to 1000 °C, the stacking height Lc and the layer structure La tended to increase, whereas the interplanar spacing d002 tended to decrease (shown in Table 3). This indicated that, as the pyrolysis temperature increased, the microcrystalline structure of coal char gradually became ordered, improving the degree of graphitization of char. Many researchers have shown that as pyrolysis temperature is increased, the crystalline structure of coal char becomes more ordered and the reactivity of coal char is decreased.34,35
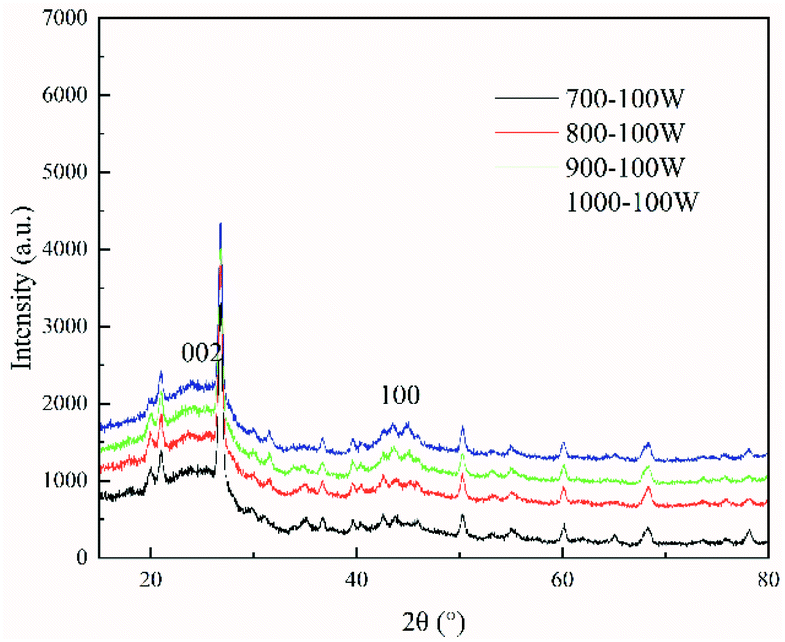 | ||
| Fig. 5 XRD spectra of char obtained under different temperature conditions at 800 °C. | ||
| Condition | La (Å) | Lc (Å) | d002 (Å) |
|---|---|---|---|
| 700 °C | 0.715 | 6.480 | 3.352 |
| 800 °C | 0.757 | 6.503 | 3.339 |
| 900 °C | 0.840 | 6.526 | 3.336 |
| 1000 °C | 0.892 | 6.558 | 3.332 |
However, the changes in the crystalline structure of coal char with the power (thermal electrons) are not clearly understood. Therefore, the characterization of the crystalline structure of the char was performed at 800 °C under different power conditions using X-ray diffraction. The intensities of the (002) peak and (100) peak of char generated by ECP (with power ranging from 100 to 400 W) were lower those generated by CCP (power = 0 W). However, as shown in Fig. 6, the intensities of the (002) peak and the (100) peak in the char slightly increased as the power increased from 100 to 400 W. As the power in ECP was increased (from 100 to 400 W), the stacking height Lc tended to increase, the diameter of the layer structure La first decreased then increased, and the interplanar spacing d002 decreased (shown in Table 4).
 | ||
| Fig. 6 XRD spectra of char obtained under different power conditions at 800 °C. | ||
| Condition | La (Å) | Lc (Å) | d002 (Å) |
|---|---|---|---|
| 0 W | 0.820 | 6.807 | 3.328 |
| 100 W | 0.757 | 6.503 | 3.339 |
| 200 W | 0.758 | 6.489 | 3.337 |
| 300 W | 0.761 | 6.667 | 3.330 |
| 400 W | 0.762 | 6.729 | 3.328 |
Compared with CCP (P = 0 W), the degree of ordering of char crystallite structure was lower in ECP. However, the crystallite structures of coal char became more ordered as the ECP power increased. To explain this phenomenon, the chemical structural characterization of char obtained at 800 °C under different power conditions was studied by Fourier transform infrared spectroscopy. The parameters calculated from the FTIR spectra are shown in Table 5. It can be seen that IH, IAl, and IAr of the coal char in the ECP process were all greater than those in the CCP. This may be attributed to the fact that ECP promoted the cracking and ring-opening of aromatic compounds to a certain extent via thermal electrons,19,24,36 resulting in the formation of a greater number of aliphatic molecules more aliphatic molecules. This led to an increase of aliphatic hydrocarbons in the coal char (increased IH, IAl), a decrease of aromatic compounds, and an increase of aliphatic structures on aromatic nuclei (increased IAr) in coal char generated during ECP compared with CCP. In turn, the aromatization of coal char was hindered, and the extent of thermal evolution and the further ordering process of coal char was hindered. The dissociation of organic compounds dissociation (e.g., alcohols and carboxylic acids) may form anionic hydrocarbon fragments (CxHy−). These fragments were depolymerized from coal with thermal electrons (i.e., e−(s) + CxHyOH(s)/CxHy = CmHn− + …) and by the cracking of aromatic compounds,8,9 and would therefore lead to an increase in liquid and gaseous products in ECP.
| Parameter | 0 W | 100 W | 200 W | 300 W | 400 W |
|---|---|---|---|---|---|
| Hydrogen enrichment parameter, IH | 2.291 | 3.502 | 3.187 | 3.125 | 2.910 |
| Aliphatic structural parameter, IAl | 2.640 | 3.032 | 3.215 | 3.386 | 3.829 |
| Aromatization degree parameter, IAr | 0.862 | 1.087 | 1.113 | 1.117 | 1.074 |
However, during the ECP process, as the power increased (from 100 to 400 W), the hydrogen-enrichment parameter IH tended to decrease, the aliphatic-structural parameter IAl tended to increase, and the aromatization degree parameter IAr first increased and then decreased. This can be explained by the increased number of thermionic electrons involved in the pyrolysis process, and the greater number of aliphatic hydrocarbons produced by the stimulated cracking and ring-opening of aromatic compounds by thermal electrons. However, when the power level was increased, more aliphatic compounds were decomposed into smaller molecules, resulting in liquid and gaseous products that could be isolated from the coal char. This led to a decrease in aliphatic hydrocarbons (decreased IH), an increase in long-chain aliphatic hydrocarbons and aromatic compounds (increased IAl, decreased IAr), and a decrease in aliphatic structures on aromatic nuclei in the coal char. Further, the thermal evolution of char increased and the crystallite structures of coal char became more ordered as the power supplied during ECP increased.
3.2 Analysis of the liquid products
The percentage of tar in the pyrolysis products generated under different power and temperature conditions are shown in Fig. 7. The tar production was decreased by 0.61–1.60% as the temperature increased from 700 °C to 1000 °C under different power conditions. The tar production was decreased by 2.16–3.16% as the power increased from 0 to 400 W under different temperature conditions. Similar to coal char, the increased temperature was conducive to the cracking of organic matter in tar, thereby forming more gaseous products. This ultimately led to a reduction in the composition of tar in the pyrolysis products as the temperature increases. However, in the ECP process, thermal electrons promote ring-opening reactions and the cracking of fused-ring compounds, which further promotes pyrolysis, and causes the conversion of some of these to gaseous products. As the power increases, an increasing amount of tar is converted into gaseous products, resulting in a lower proportion of tar in the pyrolysis products. To confirm this, the composition of tar and gaseous products in the pyrolysis products during ECP was analyzed. The composition of tar (detectable components) under different power conditions was analyzed by gas chromatography-mass spectrometry (GC-MS).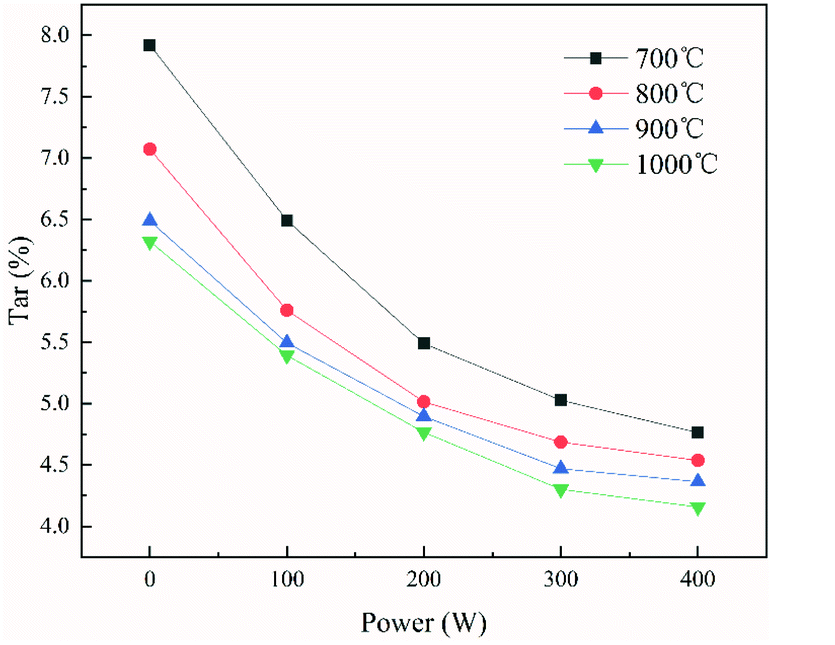 | ||
| Fig. 7 The percentage of tar in the pyrolysis products generated under different conditions. | ||
The components and relative content of tar collected under different conditions were obtained. For the example of tar collected at a temperature of 800 °C and power of 100 W, the test results are shown in Table 6. The main components were alkanes, alcohols, esters, benzenes, phenols, naphthalene, anthracenes, aliphatic heterocyclic compounds, and aromatic heterocyclic compounds. To facilitate a comparative analysis, the content of tars generated under different conditions was divided into the following three categories: aliphatic compounds, monocyclic compounds (mono-heterocyclic compounds and monocyclic aromatic compounds), and fused-ring compounds (fused heterocyclic compounds and fused-ring aromatic compounds).
| Hold time | Name | Molecular formula | Hold time | Name | Molecular formula |
|---|---|---|---|---|---|
| 6.198 | 1,7-Heptanediol | C7H16O2 | 17.616 | Naphthalene, 2-methyl- | C11H10 |
| 6.502 | Butyrolactone | C4H6O2 | 18.07 | Naphthalene, 2-methyl- | C11H10 |
| 6.749 | 2-Furanmethanol, tetrahydro- | C5H10O2 | 20.904 | Naphthalene, 1,3-dimethyl- | C12H12 |
| 8.625 | Phenol | C6H6O | 20.984 | Naphthalene, 1,6-dimethyl- | C12H12 |
| 10.81 | Phenol, 2-methyl- | C7H8O | 23.43 | 1-Naphthalenol | C10H8O |
| 11.426 | p-Cresol | C7H8O | 23.64 | Naphthalene, 1,6,7-trimethyl- | C13H14 |
| 13.329 | Phenol, 4-ethyl- | C8H10O | 24.024 | Naphthalene, 1,6,7-trimethyl- | C13H14 |
| 13.58 | Phenol, 2,4-dimethyl- | C8H10O | 24.98 | Naphthalene, 1,4,5-trimethyl- | C13H14 |
| 14.142 | Phenol, 4-ethyl- | C8H10O | 25.855 | 1-Naphthalenol, 2-methyl- | C11H11O |
| 14.2 | Phenol, 3,5-dimethyl- | C8H10O | 26.03 | Dibenzofuran, 4-methyl- | C13H10O |
| 14.905 | Phenol, 3,4-dimethyl- | C8H10O | 27.056 | Naphthalene, 1,6-dimethyl-4-(1-methylethyl)- | C15H12 |
| 15.148 | Phenol, 2,3,5-trimethyl- | C9H12O | 28.228 | 1,4,5,8-Tetramethylnaphthalene | C14H16 |
| 15.884 | Phenol, 3-(1-methylethyl)- | C8H10O | 29.159 | Anthracene | C14H10 |
| 16.165 | Benzene, 1-ethyl-4-methoxy- | C9H12O | 31.668 | Eicosane | C20H42 |
| 16.778 | Phenol, 3-ethyl-5-methyl- | C9H12O | 31.789 | Phenanthrene, 3-methyl | C15H12 |
The proportions of various components in the tar under different temperature conditions at 100 W are shown in Fig. 8(a). The proportion of aliphatic compounds and monocyclic compounds in pyrolysis tar decreased by approximately 1.82% and 10.09% as the temperature increased, and the proportion of fused-ring compounds increased by approximately 11.92% as the temperature increased. The observation concerning the influence of temperature on tar composition was in good agreement with the literature.37,38 This may be because although the increase in temperature could promote the decomposition of aliphatic compounds in tar, resulting in a reduction in the proportion of aliphatic compounds in tar, the secondary polycondensation of monocyclic compounds (mono-heterocyclic compounds and monocyclic aromatic compounds) was promoted as the temperature increased, which resulted in the reduction of monocyclic compounds and the increase in fused-ring compounds.
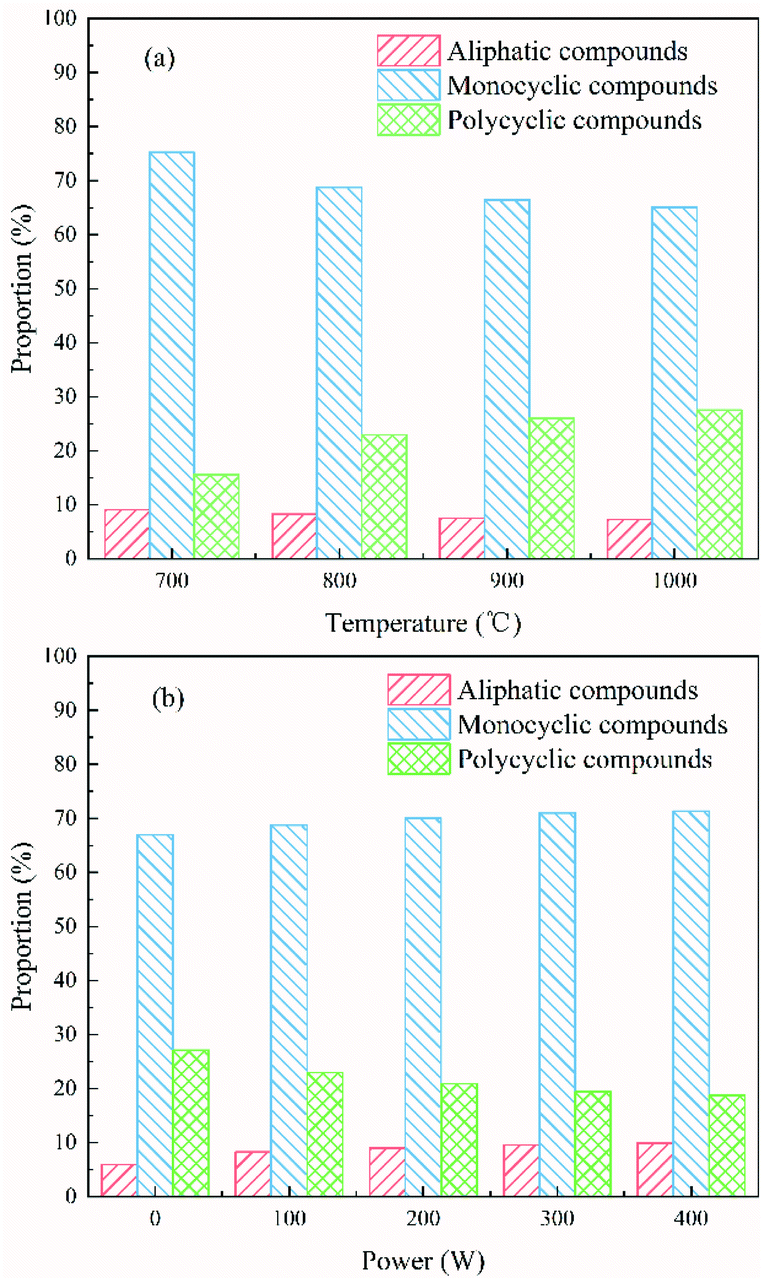 | ||
| Fig. 8 Proportions of various components in tar generated under (a) different temperature conditions at 100 W, (b) different power conditions at 800 °C. | ||
The proportions of the various components in the tar under different power conditions at 800 °C are shown in Fig. 8(b). As the power increased, the proportion of aliphatic compounds and monocyclic compounds in pyrolysis tar increased by approximately 3.99% and 4.38%, respectively, and the proportion of fused-ring compounds decreased by approximately 8.38%. This was in contrast to the influence of temperature on tar composition.
These observations indicated that the thermal electrons may have aided the addition, oxidation, ring-opening, and cracking reactions of macromolecular organic compounds (fused heterocyclic compounds and fused-ring aromatic compounds) in tar, resulting in the formation of aliphatic compounds (including aliphatic heterocyclic compounds) and monocyclic aromatic compounds, which resulted in a decrease in the proportion of polycyclic compounds.
3.3 Analysis of the gaseous products
The percentage of gaseous products in the pyrolysis products generated under different conditions is shown in Fig. 9. An increase of approximately 1.72–2.82% was observed as the temperature increased from 700 °C to 1000 °C under different power conditions. The reason for this is that the pyrolysis reaction is endothermic. Increasing the temperature is conducive to the cracking of organic matters in the coal char and the cracking of organic components in tar, thereby increasing the formation of gaseous products. The proportions of the main components in the gaseous product generated under different temperature conditions at 100 W are shown in Fig. 10(a). As the temperature increased, the proportion of CO in the produced gas increased by 9.62% and the proportion of H2 increased by 8.46%. The proportion of CO2, CH4 and CnHm (gaseous components other than CO, CO2, H2, and CH4) decreased by 10.64%, 5.91%, and 1.53%, respectively. The CO in the pyrolysis process arises mainly from the decomposition of oxygen-containing functional groups, and the increase in temperature is conducive to the cracking of these functional groups. As the pyrolysis temperature increases, the secondary condensation reaction of aromatic ring compounds occurs in char and tar, producing a large amount of H2. At the same time, CH4 and CnHm in the pyrolysis products would be reformed in the presence of water to produce CO and H2 at high temperatures. This results in the increase of CO and H2 and the decrease in other components in the gaseous products.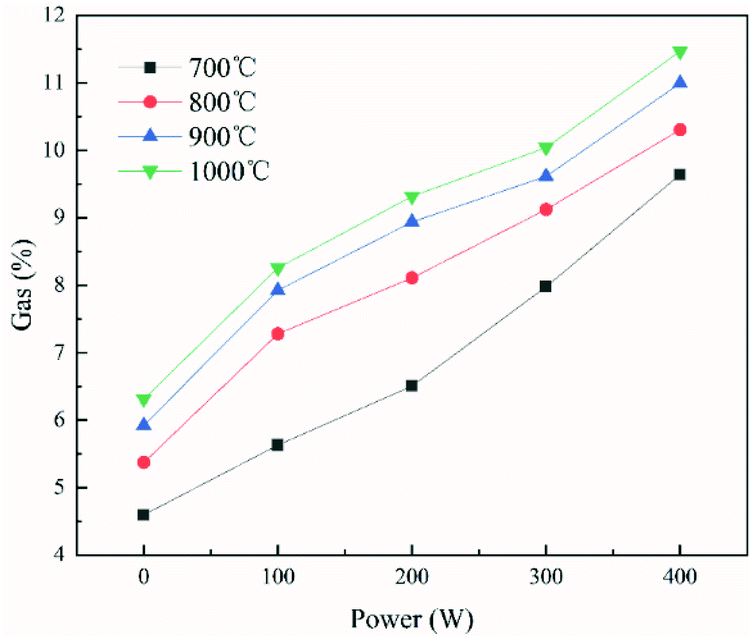 | ||
| Fig. 9 The percentage of gaseous products in the pyrolysis products generated under different conditions. | ||
 | ||
| Fig. 10 Proportion of the main components of gaseous products generated under (a) different temperature conditions at 100 W and (b) different power conditions at 800 °C. | ||
The percentage of gaseous products in the pyrolysis products also increased by approximately 4.93–5.15% as the power increased from 0 to 400 W under different temperature conditions. The proportions of main components in the gaseous product under different power conditions at 800 °C are shown in Fig. 10(b). As the power increased (from 0 to 400 W), the proportion of CO in the produced gas increased by 4.1%, the proportion of H2 increased by 12.17%, the proportion of CH4 increased by 4.94%, and the proportion of CnHm (gaseous components other than CO, CO2, H2, and CH4) increased by 0.03%. Only the proportion of CO2 decreased (by 21.2%).
In combination with the change in tar production and composition with power in the previous section, it can be verified that as the power increases, more and more tar is converted into gaseous products, resulting in a decrease in the proportion of tar in the pyrolysis products. This is because thermal electrons in ECP could promote ring-opening reactions and the cracking of the macromolecular organic compounds (fused heterocyclic compounds and fused-ring aromatic compounds)24 in tar, which resulted in the formation of aliphatic compounds (including aliphatic heterocyclic compounds) and monocyclic aromatic compounds. Then, the ring-opening and decomposition reactions of these small organic compounds may be promoted by thermal electrons, which would cause some of them to be converted into gaseous products (CO, H2, CH4, and CmHn).
4. Conclusions
Electrochemical catalytic pyrolysis, an important process in electrochemical catalytic gasification, was investigated in this paper.The char production decreased by approximately 2.15–3.47% as the temperature increased from 700 °C to 1000 °C under different power conditions, and decreased by approximately 3.64–4.96% as the power increased from 0 to 400 W under different temperature conditions. The tar production decreased by 0.61–1.60% as the temperature increased from 700 °C to 1000 °C under different power conditions, and decreased by 2.16–3.16% as the power increased from 0 to 400 W under different temperature conditions. The proportion of gaseous products increased by approximately 1.72–2.82% as the temperature increased from 700 °C to 1000 °C under different power conditions and increased by approximately 4.93–5.15% as the power increased from 0 to 400 W under different temperature conditions. Compared with common coal pyrolysis, electrochemical catalytic pyrolysis was more conducive to the full pyrolysis of coal, leading to the formation of more gaseous products.
High temperature and power in ECP would lead to a deeper thermal evolution and graphitization degree of coal char. The proportion of aliphatic compounds and monocyclic compounds in tar decreased with as the temperature increased, and the proportion of fused-ring compounds slightly increased as the temperature increased. However, compared with temperature, the effect of power on tar composition was just the opposite. The proportion of CO and H2 in the produced gas increased as the pyrolysis temperature increased. The proportion of CO2, CH4, and CnHm (gaseous components other than CO, CO2, H2, and CH4) decreased as the temperature increased. Unlike the effect of temperature on gas production components, only the proportion of CO2 decreased as the power increased; other components increased as the power increased.
However, the degree of char crystallite structure ordering and the degree of thermal evolution of coal char were still lower in ECP than in CCP. There were more aliphatic compounds and monocyclic compounds in tar generated during ECP compared to CCP. All of these were beneficial to the subsequent electrochemical catalytic gasification reaction.
In addition, when comparing the effects of temperature and thermal electrons on coal pyrolysis, it was discovered that thermal electrons had a bigger impact than temperature. This suggests that by changing the power, efficient coal conversion could be achieved at a relatively low reaction temperature in ECP.
Author contributions
Fan Yang: conceptualization, methodology, formal analysis, investigation, writing-original draft.Qingbo Yu: conceptualization, supervision, resources, funding acquisition, writing-review & editing.
Wenjun Duan: data curation, writing-review & editing.
Zhenfei Qi: formal analysis, writing-review & editing.
Qin Qin: conceptualization, formal analysis, project administration.
Conflicts of interest
There are no conflicts to declare.Acknowledgements
This research was supported by Liaoning Revitalization Talents Program (XLYC1802003), The Major State Research Development Program of China (2017YFB0603603), The National Natural Science Foundation of China (51576035).References
- BP, Statistical Review of World Energy, https://www.bp.com/en/global/corporate/energy-economics/statistical-review-of-world-energy.html, accessed June 2020 Search PubMed.
- D. Xiang, P. Li, X. Yuan, H. Cao, L. Liu and Y. Liu, Appl. Therm. Eng., 2021, 193, 116990 CrossRef CAS.
- L. S. Lobo and S. A. C. Carabineiro, Fuel, 2016, 183, 457–469 CrossRef CAS.
- S. Fan, X. Yuan, L. Zhao, L.-H. Xu, T.-J. Kang and H.-T. Kim, Fuel, 2016, 165, 397 CrossRef CAS.
- F. Zhang, D. Xu, Y. Wang, Y. Wang, Y. Gao, T. Popa and M. Fan, Fuel Process. Technol., 2015, 130, 107 CrossRef CAS.
- Y. Wang, Z. Wang, J. Huang and Y. Fang, Energy Fuels, 2015, 29, 6988–6998 CrossRef CAS.
- S. Gabor A and L. Yimin, Introduction to Surface Chemistry and Catalysis, Wiley, New York, 1994 Search PubMed.
- L. Yuan, Y. Chen, C. Song, T. Ye, Q. Guo, Q. Zhu, Y. Torimoto and Q. Li, Chem. Commun., 2008, 5215, 10.1039/B810851J.
- Q. X. Li, K. Hayashi, M. Nishioka, H. Kashiwagi, M. Hirano, Y. Torimoto, H. Hosono and M. Sadakata, Appl. Phys. Lett., 2002, 80, 4259 CrossRef CAS.
- Q. Li, H. Hosono, M. Hirano, K. Hayashi, M. Nishioka, H. Kashiwagi, Y. Torimoto and M. Sadakata, Surf. Sci., 2003, 527, 100 CrossRef CAS.
- J. Li, F. Huang, L. Wang, Z. Wang, S. Yu, Y. Torimoto, M. Sadakata and Q. Li, J. Phys. Chem. B, 2005, 109, 14599 CrossRef CAS PubMed.
- J. Li, F. Huang, L. Wang, S. Q. Yu, Y. Torimoto, M. Sadakata and Q. X. Li, Chem. Mater., 2005, 17, 2771 CrossRef CAS.
- F. Huang, J. Li, H. Xian, J. Tu, J. Q. Sun, S. Q. Yu, Q. X. Li, Y. Torimoto and M. Sadakata, Appl. Phys. Lett., 2005, 86, 114101 CrossRef.
- F. Huang, J. Li, L. Wang, T. Dong, J. Tu, Y. Torimoto, M. Sadakata and Q. Li, J. Phys. Chem. B, 2005, 109, 12032 CrossRef CAS PubMed.
- C. Song, J. Sun, S. Qiu, L. Yuan, J. Tu, Y. Torimoto, M. Sadakata and Q. Li, Chem. Mater., 2008, 20, 3473 CrossRef CAS.
- Y. Chen, L. Yuan, T. Ye, S. Qiu, X. Zhu, Y. Torimoto, M. Yamamoto and Q. Li, Int. J. Hydrogen Energy, 2009, 34, 1760 CrossRef CAS.
- M. Backhaus-Ricoult, Solid State Sci., 2008, 10, 670 CrossRef CAS.
- L. Yuan, Y. Chen, C. Song, T. Ye, Q. Guo, Q. Zhu, Y. Torimoto and Q. Li, Chem. Commun., 2008, 5215 RSC.
- T. Ye, L. Yuan, Y. Chen, T. Kan, J. Tu, X. Zhu, Y. Torimoto, M. Yamamoto and Q. Li, Catal. Lett., 2009, 127, 323 CrossRef CAS.
- L. Yuan, T. Ye, F. Gong, Q. Guo, Y. Torimoto, M. Yamamoto and Q. Li, Energy Fuels, 2009, 23, 3103 CrossRef CAS.
- X.-l. Li, S. Ning, L.-x. Yuan and Q.-x. Li, ChJCP, 2011, 24, 477 CAS.
- T. Kan, J. Xiong, X. Li, T. Ye, L. Yuan, Y. Torimoto, M. Yamamoto and Q. Li, Int. J. Hydrogen Energy, 2010, 35, 518 CrossRef CAS.
- J. Tao, Q. Lu, C. Dong, X. Du and E. Dahlquist, Energy Convers. Manag., 2015, 100, 56 CrossRef CAS.
- F. Yang, Q. Yu, W. Duan, Z. Qi and Q. Qin, Catal. Commun., 2020, 106261 Search PubMed.
- L. Ding, Z. Dai, Q. Guo and G. Yu, Appl. Energy, 2017, 187, 627–639 CrossRef CAS.
- H. Fatehi and X.-S. Bai, Appl. Energy, 2017, 185, 998 CrossRef CAS.
- A. Gomez and N. Mahinpey, Appl. Energy, 2015, 137, 126 CrossRef CAS.
- P. Liu, D. Zhang, L. Wang, Y. Zhou, T. Pan and X. Lu, Appl. Energy, 2016, 163, 254 CrossRef CAS.
- Y. Zhang, X. Kang, J. Tan and R. L. Frost, Energy Fuels, 2013, 27, 7191 CrossRef CAS.
- R. Lin and G. P. Ritz, Appl. Spectrosc., 1993, 47, 265 CrossRef CAS.
- C. Geng, S. Li, C. Yue and Y. Ma, J. Energy Inst., 2016, 89, 725 CrossRef CAS.
- P. Dong, Z. Wang, Z. Li, S. Li, W. G. Lin and W. Song, Energy Fuels, 2012, 26, 5193 CrossRef CAS.
- M. Ma, Y. Bai, J. Wang, P. Lv, X. Song, W. Su and G. Yu, J. Environ. Manag., 2021, 290, 112580 CrossRef CAS PubMed.
- Z. Zhou, L. Ding, L. Wu, S. Lin, T. Cui, G. Yu and F. Wang, Energy Technol., 2014, 2, 284 CrossRef CAS.
- J. Xiao, F. Li, Q. Zhong, J. Huang, B. Wang and Y. Zhang, J. Anal. Appl. Pyrolysis, 2016, 117, 64 CrossRef CAS.
- I. Shoichiro, T. Takehiko and I. Kaname, Bull. Chem. Soc. Jpn., 1987, 60, 2517 CrossRef.
- M. Zhong, Z. Zhang, Q. Zhou, J. Yue, S. Gao and G. Xu, J. Anal. Appl. Pyrolysis, 2012, 97, 123 CrossRef CAS.
- M. Mayerhofer, P. Mitsakis, X. Meng, W. de Jong, H. Spliethoff and M. Gaderer, Fuel, 2012, 99, 204 CrossRef CAS.
| This journal is © The Royal Society of Chemistry 2021 |