
 Open Access Article
 This Open Access Article is licensed under a Creative Commons Attribution-Non Commercial 3.0 Unported Licence
A theoretical study of allopurinol drug sensing by carbon and boron nitride nanostructures: DFT, QTAIM, RDG, NBO and PCM insights†
Md. Helal Miah a,
Md. Rakib Hossain*a,
Md. Saiful Islama,
Tahmina Ferdousb and
Farid Ahmedb
a,
Md. Rakib Hossain*a,
Md. Saiful Islama,
Tahmina Ferdousb and
Farid Ahmedb
aDepartment of Physics, Bangabandhu Sheikh Mujibur Rahman Science and Technology University, Gopalganj-8100, Bangladesh. E-mail: rakibphy_r@bsmrstu.edu.bd
bDepartment of Physics, Jahangirnagar University, Savar, Dhaka-1342, Bangladesh
First published on 30th November 2021
Abstract
The application of low-dimensional nanomaterials in clinical practice as efficient sensors has been increasing day by day due to progress in the field of nanoscience. In this research work, we have conducted a theoretical investigation to nominate a potential electrochemical sensor for the allopurinol (APN) drug molecule via studying the fundamental interactions of the drug molecule with two nanocages (carbon nanocage/CNC – C24 and boron nitride nanocage/BNNC – B12N12) and two nanosheets (graphene – C54H18 and boron nitride – B27N27H18) by means of the DFT B3LYP/6-31G(d,p) level of theory in both gas and water phases. The adsorption energies of APN–BNNC conjugated structures are in the range of −20.90 kcal mol−1 to −22.33 kcal mol−1, which indicates that weak chemisorption has occurred. This type of interaction happened due to charge transfer from the APN molecule to BNNC, which was validated and characterized based on the quantum theory of atoms in molecules, natural bond analysis, and reduced density gradient analysis. The highest decreases in energy gap (36.22% in gas and 26.79% in water) and maximum dipole moment (10.48 Debye in gas and 13.88 Debye in water) were perceived for the APN–BNNC conjugated structure, which was also verified via frontier molecular orbital (FMO) and MEP analysis. Also, the highest sensitivity (BNNC > BNNS > CNC > GNS) and favorable short recovery time (in the millisecond range) of BNNC can make it an efficient detector for the APN drug molecule.
1. Introduction
Allopurinol (C5H4N4O) is a synthesized purine, structurally analogous to a naturally occurring purine in the human body called hypoxanthine.1–3 It was first synthesized and reported in 1956 by G. B. Elion and G. H. Hitchings during a search for antineoplastic agents.4 1,5-Dihydro-4H-pyrazolo[3,4-d]pyrimidin-4-one is the most stable of its different types of tautomer.5,6 The APN drug molecule and its active metabolite, oxypurinol, inhibit the xanthine oxidase enzyme that converts hypoxanthine and xanthine to uric acid through purine catabolism.7–10 Thus, it prevents an increase in uric acid levels in the human body. The US Food and Drug Administration (FDA) first approved it under the trade name Zyloprim in 1966 to treat hyperuricemia-related diseases such as gout, recurrent urates, and kidney stones, and to prevent an increase in uric acid levels during cancer chemotherapy etc.7,11–14 Though it is sufficient to maintain the uric acid level in human blood, it has some adverse effects on the human body. The APN molecule is transformed into oxypurinol through an oxidization process within 2 hours after taking it orally. This oxypurinol is mainly responsible for the adverse effects of APN on the human body.2,15 The most common life-threatening adverse effects of APN are hypersensitivity syndrome (HSS), Stevens–Johnson syndrome (SJS), and toxic epidermal necrolysis (TEN).16,17 Different studies have revealed that APN is the most common drug responsible for HSS, SJS or TEN in Pacific-Asian, European, and Israeli populations.18,19 So, it is understandable that this drug is needed to treat some serious diseases, although it has side effects. To get rid of these adverse effects, the sensing of this drug will encounter significant rules.Nanostructured materials are materials of nanoscale in size (generally 1–100 nm range) with zero-dimensional (nanocage), one-dimensional (nanotube), two-dimensional (nanosheet), or three-dimensional (diamond) structures. A tremendous appeal to nanomaterials by the scientific research community has been made after the synthetization of the two-dimensional carbon nanostructure named graphene by the group of K. S. Novoselov et al.20 Nanostructures are considered for nanoscale drug delivery and drug sensing tools due to their biocompatibility, low toxicity and low cost, as well as their intriguing electronic and mechanical properties.21–23 In past years, it has been revealed theoretically and experimentally that pure carbon-based nanostructures can be used as sensors towards various toxic gases and life-threatening drugs.24 For instance, P. Wu et al. fabricated an efficient glucose detector by providing a general approach for constructing a graphene-based bio-sensing platform through assembling enzymes/proteins on the graphene surface.25 Also, a number of experimental studies have been done by different research groups to sense metronidazole, doxorubicin, β-cyclodextrin etc. drugs by using graphitic carbon nitrides (g-C3N4) and they obtained very promising results to apply this technique clinically.26–28 Similarly, S. J. Rodríguez and E. A. Albanesi proposed a type of field-effect transistor device based on graphene for detecting amino acids with the help of DFT calculations in combination with the non-equilibrium Green's function in the OpenMX3.844 software package.29 In addition, M. Z. Tonel et al. conducted a theoretical study and they found physisorption interaction between a pristine graphene nanosheet and doxorubicin anticancer drug with 0.49 eV binding energy and also showed a decrease in the interaction with increasing temperature by means of DFT theory with the GGA-PBE functional in SIESTA code.30 Moreover, the C24 nanocage has been proposed as a sensing nanostructure towards anticancer drug Melphalan by performing DFT at the B3LYP/6-31G(d) level of theory by the research group of E. S. Mirkamali et al.31 Finally, E. O. Kweitsu's research group theoretically showed that pristine C60 is a suitable sensor for sensing phosgene gas by using DFT/LDA calculation in Quantum Espresso Software.32
With advances in nanoscience, researchers have set themselves to discover the properties of boron nitride (BN) nanostructures and the isoelectronic structure of carbon allotropes, for the purpose of applying them in diversified fields. It was first synthesized as a cubic form in 1957, as a tubular form in 1995, as a nanocage in 2004, and as a nanosheet in 2011.33–36 BN nanostructures have emerged as potential candidates in the field of sensing and transporting of drugs in targeting sites for their lucrative improved properties, including higher thermal and chemical stability, and wide bandgap compared to their famous counterpart carbon-based nanostructures.37,38 With the assistance of the DFT method, Md. Rakib Hossain's research group conducted a comparative theoretical investigation and showed that pristine and functionalized boron nitride nanostructures are potential substrates to interact with different drug molecules.39–42 S. D. Dabhi et al. proposed boron nitride nanoribbons as a biosensor to sense DNA and RNA nucleobases by using van der Waals corrected DFT/GGA theory.43 Different groups claimed that 6-tetragonal and 8-hexagonal ringed Th symmetric B12N12 nanocages are a more sensible choice and capable of drug delivery and sensing systems.24,44 K. Nejati et al. conducted a comparative study among BN nanostructures towards cathinone drug, and they concluded that the B12N12 nanocage is a more sensible electronic sensor than BNNT or BNNS by calculating −16.1 kcal mol−1 adsorption energy and a 46% decrease in the HOMO–LUMO gap by using the B3LYP-D/6-31G* method.45 A. Hosseinian's team proposed pristine B12N12 nanocages as an effective chemical sensor to detect the anticancer drug α-cyano-4-hydroxycinnamic acid because of their maximum adsorption energy of −23.7 kcal mol−1, high sensitivity (maximum 55.2% decrease in Eg) and short recovery time (22.7 s) with the help of density functional theory calculations.46
In order to find an effective, economical, and biosafe nano-sensor to detect the drug APN, we have conducted a comparative study by performing the quantum computational method DFT. The essential factors for the adsorption of APN drug on a graphene nanosheet (GNS – C54H18), carbon nanocage (CNC – C24), boron nitride nanosheet (BNNS – B27N27H18), and boron nitride nanocage (BNNC – B12N12) in both gas and solvent phases were investigated. To the best of our knowledge, there has been no theoretical study on the interaction of APN drug with the aforementioned adsorbents. Therefore, our aim is to identify a promising APN drug sensor by studying the geometric structure, and electronic and thermodynamic characteristics of the final conjugated structures (CSs).
2. Theoretical methodology
The quantum mechanical method, DFT, has been applied to explore the essence of structural, chemical, electronic, thermodynamic, etc. parameters of proposed structures to identify a suitable APN drug detector. Before the adsorption process, all adsorbents and the adsorbate were optimized through the commonest and most reliable hybrid B3LYP functional and polarized double-ζ basis sets 6-31G(d,p) implemented in the Gaussian 09 program.47–51 The structural stability and natural existence of the aforementioned adsorbents were confirmed by calculating cohesive energy and vibrational frequency. We observed the adsorption process of the optimized APN drug on optimized GNS, CNC, BNNS, and BNNC nanostructures to obtain energetically suitable and stable conjugated nanostructures. In order to analyze the thermal stability of the pristine and conjugated nanostructures, we studied thermodynamic parameters such as changes in enthalpy (ΔH), entropy (ΔS), and Gibbs free energy (ΔG) during the adsorption process. To get electronic confirmation of the interaction between adsorbents and the APN drug, including the sensitivity of the adsorbents towards APN, we conducted a critical analysis regarding the energy of the highest occupied molecular orbital (HOMO), the energy of the lowest unoccupied molecular orbital (LUMO), the density of states (DOS) and natural bond orbital (NBO). For more precise information about intermolecular interactions, quantum theory of atoms in molecules (QTAIM) and reduced density gradient (RDG) analysis were also undertaken for the conjugated nanostructures. Quantum mechanical descriptors, such as chemical potential, global hardness, global softness, and global electrophilicity index, were studied to gain information about the chemical stability and reactivity of the conjugated structures. Moreover, since recovery time is a vital issue in the arena of sensing, we have taken steps to estimate the recovery time. Finally, all stable conjugated nanostructures were again optimized in water medium and some vital characteristics calculated, such as solubility, adsorption properties, and electronic properties to understand the biological effect on the conjugated nanostructures.3. Results and discussion
3.1. Optimized geometries of the adsorbents and adsorbate
First, the structural and electronic properties of adsorbate and adsorbents were illustrated with the help of DFT calculations. The optimized structures of the adsorbate and adsorbents are depicted in Fig. 1. The investigated bond length, bond angle, minimum and maximum frequency, cohesive energy, HOMO, LUMO, and MEP of the adsorbate APN molecule are shown in Fig. 1 and Tables S1, 1, 3.† The APN molecule has fourteen atoms belonging to one pentagonal ring named a pyrozolic ring (PZ) and one hexagonal ring called a pyrimidinic ring (PD). From Table S1,† we can observe that our calculated bond lengths and bond angles coincide with the theoretical calculation of Delano P. Chong.6 Our calculated bond lengths and bond angles vary from 1.01 Å to 1.44 Å and from 104.8° to 136°, respectively, which also agree with the results of Delano P. Chong. Thus, it has been shown that our DFT/B3LYP/6-31G(d,p) level of theory is reliable.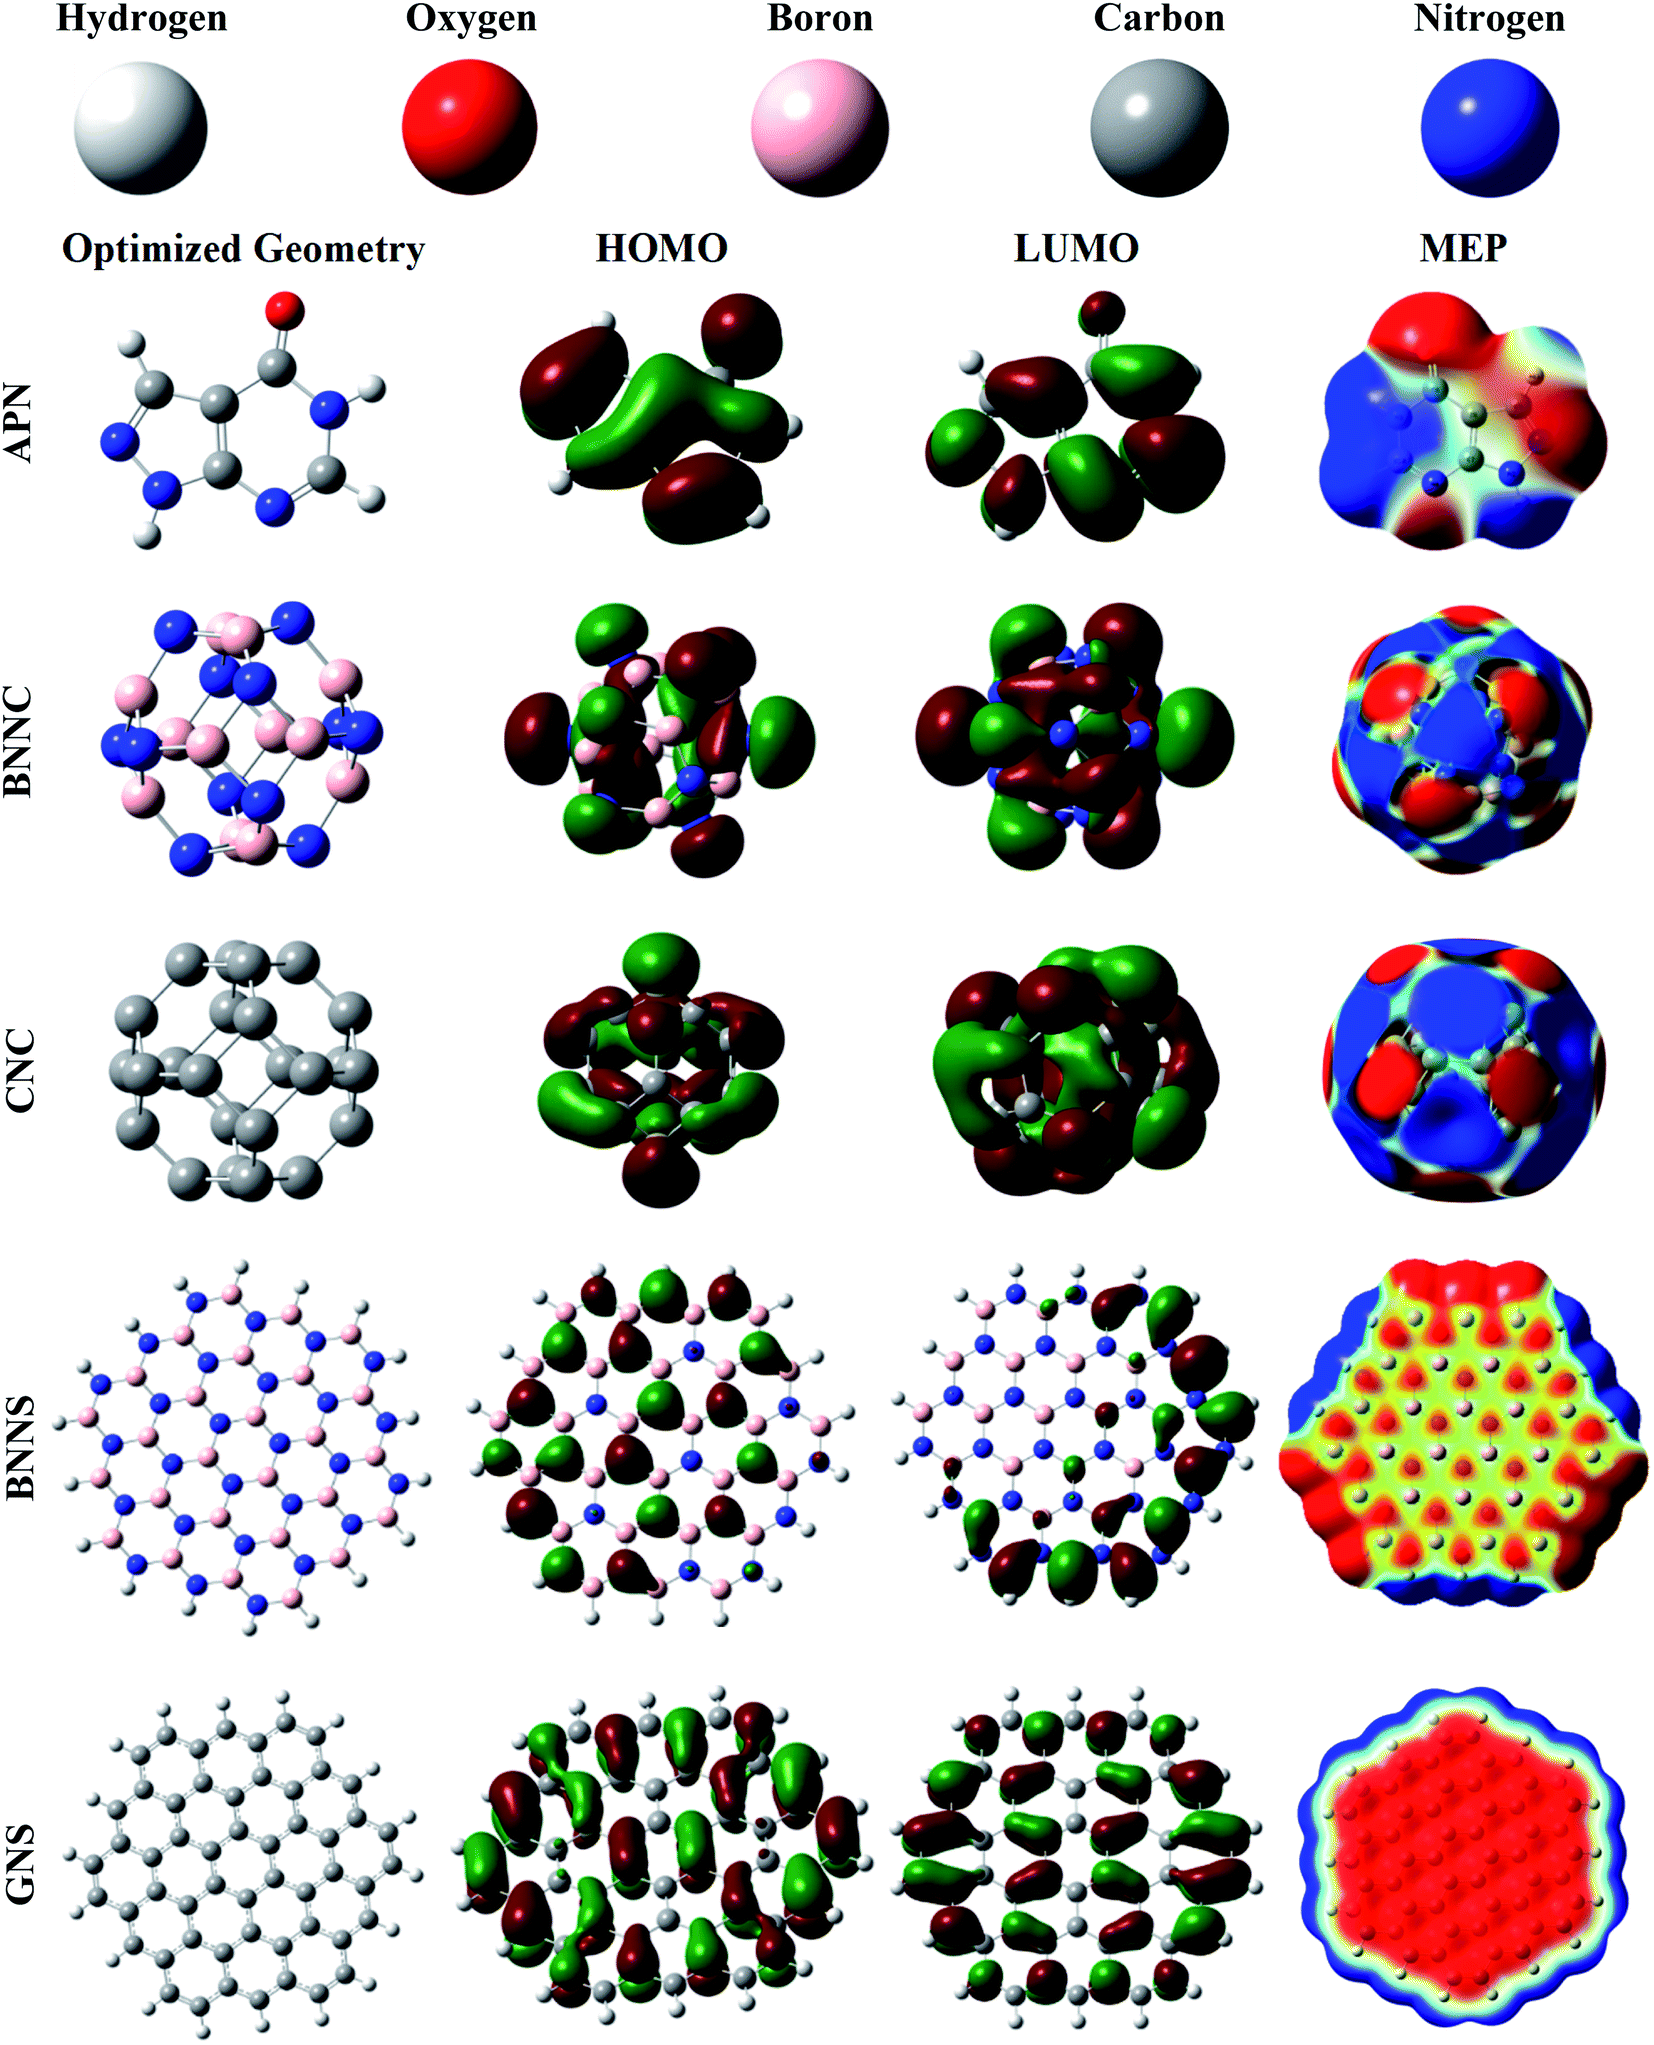 | ||
| Fig. 1 Representations of the optimized geometries, HOMOs, LUMOs, and MEPs of the APN drug molecule and the adsorbents. The MEP surfaces are defined by the 0.0004 electron per bohr3 contour of electronic density. The red to blue (−0.01 a.u. to 0.01 a.u.) colour scheme for the MEP surface indicates the electron-rich to electron-deficient or partially negative charge to partially positive charge region of the surface, respectively. | ||
| System | d | DM | EAds (B3LYP) | EAds,CP (B3LYP) | EAds (wB97XD) | EAds,CP (wB97XD) | νmin | νmax | τ |
|---|---|---|---|---|---|---|---|---|---|
| APN | — | 3.63 | — | — | — | — | 158.61 | 3674.09 | — |
| BNNC | — | 0 | — | — | — | — | 325.51 | 1447.64 | — |
| CS1 | 1.55 | 8.72 | −26.27 | −21.00 | −31.61 | −27.30 | 19.26 | 3667.13 | 19.9 |
| CS2 | 1.61 | 10.48 | −26.48 | −22.33 | −33.61 | −30.09 | 27.59 | 3602.47 | 26.8 |
| CS3 | 1.63 | 4.93 | −25.20 | −20.90 | −33.82 | −30.13 | 23.75 | 3599.9 | 4.3 |
| BNNS | — | 0 | — | — | — | — | 27.05 | 3626.62 | — |
| CS4 | 2.23 | 3.43 | −9.99 | −6.48 | −14.62 | −11.57 | 9.02 | 3672.37 | 1.58 × 10⁻¹² |
| CS5 | 2.36 | 3.593 | −2.74 | −0.29 | −23.88 | −17.18 | 4.98 | 3628.82 | 5.01 × 10⁻¹⁷ |
| CS6 | 2.40 | 2.81 | −3.69 | −0.48 | −23.64 | −16.93 | 6.08 | 3674.75 | 1.95 × 10⁻¹⁶ |
| CNC | — | 0 | — | — | — | — | 375.67 | 1609.76 | — |
| CS7 | 2.64 | 2.84 | −3.15 | −0.75 | −6.38 | −4.13 | 13.04 | 3673.9 | 9 × 10⁻¹⁷ |
| CS8 | 2.75 | 3.05 | −2.17 | −0.55 | −5.62 | −3.86 | 11.4 | 3634.96 | 2.22 × 10⁻¹⁷ |
| CS9 | 3.74 | 3.34 | −0.56 | 0.96 | −8.71 | −6.32 | 10.65 | 3674.02 | 2.23 × 10⁻¹⁸ |
| GNS | — | 0 | — | — | — | — | 48.35 | 3199.86 | — |
| CS10 | 2.54 | 3.74 | −5.31 | −2.80 | −9.85 | −7.69 | 8.31 | 3673.81 | 1.97 × 10⁻¹⁵ |
| CS11 | 2.68 | 3.65 | −1.94 | −1.07 | −19.51 | −15.33 | −3.36 | 3676.37 | 1.6 × 10⁻¹⁷ |
| CS12 | 2.68 | 3.58 | −3.45 | −1.82 | −7.60 | −6.16 | 8.27 | 3630.32 | 1.38 × 10⁻¹⁶ |
| Systems | ΔH | ΔG | ΔS |
|---|---|---|---|
| CS1 | −25.42 | −12.54 | −0.043 |
| CS2 | −25.00 | −12.39 | −0.042 |
| CS3 | −23.71 | −10.76 | −0.043 |
| CS4 | −8.34 | 1.41 | −0.033 |
| CS5 | −1.50 | 6.12 | −0.026 |
| CS6 | −2.42 | 5.65 | −0.027 |
| CS7 | −1.91 | 6.65 | −0.029 |
| CS8 | −0.90 | 7.12 | −0.027 |
| CS9 | 0.64 | 7.70 | −0.024 |
| CS10 | −3.27 | 3.88 | −0.024 |
| CS11 | −0.76 | 6.26 | −0.024 |
| CS12 | −1.49 | 5.36 | −0.023 |
| System | E(H) | E(L) | Eg | % ΔEg | E(F) |
|---|---|---|---|---|---|
| APN | −6.53 | −1.10 | 5.43 | −3.82 | |
| BNNC | −7.71 | −0.87 | 6.84 | −4.29 | |
| CS1 | −6.74 | −2.27 | 4.47 | 34.66 | −4.50 |
| CS2 | −6.76 | −2.39 | 4.36 | 36.22 | −4.58 |
| CS3 | −7.00 | −2.47 | 4.52 | 33.91 | −4.74 |
| BNNS | −6.53 | −0.04 | 6.49 | −3.29 | |
| CS4 | −6.53 | −1.31 | 5.22 | 19.49 | −3.92 |
| CS5 | −6.39 | −0.96 | 5.42 | 16.37 | −3.68 |
| CS6 | −6.39 | −0.95 | 5.44 | 16.09 | −3.67 |
| CNC | −5.87 | −3.35 | 2.52 | −4.61 | |
| CS7 | −5.84 | −3.38 | 2.46 | 2.25 | −4.61 |
| CS8 | −5.86 | −3.39 | 2.48 | 1.66 | −4.63 |
| CS9 | −5.85 | −3.34 | 2.51 | 0.23 | −4.59 |
| GNS | −4.94 | −2.12 | 2.82 | −3.53 | |
| CS10 | −5.01 | −2.20 | 2.81 | 0.41 | −3.61 |
| CS11 | −5.06 | −2.25 | 2.82 | 0.15 | −3.66 |
| CS12 | −4.97 | −2.16 | 2.81 | 0.29 | −3.56 |
We have tabulated a comparative study of our DFT calculations of the APN molecule for the fifteen bond lengths and twenty-three bond angles with two other theoretical studies in Table S1.† We know that a higher negative cohesive energy means that the structure attains energetically higher stability. To predict the energetic stability of the APN structure, we have calculated the cohesive energy of the drug molecule and found it to be −6.66 eV per atom, which means that the APN drug molecule is energetically stable. To estimate the cohesive energy of the APN drug molecule and studied adsorbents, we used following formula:52
 | (1) |
We have also observed that the IR frequency of APN ranges from 158.61 cm−1 to 3674.09 cm−1. The electronic properties, including HOMO, LUMO, and dipole moment of the APN drug molecule were explored and are tabulated in Tables 1 and 3. A 3.63 Debye dipole moment was recorded for the APN drug molecule, which is in excellent agreement with the 3.65 Debye of M. E. Costas et al.53 The APN molecule has an intrinsic dipole moment, which means the asymmetric charge distribution occurs throughout the whole molecule. This has also been observed from MEP (Fig. 1) where electronic charge-rich regions are mainly on O1, N5, and N4 atoms, which act as electrophilic sites and electronic charge-deficient regions are at N2, N3, and C10 atoms which are considered nucleophilic sites. The HOMO level is from the electron-rich portion, while the LUMO level signifies the electron-deficient portion of the nanostructures. The HOMO and LUMO values are −6.53 eV and −1.10 eV, respectively, where the Fermi level is specified at −3.82 eV.
We have done a comparative study to find a suitable adsorbent for the APN drug molecule, and chosen two nanocages (CNC and BNNC) and two nanosheets (hydrogenated GNS and hydrogenated BNNS). The Th symmetric BNNC was chosen as the APN molecule's adsorbent, which has six tetragonal rings (TR) and eight hexagonal rings (HR).37 There are 36 B–N bonds in BNNC where the bond lengths for the TR and HR rings are found to be 1.49 Å and 1.44 Å, respectively, which are completely consistent with various theoretical and experimental results.44,54,55 The cohesive energy of BNNC was also calculated by means of eqn (1) and found to be −7.42 eV per atom, which is consistent with a previous study.56 In order to confirm the natural existence of BNNC, the vibrational frequency was also studied and recorded from 325.51 cm−1 to 1447.64 cm−1. The dipole moment of BNNC is zero, which means the charges are uniformly distributed over the structure. The boron atom acts as a cation by possessing +0.44 |e| electronic charges, and the nitrogen atom acts as an anion by occupying −0.44 |e| electronic charges, which implies that each B–N bond is ionic in BNNC. From the MEP map shown in Fig. 1, it was also confirmed that the symmetric charge distribution occurred throughout the entire structure. The HOMO and LUMO energy values were calculated as −7.71 eV and −0.87 eV, respectively, and the bandgap was found to be 6.84 eV, which are in good agreement with other studies.44,57,58 From Fig. 1, we noticed that the HOMO of BNNC is mainly situated on nitrogen atoms while the LUMO is present at boron atoms.
On the other hand, there are six tetragonal rings and eight hexagonal rings in the optimized CNC structure. In the 36 C–C bonds of the CNC structure, we found two types of bond length. One is 1.49 Å which is shared between the tetragonal ring and the hexagonal ring; the other is 1.38 Å which is shared between two adjacent hexagonal rings. The cohesive energy calculation, like those of the aforementioned studied adsorbents and adsorbate, was accomplished using eqn (1) and −8.14 eV cohesive energy was found for this structure, which is also consistent with previous reports.59 Its natural existence was confirmed by exploring the IR vibrational mode ranging from 375.67 cm−1 to 1609.76 cm−1. The dipole moment of CNC is zero, and there is no ionic charge on the atoms, which implies the C–C bonds are covalent bonds. The HOMO and LUMO energy values are identified as −5.87 eV and −3.35 eV, respectively, showing a band gap of 2.52 eV.
Our studied BNNS and GNS nanosheets as adsorbents comprise 19 hexagonal rings and 18 H atoms, and contain 90 atomic bonds. In the case of the BNNS structure, there are 9 B–H bonds (1.19 Å), 9 N–H bonds (1.01 Å) and 72 B–N bonds (1.42–1.46 Å). The B–N bond lengths in the central rings are about 1.45 Å, and variation in B–N bond length occurred in the peripheral rings due to the influence of hydrogen atoms, which is similar to previous studies.39,60 We also observed that the boron atoms and nitrogen atoms possessed positive and negative electronic charges, respectively, and along with the hydrogen atoms of the N–H and B–H bonds possessed positive and negative charges, respectively. Hence it can be said that all the bonds are ionic bonds. It should also be mentioned that some peripheral nitrogen atoms possessed more negative charge than central nitrogen atoms. On the other hand, a reverse scenario was observed for boron atoms. In GNS, there are 18 C–H and 72 C–C bonds where the bond length of each C–H bond is 1.09 Å and the C–C bond length varies from 1.36 Å to 1.44 Å, which are supported by previous research work.39 In order to know the energetic stability of the BNNS and GNS nanostructures, we have found the investigated cohesive energies to be −6.67 eV per atom and −7.58 eV per atom, respectively, which are consistent with the results of M. R. Hossain et al.39 Vibrational frequencies ranging from 27.05 cm−1 to 3626.62 cm−1 and from 48.35 cm−1 to 3199.86 cm−1 were observed for BNNS and GNS, respectively, which also proved their natural existence. The HOMO energy values for BNNS and GNS are calculated as −6.53 eV and −4.94 eV while the LUMO energy values are −0.04 eV and −2.12 eV, respectively. The HOMO is mainly located on the N atoms while the LUMO is at the peripheral side's B atoms for the BNNS nanostructure, whereas the HOMO and LUMO are mainly located on several definite C–C atom pairs, which are depicted in Fig. 1. For both nanosheets, a zero dipole moment is observed due to the symmetric charge distribution over the whole nanostructure.
3.2. Adsorption and desorption processes
Primarily, to pick up the most energetically favorable conjugated structure of the APN drug molecule on BNNC, BNNS, CNC, and GNS nanostructures, we inspected the structural properties, adsorption energy, thermodynamics properties etc. with the help of the DFT/B3LYP(6-31G(d,p)) level of theory. From various initial conjugated structures (CSs), we examined and obtained three desirable CSs from each adsorbent, labeled CS1, CS2, and CS3 (APN–BNNC); CS4, CS5, and CS6 (APN–BNNS); CS7, CS8, and CS9 (APN–CNC); CS10, CS11 and CS12 (APN–GNS), which are shown in Fig. 2 and S1.† The APN molecule interacts with our studied adsorbents through oxygen in the carbonyl group or the nitrogen/hydrogen of the PD ring as well as the nitrogen/hydrogen of the PZ ring. To comprehend the adsorption process, we calculated the adsorption energies (EAds) of all conjugated structures by means of the following equation61 and these are tabulated in Table 1.| EAds = ECS − Eadsorbent − EAPN | (2) |
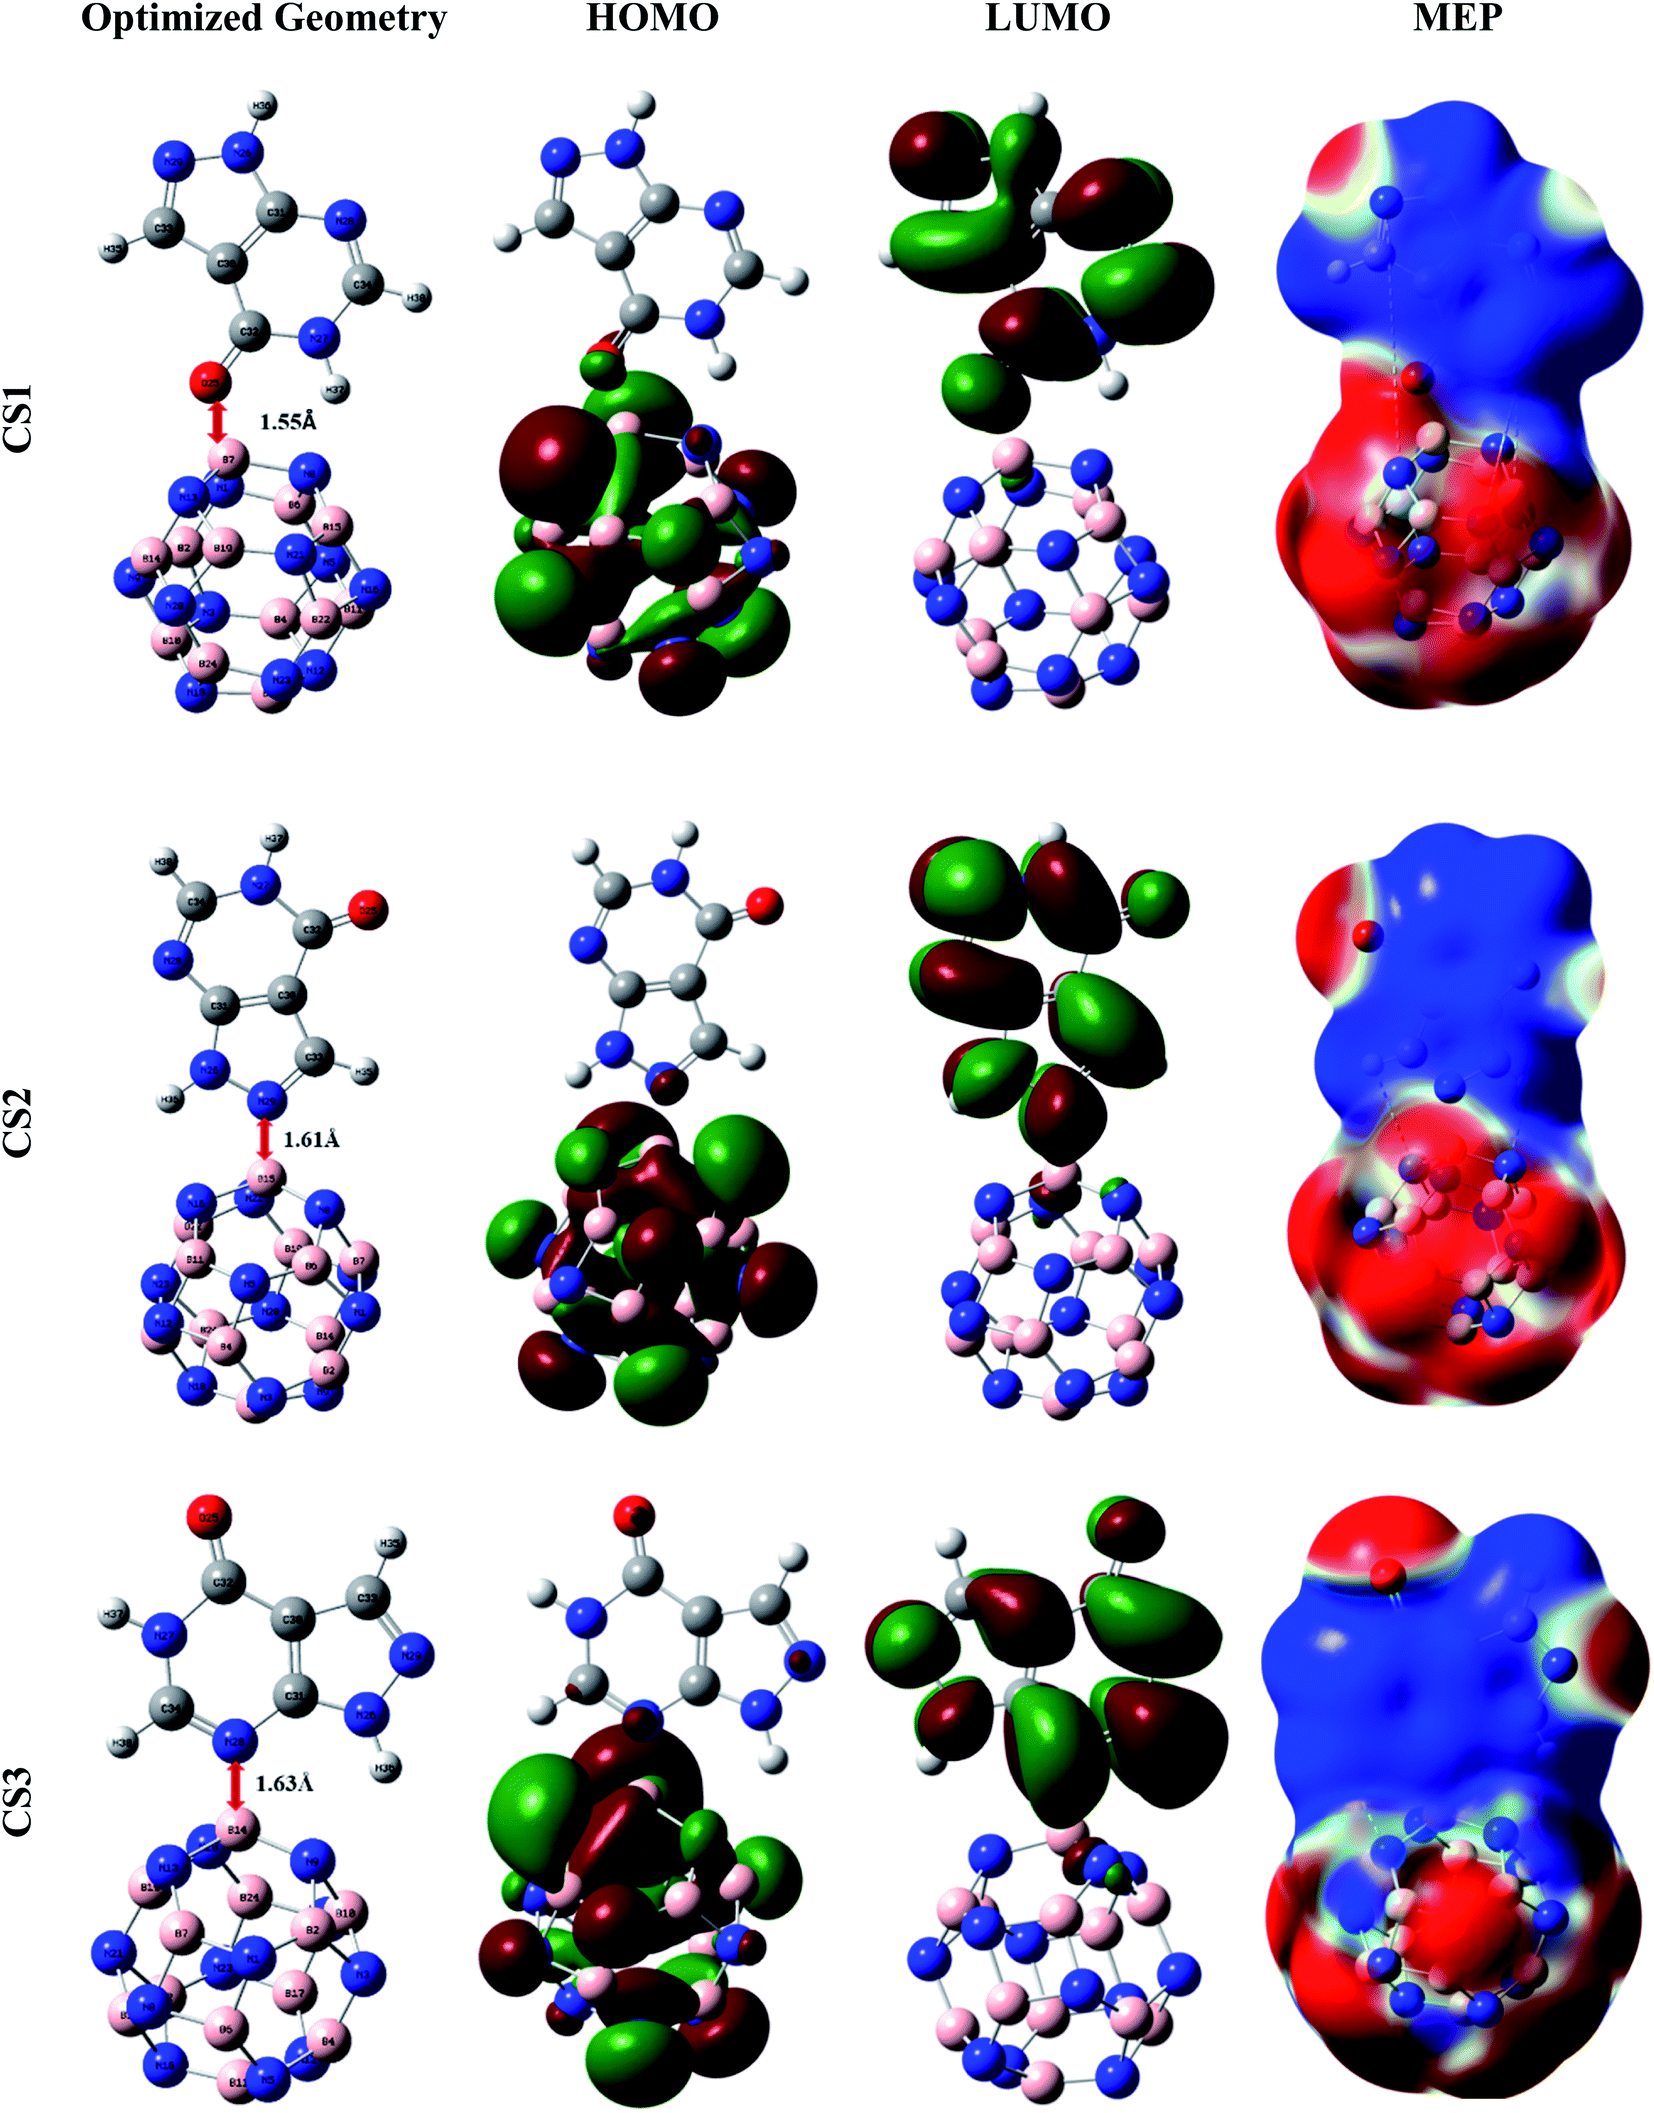 | ||
| Fig. 2 Representations of the optimized geometries, HOMOs, LUMOs, and MEPs of the CS1, CS2, and CS3 structures. | ||
The increase in energy due to the overlapping of the basis sets was adjusted with eqn (3),56 which is known as the basis set superposition error-corrected equation and is used to assess the corrected counterpoise energy.
| EAds,CP = EAds + EBSSE | (3) |
The thermodynamic parameters were also inspected at standard temperature (298.15 K) and standard pressure (1 atm) to realize the thermal stability of the studied conjugated structures. During the chemical process, the change in enthalpy permits us to investigate whether a reaction is endothermic (ΔH > 0) or exothermic (ΔH < 0), and the change in Gibbs free energy gives us information about whether there is a spontaneous interaction (ΔG < 0) or not (ΔG > 0) between the adsorbate drug and the adsorbent. The following equation was adopted to estimate ΔG and ΔH:62
| ΔU = UCS − Uadsorbent − UAPN | (4) |
The change in entropy was calculated by adopting the following equation:62
 | (5) |
It can be positive or negative. Here, a negative change indicates that the structures possess more thermodynamic stability.
From Table 1, we can see the adsorption behavior of the APN–GNS and APN–CNC conjugated structures, where APN interacts with GNS and CNC, maintaining a distance of several Angstroms. The observed BSSE-corrected adsorption energies are very low for all APN–GNS and APN–CNC conjugated structures. In addition, a negligible change in thermodynamic parameters was perceived (as shown in Table 2). Hence, energetic and thermodynamics stability have not been achieved by all the APN–GNS and APN–CNC conjugated structures. Although we have perceived better adsorption energy and thermodynamic parameters for APN–BNNS conjugated structures, which are also not sufficient to nominate the BNNS nanostructures as a carrier or sensor for the APN drug molecule.
In APN–BNNC conjugated structures, the APN drug is adsorbed on BNNC from three sites, the oxygen of the carbonyl group in the PD ring, the nitrogen of the PZ ring, and the nitrogen of the PD ring, to different boron atoms of BNNC, and it maintains minimum distances of 1.55 Å, 1.61 Å, and 1.63 Å from the adsorbent. Additionally, BSSE-corrected adsorption energies (EAds,CP) of −21.00 kcal mol−1, −22.33 kcal mol−1 and −20.90 kcal mol−1 were observed for CS1, CS2 and CS3 conjugated structures, respectively. Previous reports by Mohsen Asle Zaeem et al. and Tanveer Hussain et al. said that the value of EAds of ±1 eV (±23 kcal mol−1) is known as weak chemisorption or strong physisorption.63,64 So, it can be said that the BNNC nanocage interacts towards the APN drug molecule with a strong physisorption (weak chemisorption) process, which is feasible for a good adsorption–desorption manner with a reasonable recovery time. The wB97XD functional was also utilized to comprehend the dispersion effect on the adsorption process for all conjugated structures which increase the adsorption energy. The BSSE-corrected EAds,CP of CS1, CS2 and CS3 are −27.30 kcal mol−1, −30.09 kcal mol−1 and −30.13 kcal mol−1, respectively, which are slightly greater than the EAds,CP energies calculated with the B3LYP functional. So, it can be claimed by analyzing our investigated EAds,CP results with the help of both B3LYP and wB97XD functionals that weak chemisorption has occurred between the APN drug molecule and the BNNC nanocage.
In order to comprehend the thermodynamic stability, we calculated ΔH, ΔG, and ΔS for three studied conjugated structures of APN–BNNC and these are tabulated in Table 2. The negative values of ΔH, ΔG, and ΔS for the APN–BNNC structures indicate that the interactions are exothermic, spontaneous and thermodynamically ordered. The natural existence of the three studied APN–BNNC conjugated structures was proved by calculating the IR frequency in the ranges of 19.26 cm−1 to 3667.13 cm−1, 27.59 cm−1 to 3602.47 cm−1, and 23.75 cm−1 to 3599.90 cm−1 for CS1, CS2, and CS3, respectively.
The recovery time (τ), the time required for the desorption of an adsorbate from the adsorbent, is another crucial parameter in the drug sensing arena. Since APN–BNNC conjugated structures have attained more energetic and thermodynamic stability, it is essential to calculate the recovery time to nominate BNNC as an efficient sensor for the APN molecule. According to the investigations by S. Thomas and M. A. Zaeem, a short recovery time of an adsorbent is favorable for fabricating an efficient sensing device.65,66 By considering this issue, we have taken the initiative to evaluate the recovery time by the following equation:67
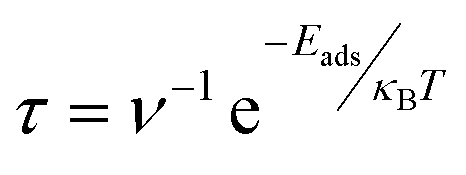 | (6) |
3.3. Dipole moment and MEP maps
A dipole moment arises in a molecule due to the asymmetric charge distribution over the whole molecule. In Section 3.1, we explained the dipole moment of adsorbate and adsorbents, where we found that the adsorbate (the APN molecule) possessed a dipole moment due to its asymmetric charge distribution over the entire molecule. On the other hand, all adsorbents possessed zero dipole moment owing to their symmetric charge distribution over the whole bare structures. After the interaction of the APN molecule with all studied adsorbents, all the conjugated structures attained a DM, as shown in Table 1. This improvement in DM is a consequence of the asymmetric redistribution of transferred charges between adsorbate and adsorbent. In the case of APN–GNS conjugated structures, 3.74 Debye, 3.65 Debye, and 3.58 Debye dipole moments are generated in CS10, CS11, and CS12 conjugated structures, respectively. Similarly, 2.84 Debye, 3.05 Debye, and 3.34 Debye are detected for the three studied structures of the APN–CNC conjugated nanostructures, respectively. In addition, for CS4, CS5, and CS6, 3.43 Debye, 3.593 Debye, and 2.81 Debye are perceived, respectively. Finally, in the case of APN–BNNC conjugated structures, 8.72 Debye, 10.48 Debye, and 4.93 Debye are observed for the three studied conjugated structures named CS1, CS2, and CS3, respectively. From the DM data analysis, we have observed that the trend in the enhancement of dipole moment due to the interaction of our adsorbents with the APN molecule is BNNC > GNS > BNNS > CNC. This means the adsorbate–adsorbent charge transportation in the case of BNNC is significantly higher than for the other adsorbents, which is the reason for the stronger attraction between APN and BNNC.The molecular electrostatic potential (MEP) map reveals the asymmetric charge distribution by showing the higher (positively charged area) and lower (negatively charged area) electrostatic potential area of a molecule. The MEP surfaces are well defined by the 0.0004 electron per bohr3 contour of the electronic charge density. The red to blue (−0.01 a.u. to 0.01 a.u.) colour scheme for the MEP surface indicates the electron-rich site named the electrophilic attack region to the electron-deficient site termed the nucleophilic attack region of the surface, respectively. The MEP maps of the conjugated structures (shown in Fig. S1†) show less alteration in charge density on the adsorbents and APN drug molecule surfaces, which confirms that unfavorable interactions have taken place between the APN dug molecule and the studied adsorbents (GNS, CNC and BNNS). In addition, overall, the red and blue colours are scattered over the whole conjugated structures for the studied APN–GNS, APN–CNC, and APN–BNNS conjugated structures. On the other hand, almost one side of the whole surface is occupied by the red colour (lower electrostatic potential) and the other side by the blue colour (higher electrostatic potential) in the case of APN–BNNC conjugated structures. To be precise, the portion of the APN molecule is blue, and the portion of BNNC is red, which indicates that charge transformation has taken place from the APN drug molecule to the BNNC nanocage. Hence, it has also been attested that APN–BNNC conjugated structures possessed more adsorption energy and more dipole moment than the other conjugated structures.
3.4. Frontier molecular orbitals
The frontier molecular orbitals (FMO), specifically the HOMO and LUMO of the nanostructures, are used to explain the concept of the interaction between adsorbent and adsorbate. In addition, HOMO energy is associated with the ionization potential due to its availability of electrons that can be donated, whereas LUMO energy is correlated to the electron affinity owing to its lack of electrons. Another crucial parameter is the HOMO–LUMO gap that is used to describe the electrical and optical properties of the conjugated structures. In Section 3.1, we discussed the FMO of the proposed adsorbents and adsorbate. The FMO analysis shows that the HOMO and LUMO energy levels remain in the adsorbents in the case of APN–GNS and APN–CNC conjugated structures (CS7–CS12) which means that there is no significant interaction (shown in Fig. S1†). In the case of APN–BNNS conjugated structures, the HOMO energies changed from −6.53 eV to −6.53 eV, −6.39 eV and −6.39 eV and the LUMO energies changed from −0.04 eV to −1.31 eV, −0.96 eV, −0.95 eV for CS4, CS5, and CS6 conjugated structures, respectively. Furthermore, the HOMO is localized on the nitrogen atoms of the BNNS adsorbent while the LUMO is distributed over the whole structure of the APN drug molecule for the CS4 structure. In addition, for the rest of the studied conjugated structures of APN–BNNS, the HOMO and LUMO are localized on the APN drug molecule.Moreover, the HOMO energies are stabilized at −6.74 eV, −6.76 eV and −7.00 eV from −7.71 eV and the LUMO energies are at −2.27 eV, −2.39 eV and −2.47 eV from −0.87 eV with respect to bare BNNC for CS1, CS2, and CS3 conjugated structures, respectively (as shown in Table 3). As well as that, for all the studied APN–BNNC conjugated nanostructures, the HOMO is localized on the adsorbent BNNC especially on the nitrogen atoms, whereas the LUMO is distributed over the whole structure of APN, as shown in Fig. 2. So, a shifting of the HOMO and LUMO levels occurs between BNNC and the APN drug, respectively, which predicts a favorable interaction in the case of APN–BNNC conjugated structures.
Insufficient changes in the energy gap (Eg) have been observed for APN–GNS and APN–CNC conjugated structures, which is supported by PDOS and TDOS studies of the adsorbate, adsorbents, and their conjugated structures. The decreases in Eg have been perceived as 19.49%, 16.37%, and 16.09% for CS4, CS5, and CS6 structures, respectively (as shown in Table 3). Additionally, in the PDOS and TDOS studies, a decrease in Eg in the energy band of BNNS has also been observed after interaction with the APN drug molecule. In the case of APN–BNNC conjugated structures, the HOMO–LUMO gaps are shifted from 6.84 eV to 4.47 eV, 4.36 eV and 4.52 eV which are 34.66%, 36.22% and 33.91% decreases for the CS1, CS2, and CS3 structures, respectively (as shown in Table 3). These data are comparable with previous studies by Alireza Soltani and coworkers.69–71 Also, according to Paria Fallahi et al., the decrease in Eg is related to the increase in conductivity of the nanostructure.72 Accordingly, this decrease in Eg for the interaction of APN with the BNNC nanostructure can produce electrical noise, which reveals the potential application of BNNC as an APN drug sensor.
We also performed a calculation of the PDOS of the adsorbate molecule and adsorbent nanostructures and the TDOS of the conjugated structures to realize the orbital hybridization by confirming the availability of the newly generated energy state in the energy band. In Fig. 3, several energy states can be seen in the energy gap of bare BNNC after interaction with the APN drug molecule. This means that orbital hybridization has occurred in the case of all the proposed APN–BNNC conjugated nanostructures. Hence, the energy gap of all the studied APN–BNNC conjugated structures has been reduced, which supports the change in the numerical value of the HOMO–LUMO gap.
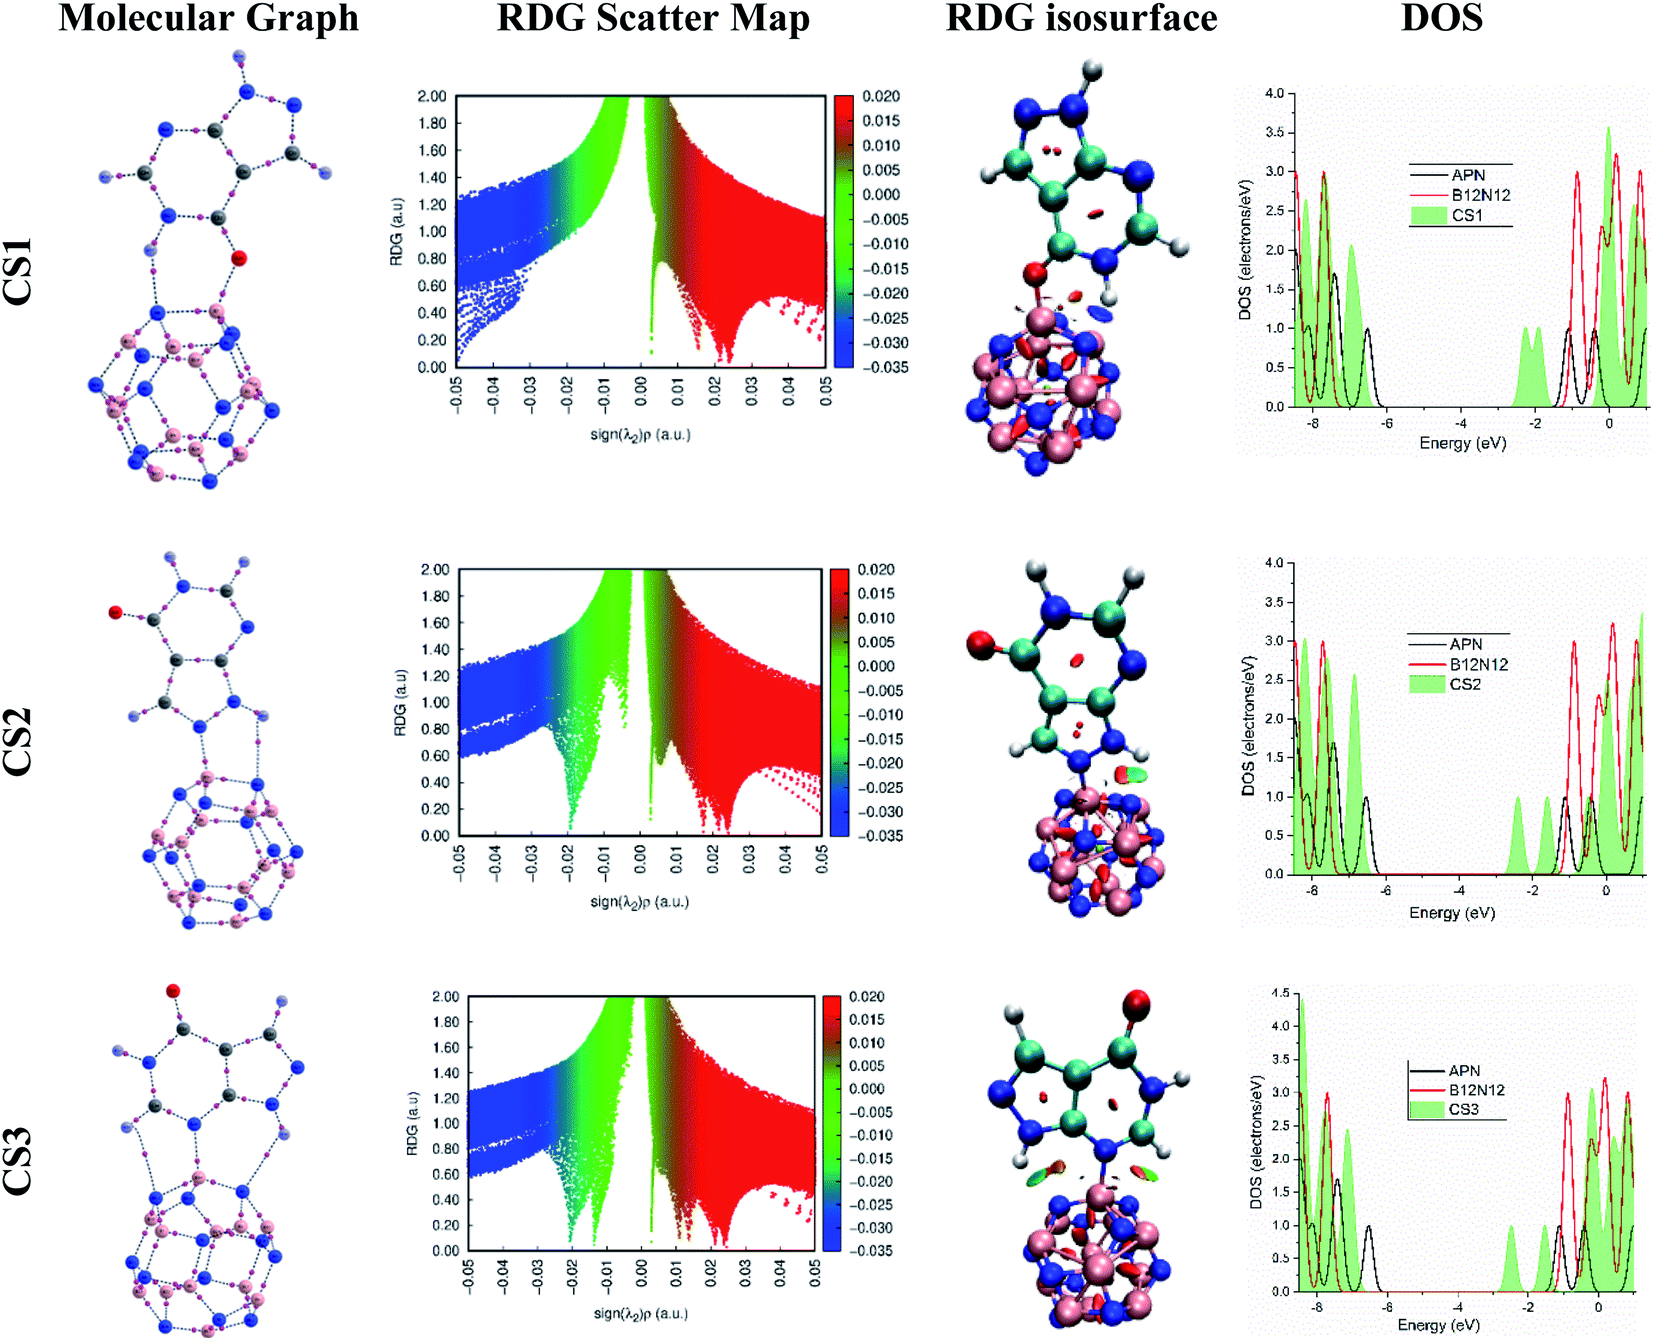 | ||
| Fig. 3 The molecular graphs, RDG scatter maps, RDG isosurfaces, and DOS of the CS1, CS2, and CS3 structures. | ||
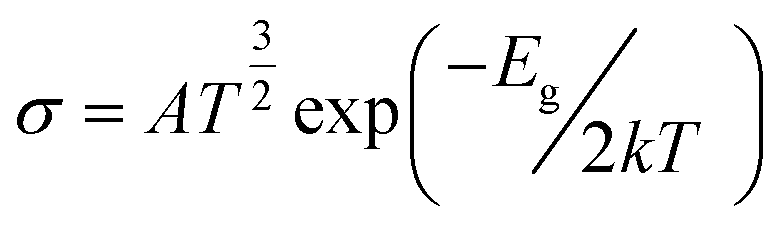
The change in the energy gap (Eg) and the conductivity (σ) are related by the following equation.73
 | (7) |
 is a constant. According to this equation, the conductivity increases exponentially with a reduction in the HOMO–LUMO energy gap. This means an electrical signal is generated due to the reduction in the energy band, which is a most important parameter for sensing drug molecules by adsorbents. Thus, our study reveals that the sensitivity of the adsorbents toward the APN molecule follows the trend: σ(BNNC) > σ(BNNS) > σ(CNC) > σ(GNS). Hence, it can be claimed that BNNC is more sensitive towards the APN drug molecule than the other three adsorbents. Thus, BNNC is a promising nanomaterial for sensing the APN molecule.
3.5. Quantum molecular descriptors
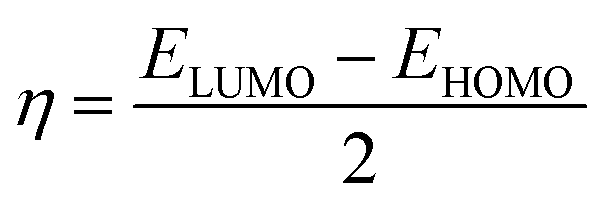
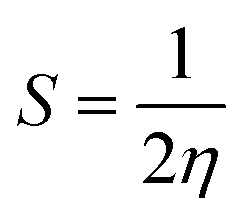
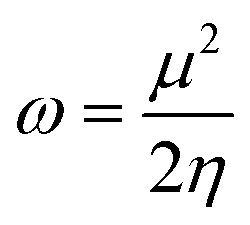
Quantum molecular descriptor (QMD) analyses are needed to decipher the information on chemical stability and reactivity of adsorbate and its adsorbents. According to Koopman's theorem, global reactivity descriptors, such as global hardness (η), global softness (S), and global electrophilicity index (ω), can be calculated by means of the following equations.74–76
 | (8) |
 | (9) |
 | (10) |
The global hardness (η) can be seen as a resistance to charge transfer, which means that the higher its value, the lower the chemical reactivity and the higher the chemical stability. It has been calculated to decrypt the essence of chemical reactivity between the proposed adsorbate and adsorbents (as shown in Table 4). We can observe from the data in Table 4 that the global hardness of BNNC has been reduced after interaction with the APN drug molecule from 3.42 eV to 2.24 eV, 2.18 eV, and 2.26 eV for the CS1, CS2, and CS3 structures, respectively. This is an indication of increasing chemical reactivity over that of bare BNNC. On the other hand, the global softness (S) and electrophilicity index (ω) of BNNC have increased from its pristine structures, which are shown in Table 4. In brief, it can be remarked that higher variation in global hardness and global softness, as well as in the electrophilicity index, have been perceived for APN–BNNC conjugated structures compared to other conjugated structures (as shown in Table 4). Hence, we can conclude that the BNNC is more interactive towards the APN drug molecule than other adsorbents.
| System | μ | χ | η | ω | S |
|---|---|---|---|---|---|
| APN | −3.82 | 3.82 | 2.71 | 2.69 | 0.18 |
| BNNC | −4.29 | 4.29 | 3.42 | 2.69 | 0.15 |
| CS1 | −4.50 | 4.50 | 2.24 | 4.53 | 0.22 |
| CS2 | −4.58 | 4.58 | 2.18 | 4.80 | 0.23 |
| CS3 | −4.74 | 4.74 | 2.26 | 4.96 | 0.22 |
| BNNS | −3.29 | 3.29 | 3.24 | 1.67 | 0.15 |
| CS4 | −3.92 | 3.92 | 2.61 | 2.94 | 0.19 |
| CS5 | −3.68 | 3.68 | 2.71 | 2.49 | 0.18 |
| CS6 | −3.67 | 3.67 | 2.72 | 2.48 | 0.18 |
| CNC | −4.61 | 4.61 | 1.26 | 8.45 | 0.40 |
| CS7 | −4.61 | 4.61 | 1.23 | 8.63 | 0.41 |
| CS8 | −4.63 | 4.63 | 1.24 | 8.65 | 0.40 |
| CS9 | −4.59 | 4.59 | 1.26 | 8.40 | 0.40 |
| GNS | −3.53 | 3.53 | 1.41 | 4.42 | 0.35 |
| CS10 | −3.61 | 3.61 | 1.41 | 4.63 | 0.36 |
| CS11 | −3.66 | 3.66 | 1.41 | 4.74 | 0.35 |
| CS12 | −3.56 | 3.56 | 1.41 | 4.51 | 0.36 |
The route of charge transfer has also been elucidated by calculation of the electronic chemical potential as well as the fractional number of charges transferred (ΔN) (shown in Tables 4 and S2†). Generally, electrons flow from higher to lower electronic chemical potential until it becomes equal, which is known as the normal electron demand (NED). According to this statement, the electrons flow from the APN drug molecule (−3.82 eV) towards BNNC (−4.29 eV) in the case of APN–BNNC conjugated structures. The negative fractional number of charges transferred (ΔN = (μB − μA)/(ηA + ηB)) causes a negative change in the individual energy of the acceptor 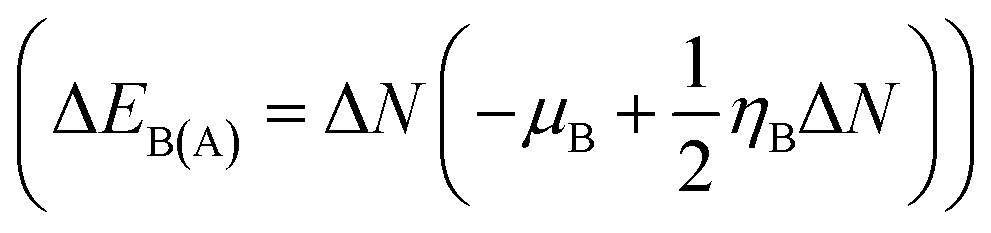 , and thus a negative ΔEB(A) reveals that the APN drug molecule is a donor and BNNC is an acceptor, which is in complete agreement with the MEP result. In addition, the positive change in the individual energy of the donor
 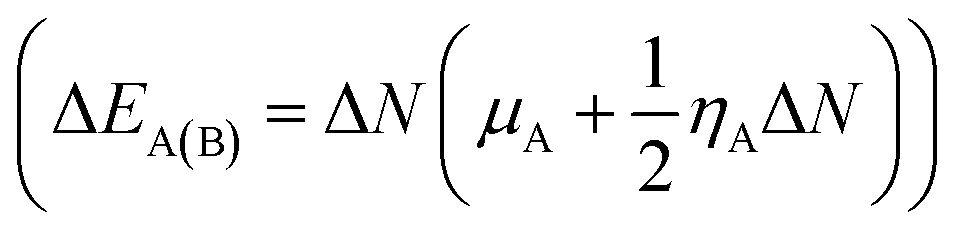 indicates that APN–BNNC conjugated structures are more stable than an individual BNNC or the APN drug molecule. Moreover, the negative value of the total stabilization energy (ΔESE(AB) = ΔEA(B) + ΔEB(A) = −(μB − μA)2/2(ηA + ηB)) shows that a favorable interaction has occurred between the APN drug molecule and BNNC.
3.6. QTAIM investigations
To gain precise and more reliable information about the strength and nature of the interaction (covalent, electrostatic etc.) between the APN drug molecule and the proposed adsorbent nanostructures, we executed QTAIM analysis with the help of the AIMALL program. The obtained topological parameters at bond critical points (BCPs), such as electron densities (ρbcp) and their Laplacians (∇2ρbcp), potential electron energy densities (Vbcp), kinetic electron energy densities (Gbcp), and total electron energy densities (Hbcp) and the −Gbcp/Vbcp ratio of all studied conjugated nanostructures, are summarized in Table 5, with a pictorial representation of BCP in Fig. 3 and S2.† According to the quantum theory of atoms in molecules, the positive and negative values of Hbcp signify closed-shell interactions and shared interactions, respectively.77 It is worth revealing that a weak electrostatic interaction will be observed for (−Gbcp/Vbcp) > 1 and covalent interaction will occur for (−Gbcp/Vbcp) < 1. In addition, positive values of both ∇2ρbcp and Hbcp signify an electrostatic interaction, negative values of both ∇2ρbcp and Hbcp denote a strong covalent interaction, and a negative value of Hbcp with a positive value of ∇2ρbcp refer to partially covalent interactions.78 According to data analysis of the topological parameters at BCPs, our investigated results reveal that the critical bond paths are generated due to the weak electrostatic interaction between adsorbate and adsorbents for APN–BNNS, APN–CNC, and APN–GNS conjugated structures, which confirm our geometrical and electronic properties. On the other hand, in the three studied APN–BNNC conjugated structures, we found seven critical bond paths. Among them, four bonds are partially covalent because of their negative value of Hbcp and positive value of ∇2ρbcp, and three are electrostatic in nature (Hbcp > 0 and ∇2ρbcp > 0). As can be seen from Table 5, partial covalent interactions are observed for those atoms between the APN drug molecule and the BNNC nanostructure, which are within the minimum distance. This is the reason behind the feasible attraction between the APN molecule and the BNNC nanostructure.| System | Interacting atoms | Distance | ρbcp | ∇2ρbcp | Vbcp | Gbcp | Hbcp | −Gbcp/Vbcp |
|---|---|---|---|---|---|---|---|---|
| CS1 | B7–O25 | 1.55 | 0.118 | 0.456 | −0.255 | 0.184 | −0.070 | 0.724 |
| N8–H37 | 1.74 | 0.049 | 0.108 | −0.036 | 0.031 | −0.004 | 0.875 | |
| CS2 | B15–N29 | 1.61 | 0.124 | 0.334 | −0.258 | 0.171 | −0.087 | 0.662 |
| N16–H36 | 2.22 | 0.019 | 0.065 | −0.013 | 0.015 | 0.001 | 1.102 | |
| CS3 | N9–H36 | 2.16 | 0.021 | 0.060 | −0.014 | 0.015 | 0.0004 | 1.028 |
| B14–N28 | 1.63 | 0.119 | 0.273 | −0.240 | 0.154 | −0.086 | 0.642 | |
| N13–H38 | 2.44 | 0.014 | 0.057 | −0.009 | 0.012 | 0.002 | 1.266 | |
| CS4 | H13–O73 | 2.33 | 0.013 | 0.041 | −0.010 | 0.010 | 0.0003 | 1.032 |
| H12–O73 | 2.23 | 0.015 | 0.045 | −0.011 | 0.011 | 9.7 × 10⁻⁵ | 1.009 | |
| N48–H85 | 2.29 | 0.015 | 0.038 | −0.010 | 0.010 | 4.8 × 10⁻⁵ | 1.005 | |
| CS5 | N51–H84 | 2.36 | 0.013 | 0.033 | −0.008 | 0.008 | 0.000 | 1.016 |
| N50–N76 | 3.69 | 0.003 | 0.012 | −0.002 | 0.002 | 0.001 | 1.379 | |
| CS6 | N55–O73 | 3.50 | 0.004 | 0.016 | −0.002 | 0.003 | 0.001 | 1.382 |
| N54–H85 | 2.40 | 0.012 | 0.032 | −0.007 | 0.008 | 0.0003 | 1.040 | |
| N49–H86 | 3.50 | 0.002 | 0.006 | −0.001 | 0.001 | 0.0004 | 1.611 | |
| CS7 | C12–O25 | 3.34 | 0.004 | 0.017 | −0.003 | 0.003 | 0.001 | 1.361 |
| C8–H37 | 2.64 | 0.008 | 0.022 | −0.004 | 0.005 | 0.001 | 1.223 | |
| CS8 | C23–H36 | 2.75 | 0.008 | 0.022 | −0.003 | 0.004 | 0.001 | 1.283 |
| CS9 | C3–N26 | 3.74 | 0.003 | 0.009 | −0.002 | 0.002 | 0.0004 | 1.277 |
| C16–C33 | 3.79 | 0.003 | 0.008 | −0.001 | 0.002 | 0.0004 | 1.366 | |
| CS10 | H65–O73 | 2.61 | 0.007 | 0.026 | −0.005 | 0.006 | 0.001 | 1.189 |
| H71–O73 | 2.57 | 0.008 | 0.028 | −0.005 | 0.006 | 0.001 | 1.151 | |
| C52–H85 | 2.54 | 0.009 | 0.027 | −0.005 | 0.006 | 0.001 | 1.213 | |
| CS11 | C26–H85 | 2.68 | 0.007 | 0.021 | −0.003 | 0.004 | 0.001 | 1.284 |
| C28–H86 | 3.14 | 0.003 | 0.010 | −0.001 | 0.002 | 0.001 | 1.431 | |
| CS12 | C16–H84 | 2.68 | 0.007 | 0.023 | −0.004 | 0.005 | 0.001 | 1.321 |
| H64–N77 | 2.84 | 0.005 | 0.018 | −0.003 | 0.004 | 0.001 | 1.277 | |
| H61–N77 | 2.69 | 0.007 | 0.023 | −0.004 | 0.005 | 0.001 | 1.218 |
3.7. NBO analysis
Natural bond orbital analysis delivers useful information on intra and intermolecular bonding and hybridization through charge transfer after interaction between adsorbate and adsorbents. In NBO analysis, atomic orbitals (AOs) are transformed into natural bond orbitals (NBOs) through natural atomic orbitals (NAOs) and natural hybrid orbitals (NHOs) i.e. AOs → NAOs → NHOs → NBOs.79 To be precise, the delocalization of electrons occurs from filled Lewis-type donor NBOs to empty non-Lewis-type acceptor NBOs. This means that the delocalized molecular orbitals are transformed into localized molecular orbitals, which is closely linked to chemical bonding concepts.80 A natural bonding orbital and an antibonding orbital are formed between x and y atoms as per following equations:81| σxy = Cxhx + Cyhy | (11) |
 | (12) |
The filled–empty NBO interaction energy, also known as the stabilization energy of the molecule E(2), is a measure of the stability of a molecule. A higher value of E(2) implies that a significant amount of electron density is delocalized from donor NBO to acceptor NBO and greater stability is attained.82 The stabilization energy is evaluated by using second-order perturbation theory and the associated delocalization of charges from donor NBO (i) to acceptor NBO (j) is calculated with the following equation.79,83,84
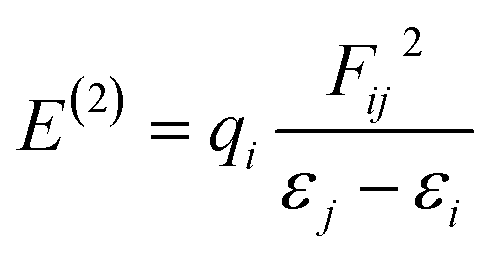 | (13) |
In our study, the NBO analysis was accomplished by the DFT/B3LYP(6-31G(d,p)) level of theory via the NBO 3.1 program integrated into the Gaussian 09 package. The results of NBO analysis for our studied conjugated structures are tabulated in Tables 6 and 7. Our explanations are restricted to the most intra-NBO and inter-NBO interactions of the APN drug molecule and adsorbents. In our study, we found that the APN drug molecule is adsorbed on BNNC nanostructures by generating a sigma bond between them through a transfer of charges while the rest of the adsorbents interacted with the APN drug molecule through a transfer of charges, but no bond was created between them. In Table 6, we can observe σ(B7–O25), σ(B15–N29), and σ(B14–N28) bonds for CS1, CS2 and CS3 conjugated structures, respectively. It is notable that every bonding NBO must be balanced with a corresponding anti-bonding NBO;81 that is why we have observed the corresponding anti-bonding NBO σ*. It can also be observed that the contribution of the natural atomic hybrid orbitals of the corresponding atom in the APN drug molecule to the newly formed NBOs is larger than that of the adsorbent atoms. Let us explain the formation of a new NBO between B7 and O25 atoms in the case of CS1 conjugated structures. The sp4.79 natural atomic hybrid orbital of B7 and sp1.35 natural atomic hybrid orbital of O25 interact with each other and then form a σ(B7–O25) bond where O25 and B7 make 83.65% and 16.35% contributions, respectively.85 The properties of the new NBO are of a p-character rich NBO because the interacting atomic hybrid orbitals are controlled by p-character (as shown in Table 6). A similar pattern can also be perceived for the CS2 and CS3 conjugated structures.
| System | Bond | Occupancy | EDA% | EDB% | Formed NBOs (σxy) | % s character in hybrid AO | % p character in hybrid AO |
|---|---|---|---|---|---|---|---|
| CS1 | σ(B7–O25) | 1.97755 | 16.35 | 83.65 | =0.4044(sp4.79)B7 + 0.9146(sp1.35)O25 | 17.17 | 82.29 |
| 42.46 | 57.52 | ||||||
| σ*(B7–O25) | 0.10050 | 83.65 | 16.35 | =0.9146(sp4.79)B7 − 0.4044(sp1.35)O25 | 17.17 | 82.29 | |
| 42.46 | 57.52 | ||||||
| CS2 | σ(B15–N29) | 1.97193 | 18.92 | 81.08 | =0.4350(sp4.83)B15 + 0.9004(sp1.30)N29 | 17.11 | 82.55 |
| 43.47 | 56.52 | ||||||
| σ*(B15–N29) | 0.10135 | 81.08 | 18.92 | =0.9004(sp4.83)B15 − 0.4350(sp1.30)N29 | 17.11 | 82.55 | |
| 43.47 | 56.52 | ||||||
| CS3 | σ(B14–N28) | 1.95770 | 18.59 | 81.41 | =0.4311(sp4.77)B14 + 0.9023(sp1.59)N28 | 17.28 | 82.38 |
| 38.65 | 61.34 | ||||||
| σ*(B14–N28) | 0.10232 | 81.41 | 18.59 | =0.9023(sp4.77)B14 − 0.4311(sp1.59)N28 | 17.28 | 82.38 | |
| 38.65 | 61.34 |
| System | Intramolecular donor–acceptor NBOs | Intermolecular donor–acceptor NBOs | ||||||
|---|---|---|---|---|---|---|---|---|
| Donor NBO(i) | Acceptor NBO(j) | E(2) kcal mol−1 | Donor NBO(i) | Acceptor NBO(j) | E(2) kcal mol−1 | |||
| CS1 | LP(1) C30 | → | BD*(2) N26–C31 | 195.63 | LP(1) N8 | → | BD*(1) N27–H37 | 26.91 |
| CS2 | LP(1) C30 | → | BD*(2) N26–C31 | 199.43 | BD(2) B6–N8 | → | BD*(1) B15–N29 | 12.74 |
| CS3 | LP(1) C30 | → | BD*(2) N26–C31 | 208.75 | BD(2) B19–N20 | → | BD*(1) B14–N28 | 14.04 |
| CS4 | LP(1) C78 | → | BD*(2) N74–C79 | 215.56 | BD(2) B44–N48 | → | BD*(1) N75–H85 | 4.34 |
| CS5 | LP(1) C78 | → | BD*(2) N74–C79 | 216.06 | BD(2) B39–N51 | → | BD*(1) N74–H84 | 2.61 |
| CS6 | LP(1) C78 | → | BD*(2) N74–C79 | 223.47 | BD(2) B34–N54 | → | BD*(1) N75–H85 | 2.15 |
| CS7 | BD*(2) N28–C34 | → | BD*(2) C30–C31 | 96.10 | BD(2) C8–C15 | → | BD*(1) N27–H37 | 2.53 |
| CS8 | BD*(2) N28–C34 | → | BD*(2) C30–C31 | 94.25 | BD(2) C5–C23 | → | BD*(1) N26–H36 | 1.70 |
| CS9 | BD*(2) N28–C34 | → | BD*(2) C30–C31 | 95.89 | BD*(2) C30–C31 | → | BD*(2) C3–C16 | 0.44 |
| CS10 | BD*(2) C48–C53 | → | BD*(2) C51–C54 | 243.80 | BD(2) C36–C52 | → | BD*(1) N75–H85 | 1.95 |
| CS11 | BD*(2) C13–C15 | BD*(2) C10–C14 | 241.60 | BD(2) C26–C27 | → | BD*(1) N75–H85 | 0.73 | |
| CS12 | BD*(2) C16–C33 | BD*(2) C37–C38 | 138.79 | BD(2) C16–C33 | → | BD*(1) N74–H84 | 0.99 | |
The second-order perturbation interaction energies between filled NBOs and empty NBOs have been calculated and are tabulated in Table 7 along with donor–acceptor NBOs. The 0.50 kcal mol−1 and 0.05 kcal mol−1 threshold stabilization energies for intra-molecular NBOs and intermolecular NBOs have been printed, respectively. We can observe that more electronic charges have transferred between intramolecular NBOs indicating maximum stabilization energy, whereas less electronic charge transfer has occurred between intermolecular NBOs (as shown in Table 7). Maximum charge transfer between intermolecular NBOs of the APN molecule and adsorbents have been perceived for the APN–BNNC conjugated structures (as shown in Table 6). Finally, it can be said, by taking into account the stabilization energy (E(2)) and newly formed σxy, that covalent interaction has been observed for APN–BNNC conjugated structures. This is the reason behind the superior electronic properties achieved by APN–BNNC conjugated structures compared to other conjugated structures.
3.8. RDG analysis
Electron density (ρ), its derivative (∇ρ), and Laplacian (∇2ρ) are used to analyze the non-covalent index (NCI), which enables us to identify the noncovalent interaction between adsorbate and adsorbents. The NCI index is explained by the graph of the reduced density gradient (S(r)) versus electron density (ρ(r)).86
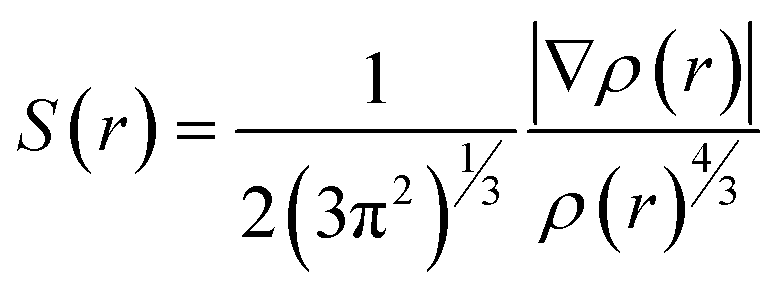 | (14) |
The RDG will have large positive values in a region far from the molecule where the electron density is decaying exponentially to zero. In contrast, the RDG will have small values, approaching zero, for regions of high electron density, indicating both covalent bonding and noncovalent interactions. But at low electron density and low RDG, weak interactions such as van der Waals (vdW) are observed. However, different types of interaction (i.e., attractive and repulsive) can be observed at the same electron density/RDG. ∇2ρ is used to distinguish the different types of interaction by solving the above problem. In order to understand the interactions, ∇2ρ is decomposed into a sum of three eigenvalues of the electron density Hessian matrix along the three principal axes of maximal variation such as ∇2ρ = λ1(r) + λ2(r) + λ3(r), where λ1(r) < λ2(r) < λ3(r). The second eigenvalue (λ2(r)) is used to classify the types of interaction (λ2(r) < 0 for bonding, λ2(r) > 0 for nonbonding and λ2(r) ≈ 0 for vdW) depending on its positive or negative sign and the electron density delivers information regarding the strength of the interaction.87,88 Thus, the graph will be RDG versus sign (λ2)ρ instead of RDG versus ρ. In addition, the color-filled RDG isosurfaces deliver a rich visualization of different types of interactions as wide-ranging regions in real space, rather than only pairwise interaction between atoms. In our analysis, blue, green, and red zones indicate strong hydrogen bonding interaction, weak interaction and strong repulsion or steric interaction in both the RDG scatter map and the color-filled RDG isosurface map, respectively. To accomplish the RDG study, we used the Multiwfn 3.7 software package and VMD software was used to visualize the RDG isosurfaces.89,90 Our analysis in both the RDG scatter map and the color-filled RDG isosurface map will be limited to a discussion of intermolecular interaction.
According to the map of RDG versus sign(λ2)ρ, the RDG scatter map shows green spikes at low electron density and λ2(r) ≈ 0, which confirms that weak electrostatic interaction has occurred between the APN drug molecule and its adsorbents for the APN–GNS, APN–CNC, and APN–BNNS conjugated structures. In addition, the RDG isosurface map also confirms the weak electrostatic interaction by showing the green patches between the APN drug molecule and its adsorbents (as shown in Fig. S2†). Furthermore, at higher electron density and λ2(r) < 0, blue and green blended spikes were witnessed, which confirms that partial covalent interaction has occurred in the three studied APN–BNNC conjugated structures. In addition, the color-filled RDG isosurface map also confirmed the partial covalent interaction by showing the intermolecular bond as well as blue and green patches between the APN drug molecule and BNNC (as shown in Fig. 3). Moreover, our QTAIM data and NBO results also support the RDG analysis.
Hence, in accordance with the analysis of the RDG versus sign (λ2)ρ graph and RDG isosurface map, it can be concluded that higher interaction strength has been perceived for APN–BNNC conjugated structures due to the partial covalent interaction between the APN molecule and BNNC. That is why APN–BNNC conjugated structures achieved superior structural and electronic properties in favor of sensing than other conjugated structures.
3.9. Solvent effects
To realize the influence of polar media like water with a dielectric constant of 78.3553 on the interaction between the APN drug molecule and studied adsorbents, we optimized the adsorbate, adsorbents, and their conjugated structures by using the polarizable continuum model (PCM) with the help of the aforementioned level of theory and computed the Eads, DM, HOMO and LUMO energy and H–L energy gap etc. by means of the respective equations which were described in previous sections. The Eads of the conjugated structures in the water medium follow the same trend as the adsorption energies of the conjugated structures achieved in a gas medium. This means the APN–BNNC conjugated structures achieved more negative values of Eads, which are slightly greater than those in the gas medium, indicating an increase in stability in the water medium (as shown in Table 8). In addition, the DM of the conjugated structures in the water medium has increased in comparison to the gas medium, which implies that the reactivity and solubility of the studied conjugated structures have increased. Moreover, APN–BNNC conjugated structures achieved a bigger DM than those of the other conjugated structures, which indicates the highest reactivity and solubility among all the studied conjugated structures.| System | DM | Eads | E(H) | E(L) | Eg | % ΔEg |
|---|---|---|---|---|---|---|
| APN | 4.85 | — | −6.56 | −1.03 | 5.53 | — |
| BNNC | 0 | — | −7.70 | −0.81 | 6.89 | — |
| CS1 | 12.22 | −27.21 | −7.00 | −1.82 | 5.18 | 24.81 |
| CS2 | 13.88 | −28.73 | −7.00 | −1.89 | 5.11 | 25.82 |
| CS3 | 6.95 | −26.45 | −7.02 | −1.97 | 5.04 | 26.79 |
| BNNS | 0.01 | — | −6.58 | −0.08 | 6.50 | — |
| CS4 | 4.87 | −5.61 | −6.56 | −1.14 | 5.42 | 16.66 |
| CS5 | 5.10 | −1.48 | −6.57 | −1.04 | 5.53 | 14.94 |
| CS6 | 4.76 | −1.75 | −6.57 | −1.05 | 5.52 | 15.05 |
| CNC | 0 | — | −5.79 | −3.28 | 2.51 | — |
| CS7 | 4.55 | −1.73 | −5.79 | −3.30 | 2.49 | 0.81 |
| CS8 | 4.58 | −1.32 | −5.81 | −3.31 | 2.50 | 0.62 |
| CS9 | 4.81 | −0.60 | −5.79 | −3.27 | 2.51 | −0.10 |
| GNS | 0 | — | −5.10 | −2.28 | 2.82 | — |
| CS10 | 4.74 | −2.43 | −5.10 | −2.28 | 2.82 | 0.11 |
| CS11 | 5.01 | −0.34 | −5.13 | −2.31 | 2.82 | 0.08 |
| CS12 | 4.97 | −1.53 | −5.09 | −2.27 | 2.82 | 0.15 |
The change in the HOMO–LUMO gap of the studied conjugated structures in the water medium has also been calculated and explained for nominating an electrical sensor for the APN molecule from among the studied adsorbents. In the case of APN–GNS and APN–CNC conjugated structures, there are no changes in Eg and an insufficient change in Eg has also been observed in the APN–BNNS conjugated structures. That means these three adsorbents are not efficient enough as electrical sensors. On the other hand, 24.81%, 25.82%, and 26.79% changes in the energy gap have been perceived for CS1, CS2, and CS3 structures, respectively. Furthermore, these variations in Eg of APN–BNNC in the water medium are good for sensing the APN drug molecule. Finally, the superior properties of APN–BNNC structures (highest Eads, DM, and change in HOMO–LUMO gap) in the water medium have also made the BNNC an invincible candidate for sensing the APN molecule in a polar medium, especially in water.
4. Conclusions
In this research work, a comparative study has been undertaken to find an efficient nanodevice sensor for the APN drug molecule based on the DFT B3LYP/6-31G(d,p) level of theory. First, we chose two nanocages (CNC and BNNC) and two nanosheets (GNS and BNNS) as adsorbents for the APN drug molecule. We calculated the cohesive energies of the optimized adsorbate and adsorbents to confirm their stability. After getting convincing cohesive energies, we observed the adsorption process of the APN molecule on the adsorbents using both B3LYP and wB97XD functionals. Unfavorable interaction energy and thermodynamic parameters were observed for the APN–GNS and APN–CNC conjugated structures. Although a glimpse of suitable structural and thermodynamic parameters was found in the case of APN–BNNS, these were insufficient for drug delivery and drug sensing aims. However, in the case of the APN–BNNC conjugated structure, the obtained adsorption energy shows that a weak chemisorption-type adsorption process has occurred, and recovery times in the millisecond range are also observed which make a suitable adsorption–desorption process feasible for drug sensing applications. In this adsorption process, charge transfer has taken place from the APN drug to BNNC, which is confirmed based on QMD data, MEP, and fractional number of charge transfer calculations (ΔN). Based on QTAIM, NBO, and RDG analyses, we comprehended that partial covalent interactions have occurred between the APN drug molecule and the adsorbent BNNC. A maximum decrease in the energy gap of up to 36.22% (26.79%) was observed for APN–BNNC conjugated structures in the gas (water) phase. In addition, the sensitivities of our studied adsorbents toward the APN molecule are in the order σ(BNNC) > σ(BNNS) > σ(CNC) > σ(GNS). Our study reveals that superior properties in terms of sensing have been achieved with BNNC after interaction with the APN molecule. Therefore, we can recommend that BNNC would be a promising nanomaterial for detecting the APN drug molecule. Computer-aided drug sensing research consists of a large range of computational and theoretical approaches which deal with the electronic behavior of a drug molecule when it interacts with a nano-adsorbent. This research methodology has made a key contribution to sensing various drugs which are in use or at the clinical trial stage. The future aim of our research is to reproduce the results of this investigation experimentally, which can help avoid the adverse effects of the APN drug.Author contributions
Md. Helal Miah: writing – original draft, formal analysis, investigation, funding acquisition; Md. Rakib Hossain: writing – review & editing, conceptualization, methodology, validation; Md. Saiful Islam: visualization, data curation; Tahmina Ferdous: resources, software; Farid Ahmed: resources, project administration, supervision.Conflicts of interest
The authors declare that they have no known competing financial interests or personal relationships that could have appeared to influence the work reported in this paper.Acknowledgements
We are very thankful to BSMRSTU Research Cell for a funding allocation to set up the Computational Lab at the Department of Physics in Bangabandhu Sheikh Mujibur Rahman Science and Technology University (BSMRSTU). We also gratefully acknowledge the Higher Education Quality Enhancement Program (HEQEP) subproject CP-3415, University Grant Commission (UGC) of Bangladesh, and the World Bank for financial assistance to set up the Computational Physics (CP) Research Lab in the Department of Physics at Jahangirnagar University. We are also thankful to the Ministry of Science and Technology, Bangladesh for their financial support of this project conducted by members of the Condensed Matter Physics lab at Jahangirnagar University through their R&D fund allocation program.References
- W. Shakir Khayoon, Q. Al-Abaichy, M. Jasim and M. A. Al-Hamadany, Spectrophotometric Determination of Allopurinol in Tablet Formulation, 2008, vol. 19 Search PubMed.
- T. F. Tsai and T. Y. Yeh, American Journal of Clinical Dermatology, 2010, 11, 225–232 CrossRef PubMed.
- G. B. Elion, Science, 1989, 244, 41–47 CrossRef CAS PubMed.
- G. B. Elion, W. H. Lange and G. H. Hitchings, J. Am. Chem. Soc., 1956, 78, 2858–2863 CrossRef CAS.
- R. Acevedo-Chávez, J. Robles and M. E. Costas, J. Mol. Struct.: THEOCHEM, 2003, 664–665, 91–109 CrossRef.
- D. P. Chong, Can. J. Chem., 2013, 91, 637–641 CrossRef CAS.
- J. L. Girardet and J. N. Miner, in Annual Reports in Medicinal Chemistry, Academic Press Inc., 2014, vol. 49, pp. 151–164 Search PubMed.
- P. Pacher, A. Nivorozhkin and C. Szabó, Pharmacol. Rev., 2006, 58, 87–114 CrossRef CAS.
- K. Turnheim, P. Krivanek and R. Oberbauer, Br. J. Clin. Pharmacol., 1999, 48, 501–509 CrossRef CAS PubMed.
- R. O. Day, G. G. Graham, M. Hicks, A. J. McLachlan, S. L. Stocker and K. M. Williams, Clin. Pharmacokinet., 2007, 46, 623–644 CrossRef CAS PubMed.
- J. M. Lü, Q. Yao and C. Chen, Biochem. Pharmacol., 2013, 86, 1328–1337 CrossRef PubMed.
- F. Borges, E. Fernandes and F. Roleira, Curr. Med. Chem., 2012, 9, 195–217 CrossRef.
- A. Šmelcerović, K. Tomović, Ž. Šmelcerović, Ž. Petronijević, G. Kocić, T. Tomašič, Ž. Jakopin and M. Anderluh, Eur. J. Med. Chem., 2017, 135, 491–516 CrossRef PubMed.
- K. M. Jordan, J. S. Cameron, M. Snaith, W. Zhang, M. Doherty, J. Seckl, A. Hingorani, R. Jaques and G. Nuki, Rheumatology, 2007, 46, 1372–1374 CrossRef PubMed.
- M. Gorrie, M. Beaman, A. Nicholls and P. Blackwell, BMJ, 1994, 308, 113 CrossRef CAS PubMed.
- N. Dalbeth and L. Stamp, Seminars in Dialysis, 2007, 20, 391–395 CrossRef PubMed.
- W.-H. Chung, C.-W. Wang and R.-L. Dao, J. Dermatol., 2016, 43, 758–766 CrossRef CAS PubMed.
- S. Halevy, P. D. Ghislain, M. Mockenhaupt, J. P. Fagot, J. N. Bouwes Bavinck, A. Sidoroff, L. Naldi, A. Dunant, C. Viboud and J. C. Roujeau, J. Am. Acad. Dermatol., 2008, 58, 25–32 CrossRef PubMed.
- M. S. Lin, Y. S. Dai, R. F. Pwu, Y. H. Chen and N. C. Chang, Intern. Med. J., 2005, 35, 188–190 CrossRef PubMed.
- K. S. Novoselov, A. K. Geim, S. V Morozov, D. Jiang, Y. Zhang, S. V Dubonos, I. V Grigorieva and A. A. Firsov, Science, 2004, 306, 666–669 CrossRef CAS PubMed.
- N. Dastani, A. Arab and H. Raissi, Adsorption, 2020, 26, 879–893 CrossRef CAS.
- H. He, J. Klinowski, M. Forster and A. Lerf, Chem. Phys. Lett., 1998, 287, 53–56 CrossRef CAS.
- H. Mianehrow, M. H. M. Moghadam, F. Sharif and S. Mazinani, Int. J. Pharm., 2015, 484, 276–282 CrossRef CAS.
- H. Rahman, M. R. Hossain and T. Ferdous, J. Mol. Liq., 2020, 320, 114427 CrossRef CAS PubMed.
- P. Wu, Q. Shao, Y. Hu, J. Jin, Y. Yin, H. Zhang and C. Cai, Electrochim. Acta, 2010, 55, 8606–8614 CrossRef CAS.
- A. Hatamie, F. Marahel and A. Sharifat, Talanta, 2018, 176, 518–525 CrossRef CAS PubMed.
- S. Liu, W. Dong, X. Zeng, Z. Guo, P. Zong, B. Li, X. Meng and G. Zuo, J. Chem. Technol. Biotechnol., 2019, 94, 628–633 CrossRef CAS.
- L. Sen Lin, Z. X. Cong, J. Li, K. M. Ke, S. S. Guo, H. H. Yang and G. N. Chen, J. Mater. Chem. B, 2014, 2, 1031–1037 RSC.
- S. J. Rodríguez and E. A. Albanesi, Phys. Chem. Chem. Phys., 2019, 21, 597–606 RSC.
- M. Z. Tonel, M. O. Martins, I. Zanella, R. B. Pontes and S. B. Fagan, Comput. Theor. Chem., 2017, 1115, 270–275 CrossRef CAS.
- E. S. Mirkamali, R. Ahmadi, K. Kalateh and G. Zarei, Nanomed. J., 2019, 6, 112–119 CAS.
- E. O. Kweitsu, S. K. Armoo, K. Kan-Dapaah, E. K. K. Abavare, D. Dodoo-Arhin and A. Yaya, Molecules, 2020, 26, 120 CrossRef PubMed.
- R. H. Wentorf Jr, J. Chem. Phys., 1961, 34, 809 CrossRef.
- N. G. Chopra, R. J. Luyken, K. Cherrey, V. H. Crespi, M. L. Cohen, S. G. Louie and A. Zettl, Science, 1995, 269, 966–967 CrossRef CAS PubMed.
- T. Oku, I. Narita and A. Nishiwaki, Mater. Manuf. Processes, 2004, 19, 1215–1239 CrossRef CAS.
- K. K. Kim, A. Hsu, X. Jia, S. M. Kim, Y. Shi, M. Hofmann, D. Nezich, J. F. Rodriguez-Nieva, M. Dresselhaus, T. Palacios and J. Kong, Nano Lett., 2012, 12, 161–166 CrossRef PubMed.
- F. Jensen and H. Toftlund, Chem. Phys. Lett., 1993, 201, 89–96 CrossRef CAS.
- M. Noormohammadbeigi, S. Kamalinahad, F. Izadi, M. Adimi and A. Ghasemkhani, Mater. Res. Express, 2019, 6, 1250g2 CrossRef CAS.
- M. R. Hossain, M. M. Hasan, N.-E. Ashrafi, H. Rahman, M. S. Rahman, F. Ahmed, T. Ferdous and M. A. Hossain, Phys. E, 2021, 126, 114483 CrossRef CAS.
- M. M. Hasan, A. C. Das, M. R. Hossain, M. K. Hossain, M. A. Hossain, B. Neher and F. Ahmed, J. Biomol. Struct. Dyn., 2021, 1–17 CrossRef PubMed.
- M. R. Hossain, M. M. Hasan, M. Nishat, N.-E. Ashrafi, F. Ahmed, T. Ferdous and M. A. Hossain, J. Mol. Liq., 2021, 323, 114627 CrossRef CAS.
- S. U. D. Shamim, M. H. Miah, M. R. Hossain, M. M. Hasan, M. K. Hossain, M. A. Hossain and F. Ahmed, Phys. E, 2022, 136, 115027 CrossRef.
- S. D. Dabhi, B. Roondhe and P. K. Jha, Phys. Chem. Chem. Phys., 2018, 20, 8943–8950 RSC.
- A. Soltani, E. Tazikeh-Lemeski and M. B. Javan, J. Mol. Liq., 2020, 297, 111894 CrossRef CAS.
- K. Nejati, A. Hosseinian, E. Vessally, A. Bekhradnia and L. Edjlali, Appl. Surf. Sci., 2017, 422, 763–768 CrossRef CAS.
- A. Hosseinian, E. Vessally, A. Bekhradnia, S. Ahmadi and P. D. Kheirollahi Nezhad, J. Inorg. Organomet. Polym. Mater., 2018, 28, 1422–1431 CrossRef CAS.
- A. S. Rad, N. Nasimi, M. Jafari, D. S. Shabestari and E. Gerami, Sens. Actuators, B, 2015, 220, 641–651 CrossRef CAS.
- A. D. Becke, J. Chem. Phys., 1993, 98, 1372–1377 CrossRef CAS.
- A. D. Becke, Phys. Rev. A, 1988, 38, 3098–3100 CrossRef CAS PubMed.
- C. Lee, W. Yang and R. G. Parr, Phys. Rev. B: Condens. Matter Mater. Phys., 1988, 37, 785–789 CrossRef CAS PubMed.
- M. J. Frisch, G. W. Trucks, H. B. Schlegel, G. E. Scuseria, M. A. Robb, J. R. Cheeseman, G. Scalmani, V. Barone, G. A. Petersson, H. Nakatsuji, X. Li, M. Caricato, A. Marenich, J. Bloino, B. G. Janesko, R. Gomperts and B. Mennucci, Gaussian 09, Revision D.01, 2009, Gaussian 09 Citation | Gaussian.com Search PubMed.
- A. S. Rad, M. Ardjmand, M. R. Esfahani and B. Khodashenas, Spectrochim. Acta, Part A, 2021, 247, 119082 CrossRef CAS PubMed.
- Density functional study of neutral allopurinol tautomeric forms – Costas – 1999 – Journal of Computational Chemistry – Wiley Online Library.
- R. S. Pease, Acta Crystallogr., 1952, 5, 356–361 CrossRef CAS.
- H. Zhu, C. Zhao, Q. Cai, X. Fu and F. R. Sheykhahmad, Inorg. Chem. Commun., 2020, 114, 107808 CrossRef CAS.
- M. Rakib Hossain, M. Mehade Hasan, S. Ud Daula Shamim, T. Ferdous, M. Abul Hossain and F. Ahmed, Comput. Theor. Chem., 2021, 113156 CrossRef CAS.
- S. Larki, E. Shakerzadeh, E. C. Anota and R. Behjatmanesh-Ardakani, Chem. Phys., 2019, 526, 110424 CrossRef CAS.
- E. Golipour-Chobar, F. Salimi and G. Ebrahimzadeh Rajaei, Monatshefte für Chemie, 2020, 151, 309–318 CrossRef CAS.
- Y. F. Chang, J. P. Zhang, H. Sun, B. Hong, Z. An and R. S. Wang, Int. J. Quantum Chem., 2005, 105, 142–147 CrossRef CAS.
- X. Deng, D. Zhang, M. Si and M. Deng, Phys. E, 2011, 44, 495–500 CrossRef CAS.
- A. S. Rad, Appl. Surf. Sci., 2015, 357, 1217–1224 CrossRef CAS.
- M. Zou, J. Zhang, J. Chen and X. Li, Environ. Sci. Technol., 2012, 46, 8887–8894 CrossRef CAS PubMed.
- S. Thomas and M. Asle Zaeem, Appl. Surf. Sci., 2021, 563, 150232 CrossRef CAS.
- T. Kaewmaraya, L. Ngamwongwan, P. Moontragoon, A. Karton and T. Hussain, J. Phys. Chem. C, 2018, 122, 20186–20193 CrossRef CAS.
- S. Thomas and M. Asle Zaeem, Adv. Theory Simul., 2021, 4, 2000250 CrossRef CAS.
- D. R. Roy, M. A. Zaeem, S. Thomas and V. Kumar, ACS Appl. Nano Mater., 2020, 3, 10073–10081 CrossRef.
- M. Shahabi and H. Raissi, J. Inclusion Phenom. Macrocyclic Chem., 2017, 88, 159–169 CrossRef CAS.
- H. Wang, T. Maiyalagan and X. Wang, ACS Catal., 2012, 2, 781–794 CrossRef CAS.
- A. Soltani, E. Tazikeh-Lemeski and M. B. Javan, J. Mol. Liq., 2020, 297, 111894 CrossRef CAS.
- N. Abdolahi, M. Aghaei, A. Soltani, Z. Azmoodeh, H. Balakheyli and F. Heidari, Spectrochim. Acta, Part A, 2018, 204, 348–353 CrossRef CAS PubMed.
- A. S. Ghasemi, M. R. Taghartapeh, A. Soltani and P. J. Mahon, J. Mol. Liq., 2019, 275, 955–967 CrossRef CAS.
- P. Fallahi, H. Jouypazadeh and H. Farrokhpour, J. Mol. Liq., 2018, 260, 138–148 CrossRef CAS.
- J. Jiang, T. Yan, D. Cui, J. Wang, M. Salehabadi, J. Shen and F. Guo, Appl. Surf. Sci., 2020, 146758 CrossRef.
- A. S. Rad and O. R. Kashani, Appl. Surf. Sci., 2015, 355, 233–241 CrossRef CAS.
- M. M. Hasan, M. H. Kabir, M. A. Badsha and M. R. Hossain, Phosphorus, Sulfur Silicon Relat, Elem., 2021 DOI:10.1080/10426507.2021.1988599.
- M. A. Hossain, M. R. Hossain, M. K. Hossain, J. I. Khandaker, F. Ahmed, T. Ferdous and M. A. Hossain, Chem. Phys. Lett., 2020, 754, 137701 CrossRef CAS.
- R. F. W. Bader, Acc. Chem. Res., 1985, 18, 9–15 CrossRef CAS.
- A. Mortazavifar, H. Raissi and A. Akbari, J. Mol. Liq., 2019, 276, 577–587 CrossRef CAS.
- F. Weinhold and C. R. Landis, Chem. Educ. Res. Pract., 2001, 2, 91–104 RSC.
- M. J. Alam and S. Ahmad, J. Mol. Struct., 2014, 1059, 239–254 CrossRef CAS.
- M. Doust Mohammadi and H. Y. Abdullah, Theor. Chem. Acc., 2020, 139, 1–17 Search PubMed.
- F. Azarakhshi, M. Sheikhi, S. Shahab, M. Khaleghian, K. Sirotsina, H. Yurlevich and D. Novik, Chem. Pap., 2021, 75, 1521–1533 Search PubMed.
- M. Rezaei-Sameti and E. Shiravand, Adsorption, 2020, 26, 955–970 CrossRef CAS.
- A. E. Reed, L. A. Curtiss and F. Weinhold, Chem. Rev., 1988, 88, 899–926 CrossRef CAS.
- S. Murugavel, S. Sundramoorthy, D. Lakshmanan, R. Subashini and P. Pavan Kumar, J. Mol. Struct., 2017, 1131, 51–72 CrossRef CAS.
- E. R. Johnson, S. Keinan, P. Mori-Sánchez, J. Contreras-García, A. J. Cohen and W. Yang, J. Am. Chem. Soc., 2010, 132, 6498–6506 CrossRef CAS PubMed.
- Z. Jia, H. Pang, H. Li and X. Wang, Theor. Chem. Acc., 2019, 138, 113 Search PubMed.
- S. Khan, H. Sajid, K. Ayub and T. Mahmood, J. Mol. Liq., 2020, 316, 113860 CrossRef CAS.
- T. Lu and F. Chen, J. Comput. Chem., 2012, 33, 580–592 CrossRef CAS PubMed.
- W. Humphrey, A. Dalke and K. Schulten, J. Mol. Graphics, 1996, 14, 33–38 CrossRef CAS PubMed.
Footnote |
| † Electronic supplementary information (ESI) available. See DOI: 10.1039/d1ra06948a |
| This journal is © The Royal Society of Chemistry 2021 |