
 Open Access Article
 This Open Access Article is licensed under a Creative Commons Attribution-Non Commercial 3.0 Unported Licence
Structure modulation of g-C3N4 in TiO2{001}/g-C3N4 hetero-structures for boosting photocatalytic hydrogen evolution†
Qianqian Shang ,
Yuzhen Fang,
Xingliang Yin and
Xiangjin Kong*
,
Yuzhen Fang,
Xingliang Yin and
Xiangjin Kong*
College of Chemistry and Chemical Engineering, Liaocheng University, Liaocheng, 252000, China. E-mail: kongxjin@163.com; shangqian@tju.edu.cn
First published on 18th November 2021
Abstract
Structure design of photocatalysts is highly desirable for taking full advantage of their abilities for H2 evolution. Herein, the highly-efficient TiO2{001}/g-C3N4 (TCN) heterostructures have been fabricated successfully via an in situ ethanol-thermal method. And the structure of g-C3N4 in the TCN heterostructures could be exfoliated from bulk g-C3N4 to nanosheets, nanocrystals and quantum dots with the increase of the synthetic temperature. Through detailed characterization, the structural evolution of g-C3N4 could be attributed to the enhanced temperature of the ethanol-thermal treatment with the shear effects of HF acid. As expected, the optimal TCN-2 heterostructure shows excellent photocatalytic H2 evolution efficiency (1.78 mmol h−1 g−1) under visible-light irradiation. Except for the formed built-in electric field, the significantly enhanced photocatalytic activity of TCN-2 could be ascribed to the enhanced crystallinity of TiO2{001} nanosheets and the formed g-C3N4 nanocrystals with large surface area, which could extend the visible light absorption, and expedite the transfer of photo-generated charge carriers further. Our work could provide guidance on designing TCN heterostructures with the desired structure for highly-efficient photocatalytic water splitting.
1. Introduction
Semiconductor photocatalysis provides an efficient strategy for overcoming the energy crisis and global climate deterioration by utilizing solar energy to generate sustainable hydrogen (H2) energy from water splitting.1–3 Since Fujishima discovered TiO2 could split water into H2 in 1972, TiO2 has been paid much attention because of its desirable properties such as low cost, non-biotoxic, photo-corrosion resistance and high photocatalytic activity.4,5 To date, extensive research has verified that the tailored nanocrystal facets of TiO2 have a close relationship with its photocatalytic activity of H2 evolution. Due to the high surface energy (0.90 J m−2), the {001} facet of anatase TiO2 shows higher reactive activity than the commonly investigated {101} facet.6,7 However, the practical application of TiO2 {001} is still impeded by the ineffective utilization of solar light caused by the wide bandgap (∼3.2 eV) and the high recombination rate of photo-generated e−–h+ pairs.8–10 Therefore, exploring the high efficient visible-light driven TiO2{001} based photocatalyst is still highly desired for water splitting.Admittedly, incorporating TiO2{001} with other narrow bandgap semiconductors is supposed to overcome the intrinsic drawbacks of pristine TiO2{001} by forming the internal electric field.11,12 Owing to the excellent chemical stability, tunable electronic structure, low-cost and narrow bandgap (∼2.7 eV), the metal-free g-C3N4 has been identified as a promising candidate for fabricating the heterostructures with TiO2{001}.13,14 Benefiting from the broadened spectral absorption range and the facilitated spatial separation of photo-generated charge carriers, constructing the high-efficient TiO2{001}/g-C3N4 (TCN) heterostructure is always a hot issue for the photocatalytic H2 evolution.15 For instance, Tan et al. vapor-deposited g-C3N4 nanoparticles on the commercialized P25, leading to the rapid migration rate of photo-generated charge carriers.16 However, the commonly employed bulk g-C3N4 (BCN) also suffers from the instinct drawbacks of small specific surface area and high recombination rate of photo-generated e−–h+ pairs, resulting in the limited practical application of TiO2/BCN heterostructures.30–32 It has been verified that the structure of g-C3N4 has a substantial impact on the electronic energy level and surface properties of the fabricated TCN heterostructures.20–22 Coupling TiO2 with a target-specific structure of g-C3N4 has been employed to further improve the photocatalytic H2 production performance. Wang et al. coupled the g-C3N4 nanosheets (CN-NS) with TiO2 flower, showing high efficient visible-light photocatalytic activity.17 Guo et al. hybridized the TiO2 nanoparticles with g-C3N4 nanocrystalline (CN-NC), showing the extended lifetime of photo-generated e−–h+ pairs.18 Li et al. grafted the g-C3N4 quantum dots (CN-QDs) onto TiO2 nanotube, causing the enhanced photocatalytic H2 evolution performance.19 To date, numerous efforts have been implemented to fabricate the TCN heterostructures with a targeted structure of g-C3N4.23–26 However, it remains a severe challenge to precisely synthesize the TCN heterostructures with different structures of g-C3N4 via easily modulating one synthetic parameter. And few studies concerning the influence of the morphological structure of g-C3N4 its-self on the photocatalytic H2 evolution performance of the fabricated TCN heterostructures. In addition, the formation of intimate interfacial contact between TiO2{001} and g-C3N4 is crucial for preparing the TCN heterostructures with superior photocatalytic performances.27–29 Compared with the widely used mechanical blend and unordered sintering methods, the in situ solvothermal method could effectively form the strong chemical bond between TiO2 and g-C3N4, which promotes the formation of the close contact interface.33–35
Directed by the above strategy, we aimed to synthesize the TCN heterostructure via the in situ ethanol-thermal method for the high-efficient photocatalytic H2 evolution. And the structure of g-C3N4 in the prepared TCN heterostructures could be modulated from BCN to CN-NS, CN-NC and CN-QD via regulating the synthetic temperature. Through detailed characterizations, the structure evolution of g-C3N4 in TCN heterostructures could be attributed to the increased temperature of ethanol-thermal treatment and the shear effects of HF acid. The optimized TiO2/g-C3N4 nanocrystalline (TCN-2) was proved to have the highest H2 evolution performance under visible light irradiation. Except for the formed built-in electric field, the significantly enhanced photocatalytic activity of TCN-2 could be ascribed to the enhanced crystallinity of TiO2{001} and the formation of CN-NC with large surface area, which could extend the visible light absorption, and expedite the transfer of photo-generated charge carriers further. Our work might provide a novel path for the morphological structure designing of TCN heterostructures towards high-efficient photocatalytic H2 evolution.
2. Experiment
2.1. Materials
Tetrabutyl titanate (TBOT), hydrofluoric acid (HF, 30 vol%), tert-butanol (TBA), triethanolamine (TEOA), ethanol (EtOH) and methanol (MeOH) were purchased from Aladdin-Holdings Group. Melamine, silver nitrate (AgNO3), EDTA disodium salt dihydrate (EDTA-2Na), sodium sulfate (Na2SO4), chloroplatinic acid (H2PtCl6) and benzoquinone (PBQ) were supplied by Shanghai Macklin Biochemical Co., Ltd.2.2. Synthesis of TCN-1, TCN-2 and TCN-3
BCN was synthesized by the traditional thermal poly-condensation method by using melamine as the precursor.36 Briefly, 6 g melamine was put into a closed crucible and calcinated at 550 °C for 4 h with a ramp rate of 5 °C min−1 directly. The light-yellow BCN power was obtained after the fully ground.TCN heterostructures were fabricated via an in situ ethanol-thermal approach. Briefly, 0.5 g of BCN was well dispersed into 30 mL of ethanol under magnetic stirring for 30 min. Then, 5 mL of Ti(OBu)4 and 1.5 mL of HF acid were successively added into the above suspension. After stirring for 15 min, the above mixture was transferred into a Teflon inner container with a capacity of 50 mL. Afterwards, the fully sealed high-pressure hydrothermal reactor was heated at the set temperature for 24 h. After cold to the ambient temperature, the sediments were washed thoroughly using ethanol and deionized (DI) water several times alternately until the pH became neutral. The final samples were obtained after vacuum drying at 60 °C overnight. The morphological structure of g-C3N4 in the fabricated TCN heterostructures could be tuned from BCN to CN-NS, CN-NC and CN-QD via regulating the set temperature at 160 °C, 200 °C and 240 °C, respectively.
2.3. Characterization
The morphological structures and chemical element compositions of the samples were observed by a high-resolution transmission electron microscope (HR-TEM, JEM-2100, Japan) and a field-emission scanning electron microscope (FE-SEM, Thermo Scientific GX4, USA) equipped with the energy dispersive spectroscopy (EDS) system. The crystalline structures were characterized by an X-ray diffractometer (XRD, Rigaku SmartLab, Japan) with Cu-Kα radiation (λ = 1.5418 Å) with a range of 5° to 80°. The chemical bonding states were detected on a Fourier transform infrared spectrometer (FT-IR, Thermo Scientific NICOLET 6700, USA) between 3900 and 400 cm−1 using the standard KBr pellet technique. The surface oxidation states were recorded by an X-ray photoelectron spectroscopy instrument (XPS, Thermo Fisher ESCALAB Xi+, UK) with Al-Kα radiation. The BET-specific surface areas was obtained on an N2 micropore chemisorption analyzer (BET, Quantachrome, USA). The optical absorption properties were measured by a UV-vis spectrophotometer (UV-vis DRS, Agilent Carry 5000, AUS), using BaSO4 as a reference. The photoluminescence (PL) emission spectra and transient fluorescence spectra were tested on a fluorescence spectrometer (Edinburgh FLS1000, UK) with a incident wavelength of 387 nm.2.4. Electrochemical measurement
The photo-electrochemical (PEC) measurements were carried out on a CHI660E electrochemical workstation (Shanghai Chenhua, China) in 0.5 M Na2SO4 aqueous solution with a standard three-electrode system. The working electrode (1.0 × 1.0 cm2) was prepared via the doctor-blading method.37 And the saturated calomel electrode (SCE) and platinum (Pt) wire were served as the reference electrode and counter electrode, respectively. A 300 W xenon lamp equipped with a UV-cutoff filter (λ > 420 nm) was used as the visible light source (CEL-HX300, Zhongjiao Jinyuan Technology Co., Ltd. China). Prior to measurement, the suspension was purged with N2 to remove the residual air. The transient photocurrent response tests were performed at an applied −0.6 V potential versus SCE under continuously illumination (λ > 420 nm) with the switch on and off every 40 s. The electrochemical impedance spectroscopy (EIS) Nyquist plots were recorded at open circuit voltage versus SCE over the frequency range from 1 MHz to 0.1 Hz in the dark.2.5. Photocatalytic H2 evolution tests
The photo-reduction activities of the prepared samples were evaluated by an online photocatalytic water splitting system (CEL-PAEM-D8, Zhongjiao Jinyuan Technology Co., Ltd. China). Briefly, 50 mg of sample was thoroughly dispersed into 80 mL of TEOA aqueous solution (10 vol%) under magnetic stirring for 30 min. As the precursor, 150 μL of H2PtCl6 (3 wt%) aqueous solution was added to the above mixture for the subsequent in situ photo-deposition of Pt atoms on the prepared samples. The photocatalytic water splitting reaction was triggered under the above 300 W xenon lamp equipped with a UV-cutoff cutoff filter (λ > 420 nm). Before reaction, the whole system was vacuumed by a mechanical pump to remove any gas impurities. During the whole reaction process, the aqueous solution in the quartz reactor was maintained at 5 °C using a cooling water circulation system. The H2 production rate was analyzed by a gas chromatograph (GC-2014C, Shimadzu).2.6. Theoretical computation
The first-principles calculations were performed using the Vienna Ab initio Simulation Package (VASP) with the projector augmented wave (PAW) pseudo potentials. The generalized gradient approximation of Perdew–Burke–Ernzerhof parameterization (GGA-PBE) was applied to describe the exchange and correlation potential. The electronic wave functions use a cutoff energy of 400 eV, and 6 × 4 × 1 Monkhorst–Pack k-point sampling was set for all calculations. Geometry optimizations were terminated when the energy and force on each ion were reduced below 10−8 eV and 0.01 eV Å−1, and the optimized structures were then used to calculate the electronic structures of the fabricated TCN heterostructures.3. Results and discussion
As illustrated in Fig. 1, the TCN heterostructures with different structures of g-C3N4 have been synthesized via the in situ ethanol-thermal method successfully. Firstly, BCN was synthesized by the thermal polymerization of melamine.36 Then, the synthesized BCN powder was ultrasonically dispersed into the ethanol. Due to the theory of minimized mixing enthalpy, ethanol molecules would conquer the interlayer van der Waals force, and embed into the interlayer gallery of BCN.38 Afterwards, the successively added TBOT molecules would anchor to the surface of CN-NS owing to the formation of coordinated bond between the Ti atom in TBOT and the N atom in g-C3N4, which provides a channel for the preferential transfer of photo-excited electrons.39 Under the synergistic effect of the ethanol-thermal treatment and HF acid, the TBOT precursors would be in situ hydrolyzed to the anatase TiO2{001} on the surface of g-C3N4. The g-C3N4 in the fabricated TCN heterostructures could be exfoliated from BCN to CN-NS (160 °C), CN-NC (200 °C) and CN-QD (240 °C) with the increasing of the synthetic temperature, respectively. In addition, the in situ ethanol-thermal method could provide the high temperature and high pressure condition, which is essential for the formation of high-crystalline TCN heterostructures with intimate contact.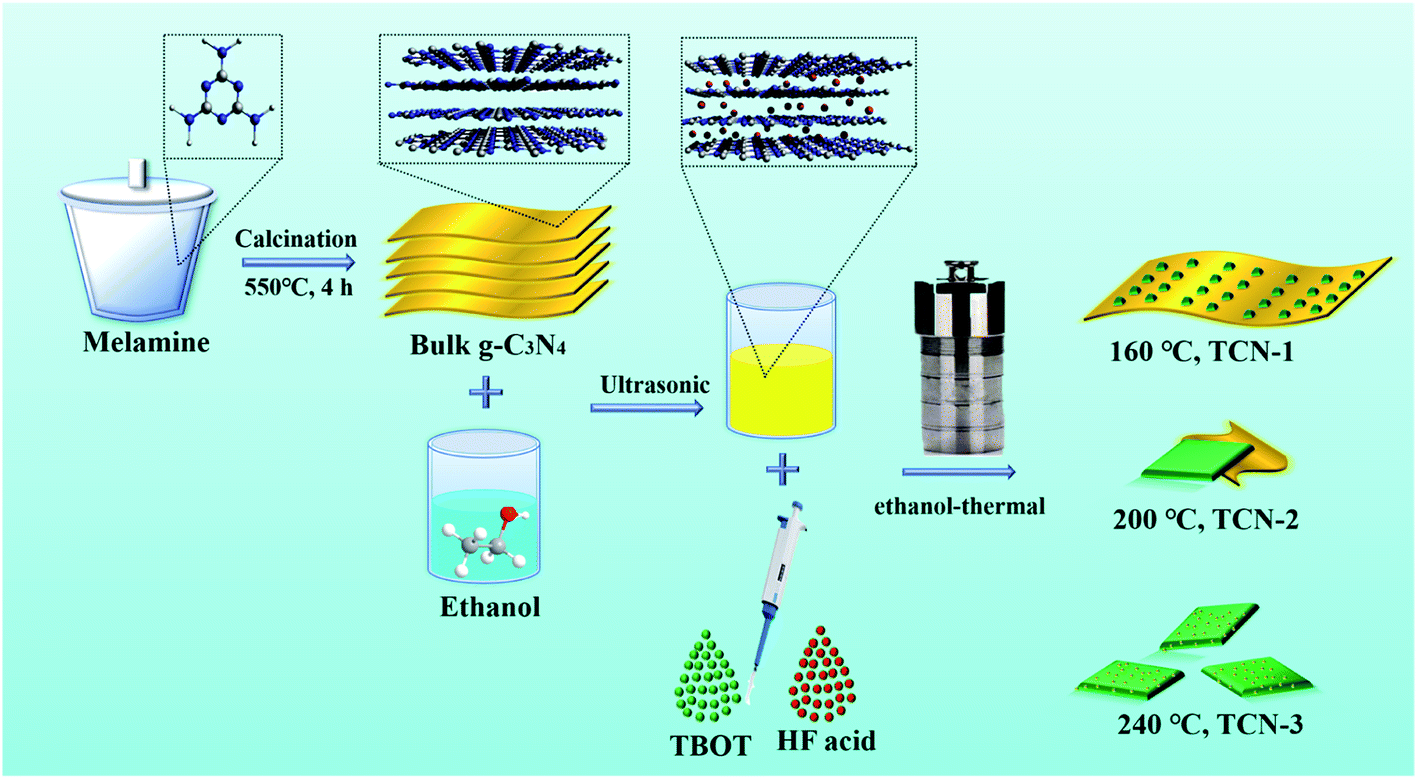 | ||
| Fig. 1 Schematic illustration of TCN-1, TCN-2 and TCN-3 heterostructures fabricated at 160 °C, 200 °C and 240 °C, respectively. | ||
3.1. The morphological structure evolution of g-C3N4
HR-TEM was used to observe the morphological structure of g-C3N4 in the fabricated TCN heterostructures. As shown in Fig. 2(a), the g-C3N4 in TCN-1 exhibits two-dimensional curved lamellar structure, which is in stark contrast to the thick morphology of BCN (shown in Fig. 2(e)), suggesting the successful exfoliation of BCN into CN-NS after the ethanol-thermal treatment at 160 °C for 24 h. And there are some TiO2 nanosheets with an average diameter of 18 nm are homogeneously distributed on the surface of CN-NS (shown in Fig. S1†). Observed by HR-TEM (shown in Fig. 2(c)) further, the distinct lattice fringes with an interplanar spacing of 0.35 nm and 0.19 nm could be assigned to the (101) and the (002) facet of anatase TiO2, respectively.40–42 It is well known that the (002) facet belongs to the {001} crystal plane, therefore the anatase TiO2 with a high exposure of {001} facets has been synthesized successfully.43–45 And the formation mechanism of TiO2{001} facets has been discussed in our previous work.36 Moreover, FE-SEM was employed to detect the morphology of the fabricated TCN-1 further. Consistent with the results of TEM, the lamellar structure of TCN-1 (shown in Fig. 2(g)) is different with the blocky structure of BCN (shown in Fig. 2(f)). In addition, the uniformly distributed C, N, Ti and O elements in the EDX mapping analysis of SEM (shown in Fig. 2(h)) also demonstrates the combined structure of g-C3N4 and TiO2 in the fabricated TCN-1 heterostructures. Therefore, it can be reasonably deduced that the fabricated TCN-1 is composed of TiO2{001} and CN-NS, and its corresponding schematic diagram is shown in the inset of Fig. 2(g). To detect the exfoliation mechanism of BCN at 160 °C, BCN was treated at the same condition with TCN-1 except without adding the TBOT molecules. It is obvious in Fig. 2(d) that the formed CNS-1 also shows the typical two-dimensional curved lamellar structure. Thus, the successful exfoliation of BCN into CN-NS could be attributed to the ethanol-thermal treatment and the added HF acid.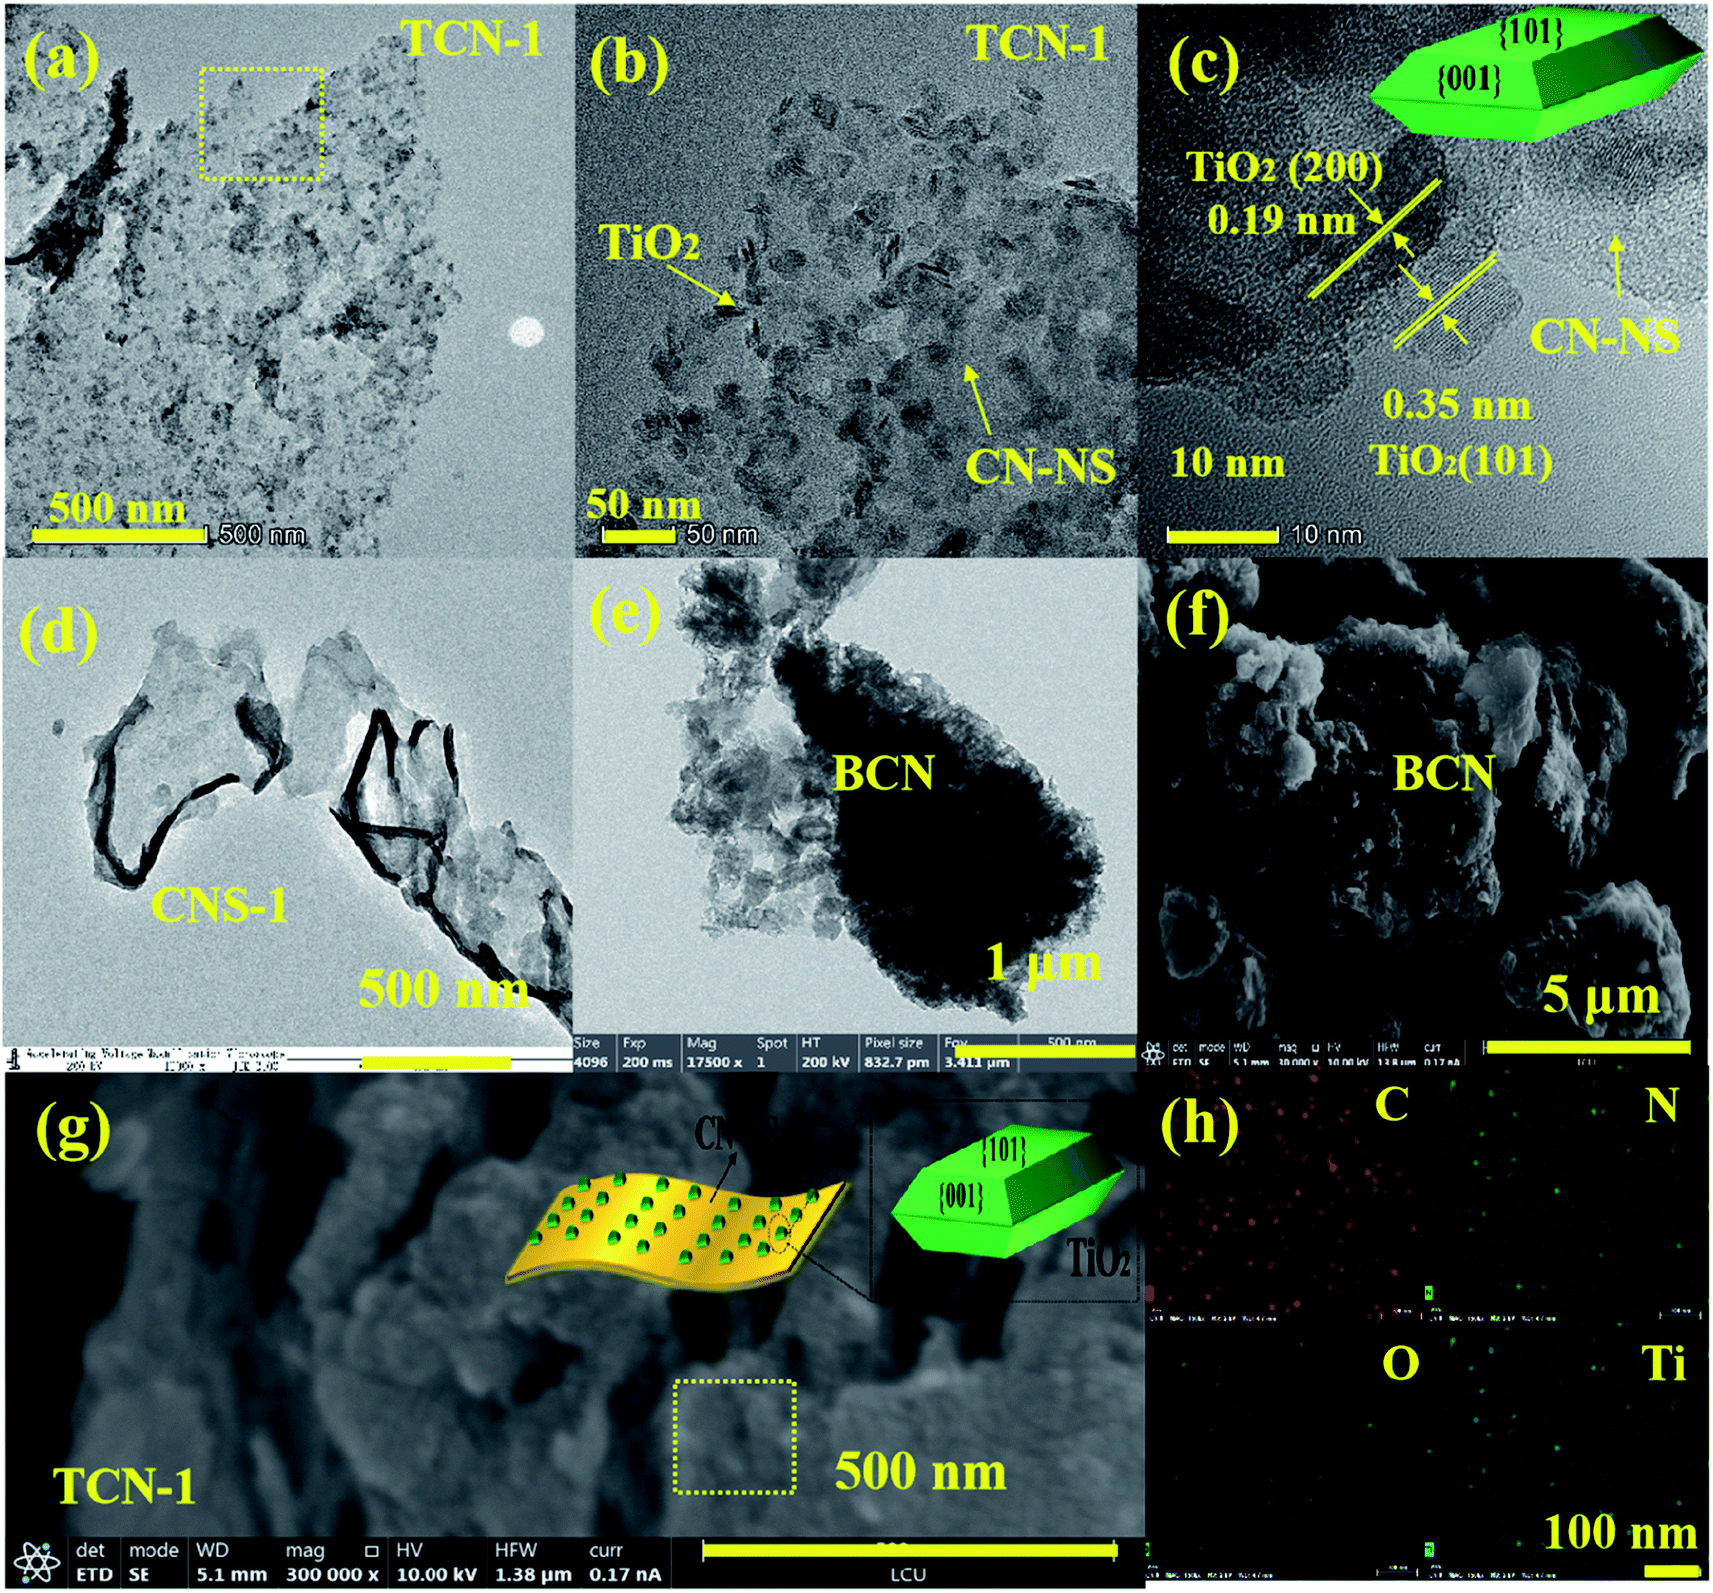 | ||
| Fig. 2 (a) TEM, (b and c) HR-TEM, (g) FE-SEM and (h) EDS of TCN-1; (e) TEM and (f) FE-SEM of BCN; (d) TEM of pure CNS-1; the illustrated diagram of (the inset of (c)) TiO2{001} and (the inset of g) TCN-1. | ||
It can be clearly observed in Fig. 3(a) that the large-area CN-NS vanished as the synthetic temperature increased to 200 °C. As shown in Fig. 3(b), the fabricated TCN-2 heterostructures have two distinctly different contrasts with similar sizes. Identified by the HR-TEM (shown in Fig. 3(c)), the light contrast with no distinct lattice fringes could be assigned to the ultrathin g-C3N4 nanosheet with small size, implying the successful exfoliation of BCN into CN-NC after the ethanol-thermal treatment at 200 °C for 24 h. And the dark fringes with the lattice spacing of 0.35 nm and 0.19 nm could be ascribed to the (101) and (002) planes of anatase TiO2, respectively, suggesting the successful synthesis of anatase TiO2 with the exposure of {001} facets. Consistent with the results of TEM images, the SEM image of TCN-2 shown in Fig. 3(e) also shows a smaller lamellar structure in comparison with that of TCN-1 (shown in Fig. 2(f)). Combined with the results of EDS mapping shown in Fig. 3(f), it can be deduced that TCN-2 is constituted by TiO2 and CN-NC, and its corresponding illustrated diagram is shown in Fig. 3(e). In addition, measured by the Nano measure, the average size of TiO2{001} is around 20 nm (shown in Fig. S6†), and the lattice fringes of {001} facets in TCN-2 are more distinct than those in TCN-1, illustrating the improved crystallinity of TiO2{001} in TCN-2 due to the improved synthetic temperature. It has been proved that the enhanced crystallinity could effectively improve the light absorption ability and reduce the number of recombination centers for the photo-generated e−–h+ pairs.43 Therefore, the fabricated TCN-2 is expected to has a higher photocatalytic activity than TCN-1.
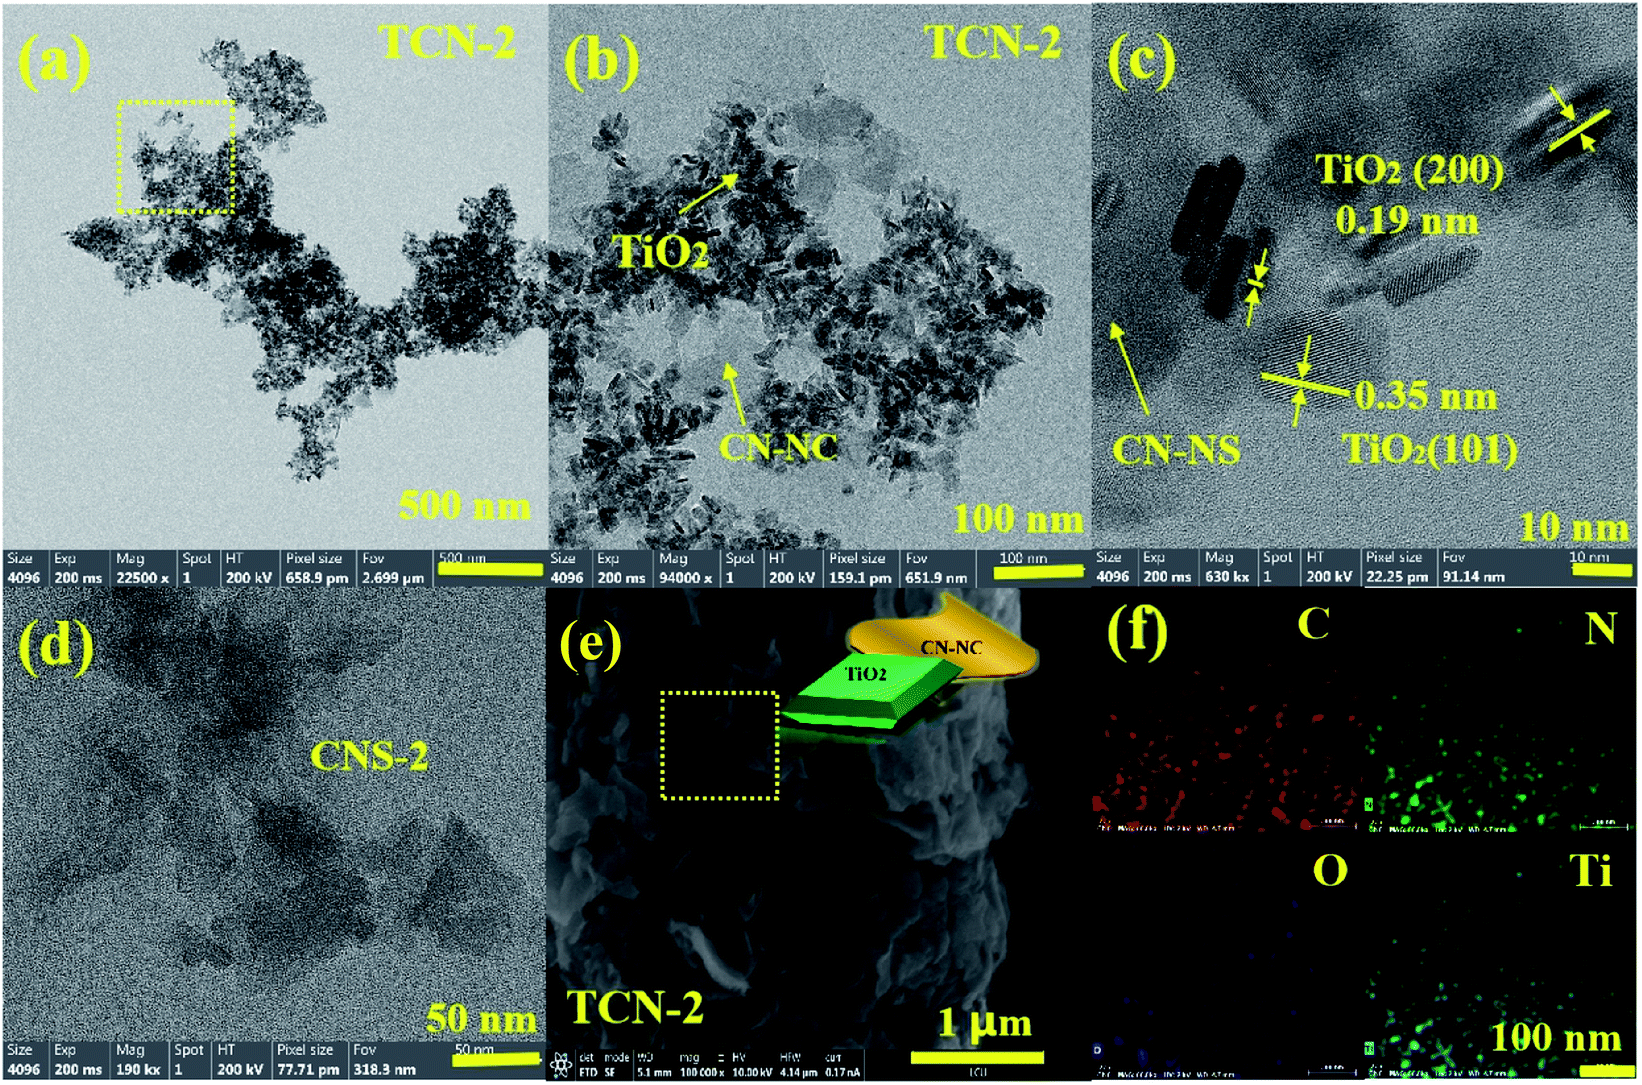 | ||
| Fig. 3 (a and b) TEM, (c) HR-TEM, (e) SEM and (f) EDS mapping of TCN-2, (d) TEM of CNS-2 (the inset of (e)) the illustrated diagram of TCN-2. | ||
To investigate the exfoliation mechanism of BCN at 200 °C, BCN was treated at the same condition with TCN-2 except without adding TBOT molecules. As shown in Fig. 3(d), the synthesized pure CNS-2 also shows the small sheeting structure. Therefore, it could be speculated that the successful exfoliation of BCN into CN-NC is attributed to the enhanced temperature of ethanol-thermal treatment and the shear effects of HF acid. Furthermore, to detect the effects of HF acid further, BCN was treated under the same condition with CNS-2 except without adding HF acid, the obtained sample was named as CN-200. It is apparent in Fig. S2† that the obtained CN-200 shows a typical layered structure with a large area. Therefore, the added HF acid is vital for breaking the C–N bonds between the adjacent tri-s-triazine rings under the enhanced synthetic temperature.
Once the synthetic temperature reached up to 240 °C, the ultra-thin CN-NC with small size is a disappeared (shown in Fig. 4(a)) and there are some uniform spherical quantum dots mono-dispersed on the surface of TiO2 nanosheets (shown in Fig. 4(b)). Analyzed by Nano measure 1.2, the particle sizes of the formed quantum dots are range from 2 nm to 5 nm, and the average diameter is estimated to be 3.0 nm (shown in Fig. S3†). Although it is too small to observe the lattice fringe of the formed quantum dots, those spherical quantum dots could be assigned to the CN-QD according to the stability analysis of TiO2 and g-C3N4.44,57 Moreover, the undetected morphological structure of BCN also confirms the successful exfoliation of BCN into CN-QD further. Investigated by HR-TEM (shown in Fig. 4(c)), the interplanar spacing of 0.19 nm could be assigned to the (200) planes of anatase TiO2, suggesting the successful synthesis of anatase TiO2 with the high exposure of {001} plane. Measured by the Nano measure, the average size of TiO2{001} is 23 nm (shown in Fig. S7†). Consistent with the results of TEM images, the lamellar structure of g-C3N4 is also disappeared in the SEM image of TCN-3 (shown in Fig. 4(d)), proving that the g-C3N4 in the synthesized TCN-3 has been exfoliated to the g-C3N4 quantum dots (CN-QD) further. For confirming the successful exfoliation of BCN into CN-QD at 240 °C further, the pure CN-QDs has been synthesized at the same condition with TCN-3 except without adding the TBOT molecules (shown in Fig. S4†). In addition, the EDX mapping analysis of SEM (shown in Fig. 4(e)) demonstrates the uniform distribution of C, N, Ti and O elements, confirming the combined structure of CN-QD and TiO2 in TCN-3 heterostructures further. Therefore, it is reasonable to deduce that the exfoliated CN-QD have been successfully deposited on the surface of TiO2{001}, and the corresponding illustrated diagram of TCN-3 is shown in the inset of Fig. 4(d).
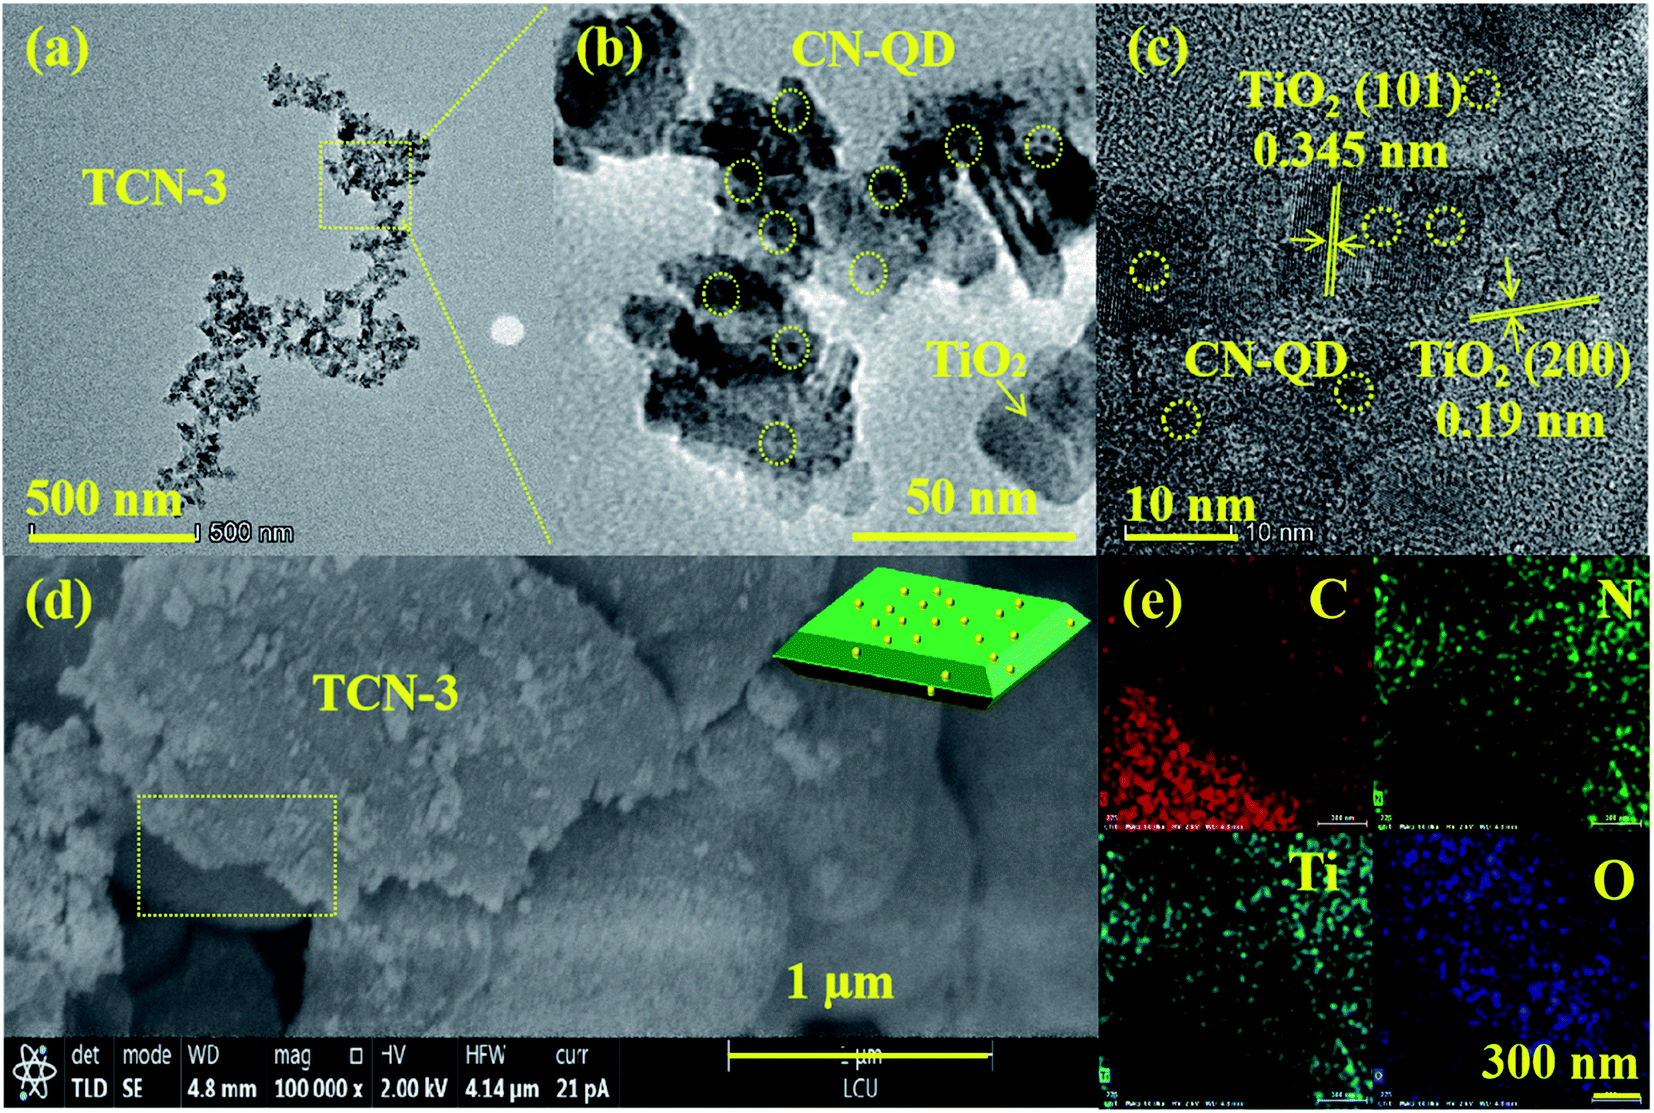 | ||
| Fig. 4 (a and b) TEM, (c) HR-TEM and (d) SEM images of TCN-3 (the inset of (d)); the illustrated diagram of TCN-3; (e) EDX elemental mapping results of C, N, Ti and O in TCN-3. | ||
3.2. Phase structures and composition
The crystal phase structures of the prepared samples were investigated by XRD patterns. As exhibited in Fig. 5(a), all the diffraction peaks of pristine TiO2 could be well indexed to anatase TiO2 (JCPDS No. 21-1272). The two pronounced diffraction peaks of BCN at 13.1° and 27.8° could be assigned to the (100) diffraction peak for the in-plane periodicity of continuous tri-s-triazine unites and the (002) diffraction plane of layered stacked π-conjugated aromatic rings, respectively (PDF #87-1526).48 For TCN-1, all the characteristic diffraction planes of both anatase TiO2 and g-C3N4 could be clearly observed, corroborating the coexistence of anatase TiO2 and g-C3N4 in TCN-1. Compared with BCN, the remarkably reduced intensity and widened full width at half maximum (FWHM) of (002) peak in TCN-1 indicates the increased distance of the adjacent g-C3N4 interlayers, suggesting the successful exfoliation of BCN into CN-NS after the ethanol-thermal treatment at 160 °C further. As the synthetic temperature increased to 200 °C, a new sharp peak corresponded to the melem structure (shown in Fig. 5(c)) is appeared at 23.8° in TCN-2, implying that the C–N chemical bonds between the adjacent tri-s-triazine units start to break at 200 °C.45 Therefore, it can be speculated that the break of C–N chemical bonds between the adjacent tri-s-triazine units leading to the successful exfoliation of BCN into CN-NC. Once the synthetic temperature increased to 240 °C, the amplified intensity and narrowed FWHM of (002) peak in g-C3N4 indicates the increased crystallinity of g-C3N4 in TCN-3 heterostructures. Meanwhile, the significantly heightened intensity of the peak at 23.8° illustrates the increased proportion of melem, meaning the further break of C–N chemical bonds between the adjacent tri-s-triazine structures under the enhanced synthetic temperature at 240 °C. Consistent with the results of TEM images, the synthetic temperature plays an essential role in determining the structure of g-C3N4 in the fabricated TCN heterostructures. In addition, the FWHM of (101) peak in anatase TiO2 decreases with the increases of the synthetic temperature, illustrating the enhanced crystallinity of TiO2. And calculated by the Scherrer equation (shown in ESI S11†), the size of (101) facets in the prepared TCN-1, TCN-2 and TCN-3 are 8.06 nm, 9.07 nm and 10.74 nm, respectively. Therefore, the size of (101) facets in the prepared samples increases with the increase of the synthetic temperature. And this tendency is consistent with the results of TEM images.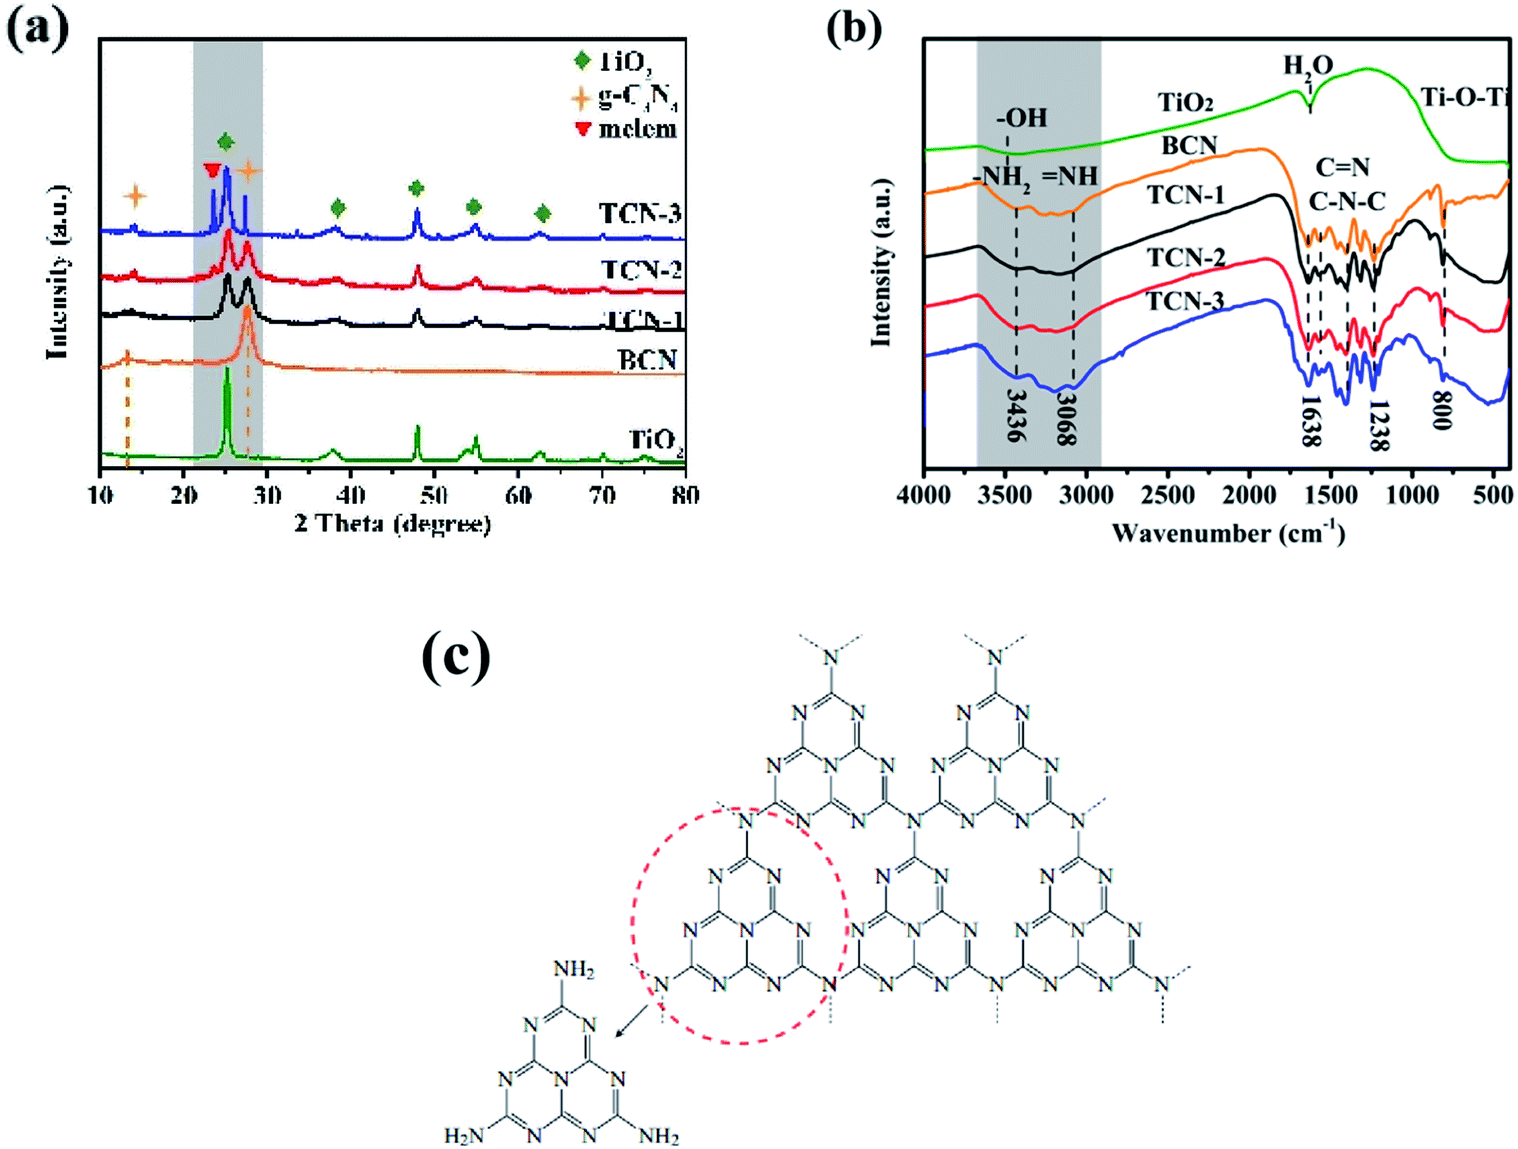 | ||
| Fig. 5 (a) XRD patterns and (b) FT-IR spectra of TiO2, BCN, TCN-1, TCN-2 and TCN-3; (c) the formation process of melem. | ||
FT-IR spectra were used to detect the surface chemical bond of the fabricated TCN heterostructures. As shown in Fig. 5(b), the prominent vibration peak of anatase TiO2 at 400–700 cm−1 corresponds to the Ti–O–Ti, and the absorption peak at 3500 cm−1 denotes the stretching vibration of the hydroxyl (–OH) group. For BCN, the peak at 809 cm−1 could be indexed to the typical bending mode of triazine units. The broad absorption band ranging from 1238 to 1638 cm−1 is assigned to the characteristic stretching vibration of C–N and C![[double bond, length as m-dash]](https://www.rsc.org/images/entities/char_e001.gif) N hetero-cycles. The band recorded between 3000 and 3500 cm−1 is ascribed to the N–H stretching vibration originated from the bridged or terminal amino group.46 Consistent with the results of XRD patterns, the well-reserved characteristic peaks of g-C3N4 indicate that the core chemical structure of g-C3N4 remains stable after the ethanol-thermal treatment. It is deserved to mention that the intensity of the characteristic vibration peaks between 3000 cm−1 and 3500 cm−1 increases with the increasing of the synthetic temperature (shown in Fig. S5†). The increased exposure of N–H group could be attributed to the increased break extent of C–N chemical bonds between the adjacent tri-s-triazine units under the enhanced synthetic temperature. Meanwhile, the –OH group of ethanol molecule would nucleophilic attack on the amino group under the high synthetic temperature, thus introducing the –OH group on the surface of g-C3N4.58 The introduced –OH group could increase the surface hydrophilicity of the fabricated TCN heterostructures, which is helpful for enhancing the photocatalytic activity of H2 evolution.47
N hetero-cycles. The band recorded between 3000 and 3500 cm−1 is ascribed to the N–H stretching vibration originated from the bridged or terminal amino group.46 Consistent with the results of XRD patterns, the well-reserved characteristic peaks of g-C3N4 indicate that the core chemical structure of g-C3N4 remains stable after the ethanol-thermal treatment. It is deserved to mention that the intensity of the characteristic vibration peaks between 3000 cm−1 and 3500 cm−1 increases with the increasing of the synthetic temperature (shown in Fig. S5†). The increased exposure of N–H group could be attributed to the increased break extent of C–N chemical bonds between the adjacent tri-s-triazine units under the enhanced synthetic temperature. Meanwhile, the –OH group of ethanol molecule would nucleophilic attack on the amino group under the high synthetic temperature, thus introducing the –OH group on the surface of g-C3N4.58 The introduced –OH group could increase the surface hydrophilicity of the fabricated TCN heterostructures, which is helpful for enhancing the photocatalytic activity of H2 evolution.47
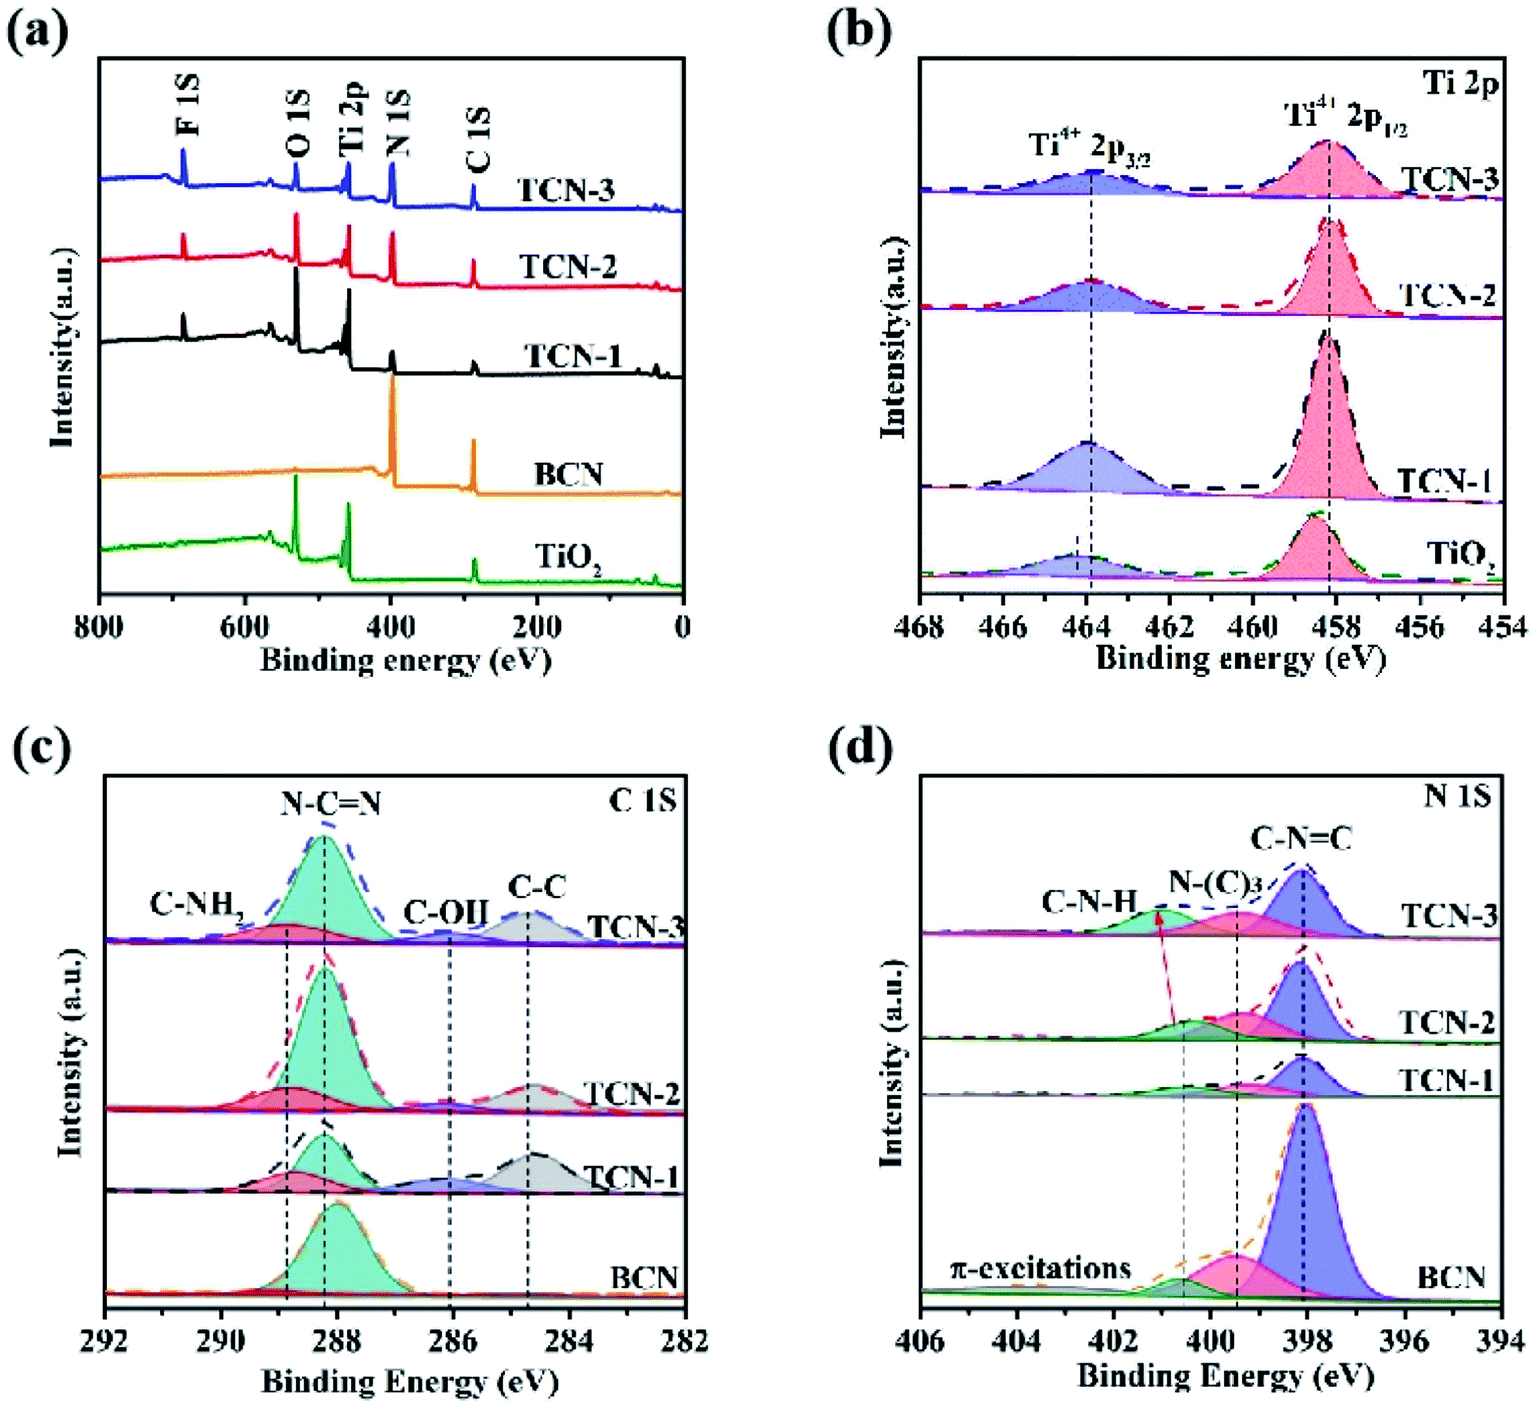
The surface chemical states of the samples were clarified by XPS further. As shown in Fig. 6(a), the survey XPS spectra confirms the coexistence of C, N, Ti and O elements in the prepared TCN hetero-structures. In the high-resolution Ti 2p spectra (shown in Fig. 6(b)), the two dominant peaks at 458.2 eV and 464.1 eV could be assigned to the Ti 2p3/2 and Ti 2p1/2 energies of Ti4+ in TiO2, respectively. Compared with pristine TiO2, the peak position of Ti 2p in the TCN heterostructures shift negatively (0.6 V), which is induced by the changed electron concentration. In theory, the electron negativity of N element is relatively weaker than O element. Therefore, the negatively shifted peak position of Ti 2p could be attributed to the replacement of O element by the N element, verifying the formation of Ti–N chemical bond. The intimate contact of TiO2 and g-C3N4 could provide an efficient charge transfer pathway and accelerate the photo-generated e−–h+ separation by forming the built-in electric field.52 In the high-resolution C 1s spectra (shown in Fig. 6(c)), the peaks can be divided into four main features at 284.6, 286.1, 288.2 and 288.9 eV, attributing to the surface adventitious C, CN bindings, C–OH species and sp3-hybridized C in (N)2–CN bindings, respectively.49 Compared with BCN, the newly introduced C–OH group in the fabricated TCN heterostructures confirms an effective surface modification of g-C3N4 in the ethanol solution further, this is consistent with the results of FT-IR spectra. The high-resolution N 1s spectra (shown in Fig. 6(d)) could be split into four peaks at 398.4, 399.7, 401.3 and 404.2 eV, attributing to the N element in the C–NC groups, N-(C)3 groups together with the (N)2–CN, C–N–H groups and π-excitations, respectively. It can be underlined that the intensity of C–N–H peak in the high-resolution N 1s spectra increases with the increasing of the synthetic temperature. The increased intensity of C–N–H peak demonstrates that the enhanced synthetic temperature could promote the break of C–N bonds between the adjacent tri-s-triazine units under the shear effects of HF acid, this is also consistent with the results of XRD.
 | ||
| Fig. 6 (a) The survey XPS spectra, the high-resolution XPS of (b) Ti 2p, (c) C 1s and (d) N 1s spectra of BCN, TiO2 TCN-1, TCN-2 and TCN-3. | ||
Based on the above analyses, the synthetic temperature plays a crucial role in exfoliating the BCN into CN-NS, CN-NC and CN-QD in the fabricated TCN heterostructures with the shearing effects of HF acid (Fig. 7). It has been verified that BCN could be exfoliated into CN-NS when the enthalpy of mixing is minimized.48,49 When the layered BCN was immersed in ethanol solvent, the ethanol molecules would conquer the interlayer van der Waals force and embed into the interlayer gallery of g-C3N4 under the assistant of ultrasonic due to the similar surface energy of ethanol to that of CN-NS.51 Yang et al. have been exfoliated BCN into the free-standing CN-NS in the isopropanol solvent.50 Then, the successively added TBOT molecules would anchor onto the surface of g-C3N4 due to the formation of coordinated bonds between Ti atoms and N atoms. Afterwards, the TBOT would be in situ hydrated to anatase TiO2{001} on the surface of CN-NS after the solvothermal process with the effects of HF acid. In addition, the in situ hydrated anatase TiO2{001} are favorable for preventing the aggregation of exfoliated CN-NSs caused by the slow solvent evaporation. Meanwhile, the –OH groups would be introduced onto the surface of g-C3N4 due to the strong polar of ethanol solvent under the high synthetic temperature. Therefore, TCN-1 could be synthesized after the ethanol-thermal process at 160 °C for 24 h. It has been revealed that the added HF acid could promote the break of C–N chemical bonds between the adjacent tri-s-triazine units under the enhanced synthetic temperature. Thus, the BCN could be exfoliated into the CN-NC and CN-QD as the heating temperature increased to 200 °C and 240 °C, respectively. Meanwhile, the crystallinity of the prepared TCN increases with the increasing of the synthetic temperature. Therefore, the strongly coupled TCN-1, TCN-2 and TCN-3 were fabricated at 160 °C, 200 °C and 240 °C, respectively.
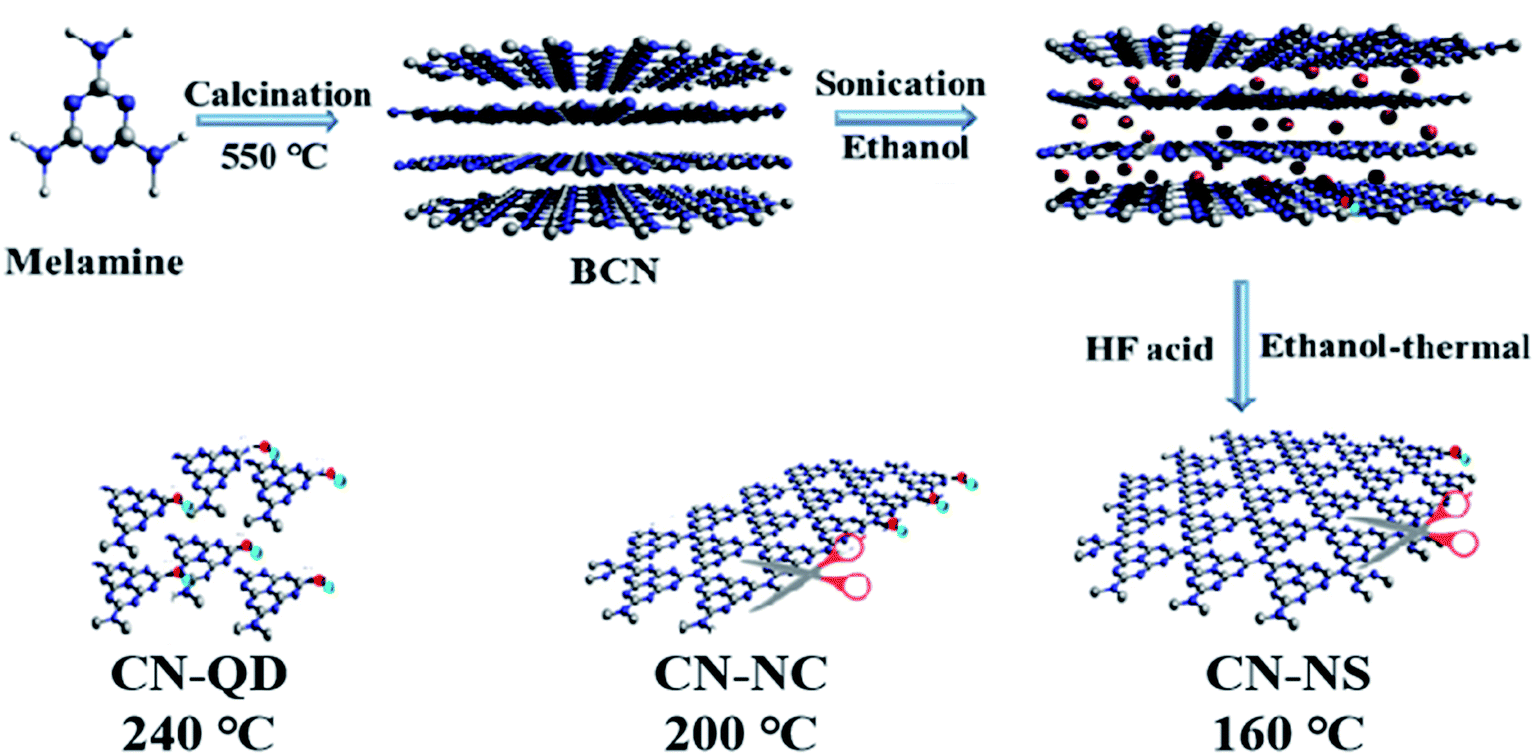 | ||
| Fig. 7 Schematic illustration of the exfoliation mechanism of BCN into CN-NS, CN-NC and CN-QD. | ||
3.3. Enhancement mechanism of photocatalytic activity
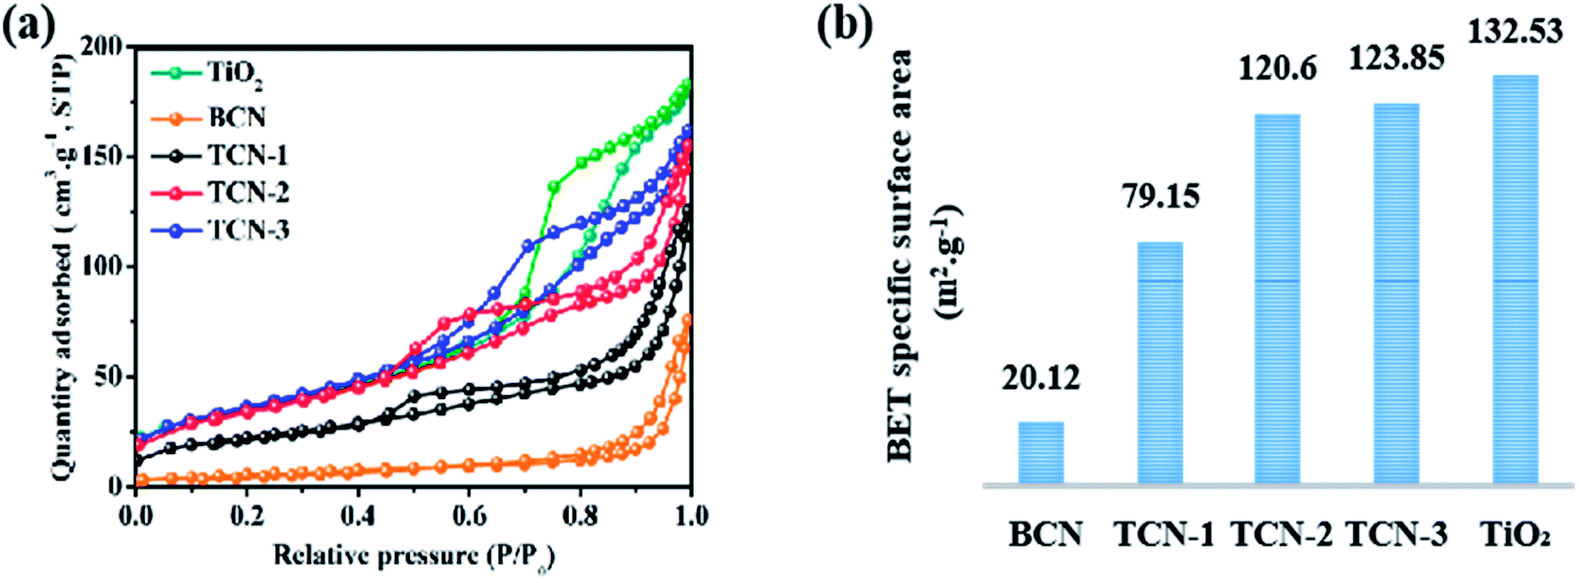 | ||
| Fig. 8 (a) N2 Adsorption–desorption isotherms and (b) the surface area values (calculated by the BET equation) of BCN, TCN-1, TCN-2, TCN-3 and TiO2. | ||
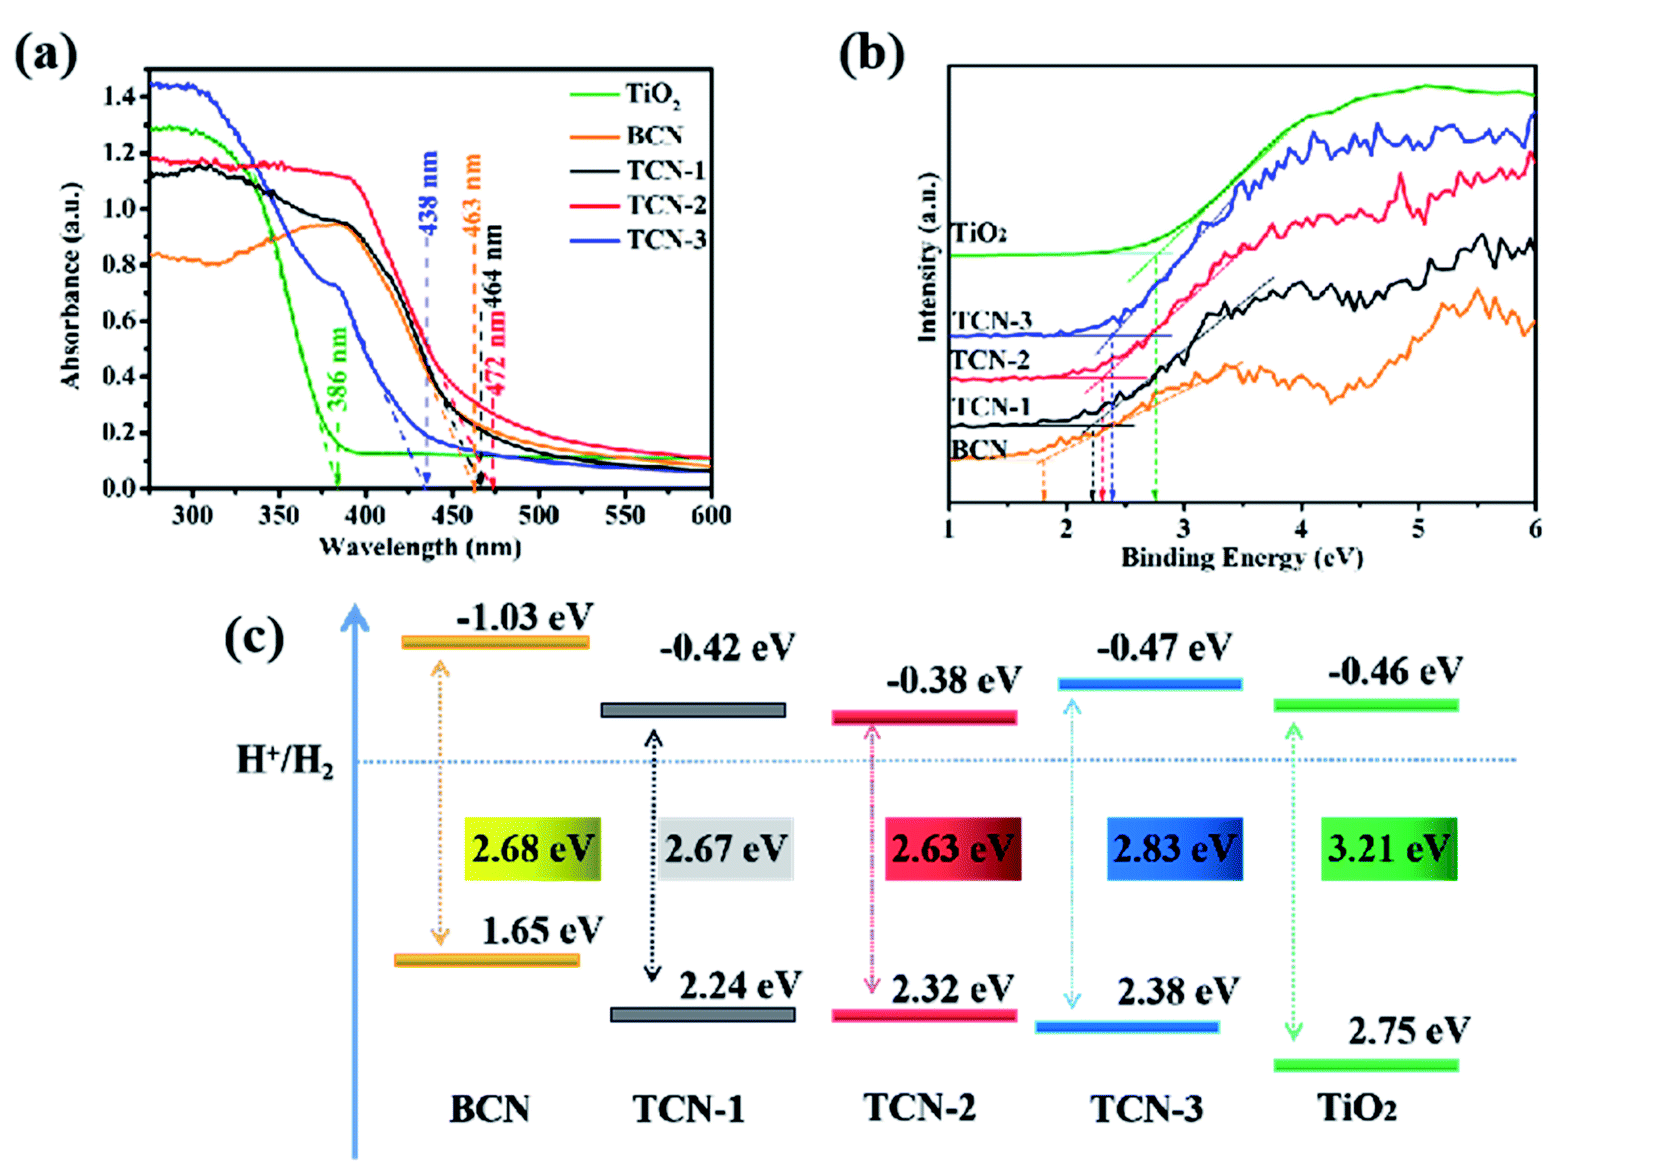 | ||
| Fig. 9 (a) UV-vis diffuses reflectance spectra, (b) valence band XPS spectra and (c) the corresponding band structure of TiO2, BCN, TCN-1, TCN-2 and TCN-3. | ||
To study the band structure of the prepared TCN photocatalysts further, the valence band edge (VB) of the samples were detected by VB-XPS. As shown in Fig. 9(b), the VB edge of TiO2, g-C3N4, TCN-1, TCN-2 and TCN-3 occurs at 2.75 eV, 1.65 eV, 2.24 eV, 2.32 eV and 2.38 eV, respectively. According to the band gap measured by UV-vis DRS, their CB are calculated to be −0.46 eV, −1.03 eV, −0.42 eV, −0.38 eV and −0.47 eV, respectively. The corresponding band structure of the prepared samples is shown in the Fig. 9(c). The differences in the band gaps are mainly caused by the diverse structure of g-C3N4 in the prepared TCN photocatalysts. Since the CB of anatase TiO2 is lower than that of g-C3N4, there is sufficient Gibbs free energy to induce the electrons to inject from g-C3N4 into TiO2, which is conducive to separating the electron–hole pairs.53
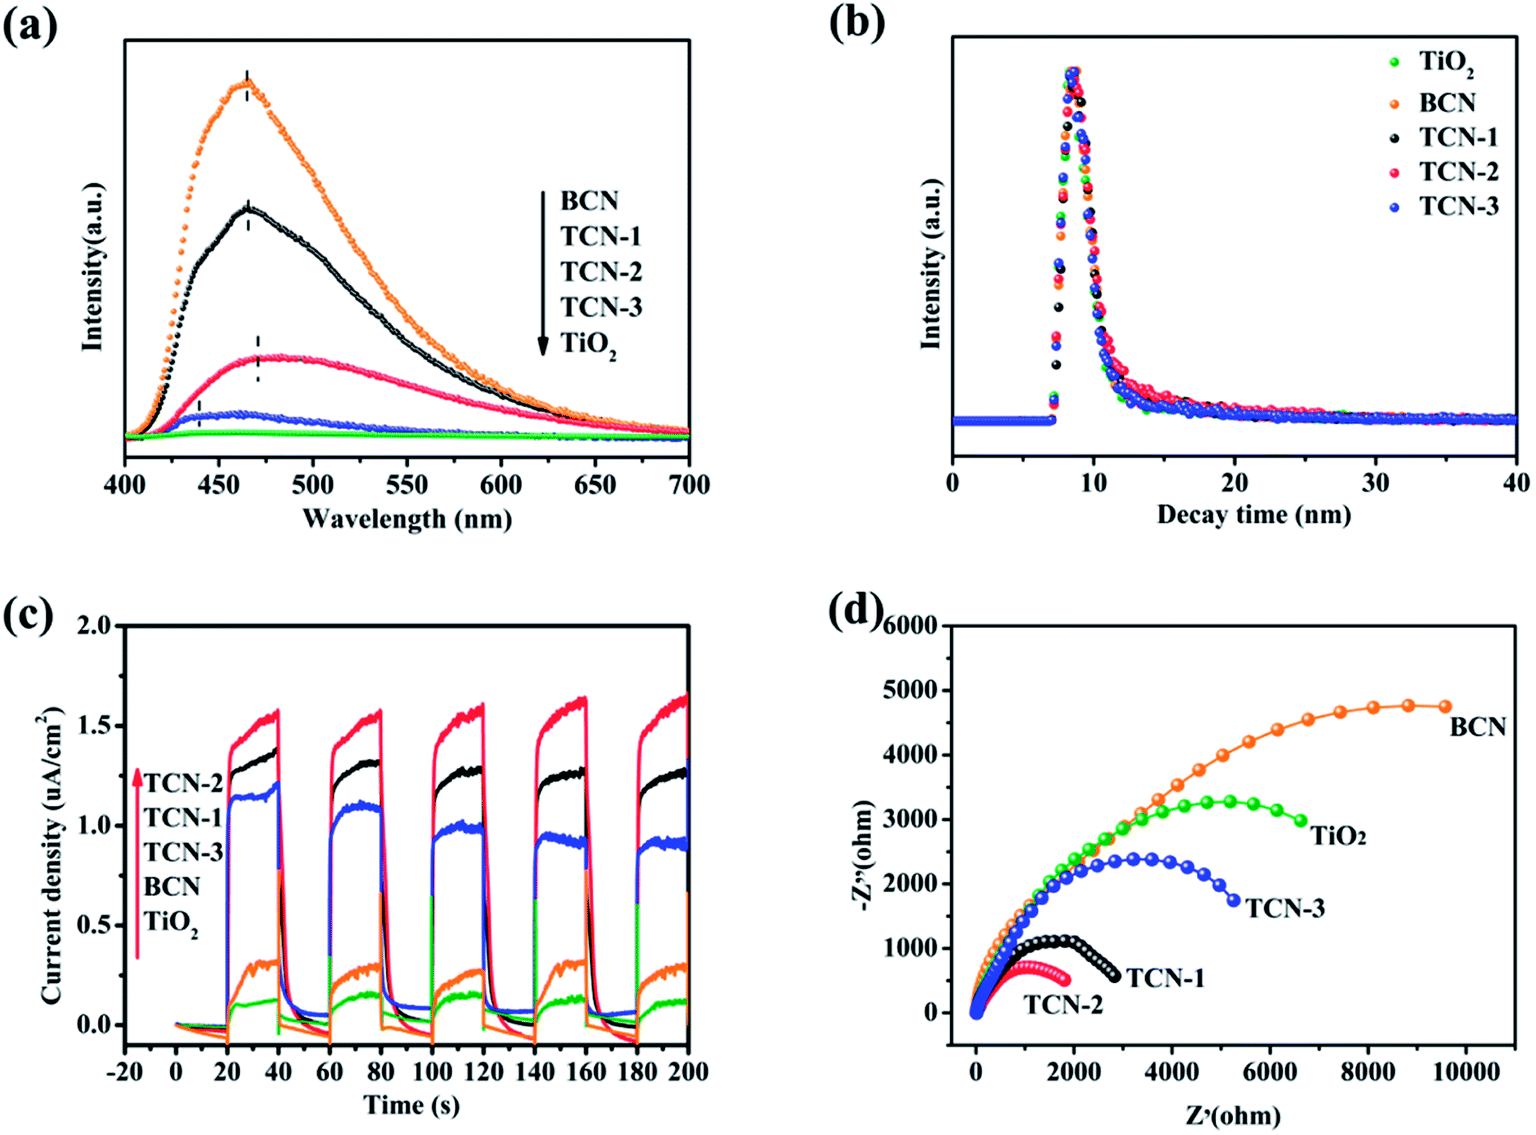 | ||
| Fig. 10 (a) PL spectra, (b) time-resolved photoluminescence decay spectra (λex = 387 nm), (c) transient photocurrent response and (d) EIS Nyquist plots of TiO2, BCN, TCN-1, TCN-2, TCN-3 heterostructure. | ||
The transient photocurrent response tests were carried out to investigate the migration efficiency of the photo-generated carriers further. Herein, the increased photocurrent could be majorly ascribed to the efficient photo-generated separation and transferring, which is benefit for the photocatalysis and correspond to the results of photocatalytic performance. As shown in Fig. 10(c), both the pure TiO2 and BCN exhibit low photocurrent intensity under visible-light irradiation. Obviously, the photocurrent responses of all the TCN heterostructures are significantly prompted, suggesting the enhanced transfer efficiency of photo-generated carriers at the strongly coupled interface between TiO2 and g-C3N4.40 In particular, TCN-2 exhibits the highest photocurrent density, implying the best separation ability of photo-generated carriers. In addition, the EIS Nyquist plots obtained in the dark could be used to evaluate the inherent interface resistance of the prepared samples. The smaller impedance arc radius in the Nyquist plot implies a weaker charge transfer resistance, valid mobility, and easier carriage of photo-generated carriers. Therefore, EIS is also deemed as valid method to investigate the migration rates of photo-generated charge carriers.50 The smaller impedance arc radius in the Nyquist plot implies a weaker charge transfer resistance, valid mobility, and easier carriage of photo-generated carriers. In Fig. 10(d), the Nyquist plots radius of TCN-2 is smaller than that of BCN, indicating the faster charge transfer and the reduced chemical impedance. And the smallest Nyquist plots radius is also obtained at TCN-2. Combined with the above analyses, the structure modification of g-C3N4 in the fabricated TCN heterostructures could affect the specific surface areas, the visible-light absorption ability, the recombination and migration rates of the photo-generated charge carriers. It has been proved that the larger specific surface areas, faster migration rates of the photo-generated e−–h+ pairs and higher visible-light response ability are helpful for achieving the better photocatalytic effect.62 Thus, the fabricated TCN-2 is expected to have the best photocatalytic activity of H2 evolution.
3.4. Photocatalytic H2 evolution
The photocatalytic reduction activities of the samples were revealed by water splitting into H2 under visible light irradiation. As demonstrated in Fig. 11(a) and (c), the anatase TiO2{001} exhibits the weaker H2 production of 0.05 mmol g−1 h−1 since its bandgap energy is too wide for visible light to induce electron excitation.61 Suffering from fast recombination of photoinduced carriers and small surface area, the pure BCN also shows a low H2 evolution of 0.19 mmol g−1 h−1. The photocatalytic performance of H2 evolution for TCN-1, TCN-2 and TCN-3 exhibits the tendency of increasing first and then decreasing, and gets an optimal value at TCN-2. The prepared TCN-2 shows conspicuous H2 evolution rates as high as 1.78 mmol g−1 h−1, which is about 9.37 times higher than BCN and 35.6 times higher than TiO2. It is obvious that the H2 evolution performance of the prepared samples exhibits a noticeable enhancement after cooperating anatase TiO2{001} with g-C3N4. To further verify the vital effects of the formed heterojunction between TiO2{001} and g-C3N4 on enhancing the photocatalytic activity of H2 evolution, the photocatalytic performance of H2 evolution for the pure CN-NC was also measured. The prepared pure CN-NC shows a lower H2 evolution of 0.71 mmol g−1 h−1 as compared with that of TCN-2. It indicates that the formation of covalent bonding at TCN hetero-structure would be the main factor for the photocatalytic H2 evolution enhancement. And the synthetic temperature of the prepared samples has close interaction with the H2 evolution activity by affecting the structure of g-C3N4 and the crystallinity of TiO2 {001}. And the exfoliated CN-NC in TCN-2 could provide more surface sites, enhance the light absorption ability and fast the mass transfer efficiency. And the increased crystallinity of TiO2{001} is also helpful in improving the photocatalytic activity of H2 evolution.63 Through a detailed comparison of the photocatalytic H2 evolution activity of the prepared TCN with that of the photocatalysts prepared by other groups (shown in ESI S8†), the prepared TCN-2 also exhibits an excellent activity of H2 evolution among the g-C3N4/TiO2 systems. Based on the remarkable photocatalytic H2 evolution performance, it's significant to explore the cycling stability of TCN-2. As shown in Fig. 11(b), the rate of photocatalytic H2 production has no apparent loss after five cycling experiments, indicating that the prepared TCN-2 is stable and difficult to decompose during the process.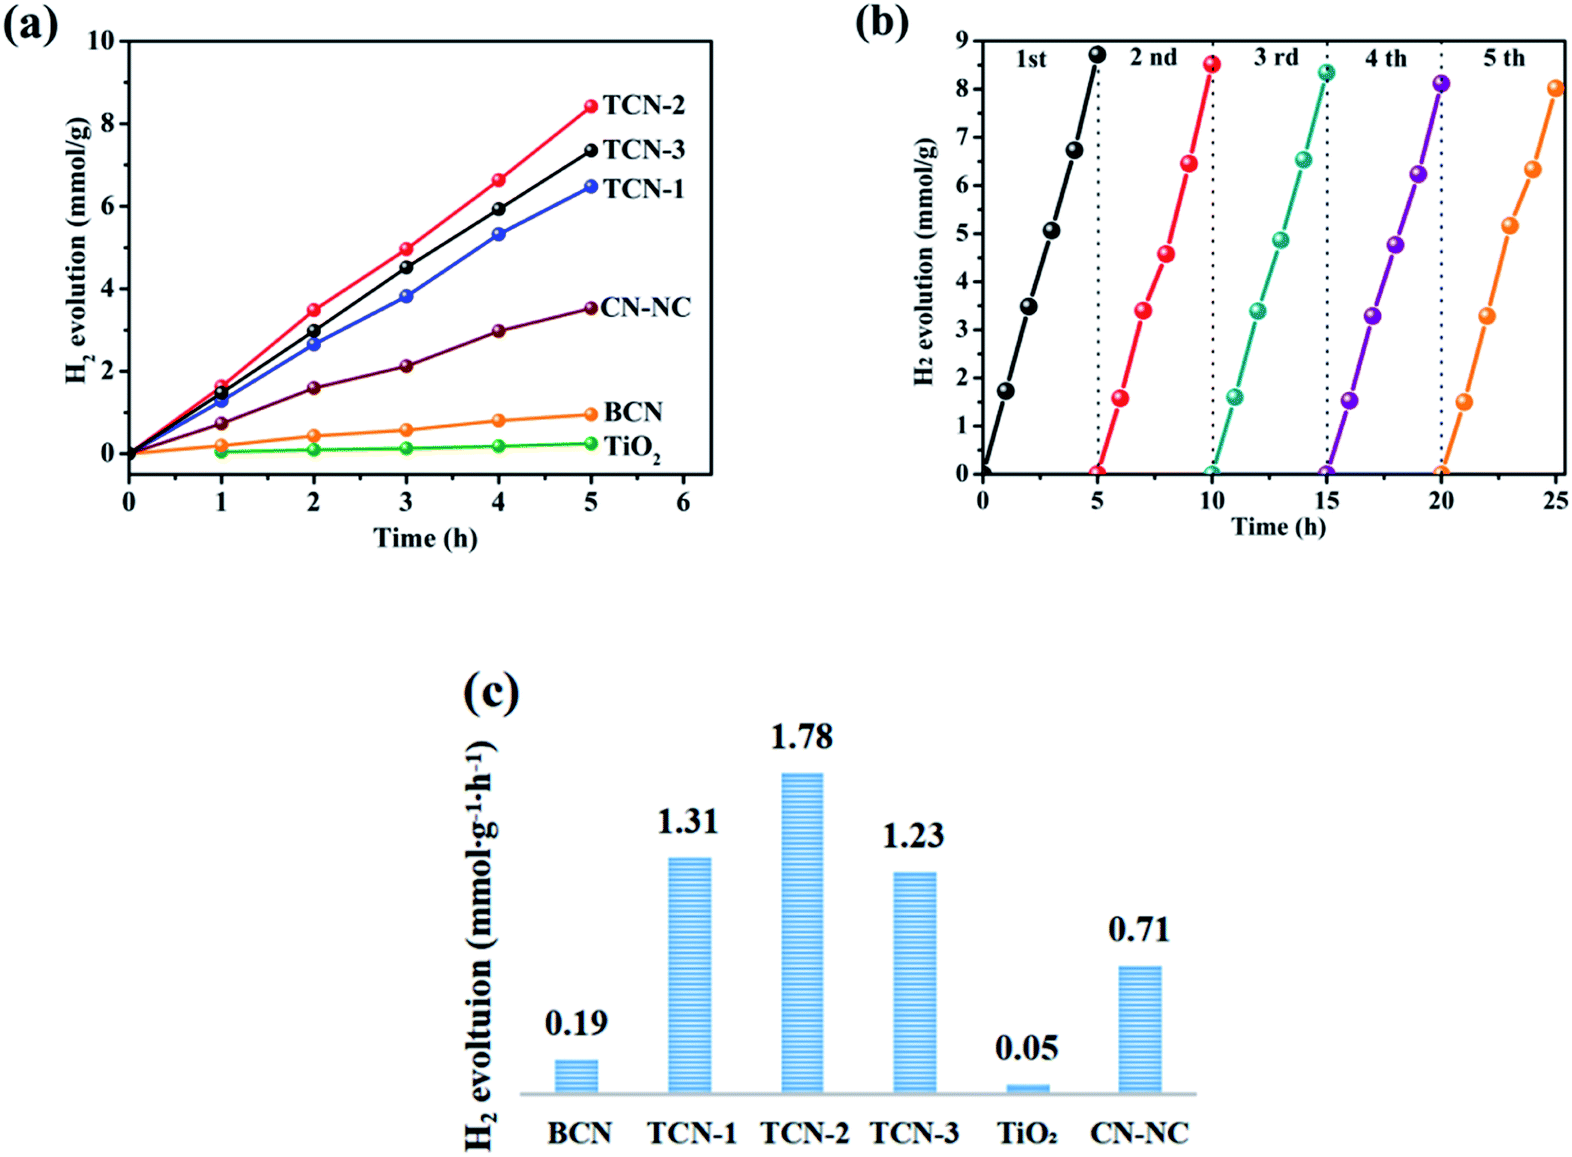 | ||
| Fig. 11 (a) The photocatalytic H2 evolution of different samples with the prolong of the time, (b) the recyclability tests under the visible light (λ > 420 nm) for the TCN-2 and (c) the photocatalytic H2 evolution rate of different samples. | ||
Combined with DFT calculation, the mechanism of the enhanced photocatalytic activity for TCN-2 was proposed at atom scale. It has been reported that the conduction band minimum (CBM) and valence band maximum (VBM) states of TiO2 are mainly contributed by Ti 3d states and O 2p states, respectively.60 According to the calculated TDOS and the corresponding PDOS of TCN-2 shown in Fig. 12(b), the CBM and the VBM of the TCN-2 are mainly composed of the Ti 3d states in TiO2{001} and the N 2p states in g-C3N4, respectively, confirming the formation of intimate contact between TiO2 and g-C3N4 in TCN-2 further. As shown in Fig. 9(c), the VB potential positions of BCN and TiO2{001} are 1.65 eV and 2.75 eV (vs. NHE), and their CB are −1.03 eV and −0.46 eV (vs. NHE), respectively.59 And the CB potential position of TCN-2 is −0.38 eV (vs. NHE), which is similar to that of TiO2, confirming the formation of type II heterojunction between TiO2{001} and g-C3N4 in TCN-2 (shown in Fig. 12(a)). Correspondingly, the VB potential position of TCN-2 is 2.32 eV (vs. NHE). For TCN-2, the e−–h+ pairs could be generated in g-C3N4 under visible light illumination (λ > 420 nm). While the CB offset between g-C3N4 and TiO2 will prompt the photo-generated electrons transfer from the CB of g-C3N4 to the CB of TiO2. It is worth mentioning that the high exposed {001} facets of anatase TiO2 and the heterojunction structure between TiO2{001} and g-C3N4 could inhibit the recombination of photoinduced charge carriers. In addition, the enlarged specific surface area could provide more reactive sites and the introduced –OH group is also favourable for the adsorption of H2O molecules, those are beneficial for enhancing the photocatalytic activity of TCN-2.
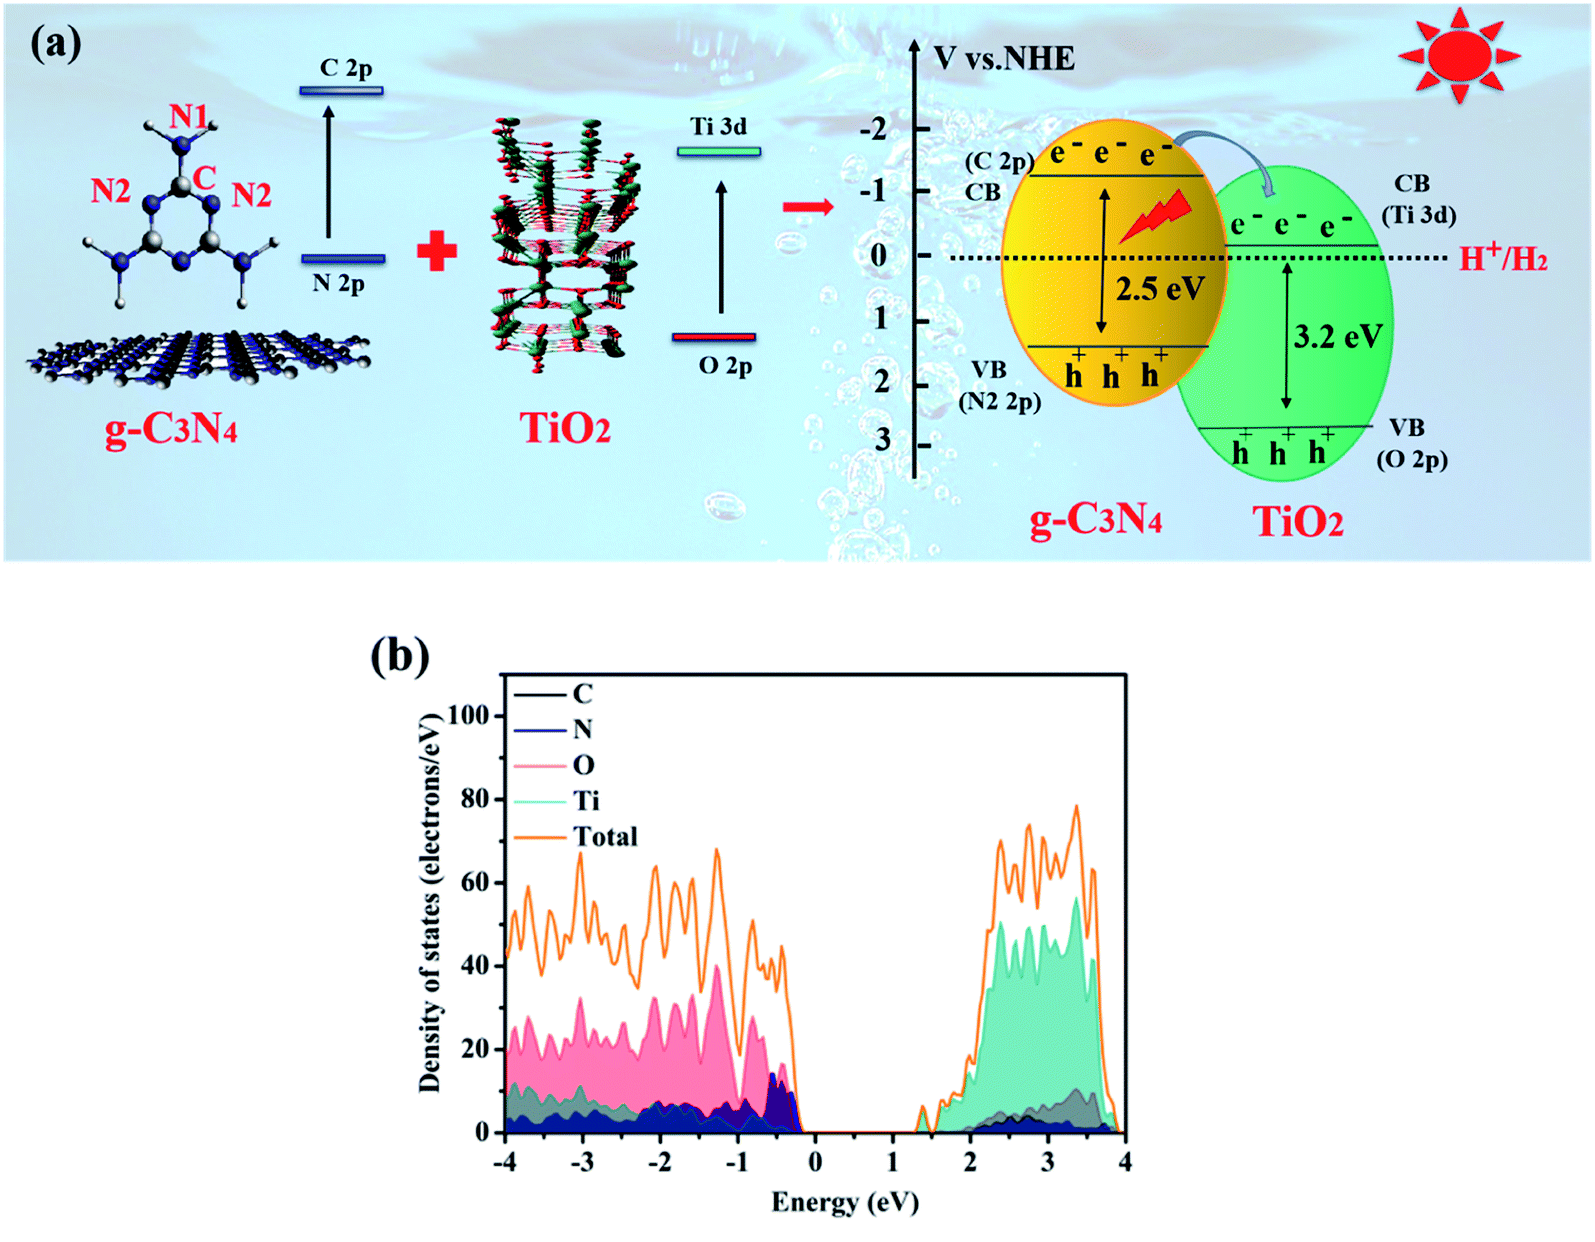 | ||
| Fig. 12 (a) Proposed photocatalytic reaction mechanism of TCN-2 heterostructure, (b) calculated TDOS and the corresponding PDOS of TCN-2. | ||
4. Conclusions
In conclusion, we presented a facial in situ ethanol-thermal method for synthesizing the high-crystalline TiO2/g-C3N4 (TCN) heterostructures with intimate contact. The structure of g-C3N4 in the fabricated TCN heterostructures could be modulated from BCN to CN-NS, CN-NC or CN-QD by regulating the synthetic temperature. Through the detailed characterizations, the structure evolution mechanism of g-C3N4 was ascribed to the co-effect of the ethanol-thermal treatment and the added HF acid with shearing effect. As expected, the fabricated TCN-2 shows the highest efficient photocatalytic activity under visible light irradiation, and the H2 production rate reaches up to 1.78 mmol h−1 g−1, which is 35.6 times higher than that anatase TiO2. Confirmed by DFT simulation, the excellent photocatalytic H2 evolution performance could be attributed to not only the synergistic effect of the CN–NCs with enhanced visible absorption and anatase TiO2{001}, but also the formed compact contact interface and the introduced surface adsorbed –OH group during in situ ethanol-thermal process. This work opens up a new window to the fabrication of highly active strongly coupled TCN heterostructures with the desired structure for the efficient photocatalytic H2 evolution under visible-light irradiation.Conflicts of interest
The authors solemnly declare no competing financial interests.Acknowledgements
This work was financially supported by the Support plan for Excellent Youth Innovation Team in Shandong Colleges and Universities (Grant No. 2020KJC012) and Shandong Province Natural Science Foundation (Grant No. ZR2020MB031).References
- X. B. Chen, S. Shen, L. Guo and S. S. Mao, Chem. Rev., 2010, 110, 6503–6570 CrossRef CAS PubMed.
- K. Maeda, K. Teramura, D. Lu, T. Takata, N. Saito, Y. Inoue and K. Domen, Nature, 2006, 440, 295–298 CrossRef CAS PubMed.
- R. T. Asahi, T. Morikawa, T. Ohwaki, K. Aoki and Y. Taga, Science, 2001, 293, 269–271 CrossRef CAS PubMed.
- A. Fujishima and K. I. Honda, J. Soc. Chem. Ind., Jpn., 1971, 74, 355–358 CAS.
- J. Schneid, M. Matsuoka, M. Takeuchi, J. Zhang, M. Anpo and D. W. Bahnemann, Chem. Rev., 2014, 14, 9919–9986 CrossRef PubMed.
- Y. Yang, Q. Z. Deng and Y. L. Zhang, Chem. Eng. J., 2019, 360, 1247–1254 CrossRef CAS.
- H. G. Yang, C. H. Sun, S. Z. Qiao, J. Zou and G. Liu, Anatase TiO2 single crystals with a large percentage of reactive facets, Nature, 2008, 453, 638–643 CrossRef CAS PubMed.
- H. G. Yang, G. Liu, S. Z. Zhang, C. H. Sun, Y. G. Jin, S. C. Smith, J. Zou, H. M. Chen and G. Q. Lu, J. Am. Chem. Soc., 2009, 131, 4078–4083 CrossRef CAS PubMed.
- H. Zhang, X. J. Lv, Y. M. Li, Y. Wang and J. H. Li, ACS Nano, 2010, 4, 380–386 CrossRef CAS PubMed.
- A. Naldoni, M. Altomare, G. Zoppellaro, N. liu, S. Kment, R. Zboril and P. Schmuk, ACS Catal., 2019, 9, 345–364 CrossRef CAS PubMed.
- T. M. Su, Q. Shao, Z. Z. Qin, Z. H. Guo and Z. L. Wu, ACS Catal., 2018, 8, 2253–2276 CrossRef CAS.
- Y. F. Chen, W. X. Huang, D. L. He, Y. Situ and H. Huang, ACS Appl. Mater. Interfaces, 2014, 6, 14405–14414 CrossRef CAS PubMed.
- S. W. Cao, J. X. Low, J. G. Yu and M. Jaroniec, Adv. Mater., 2015, 27, 2150–2176 CrossRef CAS PubMed.
- X. Wang, S. Blechert and M. Antonietti, ACS Catal., 2012, 2, 1596–1606 CrossRef CAS.
- W. Wang, J. Fang, S. Shao, L. Min and C. Lu, Appl. Catal., B, 2012, 217, 57–64 CrossRef.
- Y. Tan, Z. Shu, J. Zhou, T. T. Li, W. B. Wang and Z. L. Zhao, Appl. Catal., B, 2018, 230, 260–268 CrossRef CAS.
- Q. Wang, L. Zhang, Y. Guo, M. Shen and J. Shi, Chem. Eng. J., 2020, 396, 125347–125359 CrossRef CAS.
- F. Guo, H. Sun, X. Huang, W. Shi and C. Yan, J. Chem. Technol. Biotechnol., 2020, 95, 2684–2693 CAS.
- G. Li, Z. Lian, W. Wang, D. Zhang and H. Li, Nano Energy, 2016, 19, 446–454 CrossRef CAS.
- Y. Q. Sheng, Z. Wei, H. Miao, W. Q. Yao, H. Q. Li and Y. F. Zhu, Chem. Eng. J., 2019, 370, 287–294 CrossRef CAS.
- B. Zhang, X. He, X. H. Ma, Q. H. Chen and Y. Xin, Sep. Purif. Technol., 2020, 247, 116932–116941 CrossRef CAS.
- Y. W. Zhang, J. S. Xu, J. Mei, S. Sarina, Z. Y. Wu, T. Liao, C. Yan and Z. Q. Sun, J. Hazard. Mater., 2020, 394, 122529–122536 CrossRef CAS PubMed.
- J. Wang, G. H. Wang, X. Wang, Y. Wu, Y. R. Su and H. Tang, Carbon, 2019, 149, 618–626 CrossRef CAS.
- G. S. Li, Z. C. Lian, W. C. Wang, D. Zhang and H. Li, Nano Energy, 2016, 19, 446–454 CrossRef CAS.
- B. Y. Shao, J. Y. Wang, Y. Z. Zhang, X. Tan, W. Zhou and Y. L. Chen, Catal. Sci. Technol., 2021, 11, 1282–1291 RSC.
- M. Y. Liu, K. Jiang, X. Ding, S. L. Wang, C. Zhang, J. Liu, Z. Zhan, G. Cheng, B. Li and H. Chen, Adv. Mater., 2019, 31, 1807865–1807871 CrossRef PubMed.
- L. H. Lin, Z. Y. Yu and X. C. Wang, Angew. Chem., Int. Ed., 2019, 58, 6164–6175 CrossRef CAS PubMed.
- W. Iqbal, B. C. Qiu, Q. H. Zhu, M. Xing and J. Zhang, Appl. Catal., B, 2018, 232, 306–313 CrossRef CAS.
- K. Schwinghammer, M. B. Mesch, V. Duppel, C. Ziegler, J. Senker and B. V. Lotsch, J. Am. Chem. Soc., 2014, 136, 1730–1732 CrossRef CAS PubMed.
- P. F. Xia, M. Antonietti, B. C. Zhu, T. Heil and J. Yu, Adv. Funct. Mater., 2019, 29, 1900093–1900101 CrossRef.
- Y. Li, D. Zhang, X. Feng and Q. Xiang, Chin. J. Catal., 2020, 41, 21–30 CrossRef CAS.
- U. Caudillo-Floresa, M. J. Muñoz-Batista, R. Luque, M. Fernández-García and A. Kubacka, Chem. Eng. J., 2019, 378, 122228–122239 CrossRef.
- K. Hu, R. Li, C. Ye, A. Wang, W. Q. Wei, D. Hu, R. Qiu and K. Yan, J. Cleaner Prod., 2020, 253, 120055–120063 CrossRef CAS.
- S. H. Liu and W. X. Lin, J. Hazard. Mater., 2019, 368, 468–476 CrossRef CAS PubMed.
- R. Acharya and K. Parida, Chem. Eng., 2020, 8, 103896–103918 CAS.
- S. W. Cao, J. X. Low, J. G. Yu and M. Jaroniec, Adv. Mater., 2015, 27, 2150–2176 CrossRef CAS PubMed.
- Q. Shang, X. Tan, T. Yu, Z. Zhang, Y. Zou and S. Wang, J. Colloid Interface Sci., 2015, 455, 134–144 CrossRef CAS PubMed.
- J. Xu, L. Zhang, R. Shi and Y. Zhu, J. Mater. Chem. A, 2013, 1, 14766–14772 RSC.
- J. S. Zhang, Y. Chen and X. C. Wang, Energy Environ. Sci., 2015, 8, 3092–3108 RSC.
- K. Li, S. Gao, Q. Wang, Z. Huang and B. Ying, ACS Appl. Mater. Interfaces, 2015, 7, 9023–9030 CrossRef CAS PubMed.
- T. Xiong, W. Cen, Y. Zhang and F. Dong, ACS Catal., 2016, 6, 2462–2472 CrossRef CAS.
- Q. Guo, C. Zhou, Z. Ma and X. Yang, Adv. Mater., 2019, 31, 1901997 CrossRef CAS PubMed.
- Y. Y. Li, B. X. Zhou, H. W. Zhang, S. F. Ma, W. Q. Huang, W. Peng, W. Hu and G. F. Huang, Nanoscale, 2019, 11, 6876–6885 RSC.
- W. Wang, J. Yu, Z. Shen, D. L. Chan and T. Gu, Chem. Commun., 2014, 50, 10148–10150 RSC.
- Y. X. Li, S. Ouyang, H. Xu, W. Hou, M. Zhao, H. Chen and J. Ye, Adv. Funct. Mater., 2019, 29, 1901024–1901032 CrossRef.
- Q. Yang, C. Chen, Q. Zhang, Z. Zhang and X. Fang, Carbon, 2020, 164, 337–348 CrossRef CAS.
- T. Yu, T. Xie, W. Zhou, Y. Z. Zhang, Y. L. Chen, B. Y. Shao, W. Q. Guo and X. Tan, ACS Sustainable Chem. Eng., 2021, 9, 7529–7540 CrossRef CAS.
- D. Lu, P. Fang, W. Wu, J. Ding, L. Jiang, X. Zhao, C. Li, M. Yang, Y. Li and D. Wang, Nanoscale, 2017, 9, 3231–3245 RSC.
- S. Huang, Y. Xu, F. Ge, D. Tian, X. Zhu, M. Xie, H. Xu and H. Li, J. Colloid Interface Sci., 2019, 556, 324–334 CrossRef CAS PubMed.
- L. Cheng, Y. Song, H. Chen, G. Liu and W. Jin, Sep. Purif. Technol., 2020, 250, 117200–117211 CrossRef CAS.
- X. She, J. Wu, J. Zhong, H. Xu, Y. Yang, R. Vajtai, J. Lou, Y. Liu, D. Du and H. Li, Nano Energy, 2016, 27, 138–146 CrossRef CAS.
- P. Xia, B. Zhu, J. Yu, S. Cao and M. Jaroniec, J. Mater. Chem. A, 2017, 5, 3230–3238 RSC.
- X. Gao, J. Feng, D. Su, Y. Ma, G. Wang, H. Ma and J. Zhang, Nano Energy, 2019, 59, 598–609 CrossRef CAS.
- Z. Liu, G. Wang, H. S. Chen and Y. Ping, Chem. Commun., 2018, 54, 4720–4723 RSC.
- X. Zhang, H. Wang, H. Wang, Q. Zhang, J. Xie, Y. Tian and Y. Xie, Adv. Mater., 2014, 26, 4438–4443 CrossRef CAS PubMed.
- Q. Han, B. Wang, J. Gao, Z. Cheng, Y. Zhao, Z. Zhang and L. Qu, ACS Nano, 2016, 10, 2745–2751 CrossRef CAS PubMed.
- J. Wang, H. Jie, H. Xie and A. Qu, Int. J. Hydrogen Energy, 2014, 39, 6354–6363 CrossRef CAS.
- L. J. Wang, G. Zhou, Y. Tian, L. Yan, M. Deng, B. Yang, Z. Kang and H. Sun, Appl. Catal., B, 2019, 244, 262–271 CrossRef CAS.
- L. N. Kong, X. T. Zhang, C. H. Wang, J. P. Xu, X. W. Du and L. Li, Appl. Surf. Sci., 2018, 448, 288–296 CrossRef CAS.
- N. Guo, Y. Zeng, H. Y. Li, X. J. Xu, H. W. Yu and X. R. Han, J. Hazard. Mater., 2018, 353, 80–88 CrossRef CAS PubMed.
- Y. Li, X. H. Feng, Z. X. Lu, H. Yin, F. Liu and Q. J. Xiang, J. Colloid Interface Sci., 2018, 513, 866–876 CrossRef CAS PubMed.
- J. Wang, T. Bo, B. Shao, Y. Z. Zhang and L. X. Jia, Appl. Catal., B, 2021, 297, 120498 CrossRef CAS.
- Y. Z. Zhang, W. Zhou, L. X. Jia, X. Tan and Y. L. Chen, Appl. Catal., B, 2020, 27, 119152 CrossRef.
Footnote |
| † Electronic supplementary information (ESI) available. See DOI: 10.1039/d1ra07691d |
| This journal is © The Royal Society of Chemistry 2021 |