DOI:
10.1039/D1RA07653A
(Paper)
RSC Adv., 2021,
11, 40059-40071
Production of chlorine-containing functional group doped graphene powders using Yucel's method as anode materials for Li-ion batteries
Received
15th October 2021
, Accepted 16th November 2021
First published on 16th December 2021
Abstract
In this study, the one-step electrochemical preparation of chlorine doped and chlorine-oxygen containing functional group doped graphene-based powders was carried out by Yucel's method, with the resultant materials used as anode materials for lithium (Li)-ion batteries. Cl atoms and ClOx (x = 2, 3 or 4) groups, confirmed by X-ray photoelectron spectroscopy analysis, were covalently doped into the graphene powder network to increase the defect density in the graphene framework and improve the electrochemical performance of Li-ion batteries. The microscopic properties of the Cl-doped graphene powder were investigated by scanning electron microscopy and transmission electron microscopy (TEM) analyses. TEM analysis showed that the one-layer thickness of the graphene was approximately 0.33 nm. Raman spectroscopy analysis was carried out to determine the defect density of the graphene structures. The G peak obtained in the Raman spectra is related to the formation of sp2 hybridized carbons in the graphene-based powders. The 2D peak seen in the spectra shows that the synthesized graphene-based powders have optically transparent structures. In addition, the number of sp2 hybridized carbon rings was calculated to be 22, 19, and 38 for the Cl-GP1, Cl-GP2, and Cl-GOP samples, respectively. As a result of the charge/discharge tests of the electrodes as anodes in Li-ion batteries, Cl-GP2 exhibits the best electrochemical performance of 493 mA h g−1 at a charge/discharge current density of 50 mA g−1.
1 Introduction
It is of great importance to use renewable energy sources correctly and efficiently to meet the increasing energy needs of the world.1–3 While meeting these needs, the use of clean resources and low cost are the most important requirements. In this context, the research on systems that store energy in chemical forms, such as rechargeable batteries (lead–acid batteries, redox flow batteries, lithium (Li)-ion batteries) and supercapacitors, has continues at an incredible pace.4–12 Since lithium is the lightest metal, it is an extremely suitable candidate for use in rechargeable battery applications. This metal has been extensively researched for nearly half a century, and different Li-ion batteries with positive or negative electrodes consisting of lithium or lithium-containing compounds have been synthesized.13,14 Unfortunately, the use of lithium metal as the negative electrode in Li-ion batteries creates safety problems due to the highly reactive character of lithium, so the search for safe and low-cost negative electrodes with high specific capacity continues.15,16 In 1991, graphite as a carbon-based negative electrode was first used in Li-ion batteries manufactured by Sony.17 In a graphite electrode, lithium ions can quickly enter and exit the graphitic structure without causing a large volume change while moving with the intercalation mechanism, thus eliminating safety concerns.14,18,19 However, although graphite offers a cost-effective solution, it has a limited capacity (372 mA h g−1) compared with its other counterparts.20 In metal and metal alloy electrodes, although the theoretical capacities for the movement of lithium ions between the positive and negative electrodes during charge and discharge are relatively high, sudden and large volume changes are observed at the negative electrode.21,22 This sudden large volume change causes the negative electrode to become dysfunctional, leading to capacity fading. Investigations have thus shown that using graphene instead of graphite as the negative electrode makes it possible to increase this limited capacity. Thus, the specific capacity can be doubled without sacrificing the long-term cycling life.23,24 Many methods, especially doping methods, have been used to increase graphene efficiency in energy storage applications.25 Doping graphene-based materials with heteroatoms is a critical approach that is used to change their internal structure and electronic properties. The doping of graphene can radically change its electrical, chemical, thermal, mechanical, and morphological properties.26–28 In particular, graphene structures doped with heteroatoms such as N, S, and P atoms have shown promising results in electrochemical energy storage systems.23,29–31 While, the doping of graphene with various heteroatoms increases the network disorder in graphene, it positively affects the specific capacities for energy storage applications.32 Doped heteroatoms entering the graphene framework create defects in the graphene structure as electron acceptors (p-type) or donors (n-type) and contribute towards electron conductivity.28,33–35 Moreover, chlorine, as a doping atom, is generally preferred because it has a higher atomic radius and electronegativity than carbon. Furthermore, covalently bonded electron-donating chlorine atoms generate negative charges on carbon atoms that further enhance the chemical activity of graphene.28,36 The doping of graphene with chlorine heteroatoms generates p-type defects in its structure as well as improved electrical conductivity of up to 2.5 times that of graphene.34,37,38 This phenomena has also been discussed in the literature for supercapacitor applications of heteroatom-doped graphene with improved electrochemical performance of the resulting systems.39,40 For this purpose, various strategies have been developed to synthesize heteroatom-doped graphene-based materials, which can be categorized as in situ and stepwise methods.28,41 Post-treatment methods are wet chemical, thermal annealing, plasma, and arc discharge, while in situ processes are chemical vapor deposition (CVD), ball milling, and bottom-up synthesis methods. Although the CVD method has high standardization possibilities, it is restrictive in that it requires expensive and specialized equipment. Even though the ball milling method allows for the successful production of small-scale doped graphene, there are limitations in switching it to mass production. Furthermore, high-quality heteroatom-doped, such as with boron and nitrogen, graphene can be prepared by bottom-up synthesis; however, this approach requires obtaining graphene oxide materials in the first step. Thermal processing and wet chemistry methods have generally been limited to a small scale because they require high temperatures, harmful chemicals, and exceptionally demanding purification processes.27,28,41 Most of these methods are highly restrictive for use in application areas, as they cannot be adequately controlled and are not suitable for industrial scale-up. Therefore, since they involve multiprocessing operations, high temperatures, harmful chemicals, incredibly demanding purification processes, low doping levels, low yield, and high cost, the use of these methods on an industrial scale is limited.28,42–44 Nevertheless, the synthesis of doped graphene-based materials via electrochemical methods has been one of the most remarkable methods in recent years due to the fact that it is carried out at room temperature, in one step, using environmentally friendly and low-cost chemicals, with high efficiency, and is extremely convenient for scaling up for mass production.45–48 One of the electrochemical synthesis methods for the production of heteroatom-doped graphene-based materials at room temperature in one step is ‘Yucel's method’, which was developed by our group.8,23,49 This method allows the selective doping of graphene by different heteroatoms, including functional groups, as a function of a scanned potential range.8,23,49 The most important advantage of this method is the synthesis of graphene with controllable functional groups and heteroatoms (–N, –S, and –Cl), its installation and operation costs are relatively low, and the use of environmentally friendly resources provides a great advantage in commercial applications.50–52
In this study, comparable chlorine-doped graphene-based powders were synthesized using a simple, one-step, environmentally friendly, economical, and extremely suitable for scale-up method known as Yucel's method. The structural and chemical features of the methods were characterized by spectroscopic, microscopic, and electrochemical methods. Then, the effects of chlorine and various oxygen/chlorine functional groups (–OH, –COOH, –COH, –ClO3, and –ClO4, etc.) in a graphene network for use in Li-ion batteries as anode components were investigated by carrying out electrochemical performance tests and measuring their specific capacities. The charge/discharge tests of the electrodes showed that the Cl-GP2 powder produced in the narrowest potential range had the best electrochemical performance.
2 Experimental
2.1 Production of Cl-doped graphene-based powders
Cl-doped graphene-based powders (Cl-GP1 and Cl-GP2) and Cl-doped graphene oxide (Cl-GOP) powders were fabricated in one step at room temperature from graphite rod using Yucel's and chronoamperometric methods, respectively. In a classical three-electrode-containing electrochemical cell, graphite rod (Ø6X200E, >99.9%, 0.5 cm in diameter), Ag/AgCl (in 3.0 M KCl), and Pt wire were used as working, reference, and auxiliary electrodes, respectively. Graphite rod electrodes were treated in 5.0 M HClO4 solution at different working potential ranges against an Ag/AgCl (in 3.0 M KCl) reference electrode at a scan rate of 50 mV s−1 via cyclic voltammetry at room temperature. Electrochemical treatment of graphite electrodes was carried out in the −1.3 to +2.5 V and 0.0 to +2.5 V potential ranges, with the products named Cl-GP1, and Cl-GP2, respectively. Similarly, the graphite rod electrode was treated via a chronoamperometric method at constant potential of +2.5 V and named Cl-GOP.30,51,53 Then, the prepared Cl-doped graphene-based powders were centrifuged at 10![[thin space (1/6-em)]](https://www.rsc.org/images/entities/char_2009.gif) 000 rpm for 10 minutes, and washed with deionized water to neutralize their acidic nature, unwanted large graphite flakes, and impurities, before being centrifuged again. Washing and centrifugation were continued to eliminate their acidity and impurities and the powders were then dried under vacuum at 70 °C.8,23,30,54 All the preparation parameters of the Cl-doped graphene-based powders are listed in Table 1.
000 rpm for 10 minutes, and washed with deionized water to neutralize their acidic nature, unwanted large graphite flakes, and impurities, before being centrifuged again. Washing and centrifugation were continued to eliminate their acidity and impurities and the powders were then dried under vacuum at 70 °C.8,23,30,54 All the preparation parameters of the Cl-doped graphene-based powders are listed in Table 1.
Table 1 Electrochemical synthesis parameters of Cl-doped graphene-based powders
| Electrode type |
Preparation method |
Scanned potential range versus Ag/AgCl (in 3 M KCl) |
Electrolyte |
| Cl-GP1 |
Yucel's method |
−1.3 to +2.5 V |
5.0 M HClO4 |
| Cl-GP2 |
Yucel's method |
0.0 to +2.5 V |
5.0 M HClO4 |
| Cl-GOP |
Chronoamperometry |
+2.5 V at constant potential |
5.0 M HClO4 |
2.2 Characterization of Cl-doped graphene-based powders by spectroscopic and microscopic methods
Morphological characterization of the produced Cl-doped graphene-based powders was carried out using a Zeiss SUPRA 50VP model scanning electron microscope (SEM) and JEOL-JEM2100F model 200 keV field emission transmission electron microscope (TEM). A Witec Alpha300R device equipped with a 532 nm laser was used for Raman spectroscopy analysis in order to reveal the bonding in the as-prepared powders. X-ray photoelectron spectroscopy (XPS) analysis was carried out using a Thermo Scientific Al K-alpha model instrument (Al anode Kα = 1468.3 eV).
2.3 Characterization of Cl-doped graphene-based powders by electrochemical methods
In the first stage of the electrode preparation process, 0.1 g of binder (polyvinylidene fluoride, PVDF) was dissolved in 4 ml of NMP (N-methylpyrrolidone) solvent, then 0.1 g of Super P and 0.4 g of active material were added and mixed using a high-speed magnetic stirrer overnight. After mixing, the slurry was poured onto copper foil, and a homogeneous coating was achieved using the tape casting method. The coating was dried at 80 °C under vacuum, and then the dried copper foil was measured and cut into 16 mm diameter punches and used as an electrode. 1.0 M LiPF6 in EC (ethylene carbonate)![[thin space (1/6-em)]](https://www.rsc.org/images/entities/char_2009.gif) :
:![[thin space (1/6-em)]](https://www.rsc.org/images/entities/char_2009.gif) DMC (dimethyl carbonate) (1
DMC (dimethyl carbonate) (1![[thin space (1/6-em)]](https://www.rsc.org/images/entities/char_2009.gif) :
:![[thin space (1/6-em)]](https://www.rsc.org/images/entities/char_2009.gif) 1 v/v) liquid electrolyte (purchased from Sigma-Aldrich) was used, then CR2032 type coin-cells and a counter electrode (Li foil, Alfa Aesar, 0.75 mm thick) were assembled. Galvanostatic charge–discharge curves were obtained in the potential range of 0.02–3.00 V at two constant current values (100, 1000 mA g−1) and variable current values (50 mA g−1, 100 mA g−1, 200 mA g−1, 500 mA g−1, 1000 mA g−1) using a BasyTec battery cycler. Cyclic voltammetry tests were performed at a scan rate of 0.5 mV s−1 in the potential range of 0.02–3.00 V. Electrochemical impedance spectroscopic (EIS) analyses were carried out at a frequency of 105–10−2 Hz with an amplitude 10 mV open circuit voltage by using Gamry Reference 3000 potentiostat/galvanostat.
1 v/v) liquid electrolyte (purchased from Sigma-Aldrich) was used, then CR2032 type coin-cells and a counter electrode (Li foil, Alfa Aesar, 0.75 mm thick) were assembled. Galvanostatic charge–discharge curves were obtained in the potential range of 0.02–3.00 V at two constant current values (100, 1000 mA g−1) and variable current values (50 mA g−1, 100 mA g−1, 200 mA g−1, 500 mA g−1, 1000 mA g−1) using a BasyTec battery cycler. Cyclic voltammetry tests were performed at a scan rate of 0.5 mV s−1 in the potential range of 0.02–3.00 V. Electrochemical impedance spectroscopic (EIS) analyses were carried out at a frequency of 105–10−2 Hz with an amplitude 10 mV open circuit voltage by using Gamry Reference 3000 potentiostat/galvanostat.
3 Results & discussion
3.1 Preparation of Cl-doped graphene-based powders
Chlorine-doped graphene-based powders were fabricated using Yucel's and chronoamperometric methods from graphite rods. Within this scope, the electrochemical behavior of the graphite rod electrodes was analyzed by cyclic voltammetry (Fig. 1) in 5.0 M HClO4 solution to determine the effects of the working potential ranges. In detail, the composition of the functional groups was controlled by changing the scanned potential ranges. Firstly, the optimum anodic and cathodic peaks were determined in a potential range between −1.3 and +2.5 V (vs. Ag/AgCl), for the material referred to as Cl-GP1, representing the widest potential range used in the electrode preparation. When scanning the anodic potential, the number of covalently bonded functional groups containing –Cl and –O gradually increased on the electrode surface in addition to the graphene being controllably reduced stepwise during the scanning of the cathodic potential.51 Moreover, in the oxidation of the graphite rod, a large peak at about 1.8 V was observed, which was attributed to covalently bonded chlorine and oxygen-containing functional groups such as chlorate, chlorite, hydroxyl, epoxy, and carboxylic acid during anodic potential scanning between −1.3 and 2.5 V. In the cathodic potential scanning following the anodic scanning, a few peaks were observed, three small ones at about 1.3 V, 0.9 V, and 0.6 V, and one large one at approximately −0.5 V to reduce these groups. Besides this, on going towards a more cathodic potential, these functional groups were reduced to fewer oxygen and oxygen-chlorine-containing functional groups. Furthermore, a narrower potential range of 0.0 to 2.5 V was applied to determine the effects of the scanning potential range on the chemical structure of Cl-doped graphene-based powders. In this way, more chlorine-including oxygenated groups were observed due to inadequate reduction, with the resulting graphene-based powder named Cl-GP2. Lastly, chlorine-doped graphene oxide powder (Cl-GOP), containing more oxygen–chlorine functional groups, was synthesized via chronoamperometry to compare with all of the Cl-doped graphene-based powders. With high controllability, thanks to the different applied potential ranges or constant potential, the chemical structures of the graphene-based powders featured different amounts of heteroatom defects and functional groups.53,55,56 Afterward, these chlorine-doped graphene-based powders were exfoliated as a function of increasing voltammetry cycle numbers. Furthermore, the intercalation of chlorine and oxygen-containing functional groups has been observed to help further expand graphene layers.51,57
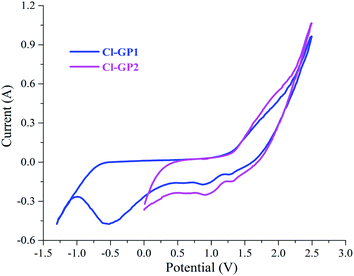 |
| | Fig. 1 Cyclic voltammograms for the synthesis of Cl-GP1 and Cl-GP2 powders in 5.0 M HClO4 solution against Ag/AgCl (in 3.0 M KCl) at a scan rate of 50 mV s−1. | |
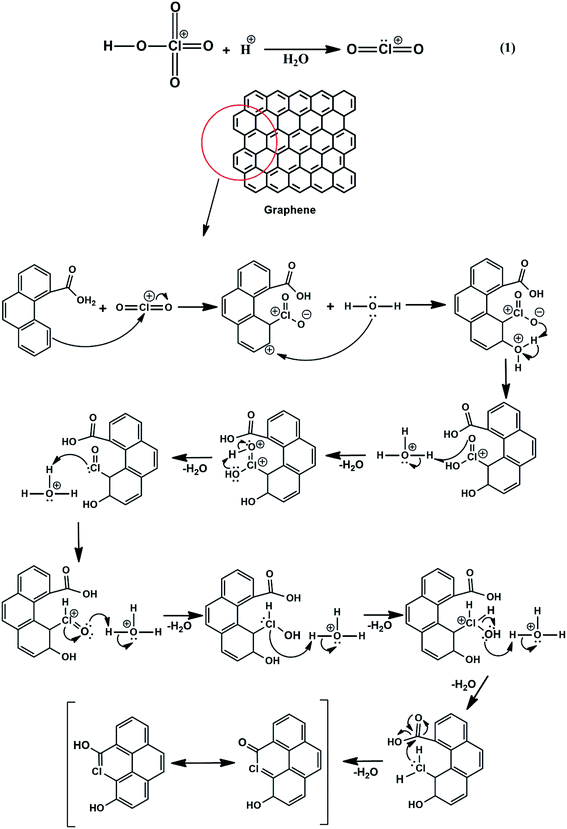
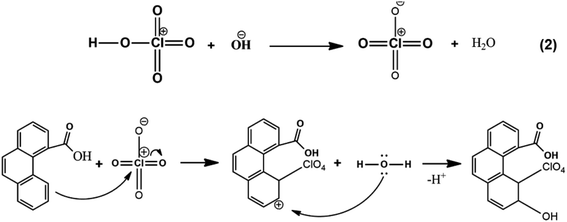
Chlorine-doped graphene synthesis was carried out using Yucel's method for the first time, to the best of our knowledge. Therefore, a plausible mechanism (eqn (1) and (2)) showing the binding of chlorine-containing functional groups to the graphene structure was proposed for the first time, to the best of our knowledge. Eqn (1) and (2) are both electrophile forming reactions. The formed electrophilic chloral structure in eqn (1) is added to the structure via an electrophilic aromatic substitution reaction. This does not occur via a one-step reaction, but by intramolecular proton migration and the production of water, therefore making it an electrophilic substitution reaction consisting of several steps. The reaction suggested in eqn (2) also generates a possible electrophile. The double bond electrons in the graphene ring attack the perchlorate electrophile and an intramolecular arrangement occurs to restore aromaticity. Then, the reaction ends with the binding of ClO4− to the graphene structure.12,58,59 XPS results supported the formation of these different types of Cl-doped graphene-based powders.
| |
 | (1) |
| |
 | (2) |
3.2 XPS analysis of Cl-doped graphene-based powders
The chemical compositions of the prepared Cl-doped graphene-based powders were determined by XPS analysis, with Fig. 2 showing the C 1s, Cl 1s, and O 1s XPS spectra of Cl-GP1, Cl-GP2, and Cl-GOP. In the C 1s XPS spectra of Cl-GP1, Cl-GP2, and Cl-GOP, peaks can be observed at around 284.6, 284.54, and 284.5 eV for –C–C– bonding, as shown in Fig. 2a, b and c, respectively.51 The peaks observed at around 285.9, 285.8, and 285.93 eV are related –C–Cl bond formation.60 Besides this, the peaks related to –C–O bonds can be observed in all of the spectra at approximately 287.02, 287.14, and 286.6 eV.23,30,38,61 The observation of C–Cl bond peaks in all of the XPS spectra of the Cl-GP1, Cl-GP2, and Cl-GOP graphene-based powders indicates the doping of chlorine heteroatoms into the graphene lattice structure. The Cl 1s spectrum of Cl-GP1 shows peaks at approximately 200.01 and 201.54 eV for –C–Cl bonding. These peaks can be observed at about 199.77, and 201.48 eV for Cl-GP2 and 199.94 and 201.51 eV for Cl-GOP (Fig. 2d–f). Furthermore, the peaks of –ClO2, –ClO3, and –ClO4 can be observed at around 206.9, 206.8, and 207 eV for Cl-GP1, Cl-GP2, and Cl-GOP, respectively. Besides these, peaks attributed to –ClO4 can be observed at approximately 208.3, 208.7, and 208.9 eV for Cl-GP1, Cl-GP2, and Cl-GOP, respectively.36,51,58,60 However, the peaks related to –ClO2, –ClO3, and –ClO4 bonds in the XPS spectrum of Cl-GP2 are more intense than those in the Cl 1s spectra of Cl-GP1. This may indicate that Cl-GP2 is more heavily doped with Cl-containing oxygenated groups. This could be related to an increase in the capacitive behavior of Cl-GP2 as an anode material for Li-ion batteries. Furthermore, the O 1s spectra of graphene-based powders are given in Fig. 2g–i. The peaks at around 531.19, 531.53, and 531.70 eV can be attributed to –C![[double bond, length as m-dash]](https://www.rsc.org/images/entities/char_e001.gif) O bonds.62 Peaks can be observed at around 532.2, 532.3, and 532.26 eV for the –C–O bonds in the structure of the graphene-based powders.62–64 The peak with the highest binding energy for the C
O bonds.62 Peaks can be observed at around 532.2, 532.3, and 532.26 eV for the –C–O bonds in the structure of the graphene-based powders.62–64 The peak with the highest binding energy for the C![[double bond, length as m-dash]](https://www.rsc.org/images/entities/char_e001.gif) O bonds can be observed in the spectrum of Cl-GOP. This result should be directly related to the production method, which was chronoamperometry. The absence of a reduction using this method may be due to oxygen-rich groups that remain unreduced on the surface of the chlorine-doped graphene oxide powders. Finally, with a value of around 533.5 eV reported in the literature, peaks were determined for –O
O bonds can be observed in the spectrum of Cl-GOP. This result should be directly related to the production method, which was chronoamperometry. The absence of a reduction using this method may be due to oxygen-rich groups that remain unreduced on the surface of the chlorine-doped graphene oxide powders. Finally, with a value of around 533.5 eV reported in the literature, peaks were determined for –O![[double bond, length as m-dash]](https://www.rsc.org/images/entities/char_e001.gif) C–O bonds at around 534.2, 534.6, and 534.4 eV, as shown in Fig. 2g, h and i, respectively. This shift may be due to the chemical environment, or binding energy that may occur due to graphene ring defects during synthesis.
C–O bonds at around 534.2, 534.6, and 534.4 eV, as shown in Fig. 2g, h and i, respectively. This shift may be due to the chemical environment, or binding energy that may occur due to graphene ring defects during synthesis.
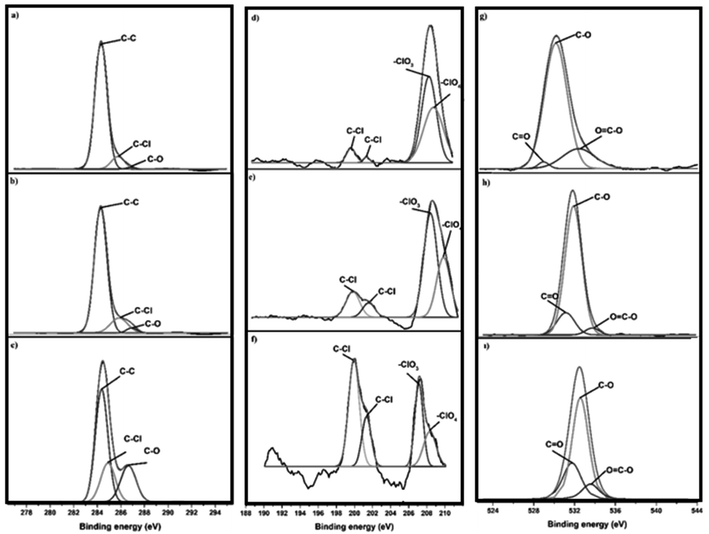 |
| | Fig. 2 C 1s XPS spectra of (a) Cl-GP1, (b) Cl-GP2, and (c) Cl-GOP; Cl 1s XPS spectra of (d) Cl-GP1, (e) Cl-GP2, and (f) Cl-GOP; O 1s XPS spectra of (g) Cl-GP1, (h) Cl-GP2, and (i) Cl-GOP. | |
3.3 Raman spectroscopic characterization of Cl-doped graphene-based powders
Raman spectroscopy is a powerful technique for identifying the defect density in carbon structures and determining the number of sp2 hybridized carbon rings in a material. To interpret the Raman spectra in detail, the spectra were deconvoluted by fitting according to Lorentzian and Gaussian mathematical models after manual baseline subtraction. The results show measurements taken from several points in each sample, as presented in Fig. 3. The D band (∼1350 cm−1) is related to the density of defects in the structure. The higher the intensity of the D band compared to the G band is related to there being more defects in the structure of the graphene-based powders, and the presence of disorder.65 The G band (∼1580 cm−1) has E2g symmetry and is related to in-plane vibrations. The 2D peak (∼2700 cm−1) is used to interpret graphene quality, gain information about ring defects and provide information about the number of layers. The DII band is observed at around 1500 cm−1 and emerges in consequence of the amorphous character of the structure. The DI band (1620 cm−1) that appears as a shadow of the G-band indicates the defective graphitic structure.66 Another defect-induced band is the D + DI peak observed at around 2900 cm−1 and consists of a combination of D and DI bands. The ID/IG ratio obtained from Raman analysis was calculated as 0.79, 0.9, and 0.46 for Cl-GP1, Cl-GP2, and Cl-GOP, respectively. Cl-GP2 with the highest ID/IG ratio has a more disordered structure as it contains a high density of defects in its structure, while Cl-GOP with the lowest ID/IG ratio has a more ordered structure with the fewest defects. Furthermore, the intensity of the peaks observed due to defects such as DI and DII increases with increasing defect ratio. Therefore, the absence of the DII peak in the Cl-GOP sample and the fact that the intensity of the DI peak is lower than those of the Cl-GP1 and ClGP2 indicates that they have more ordered structures compared to the others. The average size of the cluster diameter (Lα), which varies inversely with the ID/IG ratio, was determined using Tuinstra and Koenig's equation (eqn (3)) (Table 2).67
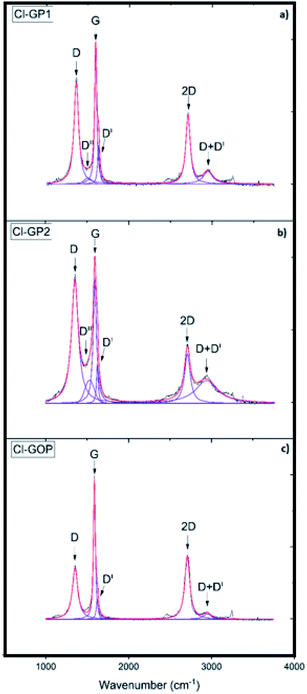 |
| | Fig. 3 Raman spectra of (a) Cl-GP1, (b) Cl-GP2, and (c) Cl-GOP. | |
Table 2 Results of Raman analysis
| Graphene powder |
ID/IG |
I2D/IG |
IIID/IG |
IID/IG |
Lα (nm) |
Ring number |
| Cl-GP1 |
0.79 |
0.51 |
0.06 |
0.33 |
55.69 |
∼22 |
| Cl-GP2 |
0.9 |
0.46 |
0.18 |
0.29 |
48.89 |
∼19 |
| Cl-GOP |
0.46 |
0.5 |
— |
0.272 |
95.65 |
∼38 |
The number of sp2 hybridized carbon rings was 22, 19 and, 38 for Cl-GP1, Cl-GP2 and Cl-GOP, respectively. Cl-GOP has the highest number of rings, whereas Cl-GP2 has the lowest number of rings.
Fig. 4 shows a comparison of the XRD patterns of Cl-GOP, Cl-GP1, and Cl-GP2. The sharp and relatively high intensity C (002) diffraction peaks, corresponding to multi-layered graphene with a d-spacing of 3.36 Å, can be observed at about 2θ = 26.36, 26.41, and 26.48 diffraction peaks for Cl-GOP, Cl-GP1, and Cl-GP2, respectively.12,58 Furthermore, Cl-GOP demonstrates a relatively low intensity and broad diffraction peak for C (002) in comparison with Cl-GP1 and Cl-GP2, which can be related to the different levels of oxygen-containing chlorinated groups in the graphene structures.68 Besides this, broad peaks at approximately 42.18°, 42.33°, and 42.09° can be observed for the Cl-GOP, Cl-GP1, and Cl-GP2, respectively. Cl-GOP demonstrates a more relatively low intensity and broad diffraction peak compared to the other graphene powders. This can be ascribed to the different effects as a result of the existence of oxygen-containing functional groups such as hydroxide, epoxy, carboxyl, chlorate, and chlorite.69,70
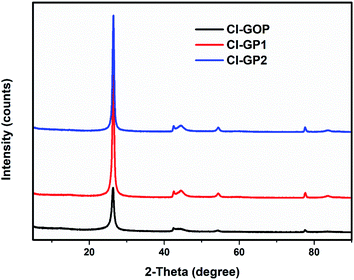 |
| | Fig. 4 XRD patterns of the Cl-GOP, Cl-GP1, and Cl-GP2 graphene powders. | |
3.4 Microscopic characterization of Cl-doped graphene-based powders
Microstructural analysis of Cl-doped graphene-based powders was performed by SEM and TEM techniques. Representative SEM images of Cl-GP1, Cl-GP2, and Cl-GOP are given in Fig. 5a, b and c, respectively. According to the SEM images, it has been observed that the chlorine-doped graphene-based powder layers are bundled in a multi-layered form. Cl-GOP has larger clusters, while Cl-GP1 and Cl-GP2 consist of smaller clusters, as shown in Fig. 5. Besides this, the SEM image of Cl-GP1 indicates that the formation of more edge sites of the graphene powder sheets is more significant than for Cl-GP2 and Cl-GOP, as this can be related to the higher doping of Cl atoms.51,60 TEM analysis shows the presence of wrinkled and high transparency Cl-doped graphene-based powder layers, typical of thin graphene structures. It has been found that the thickness between the Cl-GP1 layers is 0.33 nm, and multilayered graphene powder sheets can be observed in the HRTEM images. Besides this, Cl-GP1 demonstrates a more wrinkled structure than Cl-GP2 and Cl-GOP (Fig. 6a–c). This can be attributed to the increased amount of chlorine doping as a result of the completion of the reduction process during synthesis in the graphene powder structure.39,60
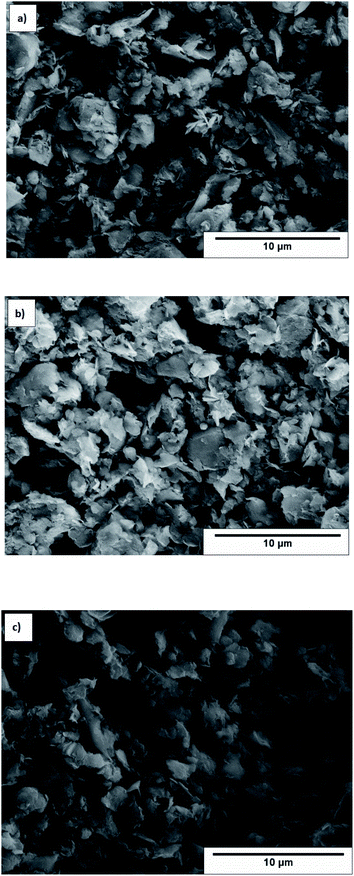 |
| | Fig. 5 SEM images of (a) Cl-GP1, (b) Cl-GP2, and (c) Cl-GOP. | |
 |
| | Fig. 6 TEM images of (a) Cl-GP1, (b) Cl-GP2, and (c) Cl-GOP. | |
3.5 Electrochemical characterization and battery testing of the Cl-doped graphene powders
Cyclic voltammetry and galvanostatic cycling analysis were applied to the structures of the Cl-doped graphene-based powders to measure their electrochemical performance. Cyclic voltammograms of Cl-GP1-, Cl-GP2-, and Cl-GOP-containing battery systems are shown in Fig. 7a, b and c, respectively. A typical oxidation peak at around 0.5 V can be observed in the cyclic voltammograms during cathodic scanning due to solid-electrolyte interface formation in the carbon-based materials. According to the cyclic voltammograms, the lithium-ion intercalation reaction can be said to continue in a highly reversible manner. Besides this, the oxidation and reduction peaks attributed to Li intercalation after the first cycle show a high degree of overlap. EIS analysis was also carried out for electrochemical characterization of Cl-GPs and Cl-GOP. Fitted EIS spectra of Cl-GP1, Cl-GP2, and Cl-GOP can be observed in Fig. 8 (inset: the equivalent circuit model used for fitting). In this circuit model, while Rs represents the ohmic resistance of the electrolyte, Rct is the charge transfer resistance of the electrochemical reaction. CPE is the double-layer capacitance and ZW represents the diffusion-controlled Warburg impedance. The data obtained by fitting of the spectra using the equivalent circuit are shown in Table 3. The Rs value has the lowest value of 3.503 Ω in the battery where Cl-GP2 was used as the anode material. Rct values were determined as 32, 20.53, and 61.76 Ω for Cl-GP1, Cl-GP2, and Cl-GOP, respectively. These results also support the electrocatalytic performance of the Cl-GP2 battery during the oxidation and reduction reactions. In addition, the ZW value was the highest Cl-GP2, indicating the enhanced diffusion rate of Li+ ions to this electrode composition.
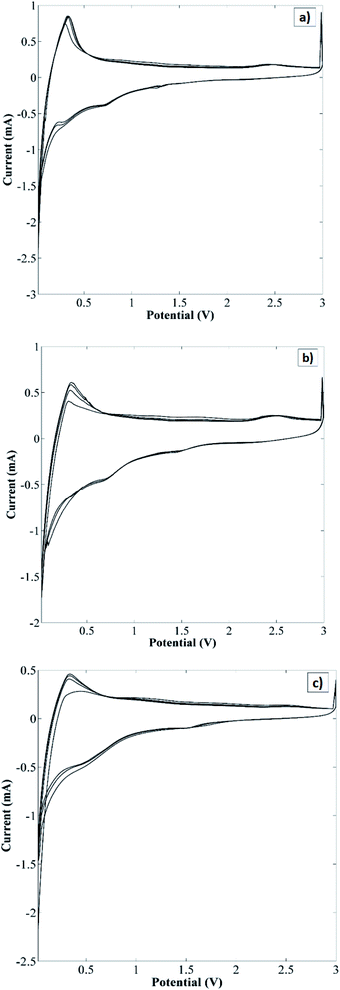 |
| | Fig. 7 Cyclic voltammograms of (a) Cl-GP1, (b) Cl-GP2, and (c) Cl-GOP. | |
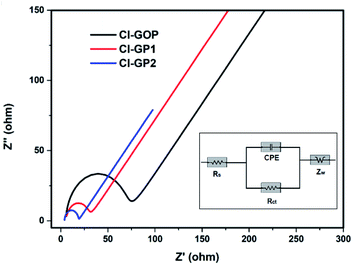 |
| | Fig. 8 Fitted electrochemical impedance spectra of Cl-GP1, Cl-GP2, and Cl-GOP in 1.0 M LiPF6 (inset: used equivalent circuit model). | |
Table 3 Fitted results for EIS measurements of Cl-GP1, Cl-GP2, and Cl-GOP
| Electrode |
Rs (Ω) |
Rct (Ω) |
CPE (F) |
ZW |
| Cl-GP1 |
8.320 |
32.00 |
8.619 × 10⁻⁶ |
7.111 × 10⁻³ |
| Cl-GP2 |
3.503 |
20.53 |
3.279 × 10⁻⁶ |
33.59 × 10⁻³ |
| Cl-GP0 |
4.818 |
61.76 |
6.209 × 10⁻⁶ |
5.409 × 10⁻³ |
The long-term cycling behavior of Cl-GP1, Cl-GP2, and Cl-GOP was assessed by galvanostatic charge/discharge under a relatively high constant charge/discharge current density of 100 mA g−1. Also, the remaining capacity as a function of cycle number is given in Fig. 9. In the charge/discharge curves obtained after 200 cycles at a current of 100 mA g−1, it can be observed that electrodes were exposed to largely irreversible capacity loss after the first discharge, which can be attributed to the formation of a SEI (Fig. 9). As the cycling proceeded, the recovered capacity continuously improved and reached 481, 493, and 374 mA h g−1 after 200 cycles for Cl-GP1, Cl-GP2, and Cl-GOP, respectively. Since Cl-GP2 has a lower number of rings in its main structure than Cl-GP1 and Cl-GOP, the insertion of the Li+ ions increased to high defect sides in the structure of Cl-GP2. This also increased the specific capacity of the Cl-GP2 as an electrode material in the charge/discharge cycling tests. Moreover, Cl-GP2 stood out as it showed the highest capacity retention, with the recovery of 374 mA h g−1 capacity, with Cl-GOP showing the lowest capacity retention. This is also mainly related to the chemical structure of Cl-GP2. According to the XPS analysis, the peak intensities of C–Cl bonding are the lowest for Cl-GP2. While, non-reversible reactions occurred for Cl-GP1 and Cl-GOP between Li+ ions and –Cl, with the amount of these reactions decreased in the Cl-GP1 battery due to its low C–Cl content. In some cases, a sudden drop in capacity was observed. The reason for this sudden drop and the continual increase in capacity is the poor wetting of graphene layers with electrolyte due to high surface area and very small interlayer distance, as discussed in the TEM results for Cl-GOP. Raman analysis also shows that Cl-GOP has the highest number of graphene rings, at 38, of all of the chlorine-doped graphene-based powders. Due to the active surface area and porosity of the electrode, specific capacity behavior was observed for the Cl-GOP battery. As confirmed from the 1000-cycle capacity retention results given in Fig. 10, poor wetting did not change the fact that Cl-GP2 and Cl-GOP present the highest and the lowest capacity retention, respectively. The rate capability behavior of the structures of Cl-doped graphene-based powders was measured by galvanostatic cycling tests over 10 cycles at current densities of 50 mA g−1, 100 mA g−1, 200 mA g−1, 500 mA g−1, 1000 mA g−1, and again at 50 mA g−1 (Fig. 11). The remaining capacity values as a function of different current densities show that the capacity retention decreased as the current density increased. In line with the findings shown in Fig. 11, the highest recovered discharge capacity was observed for Cl-GP2 during the cycles, and the lowest recovered discharge capacity was observed for the Cl-GOP sample. When the current returns to its initial rate of 50 mA g−1, it is observed that Cl-GP1, Cl-GP2, and Cl-GOP maintain excellent reversibility (Table 4). A general comparison of the obtained specific capacity in this work and literature is given in Table 5. Although the specific discharge capacity of Cl-GP2 is higher than those of graphene oxide-based electrodes reported in the literature, it is lower than that of sulfur-doped graphene. This result is mainly related to the effects of the doped heteroatoms (Table 4). Here, chlorine doping into the graphene structure formed defect sides on the main structure of the material. These defect sides led to diffusion of the Li+ ions to the inside of the graphene layers. Besides this, chlorine-containing functional groups had steric effects on the graphene layers. This also led to the increased active surface area of the graphene layers. Indeed, the method used for the preparation of chlorine-doped graphene offers a one step, cheap and simple process for the industrial application of graphene-based materials in Li-ion batteries.
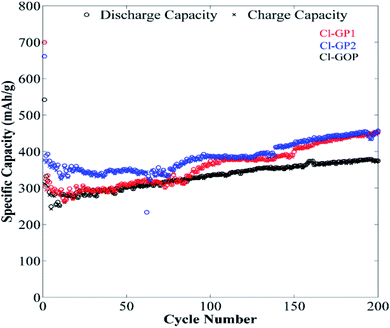 |
| | Fig. 9 Galvanostatic charge/discharge curves of Cl-GP1, Cl-GP2, and Cl-GOP at 100 mA g−1 over 200 cycles. | |
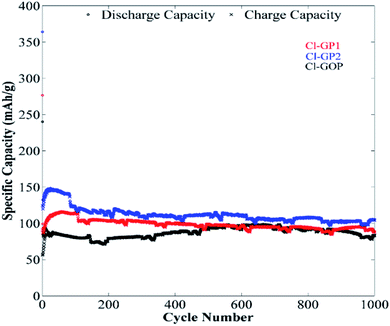 |
| | Fig. 10 Galvanostatic charge/discharge curves of Cl-GP1, Cl-GP2, and Cl-GOP at 1000 mA g−1 over 1000 cycles. | |
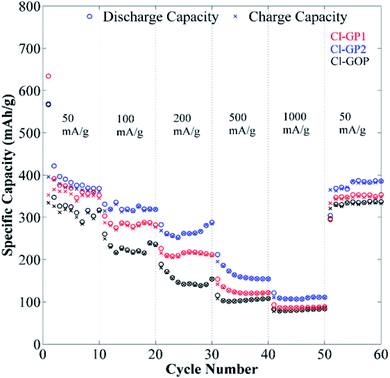 |
| | Fig. 11 Rate capability test results for Cl-GP1, Cl-GP2, and Cl-GOP at different charge/discharge current densities. | |
Table 4 Retained capacities of the samples cycled at different current densities
| Current density |
Retained capacities |
| Cl-GOP (mA h g−1) |
Cl-GP1 (mA h g−1) |
Cl-GP2 (mA h g−1) |
| 10 cycle@50 mA g−1 |
317 |
351 |
369 |
| 10 cycle@100 mA g−1 |
236 |
282 |
318 |
| 10 cycle@200 mA g−1 |
154 |
212 |
287 |
| 10 cycle@500 mA g−1 |
108 |
122 |
154 |
| 10 cycle@1000 mA g−1 |
84 |
86 |
111 |
| 10 cycle@50 mA g−1 |
337 |
354 |
386 |
Table 5 Performance comparison of anode materials of Li-ion batteries of the literature and this work
| Anode materials |
Studied potential range/V vs. Li/Li+ |
Preparation method of anode materials |
Charge/discharge current density |
Specific capacity |
Ref. |
| SiO2@graphene aerogel |
0.01–3.0 |
Modified Hummers' method and thermal treatment |
500 mA g−1 |
300 mA h g−1 |
71 |
| TiO2/graphene composites |
1.0–3.0 |
Hydrothermal method |
100 mA g−1 |
200 mA h g−1 |
72 |
| Chemically reduced graphene oxide |
0.001–2.0 |
Thermal reduction (at 500 °C) |
45 mA g−1 |
450 mA h g−1 |
73 |
| Reduced graphene oxide |
0.005–3.0 |
Reduction in aqueous solution of hydrazine at 80 °C |
50 mA g−1 |
330 mA h g−1 |
74 |
| Graphene oxide |
0.005–3.0 |
Microwave-assisted exfoliation of GO |
39.8 mA g−1 |
398 mA h g−1 |
75 |
| Boron-doped graphene |
0.01–3.0 |
Thermal reduction (at 500 °C) of mixture of boric acid and GO |
100 mA g−1 |
801 mA h g−1 |
76 |
| Nitrogen-doped graphene |
0.02–2.5 |
Heating graphene in air (430 °C for 3 h) and then in NH3/Ar (500 °C for 5 h) |
100 mA g−1 |
989.5 mA h g−1 |
77 |
| –N and –Cl dual-doped porous graphene |
0.01–3.0 |
Thermal treatment |
100 mA g−1 |
1200 mA h g−1 |
78 |
| Sulfur-doped graphene powders |
0.02–3.0 |
Chronoamperometric method |
50 mA g−1 |
915 mA h g−1 |
30 |
| Nitrogen-doped graphene powders |
0.02–3.0 |
Yucel's method |
50 mA g−1 |
438 mA h g−1 |
23 |
| Chlorine-doped graphene powders (Cl-GP2) |
0.02–3.0 |
Yucel's method |
50 mA g−1 |
493 mA h g−1 |
In this work |
The best electrochemical performance was observed for Cl-GP2 in galvanostatic cycling tests performed at a constant current rate of 100 mA g−1 and rate of capacity testing performed at different current rates. The electrochemical performance is affected by both the structural and chemical properties of the Cl-doped graphene-based powder networks. Therefore, structural defects in the Cl-doped graphene-based powder network and functional groups on the structure are among the main factors that affect performance.79,80 When the ratio of ID/IG obtained from Raman analysis is compared, it can be considered that Cl-GP2 contains a high amount of defects in its structure since it exhibits the highest rate. On the contrary, the Cl-GOP sample, with the lowest ID/IG ratio, has the most ordered structural graphene oxide network, while its electrochemical performance is relatively lower than those of the others. It is thought that the performance improves positively as the defects in the structure create active sites for the intercalation of lithium ions. The chemical structures of Cl-GP1, Cl-GP2, and Cl-GOP, which is another factor that affects electrochemical performance, change according to the potential range used during chlorine atom doping in the graphene network, leading to the formation of different types and amounts of functional groups in the structure. According to the XPS results, while the presence of oxygen and chlorine-containing functional groups is detected for all of the samples, the types and peak densities of these functional groups change depending on the scanning potential range of synthesis during the doping of the structure with chlorine atoms. In Cl-GP2, which exhibits the best electrochemical performance, the reduction of –ClO3 and –ClO4 groups could not be completed due to the doping of chlorine atoms in the narrowest potential range. Since the preparation method of heteroatom-doped graphene powders (Yucel's method) leads to the production of large amounts of graphene-based materials in one-step, using these materials in Li-ion battery applications for commercial batteries can be more economical.
4 Conclusions
In this study, chlorine-doped graphene-based powders containing chlorine and oxygen–chlorine-containing functional groups were synthesized in one-step via Yucel's method over different potential ranges, and their electrochemical performances for lithium-ion batteries were compared. The Cl-doped graphene-based powders were characterized using electrochemical, spectroscopic, and microscopic methods. The structural defect ratios, ID/IG, are 0.79, 0.9, and 0.46 and the numbers of carbon rings are 22, 19, and 38 for Cl-GP1, Cl-GP2, and Cl-GOP, respectively, as measured by Raman spectroscopy. Morphological examinations were performed using SEM and TEM microscopy methods, and the presence of multiple graphene layers was observed. As a result of the chemical analysis of the functional groups on the surface of the graphene-based powders using XPS, oxygen–chlorine containing functional groups were determined. It was observed that the reduction of the –ClO3 and –ClO4 groups could not be completely completed with the narrowing of the potential scanning range during the doping of chlorine atoms into the graphene powder networks. All the electrochemical testing showed that Cl-GP2 has the highest discharge capacity of 493 mA h g−1 at a charge/discharge current density of 50 mA g−1, and Cl-GOP has a relatively lower discharge capacity.
Conflicts of interest
There are no conflicts to declare.
Acknowledgements
The authors would like to thank Prof. Feridun Ay for allowing us to use the Raman spectroscopy equipment. The authors would also like to thank Eskişehir Technical University Scientific Research Projects Unit for grant number 1709F501 for battery assembly consumables and electrochemical performance testing.
References
- J. Jurasz, F. A. Canales, A. Kies, M. Guezgouz and A. Beluco, Sol. Energy, 2020, 195, 703–724 CrossRef.
- M. Gencten and Y. Sahin, Int. J. Energy Res., 2020, 44, 7903–7923 CrossRef CAS.
- A. V. Keskin, M. Gençten, S. Bozar, M. B. Arvas, S. Güneş and Y. Sahin, Thin Solid Films, 2020, 706, 138093 CrossRef CAS.
- N. Kocyigit, M. Gencten, M. Sahin and Y. Sahin, Int. J. Energy Res., 2020, 44, 411–424 CrossRef CAS.
- N. Kocyigit, M. Gencten, M. Sahin and Y. Sahin, Int. J. Energy Res., 2020, 44, 8014–8023 CrossRef CAS.
- O. Gorduk, M. Gencten, S. Gorduk, M. Sahin and Y. Sahin, J. Energy Storage, 2021, 33, 102049 CrossRef.
- M. G. Ersozoglu, Int. J. Electrochem. Sci., 2019, 14, 9504–9519 CrossRef CAS.
- M. B. Arvas, M. Gençten and Y. Sahin, Int. J. Energy Res., 2020, 44, 1624–1635 CrossRef CAS.
- O. Gorduk, S. Gorduk, M. Gencten, M. Sahin and Y. Sahin, Int. J. Energy Res., 2020, 44, 9093–9111 CrossRef CAS.
- M. B. Arvas, N. Karatepe, M. Gencten and Y. Sahin, New J. Chem., 2021, 45, 6928–6939 RSC.
- M. B. Arvas, M. Gencten and Y. Sahin, Ionics, 2021, 27, 2241–2256 CrossRef CAS.
- M. B. Arvas, H. Gürsu, M. Gencten and Y. Sahin, J. Energy Storage, 2021, 35, 102328 CrossRef.
- K. E. Aifantis, S. A. Hackney and R. V. Kumar, High Energy Density Lithium Batteries, Wiley, 2010 Search PubMed.
- V. Etacheri, R. Marom, R. Elazari, G. Salitra and D. Aurbach, Energy Environ. Sci., 2011, 4, 3243–3262 RSC.
- H. Ye, F. Jiang, H. Li, Z. Xu, J. Yin and H. Zhu, Electrochim. Acta, 2017, 253, 319–323 CrossRef CAS.
- Advances in Lithium-ion Batteries, ed. W. A. van Schalkwijk and B. Scrosati, Springer US, Boston, MA, 2002 Search PubMed.
- M. K. Gulbinska, Lithium-ion Battery Materials and Engineering, 2014, vol. 111 Search PubMed.
- D. Aurbach, B. Markovsky, I. Weissman, E. Levi and Y. Ein-Eli, Electrochim. Acta, 1999, 45, 67–86 CrossRef CAS.
- H. Buqa, D. Goers, M. Holzapfel, M. E. Spahr and P. Novák, J. Electrochem. Soc., 2005, 152, A474 CrossRef CAS.
- Lithium-Ion Batteries – Solid-Electrolyte Interphase, ed. P. B. Balbuena and Y. Wang, Imperial College Press, 2004 Search PubMed.
- B. Scrosati, Electrochim. Acta, 2000, 45, 2461–2466 CrossRef CAS.
- M. V. Reddy, G. V. Subba Rao and B. V. R. Chowdari, Chem. Rev., 2013, 113, 5364–5457 CrossRef CAS PubMed.
- H. Gürsu, Y. Güner, K. B. Dermenci, M. Gençten, A. F. Buluç, U. Savacı, S. Turan and Y. Şahin, Int. J. Energy Res., 2019, 43, 5346–5354 CrossRef.
- M. Liang and L. Zhi, J. Mater. Chem., 2009, 19, 5871 RSC.
- T. Qin, Z. Wang, Y. Wang, F. Besenbacher, M. Otyepka and M. Dong, Nano-Micro Lett., 2021, 13, 183 CrossRef CAS PubMed.
- B. Guo, L. Fang, B. Zhang and J. R. Gong, Insci. J., 2011, 1, 80–89 CrossRef CAS.
- L. K. Putri, W.-J. Ong, W. S. Chang and S.-P. Chai, Appl. Surf. Sci., 2015, 358, 2–14 CrossRef CAS.
- X. Wang, G. Sun, P. Routh, D. H. Kim, W. Huang and P. Chen, Chem. Soc. Rev., 2014, 43, 7067–7098 RSC.
- D. Xiong, X. Li, Z. Bai, H. Shan, L. Fan, C. Wu, D. Li and S. Lu, ACS Appl. Mater. Interfaces, 2017, 9, 10643–10651 CrossRef CAS PubMed.
- H. Gürsu, Y. Güner, K. B. Dermenci, M. Gençten, U. Savaci, S. Turan and Y. Şahin, Ionics, 2020, 26, 4909–4919 CrossRef.
- Z. S. Wu, W. Ren, L. Xu, F. Li and H. M. Cheng, ACS Nano, 2011, 5, 5463–5471 CrossRef CAS PubMed.
- H. Gursu, M. Gencten and Y. Sahin, J. Electrochem. Soc., 2021, 168, 60504 CrossRef CAS.
- R. Santhosh, S. R. S. Raman, S. M. Krishna, S. s. Ravuri, V. Sandhya, S. Ghosh, N. K. Sahu, S. Punniyakoti, M. Karthik, P. Kollu, S. K. Jeong and A. N. Grace, Electrochim. Acta, 2018, 276, 284–292 CrossRef CAS.
- X. Zhang, A. Hsu, H. Wang, Y. Song, J. Kong, M. S. Dresselhaus and T. Palacios, ACS Nano, 2013, 7, 7262–7270 CrossRef CAS PubMed.
- Y. Wen, C. Huang, L. Wang and D. Hulicova-Jurcakova, Chin. Sci. Bull., 2014, 59, 2102–2121 CrossRef CAS.
- L. Wang, Y. Li, Y. Wang, W. Kong, Q. Lu, X. Liu, D. Zhang and L. Qu, ACS Appl. Mater. Interfaces, 2019, 11, 21822–21829 CrossRef CAS.
- H. L. Poh and M. Pumera, ChemElectroChem, 2015, 2, 190–199 CrossRef CAS.
- H. Jiang, X. Ye, Y. Zhu, Z. Yue, L. Wang, J. Xie, Z. Wan and C. Jia, ACS Sustainable Chem. Eng., 2019, 7, 18844–18853 CrossRef CAS.
- K. Kakaei, M. Hamidi and S. Husseindoost, J. Colloid Interface Sci., 2016, 479, 121–126 CrossRef CAS PubMed.
- N. M. Latiff, C. C. Mayorga-Martinez, L. Wang, Z. Sofer, A. C. Fisher and M. Pumera, Appl. Mater. Today, 2017, 9, 204–211 CrossRef.
- L. Feng, Z. Qin, Y. Huang, K. Peng, F. Wang, Y. Yan and Y. Chen, Sci. Total Environ., 2020, 698, 134239 CrossRef CAS PubMed.
- L.-L. Tian, X.-Y. Wei, Q.-C. Zhuang, C.-H. Jiang, C. Wu, G.-Y. Ma, X. Zhao, Z.-M. Zong and S.-G. Sun, Nanoscale, 2014, 6, 6075–6083 RSC.
- S.-K. Park, A. Jin, S.-H. Yu, J. Ha, B. Jang, S. Bong, S. Woo, Y.-E. Sung and Y. Piao, Electrochim. Acta, 2014, 120, 452–459 CrossRef CAS.
- W. Yang, X. Xu, Z. Tu, Z. Li, B. You, Y. Li, S. I. Raj, F. Yang, L. Zhang, S. Chen and A. Wang, Electrochim. Acta, 2015, 173, 715–720 CrossRef CAS.
- V. Thirumal, A. Pandurangan, R. Jayavel, K. S. Venkatesh, N. S. Palani, R. Ragavan and R. Ilangovan, J. Mater. Sci.: Mater. Electron., 2015, 26, 6319–6328 CrossRef CAS.
- J. Lee, S. Noh, N. D. Pham and J. H. Shim, Electrochim. Acta, 2019, 313, 1–9 CrossRef CAS.
- F. Lou, M. E. M. Buan, N. Muthuswamy, J. C. Walmsley, M. Rønning and D. Chen, J. Mater. Chem. A, 2016, 4, 1233–1243 RSC.
- F. Liu, C. Wang, X. Sui, M. A. Riaz, M. Xu, L. Wei and Y. Chen, Carbon Energy, 2019, 1, 173–199 CrossRef.
- H. Gürsu, M. Gençten and Y. Şahin, Electrochim. Acta, 2017, 243, 239–249 CrossRef.
- H. Gürsu, Y. Güner, K. B. Dermenci, M. Gençten, A. F. Buluç, U. Savacı, S. Turan and Y. Şahin, Int. J. Energy Res., 2019, 43, 5346–5354 CrossRef.
- H. Gursu, M. Gençten and Y. Sahin, Int. J. Energy Res., 2018, 42, 3303–3314 CrossRef CAS.
- H. Gursu, M. Gencten and Y. Sahin, Int. J. Electrochem. Sci., 2018, 13, 875–885 CrossRef CAS.
- M. G. Ersozoglu, H. Gursu, M. Gencten, A. S. Sarac and Y. Sahin, Int. J. Energy Res., 2021, 45, 2126–2137 CrossRef CAS.
- M. B. Arvas, H. Gürsu, M. Gençten and Y. Sahin, Anal. Methods, 2018, 10, 4282–4291 RSC.
- X.-F. Wang, G.-G. Wang, J.-B. Li, Z. Liu, Y.-X. Chen, L.-F. Liu and J.-C. Han, Chem. Eng. J., 2019, 361, 773–782 CrossRef CAS.
- M. Hofmann, W.-Y. Chiang, T. D Nguyễn and Y.-P. Hsieh, Nanotechnology, 2015, 26, 335607 CrossRef PubMed.
- P. Yu, S. E. Lowe, G. P. Simon and Y. L. Zhong, Curr. Opin. Colloid Interface Sci., 2015, 20, 329–338 CrossRef CAS.
- Y. Wu, X. Lin, X. Shen, X. Sun, X. Liu, Z. Wang and J. K. Kim, Carbon, 2015, 89, 102–112 CrossRef CAS.
- D. Das, Y.-M. Lee, K. Ohkubo, W. Nam, K. D. Karlin and S. Fukuzumi, J. Am. Chem. Soc., 2013, 135, 4018–4026 CrossRef CAS PubMed.
- K.-P. Wang, Y.-C. Zhang, X. Zhang and L. Shen, SN Appl. Sci., 2019, 1, 157 CrossRef CAS.
- X. Li, S. P. Lau, L. Tang, R. Ji and P. Yang, J. Mater. Chem. C, 2013, 1, 7308 RSC.
- Z. Xing, Z. Ju, Y. Zhao, J. Wan, Y. Zhu, Y. Qiang and Y. Qian, Sci. Rep., 2016, 6, 26146–26156 CrossRef CAS PubMed.
- T. Skaltsas, X. Ke, C. Bittencourt and N. Tagmatarchis, J. Phys. Chem. C, 2013, 117, 23272–23278 CrossRef CAS.
- Y. C. G. Kwan, G. M. Ng and C. H. A. Huan, Thin Solid Films, 2015, 590, 40–48 CrossRef CAS.
- A. Mansuroglu, M. B. Arvas, C. Kiraz, B. Sayhan, A. Akgumus, M. Gencten, M. Sahin and Y. Sahin, J. Electrochem. Soc., 2021, 168, 60512 CrossRef CAS.
- S. Bernard, O. Beyssac, K. Benzerara, N. Findling, G. Tzvetkov and G. E. Brown, Carbon, 2010, 48, 2506–2516 CrossRef CAS.
- N. K. Lünsdorf, I. Dunkl, B. C. Schmidt, G. Rantitsch and H. von Eynatten, Geostand. Geoanal. Res., 2014, 38, 73–94 CrossRef.
- K. Krishnamoorthy, M. Veerapandian, K. Yun and S.-J. Kim, Carbon, 2013, 53, 38–49 CrossRef CAS.
- L. K. Putri, B.-J. Ng, K. H. Tan, F. S. Lim, W.-J. Ong, W. S. Chang and S.-P. Chai, Catal. Today, 2018, 315, 93–102 CrossRef CAS.
- J. Chen, Y. Zhang, M. Zhang, B. Yao, Y. Li, L. Huang, C. Li and G. Shi, Chem. Sci., 2016, 7, 1874–1881 RSC.
- J. Meng, Y. Cao, Y. Suo, Y. Liu, J. Zhang and X. Zheng, Electrochim. Acta, 2015, 176, 1001–1009 CrossRef CAS.
- B. Qiu, M. Xing and J. Zhang, J. Am. Chem. Soc., 2014, 136, 5852–5855 CrossRef CAS PubMed.
- F. J. Sonia, H. Kalita, M. Aslam and A. Mukhopadhyay, Nanoscale, 2017, 9, 11303–11317 RSC.
- D. Pan, S. Wang, B. Zhao, M. Wu, H. Zhang, Y. Wang and Z. Jiao, Chem. Mater., 2009, 21, 3136–3142 CrossRef CAS.
- S. Petnikota, N. K. Rotte, V. V. S. S. Srikanth, B. S. R. Kota, M. V. Reddy, K. P. Loh and B. V. R. Chowdari, J. Solid State Electrochem., 2014, 18, 941–949 CrossRef CAS.
- M. Sahoo, K. P. Sreena, B. P. Vinayan and S. Ramaprabhu, Mater. Res. Bull., 2015, 61, 383–390 CrossRef CAS.
- J. Xu, Y. Lin, J. W. Connell and L. Dai, Small, 2015, 11, 6179–6185 CrossRef CAS PubMed.
- H. Liu, Y. Tang, W. Zhao, W. Ding, J. Xu, C. Liang, Z. Zhang, T. Lin and F. Huang, Adv. Mater. Interfaces, 2018, 5, 1701261 CrossRef.
- Z. Wang, Q. Li, H. Xu, C. Dahl-Petersen, Q. Yang, D. Cheng, D. Cao, F. Besenbacher, J. V. Lauritsen, S. Helveg and M. Dong, Nano Energy, 2018, 49, 634–643 CrossRef CAS.
- Z. Wang, H. Wu, Q. Li, F. Besenbacher, Y. Li, X. C. Zeng and M. Dong, Adv. Sci., 2020, 7, 1901382 CrossRef CAS PubMed.
|
| This journal is © The Royal Society of Chemistry 2021 |
Click here to see how this site uses Cookies. View our privacy policy here.  Open Access Article
 a,
Yağmur Gunerb,
Melih Besir Arvasa,
Kamil Burak Dermencic,
Umut Savacic,
Metin Gencten
 d,
Servet Turanc and
Yucel Sahin
 *a
*a
![[thin space (1/6-em)]](https://www.rsc.org/images/entities/char_2009.gif) 000 rpm for 10 minutes, and washed with deionized water to neutralize their acidic nature, unwanted large graphite flakes, and impurities, before being centrifuged again. Washing and centrifugation were continued to eliminate their acidity and impurities and the powders were then dried under vacuum at 70 °C.8,23,30,54 All the preparation parameters of the Cl-doped graphene-based powders are listed in Table 1.
000 rpm for 10 minutes, and washed with deionized water to neutralize their acidic nature, unwanted large graphite flakes, and impurities, before being centrifuged again. Washing and centrifugation were continued to eliminate their acidity and impurities and the powders were then dried under vacuum at 70 °C.8,23,30,54 All the preparation parameters of the Cl-doped graphene-based powders are listed in Table 1.
![[thin space (1/6-em)]](https://www.rsc.org/images/entities/char_2009.gif) :
:![[thin space (1/6-em)]](https://www.rsc.org/images/entities/char_2009.gif) DMC (dimethyl carbonate) (1
DMC (dimethyl carbonate) (1![[thin space (1/6-em)]](https://www.rsc.org/images/entities/char_2009.gif) :
:![[thin space (1/6-em)]](https://www.rsc.org/images/entities/char_2009.gif) 1 v/v) liquid electrolyte (purchased from Sigma-Aldrich) was used, then CR2032 type coin-cells and a counter electrode (Li foil, Alfa Aesar, 0.75 mm thick) were assembled. Galvanostatic charge–discharge curves were obtained in the potential range of 0.02–3.00 V at two constant current values (100, 1000 mA g−1) and variable current values (50 mA g−1, 100 mA g−1, 200 mA g−1, 500 mA g−1, 1000 mA g−1) using a BasyTec battery cycler. Cyclic voltammetry tests were performed at a scan rate of 0.5 mV s−1 in the potential range of 0.02–3.00 V. Electrochemical impedance spectroscopic (EIS) analyses were carried out at a frequency of 105–10−2 Hz with an amplitude 10 mV open circuit voltage by using Gamry Reference 3000 potentiostat/galvanostat.
1 v/v) liquid electrolyte (purchased from Sigma-Aldrich) was used, then CR2032 type coin-cells and a counter electrode (Li foil, Alfa Aesar, 0.75 mm thick) were assembled. Galvanostatic charge–discharge curves were obtained in the potential range of 0.02–3.00 V at two constant current values (100, 1000 mA g−1) and variable current values (50 mA g−1, 100 mA g−1, 200 mA g−1, 500 mA g−1, 1000 mA g−1) using a BasyTec battery cycler. Cyclic voltammetry tests were performed at a scan rate of 0.5 mV s−1 in the potential range of 0.02–3.00 V. Electrochemical impedance spectroscopic (EIS) analyses were carried out at a frequency of 105–10−2 Hz with an amplitude 10 mV open circuit voltage by using Gamry Reference 3000 potentiostat/galvanostat.


![[double bond, length as m-dash]](https://www.rsc.org/images/entities/char_e001.gif) O bonds.62 Peaks can be observed at around 532.2, 532.3, and 532.26 eV for the –C–O bonds in the structure of the graphene-based powders.62–64 The peak with the highest binding energy for the C
O bonds.62 Peaks can be observed at around 532.2, 532.3, and 532.26 eV for the –C–O bonds in the structure of the graphene-based powders.62–64 The peak with the highest binding energy for the C![[double bond, length as m-dash]](https://www.rsc.org/images/entities/char_e001.gif) O bonds can be observed in the spectrum of Cl-GOP. This result should be directly related to the production method, which was chronoamperometry. The absence of a reduction using this method may be due to oxygen-rich groups that remain unreduced on the surface of the chlorine-doped graphene oxide powders. Finally, with a value of around 533.5 eV reported in the literature, peaks were determined for –O
O bonds can be observed in the spectrum of Cl-GOP. This result should be directly related to the production method, which was chronoamperometry. The absence of a reduction using this method may be due to oxygen-rich groups that remain unreduced on the surface of the chlorine-doped graphene oxide powders. Finally, with a value of around 533.5 eV reported in the literature, peaks were determined for –O![[double bond, length as m-dash]](https://www.rsc.org/images/entities/char_e001.gif) C–O bonds at around 534.2, 534.6, and 534.4 eV, as shown in Fig. 2g, h and i, respectively. This shift may be due to the chemical environment, or binding energy that may occur due to graphene ring defects during synthesis.
C–O bonds at around 534.2, 534.6, and 534.4 eV, as shown in Fig. 2g, h and i, respectively. This shift may be due to the chemical environment, or binding energy that may occur due to graphene ring defects during synthesis.


