
 Open Access Article
 This Open Access Article is licensed under a Creative Commons Attribution-Non Commercial 3.0 Unported Licence
Rapid detection of Vibrio parahaemolyticus using magnetic nanobead-based immunoseparation and quantum dot-based immunofluorescence†
Yue Zhai‡
a,
Xiangjun Meng‡a,
Li Lib,
Yushen Liua,
Kun Xu ac,
Chao Zhaoa,
Juan Wanga,
Xiuling Song*a,
Juan Li*a and
Minghua Jin*a
ac,
Chao Zhaoa,
Juan Wanga,
Xiuling Song*a,
Juan Li*a and
Minghua Jin*a
aDepartment of Hygienic Inspection, School of Public Health, Jilin University, 1163 Xinmin Street, Changchun 130021, Jilin, China. E-mail: songxiuling@jlu.edu.cn; li_juan@jlu.edu.cn; jinmh@jlu.edu.cn; Tel: +86 43185619441
bDongguan Key Laboratory of Environmental Medicine, School of Public Health, Guangdong Medical University, Dongguan 523808, Guangzhou, China
cEngineering Research Center of Jilin Public Health Testing, School of Public Health, Jilin University, 1163 Xinmin Street, Changchun 130021, Jilin, China
First published on 1st December 2021
Abstract
In recent years, the scale of population exposure and food poisoning caused by Vibrio parahaemolyticus (V. parahaemolyticus) has shown a significant upward trend, becoming one of the primary food-borne pathogens. Herein, we developed a rapid and sensitive detection of V. parahaemolyticus by integrating the technology of magnetic nanobeads (MBs) based immunoseparation (IMS) with quantum dots (QDs) based immunofluorescence. Firstly, specific rabbit polyclone IgG antibodies (IgG) and chicken egg yolk antibodies (IgY) of V. parahaemolyticus were prepared. Then two sizes of MBs (1 μm; 180 nm) were coupled with IgG to form immuno-MB (IMB) capture probes for evaluating the effect of different sizes on the detection efficiency. For QDs, they were conjugated with IgY to form fluorescent reporting probes. In the process of detection, IMB probes were used to separate V. parahaemolyticus and then these complexes were labeled by QD probes on the principle of double antibody sandwich. The fluorescence intensity of the IMB-V. parahaemolyticus-QD complexes was measured by a fluorescence spectrophotometer. The detection method takes 150 min with a detection limit of 102 cfu mL−1 ranging from 102 to 106 cfu mL−1 and it has been shown to work satisfactorily in real food samples.
Introduction
V. parahaemolyticus, which is a halophilic Vibrio, is present in coastal waters, seabed sediments, and other coastal areas globally.1–3 As one of the most common food-borne pathogenic bacteria, it is always present in clam, shellfish, and other kinds of seafood.4,5 After being consumed, V. parahaemolyticus causes acute gastroenteritis, sepsis, and other diseases, which have common symptoms of vomiting, diarrhea and intestinal cramps. Severe cases can lead to dehydration, shock, or even death.6,7 In view of the harm and prevalence, it is of great significance to establish a rapid, specific and sensitive detection method for the improvement of food safety and public health.The traditional culture-based method, as a routine laboratory test, always needs a long detection period and has complicated operation which means it cannot meet the need for rapid detection.8 In recent years, with the development of molecular biology techniques, several new detection methods such as enzyme-linked immunosorbent assay (ELISA), immunoblotting and polymerase chain reaction (PCR) have been gradually adopted.9–12 Although these methods have shown obvious improvements in speed and sensitivity when compared with traditional methods, the tedious pretreatment of samples and expensive instruments still restrict their extensive application and on-site testing.13,14 Due to the limitations of the above detection methods, it is difficult to meet the requirements of rapid and accurate screening in complex food components with low bacteria exposure. There are two key problems that need to be solved. One is quickly separating targets from complex matrix samples to simplify sample processing. The second is transforming and amplifying the signal of targets to achieve rapid and accurate detection.
In food sample pretreatment, relying on the specificity of biological functional groups and the oriented movement of magnetic character under external magnetic field, IMS technology, which combines MBs with bio-functional groups by covalent coupling, can isolate the target substance from the sample effectively.15–17 Additionally, IMS has no influence on the activity of the product, reduces the physical harm to the operator, needs simple operation and does not need large equipment.18,19 In this paper, IgG was bound to the surface of MBs by carboxyl amino binding principle. This method could rapidly separate and purify the target samples to greatly shorten the preconcentration time and improve the sensitivity and specificity of the detection.20 Such strategy had also been used in some experimental researches.21–23 However, commercially available MBs prepared in different diameters. The selection of which size in the isolation of bacteria has not been compared.
QDs are a kind of fluorescent dye with high-sensitivity fluorescent signal.24 They have emerged in recent years and have unique optical and electrical properties (wide excitation spectrum, narrow and symmetrical emission spectrum, long fluorescent service life, and so on) when its three-dimensional space reaches a certain critical dimension (1–100 nm in diameter).25 Covered by semiconductor material, which is like the crystal structure, the QDs of core/shell structure can prevent it from being oxidized, reduce the excitation defects, improve the fluorescent properties, and do some modifications on its surface for the purpose of further biological function.26–29 The QDs coated by IgY had been used as biomarkers, then used fluorescence spectroscopy to detect the antigen–antibody complex for quantity.
In our strategy (Fig. 1), we combined IMBs based separation technology with QDs based immunofluorescence labeling technology for detection of V. parahaemolyticus. IgG and IgY were conjugated onto the surface of MBs and QDs respectively to achieve IMB and QD probes for separation and labeling. Then the fluorescent intensity of the complex sandwich structure was measured by fluorescence spectrophotometer. In addition, we proved that the size of MBs did not seem to make big difference in detection sensitivity, but the smaller diameter of MBs could save more material and cost. We hope that this strategy can provide an effective and efficient approach for improving food safety and public health.
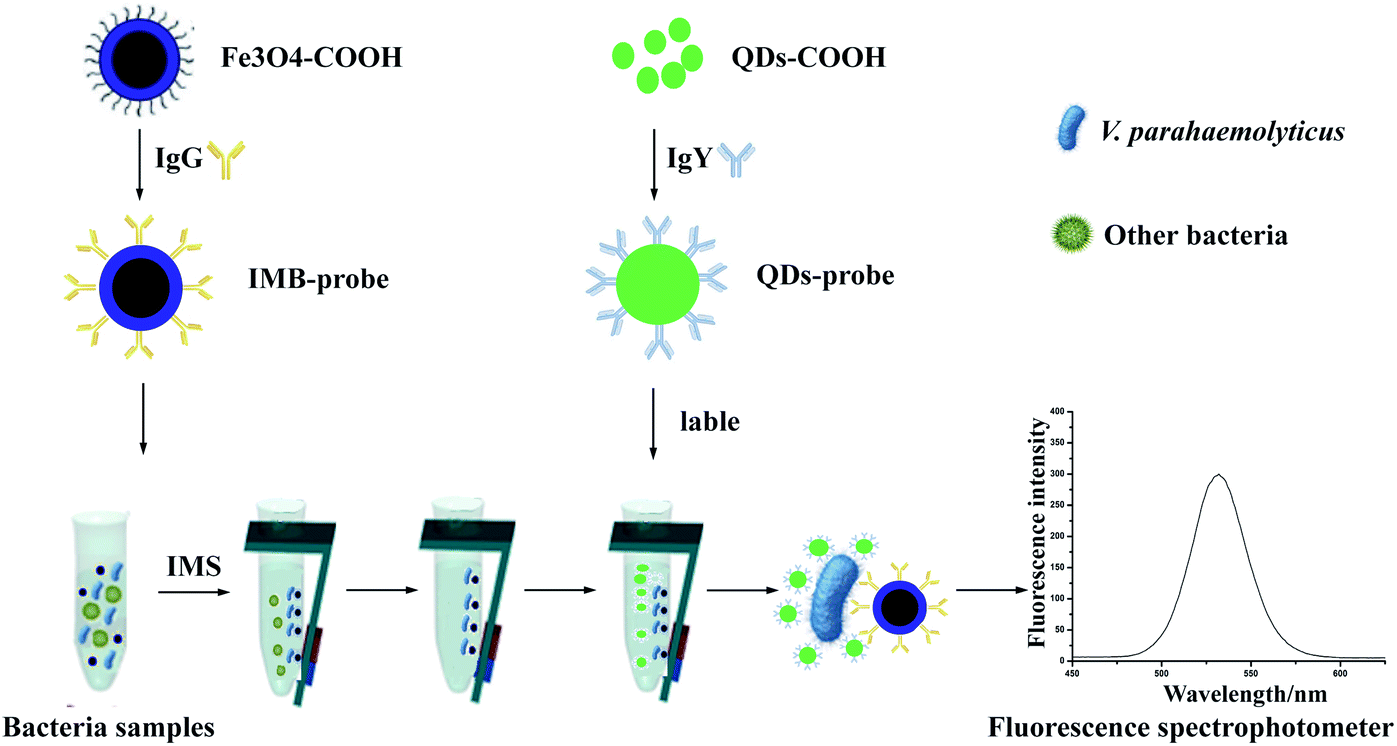 | ||
| Fig. 1 The technology road mapping. V. parahaemolyticus was separated by IMBs probes, then QDs probes were used as fluorescent label to measure the content of bacteria. | ||
Experimental
Materials and instrumentation
Carboxyl-magnetic nanobeads (180 nm) were purchased from Mikronano company (Rostock, Germany); carboxyl-magnetic nanobeads (1 μm) were purchased from Beaver Nano-Technologies Co., Ltd (Suzhou, China). Tris, Bovine Serum Albumin (BSA), 1-(3-dimethylaminopropyl)-3-ethylcarbodiimide (EDC), N-hydroxysuccinimide (NHS), and Tween-20 were purchased from Sigma-Aldrich Co., Ltd (New York, USA). NaCl, KCl, Na2HPO4, and KH2PO4 were purchased from Beijing Chemical Plant (Beijing, China). 2-Morpholinoethanesulfonic acid (MES) was purchased from Tichee Chemical Industry Development Co., Ltd (Shanghai, China). The CdSe@ZnS quantum dots (QDs) (0.05 mM, 5 nm) were kindly provided by Yushen Liu who produced in our lab.30 Fig. S1A and B† showed the absorption peak of QDs was observed at 530 nm, and the QDs exhibited a narrow and symmetrical fluorescence emission peak at 540 nm with a broad excitation spectrum under physiological relevant environmental conditions (PBS buffer solution, pH 7.4). Furthermore, high-resolution TEM indicated that the size of the QDs was about 5 nm (Fig. S1C†). V. parahaemolyticus culture was obtained from American Tissue Culture Collection (ATCC 17802). E. coli O157:H7 (ATCC 11229), L. monocytogenes (ATCC 19111), and S. bogdii (ATCC 9207) were provided by the Inspection and Quarantine Technology Center of Jilin entry exit inspection and Quarantine Bureau (Changchun, China). The hens were bought from HaoTai Laboratory Animal Breeding Co., Ltd (Shandong, China). The New Zealand white rabbit was bought from Experimental Animal Center of Jilin University (Changchun, China). Water used in the experiments was ultrapure water. The fluorescence spectrophotometer (RF-5301) was from Shimadzu (Japan). The small ultrasound machine (KQ3200E) was from Kunshan Shumei ultrasonic instruments Co., Ltd (China). Klingbeil vortex mixing apparatus was from Haimen instrument Co., Ltd (China). The pH meter (PHSJ-5) was from Shanghai ray magnetic instruments Co., Ltd (China). Beckman high-speed and low temperature refrigerated centrifuge was from USA.Animal immunization
V. parahaemolyticus was cultured in LB at 37 °C for 18 h to logarithmic metaphase. The bacteria were inactivated by incubating with 4% formaldehyde at 25 °C overnight and washed with PBS (4500 rcf, 15 min) three times. The antigen suspension (1010 cfu mL−1 in PBS) was emulsified with an equal volume of complete or incomplete Freund's adjuvant. This was stored at 4 °C for a week till the emulsion was not stratified, and then it was used as a vaccine to immunize the experimental animals.31The animal procedures were all carried out according to the Animal Scientific Procedures Act (1986) and the guidelines of the Agri-Food and Biosciences Institute (AFBI) Ethics Committee. Healthy New Zealand white rabbit (2 ± 0.2 kg) was immunized intramuscularly with inactivated bacteria with Freund's adjuvant at different sites on the back. The inactivated bacteria (1010 cfu mL−1) were emulsified with an equal volume of complete Freund's adjuvant for first immunization. Four booster injections with incomplete Freund's adjuvant were given at 14, 28, 42, 56, and 70 days after the first immunization. Seven days after the final boost, the blood sample of the rabbit was obtained. A 180-day-old chicken was immunized intramuscularly with inactivated bacteria with Freund's adjuvant at different sites on the breast muscles. The inactivated bacteria (1010 cfu mL−1) were emulsified with an equal volume of complete Freund's adjuvant for first immunization. Four booster injections with incomplete Freund's adjuvant were given at 14, 28, 42, and 56 days after the first immunization. Eggs were collected daily, marked, and stored at 4 °C until they were further processed.
Purification of IgG and IgY antibodies
Rabbit blood was collected from the auricular vein before each vaccination, and blood was extracted from the heart after the final immunization. The rabbit serum was isolated by centrifugal separation at 4500 rcf for 15 min, and IgG was purified by saturated ammonium sulfate method.32 First, the saturated ammonium sulfate was added to blood serum at a final concentration of 50%. After 2 h of incubation at 4 °C, the mixture was centrifuged at 17![[thin space (1/6-em)]](https://www.rsc.org/images/entities/char_2009.gif) 500 rcf for 15 min. The precipitate was dissolved in equal volume of PBS and mixed with saturated ammonium sulfate at a final concentration of 33%. After 2 h of incubation at 4 °C, the liquid was centrifuged at 17500 rcf for 15 min. The precipitate was the IgG, which was crude extracted.33
500 rcf for 15 min. The precipitate was dissolved in equal volume of PBS and mixed with saturated ammonium sulfate at a final concentration of 33%. After 2 h of incubation at 4 °C, the liquid was centrifuged at 17500 rcf for 15 min. The precipitate was the IgG, which was crude extracted.33
IgY from egg yolk was extracted by the improved PEG-6000 method, as described before.12,34 In brief, the yolk of each egg was diluted 1:2 with sterile PBS (0.01 M, pH 7.4). To eliminate lipids and lipoprotein, PEG-6000 was mixed with yolk suspension at a final concentration of 3.5% (w/v) and subjected to gentle shaking at 25 °C for 10 min. Following centrifugation at 17500 rcf for 20 min at 4 °C, the supernatant was collected, and PEG-6000 was added to a final concentration of 12% (w/v). The mixtures were thoroughly stirred and centrifuged at 17500 rcf for 20 min. Then the precipitate was dissolved in 10 mL of PBS (0.01 M, pH 7.4) and further precipitated with 12% PEG-6000. Finally, the precipitate was dissolved in 1.2 mL PBS and transferred into a micro-dialyzer and dialyzed against 0.1% NaCl overnight at 4 °C and then PBS for 4 h at 4 °C.
Evaluation of IgG and IgY
Indirect ELISA was performed to monitor the antibody titer.35 Coating antigen (inactivated V. parahaemolyticus) was dissolved in carbonate buffer solution (pH 9.6) and added to 96-well microplates at 100 μL per well and incubated at 4 °C overnight. After washing three times with PBS containing 0.5% Tween-20 (PBST), unbound sites were blocked with PBS containing 5% skim milk powder for 2 h at 37 °C. The plate was again washed three times with PBST. Then anti-V. parahaemolyticus antibodies diluted in PBS containing 5% skim milk powder (100 μL per well) were added to the ELISA plates for 1 h at 37 °C. After washing three times with PBST, goat anti-rabbit IgG antibody and goat anti-chicken IgG antibody, both labeled with horseradish peroxidase, were added after 1:10000 in PBS with 5% skim milk powder (100 μL) and incubated at 37 °C for 1 h. After washing three times with PBST, tetramethylbenzidine substrate solution containing 0.1 mmol L−1 citrate-phosphate buffer and 1 μL mL−1 H2O2 (100 μL) were added to each well and incubated for 15 min at 25 °C. Two moles per liter H2SO4 was added to the ELISA plate for reaction termination. The plate was read directly under a micro-plate reader at 450 nm. The titers of antibodies were determined by maximum dilution of sample (P/N ≥ 2.1, positive control and negative control, three replications).
Preparation of IgG-coated IMBs probes
Carboxyl-functionalized MBs were injected into 1.5 mL sample bottles and washed three times with MEST solution using a magnetic shelf. After the supernatant was discarded, 200 μL of EDC (10 mg mL−1 in MEST buffer solution) and NHS (10 mg mL−1 in MEST buffer solution) each were added to activate the carboxyl functional groups. The mixture was swirled using a vertical mixer at 25 °C for 30 min. The MBs were washed three times with PBST and re-suspended into 400 μL PBST solutions. Different amounts of IgG were added into the solution, and the reaction was carried out at 25 °C for 2 h. The supernatants were separated for absorbance measurement at 280 nm using an ultraviolet spectrophotometer, and the protein coupling rate and protein coupling amount were calculated as follows: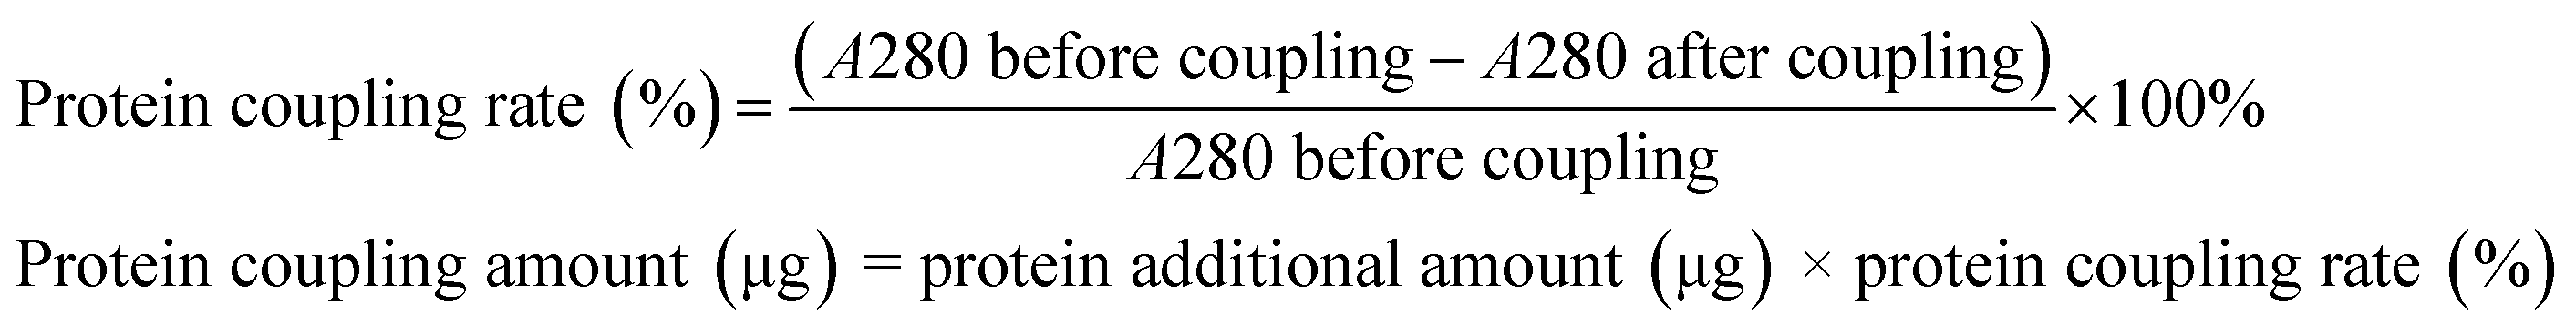
After that, the MBs were washed three times and re-dispersed in 1 mL of 1% BSA solution at 25 °C for 1 h to block the bareness sites on the surface of MNPs. Finally, the MBs were washed three times with PBS and re-dispersed into 400 μL PBS. The solution was stored at 4 °C until further use.
Preparation of IgY-coated QDs probes
In total, 20 μL of QDs (0.05 mM) were added to bottles containing 200 μL EDC (5 mg mL−1 in MEST buffer solution) and 200 μL NHS (5 mg mL−1 in MEST buffer solution). After 30 min of activation at 25 °C, the QDs solutions were transferred into 1.5 mL EP tubes and centrifuged at 17500 rcf for 5 min. Then the QDs were re-dispersed in 400 μL PBST containing 0, 40, 80, 120, 160, and 200 μg IgY. The coupling reaction was carried out at 25 °C for 2 h using a vertical mixer. After the reaction was completed, the solutions were transferred into EP tubes and centrifuged at 17500 rcf for 5 min. Finally, the precipitate was redispersed in 1 mL of 1% BSA solution at 25 °C for 1 h to block the bareness sites. Finally, the QDs were washed once with PBS and re-dispersed in 400 μL PBS. The fluorescence intensity was detected using a fluorescence spectrophotometer at an excitation wavelength of 532 nm. The solution was stored at 4 °C until further use.
Optimization of the detection methods
At first V. parahaemolyticus was connected to the IMBs and separated by using a magnetic shelf. Then the QDs probes, which provided the complex structure the property of fluorescence, were used to label the surface of the V. parahaemolyticus, and then fluorescence intensity was detected to determine the concentration of V. parahaemolyticus. We optimized the IMBs amount, QDs probes amount, the labeling time and the enriching time by choosing the point that the fluorescence intensity reached to a platform and won't increase significantly.Evaluation of the detection methods
The tests for sensitivity, accuracy, specificity, and reproducibility were performed to evaluate the detection method. The IMBs were added into V. parahaemolyticus bacteria solutions (0, 101, 102, 103, 104, 105, and 106 cfu mL−1) to detect the limit of detection (LOD) as an evaluation of the sensitivity (the fluorescence intensity of the sample/the fluorescence intensity of negative control > 2.1). L. monocytogenes (ATCC 19111), E. coli O157:H7 (ATCC 11229), S. bogdii (ATCC 9207), V. parahaemolyticus (ATCC 17802) with a concentration of 105 cfu mL−1 were used to evaluate the specificity of the method. The accuracy was evaluated by detecting V. parahaemolyticus bacteria with a concentration of 104 cfu mL−1 for three times. And the recovery rate was calculated by the following equation:A: the bacterial concentration corresponding to the standard curve.B: the real bacterial concentration of the sample.

Detection of real samples
To further test the practical application capacity of our detection method, we purchased oyster in a local supermarket. The preparation of real food samples contaminated with bacteria were performed as follow: after the clams were milled, 5 g clam meat was dissolved in 10 mL PBS solution and stored overnight, and a 0.22 μm filter paper was used to obtain the sterile sample extraction. Specific concentrations of V. parahaemolyticus bacteria solutions (1 mL 0, 101, 102, 103, 104, 105 and 106 cfu mL−1) were prepared for adding into the artificial simulated samples for further sensitivity evaluation. At the same time, the negative control of blank sample was also prepared. The preparation protocol was in a similar way except the V. parahaemolyticus bacteria solutions was replaced by pure PBS to add into the oyster extraction.Results and discussion
Evaluation of IgG and IgY
The purities and titers of IgG and IgY were confirmed by SDS-PAGE and optimized indirect ELISA. Results revealed that IgG and IgY were almost pure and showed two major protein bands (Fig. 2A and B). The protein content of IgG is 17.257 mg mL−1, and the protein count of IgY is 7.318 mg mL−1. The specific activities were obtained by the OD450 signal ratio of the positive to negative sample (P/N ratio). P/N ≥ 2.1 indicates positive, while P/N ≤ 2.1 designates negative. The titer increased (≥1:2000 for IgG and ≥1:8000 for IgY) after the first booster injection and attained peak (≥1:1024000 for IgG and ≥1:128000 for IgY) after the fifth booster injection for IgG and the fourth booster injection for IgY (Fig. 2C and D). This clearly demonstrates that both antibodies reached high titers and were able to remain stable. In addition, we found that IgY could obtain a higher titer just after one immunization and achieve a stable titer more quickly. But for the final antibody titer, IgG was higher than IgY.
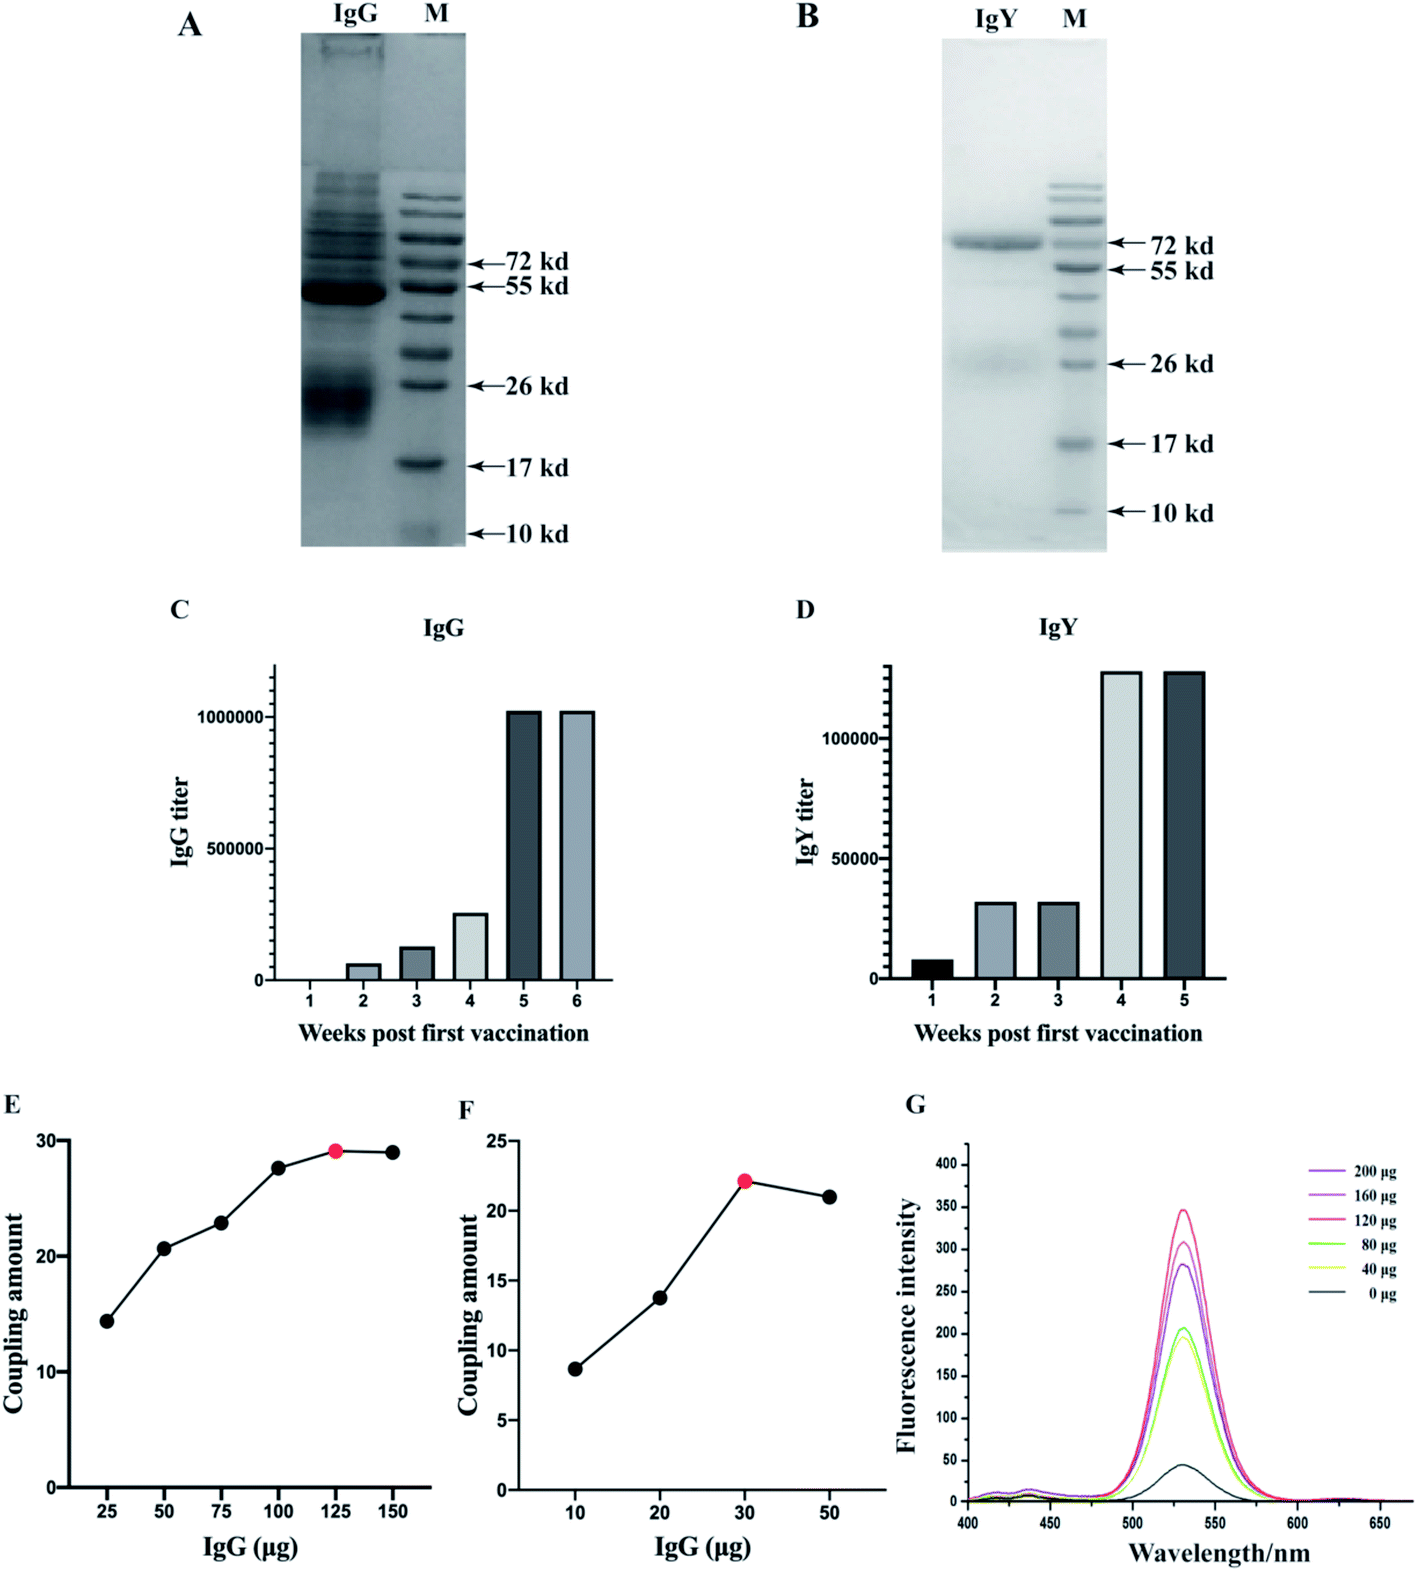 | ||
| Fig. 2 Assessment of the purity of IgG (A) and IgY (B). Lane M represented the molecular weight marker. Assessment of the antibody titre of IgG (C) and IgY (D) produced by immunizing rabbits and hens. The titer was presented by dilution times. The optimization of 1 μm IMBs-probes (E), 180 nm IMBs-probes (F) and QDs probes (G). For IMBs probes, A280 nm of the IgG solution was determined before and after conjugation. The amount of conjugated IgG of IMBs was calculated to evaluate the most efficient probes. For QDs probes, the fluorescence intensity of the complex was increased with the increase of the amount of IgY. The fluorescence intensity reached the highest level and then stepped down. | ||
Preparation and optimization of IMBs and QDs probes
Two kinds of MBs of different diameters were combined with IgG to construct the IMBs probes and QDs were combined with IgY to construct the QDs probes. The optimization of the probes was shown in Fig. 2E–G. When the amount of IgG was increased, the coupling amount of IgG for IMBs (1 μm) increased dramatically and reached the highest level at 125 μg. It indicated that the most suitable dosage of IgG was 125 μg for 1 μm IMBs probes. Fig. 2F showed with the increased IgG amount, the coupling amount showed a sharp increase first and then a slight decrease. The optimal IgG coupling amount was 30 μg for the 180 nm IMBs probes. The MBs with small diameter also have small surface area, so the optimal amount of antibody conjugated by 180 nm MBs is less than 1 μm MBs.Then ten microliters of activated QDs were coupled with 0, 40, 80, 120, 160, and 200 μg IgY. As Fig. 2G showed, the fluorescence intensity increased with increasing amounts of antibody, and the fluorescence intensity reached the peak when the amount of added IgY was 120 μg. The experimental results indicated that the optimal amount of IgY when preparing QDs-IgY probes was 120 μg. However, subsequently the conjugation rate or the fluorescence intensity decreased slightly, which might because excess antibodies competed and resulted in an antagonistic effect, when the amount of antibody added was further increased.
Optimization of experimental conditions
The IMBs probes amount, QDs probes amount, labeling time, and enrichment time were optimized to achieve the best performance of the detection method (Fig. 3). Fig. 3A–D represented the optimized conditions for 1 μm IMBs-QDs group and Fig. 3E–H represented the optimized conditions for 180 nm IMBs-QDs group. Fig. 3A showed that the fluorescence intensity reached peak when the amount of IMBs probes was 50 μL. The fluorescence intensity in Fig. 3B reached a comparatively high level at 60 min and remained basically stable which indicates the best enriching time of IMBs was 60 min. Fig. 3C showed that the fluorescence intensity reached the relatively high level when QDs probes amount was 300 μL. As shown in Fig. 3D, the fluorescence intensity line increased with the extension of the QDs labeling time and reached peak when the labeling time was 90 min. The line did not increase significantly with the prolongation of the labeling time. For the 180 nm IMBs-QDs group, it could be seen from Fig. 3E–H that the optimum IMBs probes amount was 40 μL, the best enriching time was 60 min, the optimum QDs probes amount was 400 μL and the best labeling time was 90 min. From the establishment methods, the time required for the two different sizes of IMBs-QDs methods was consistent (150 min). However, for 180 nm IMBs-QDs group, it could greatly reduce the amount of IgG (62.5 μg IgG and 50 μL MBs (1 μm) per 1 mL detection system; 12 μg IgG and 40 μL MBs (180 nm) per 1 mL detection system). This result may be due to the smaller size of MBs, which is more conducive to antibody conjugation. Therefore, from the perspective of cost saving, small-size MBs are more suitable for IgG-IMS technology.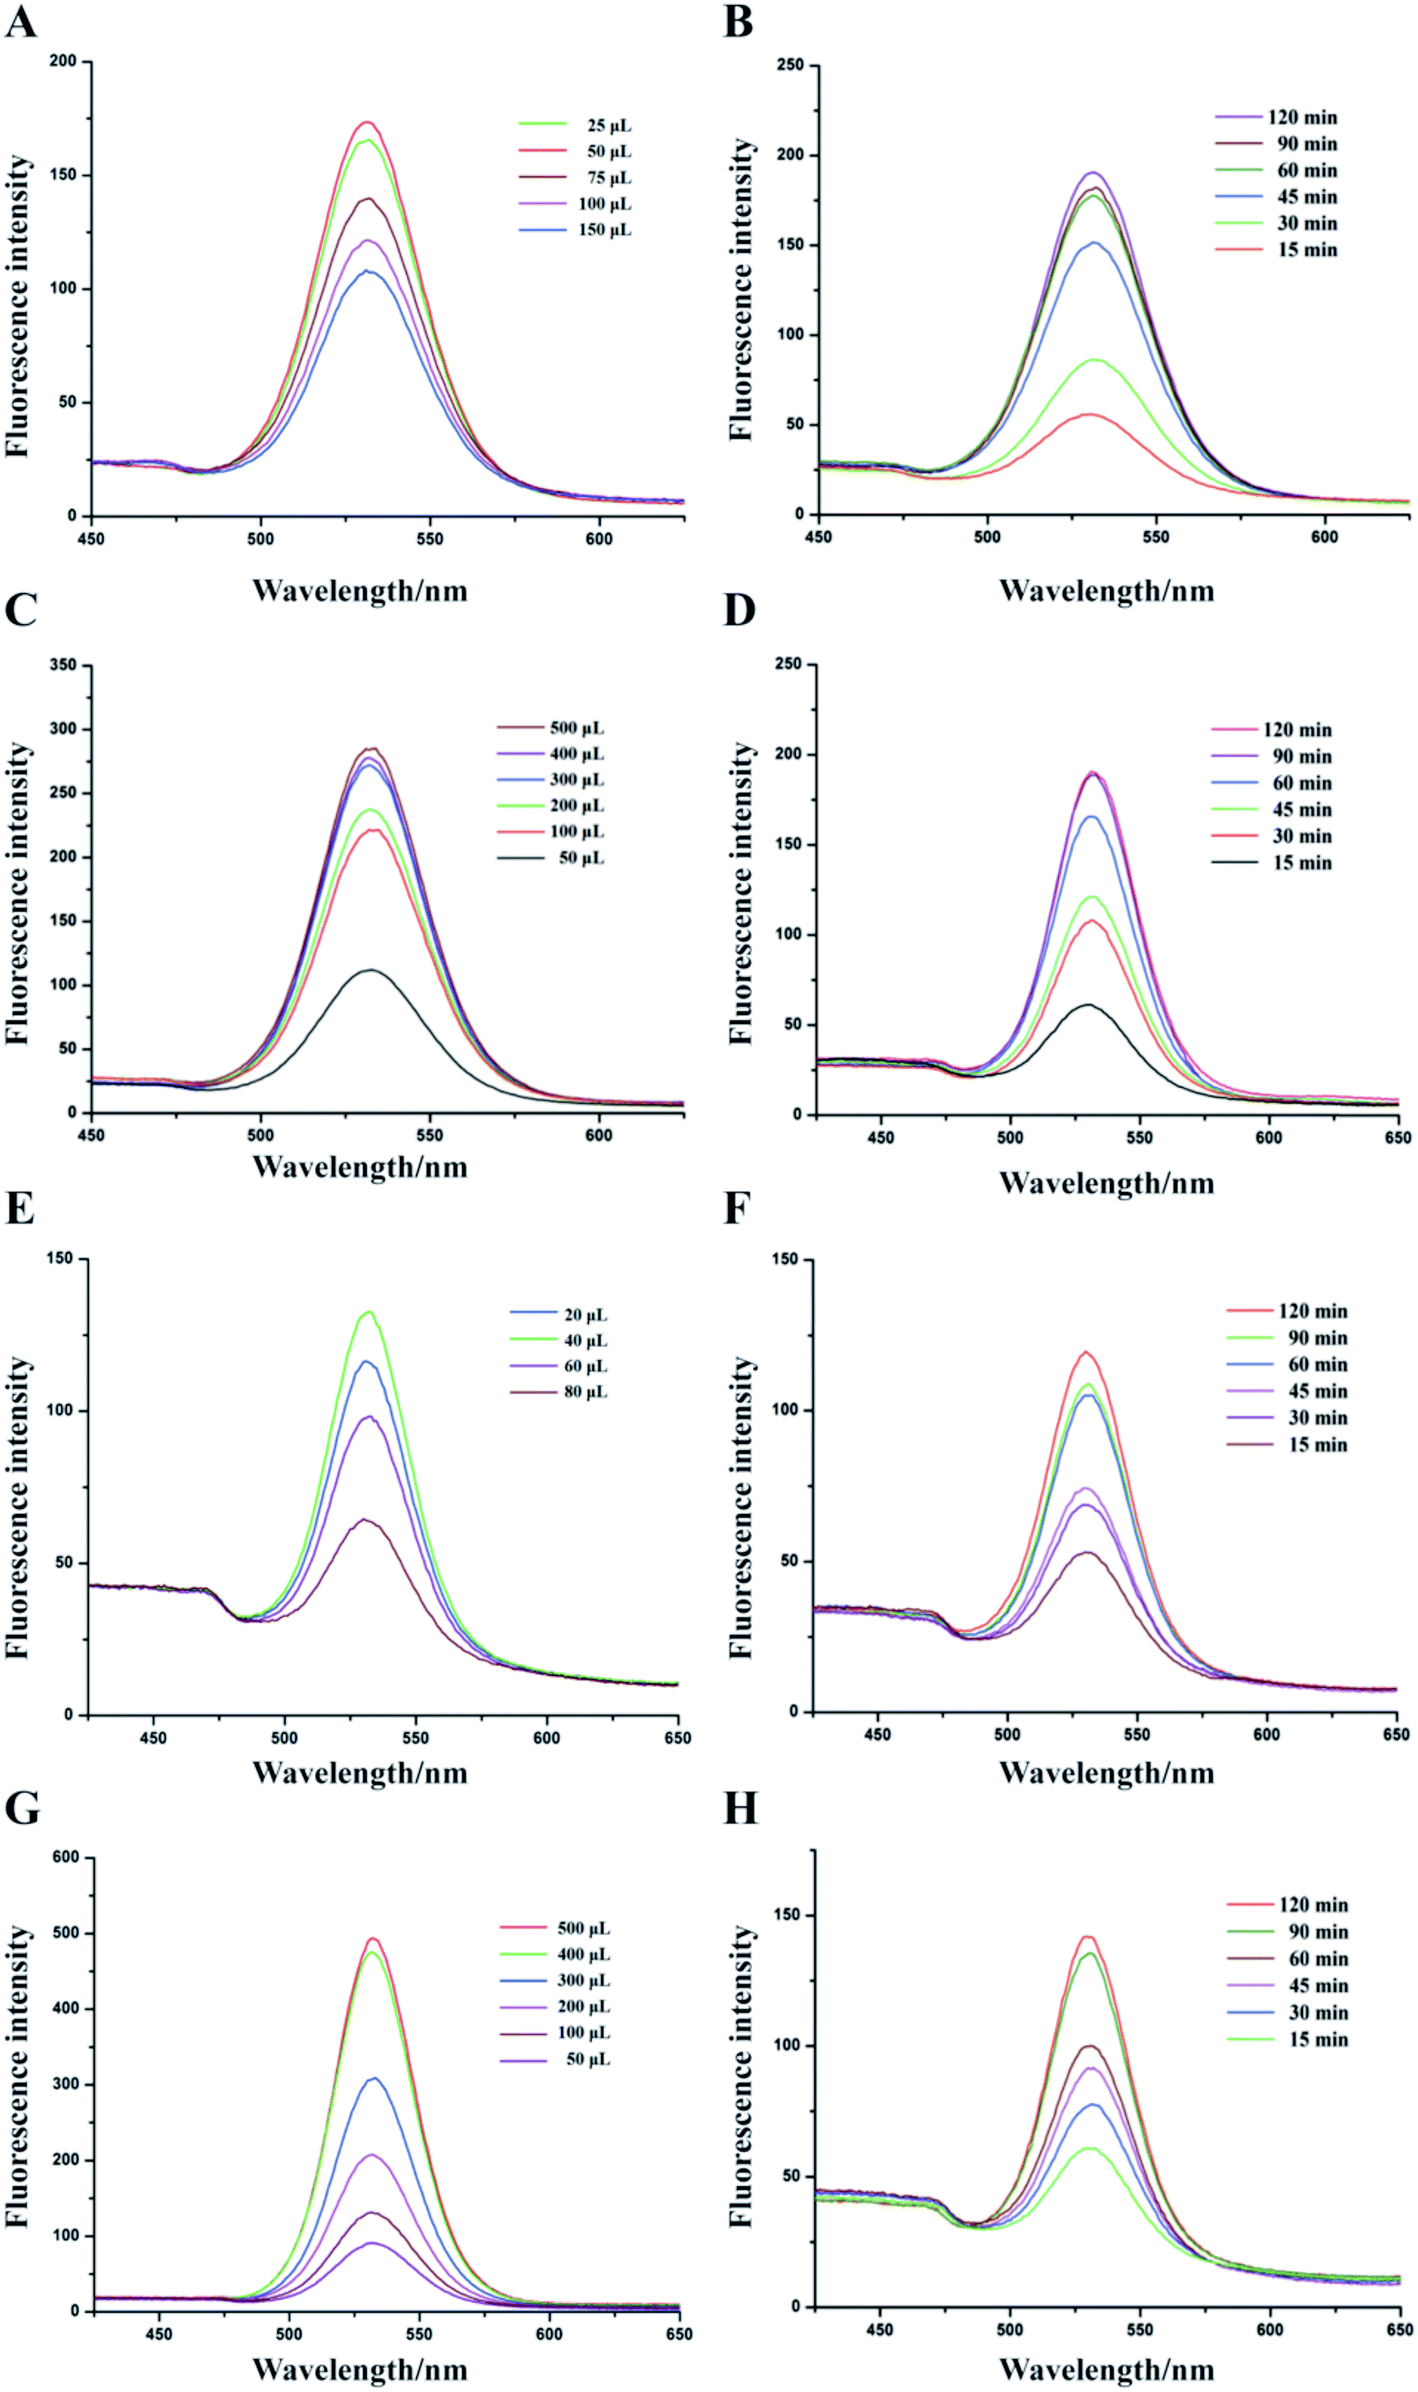 | ||
| Fig. 3 Fluorescence intensity was determined to optimized conditions of 1 μm IMBs-QDs group from the IMBs probes amount (A), QDs probes amount (B), labeling time (C) and enriching time (D). Fluorescence intensity was also determined to optimized conditions of 180 nm IMBs-QDs from the IMBs probes amount (E), QDs probes amount (F), labelling time (G) and enriching time (H). | ||
Evaluation of the detection method
To evaluate the detection methods that were established before, different concentrations of V. parahaemolyticus bacteria solutions were used to detect the sensitivity (Fig. 4A and C). The fluorescence intensity of two types of IMBs-QDs groups increased gradually with increasing concentrations of V. parahaemolyticus. The standard curves and linear relationship (R2) for the1 μm and 180 nm IMBs-QDs group were y = 57.66x + 13.8 (R2 = 0.989) and y = 72.5x + 88.2 (R2 = 0.996). The sensitivity showed a low LOD of 102 cfu mL−1 for both groups. The change of fluorescent intensity from was linearly correlated with the number of bacteria in the range of 102 to 106 CFU mL−1. In addition, 104 cfu mL−1 V. parahaemolyticus bacteria solution was used for the recovery test. The IMBs groups were added into the bacteria solution. The recovery rates were 90.61% and 95.26% for 1 μm and 180 nm IMBs groups respectively, which indicated the relatively good accuracy for the IMBs. Such a low detection limit can meet the existing requirements for food safety, and the test can be completed in only 150 minutes.36,37 Compared to previous established tests for V. parahaemolyticus, our method exhibited superior properties. For example, the LOD were 104 cfu mL−1 in pure cultures in a multiplex real-time PCR method established by Xu;38 Cheng built a detecting strategy combining IMS with RT-PCR, and the LOD could reach 5.4 × 10² cfu mL−1.39 However, just performing PCR takes longer than the entire detection time of our method. The method of Fu establishment, per fluorinated alkoxysilane modified molecularly imprinted polymer film, takes only two hours, but the detection line can only reach 104 cfu mL−1.40 It is obvious to see that in this assay the detection method was with higher sensitivity and more time-saving. This is attributed mainly to the effective immunomagnetic separation, high catalytic activity of IMS and sensitive QDs fluorescent reporting system. In addition, Zhang built a practical high performance automated bacterial concentration and recovery system based on the combination of a ceramic membrane and tangential flow filtration technique for Escherichia coli.41 So next we can further apply their high-performance automated pre-enrichment strategy combined with our system to increase the sensitivity and achieve better detection effect.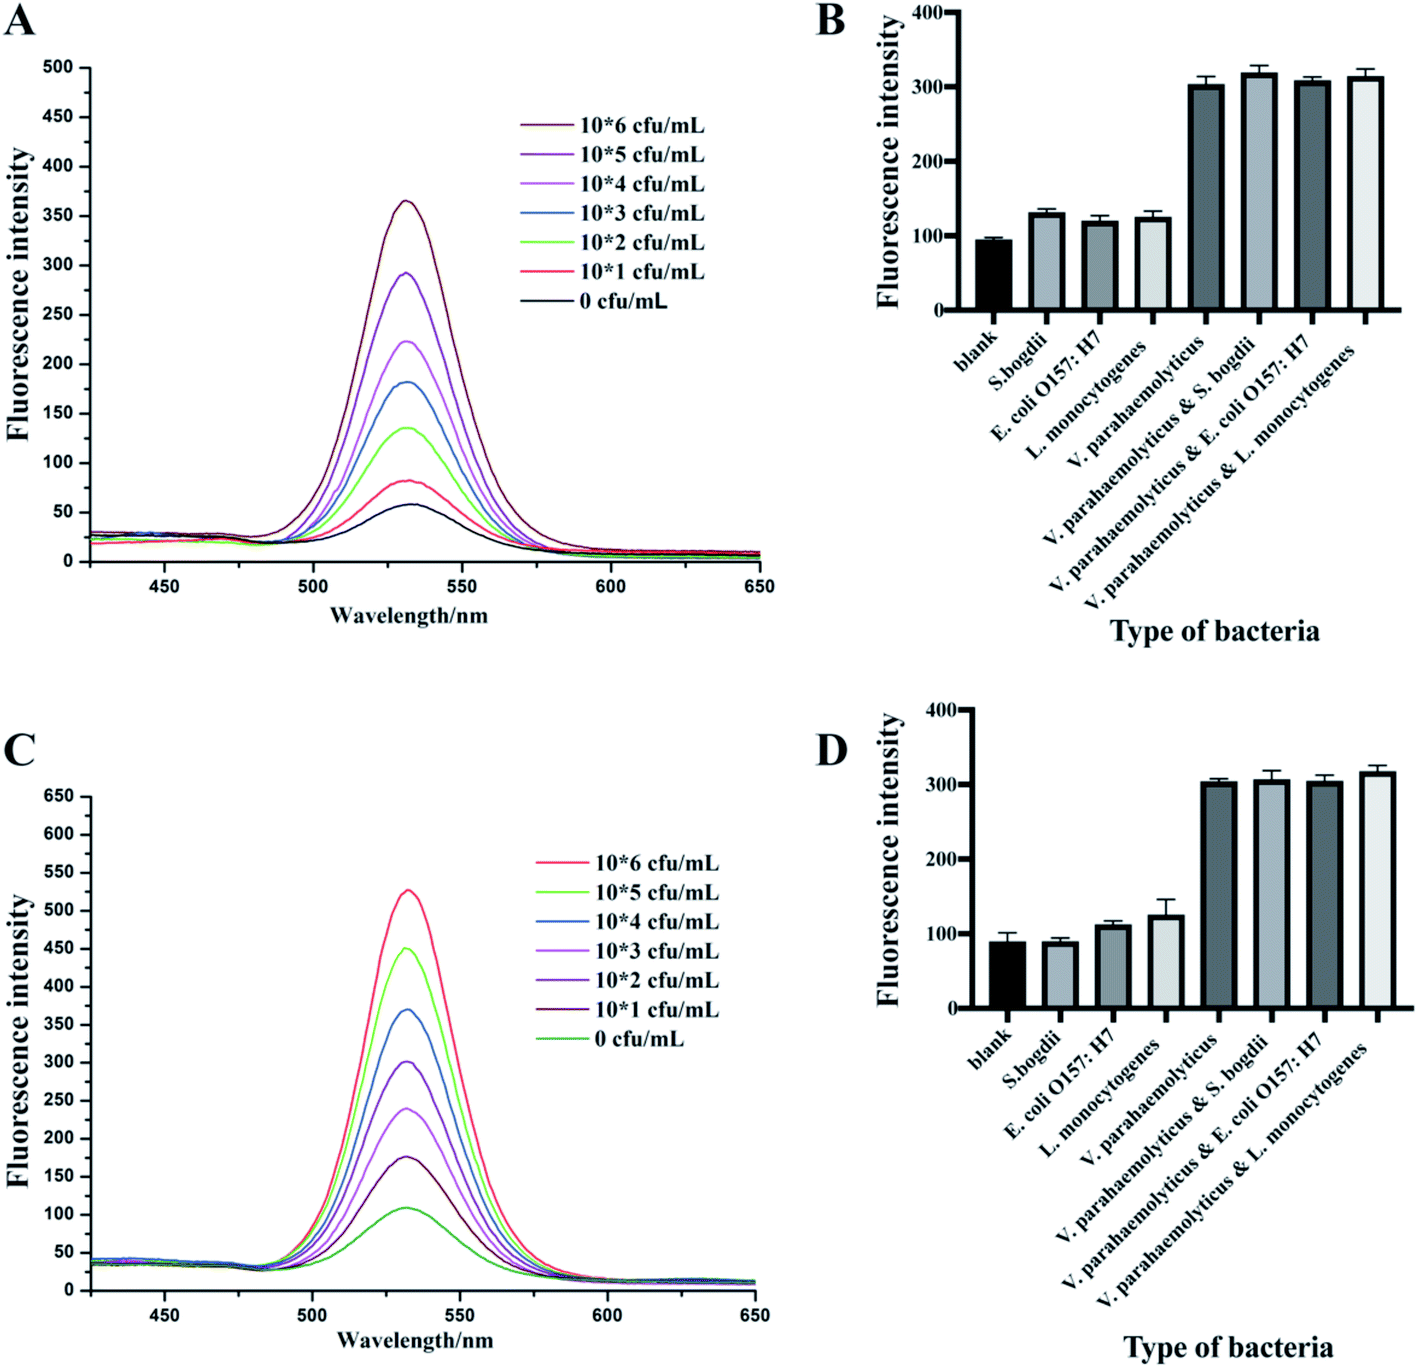 | ||
| Fig. 4 The sensitivity of 1 μm IMBs-QDs group method of V. parahaemolyticus and their plotted linear relationship (P/N ≥ 2.1 indicates positive and the LOD is 102 CFU mL−1) (A). The specificity of 1 μm IMBs-QDs group method (B). The sensitivity of 180 nm IMBs-QDs group method of V. parahaemolyticus and their plotted linear relationship (P/N ≥ 2.1 indicates positive and the LOD is 102 CFU mL−1) (C). The specificity of 1 μm IMBs-QDs group method (D). | ||
In the specificity experiments, we used seven kinds of pathogens including S. bogdii; E. coli O157:H7; L. monocytogenes; V. parahaemolyticus; V. parahaemolyticus & S. bogdii; V. parahaemolyticus & E. coli O157:H7 and V. parahaemolyticus & L. monocytogenes. All bacterial concentrations were at the level of 105 cfu mL−1. In both 1 μm and 180 nm IMBs group, the fluorescence intensity of the group without the target bacteria was significantly lower than that of the group with the target bacteria (V. parahaemolyticus) (Fig. 4B and D). The specificity of this test was due to the specificity of antibodies. Thus, the results indicated that the established methods in this assay have extremely good specificity for V. parahaemolyticus bacteria detection. Repeatability tests were also performed in 1 day and 3 days for both 1 μm 180 nm IMBs group to assess the stability of these methods. The fluorescence intensity and relative standard derivations (RSDs) were described in Table 1. The RSD values were all less than 10% which indicated the detection method had good reproducibility.
| Concentration of bacteria (cfu mL−1) | 1 day | 3 days | |||
|---|---|---|---|---|---|
| Fluorescence intensity | RSD% | Fluorescence intensity | RSD% | ||
| 1 μm IMBs-QDs group | 102 | 142.136 ± 10.741 | 7.56 | 141.81 ± 11.103 | 7.83 |
| 104 | 225.710 ± 12.371 | 5.48 | 232.66 ± 4.731 | 2.03 | |
| 106 | 362.717 ± 14.615 | 4.03 | 360.08 ± 17.049 | 4.73 | |
| 180 nm IMBs-QDs group | 102 | 249.143 ± 15.170 | 6.09 | 235.99 ± 13.050 | 5.53 |
| 104 | 385.320 ± 17.880 | 4.64 | 373.323 ± 10.254 | 2.75 | |
| 106 | 538.280 ± 18.368 | 3.41 | 544.840 ± 21.550 | 3.96 | |
Analyses of real samples
Clam is one of the most common type of seafood infected with V. parahaemolyticus.42,43 So, a range of concentrations from 0 to 106 cfu mL−1 of V. parahaemolyticus bacteria solutions were prepared by adding into clam extracts we prepared. Fig. 5 showed that the sensitivity of 1 μm IMBs-QDs group (A) and 180 nm IMBs-QDs group (B) used in the analog sample test met a detection limit of 102 cfu mL−1, whose fluorescence intensity was more than 2.1 times the negative group's fluorescence intensity. The standard curves for the 1 μm and 180 nm IMBs-QDs group were y = 33.5x + 24.41 (R2 = 0.989) and y = 51.5x + 10.6 (R2 = 0.992). The LOD could reach the limit of Chinese national requirement of 102 cfu mL−1 and was suitable for on-site rapid detection. In some reports, the LOD of food samples was lower than that of standard products, indicating that the method was affected by complex samples and its separation ability was not strong enough.44,45 In the present study, for complex food samples, the LOD we obtained were consistent with those of pure samples, indicating that the separation capacity of IMS was strong enough to separate and capture our target bacteria from food samples. In addition, we prepared three clam extracts and tested whether they infected V. parahaemolyticus before using our method. These samples were all below the detection limit (BDL), indicating that they were not contaminated food samples. Then we performed a recovery test using these clam extracts adding three concentrations of V. parahaemolyticus bacteria solution respectively (Table 2). The small RSDs and high recoveries indicated this method had strong selectivity for quantifying V. parahaemolyticus in complex food matrices.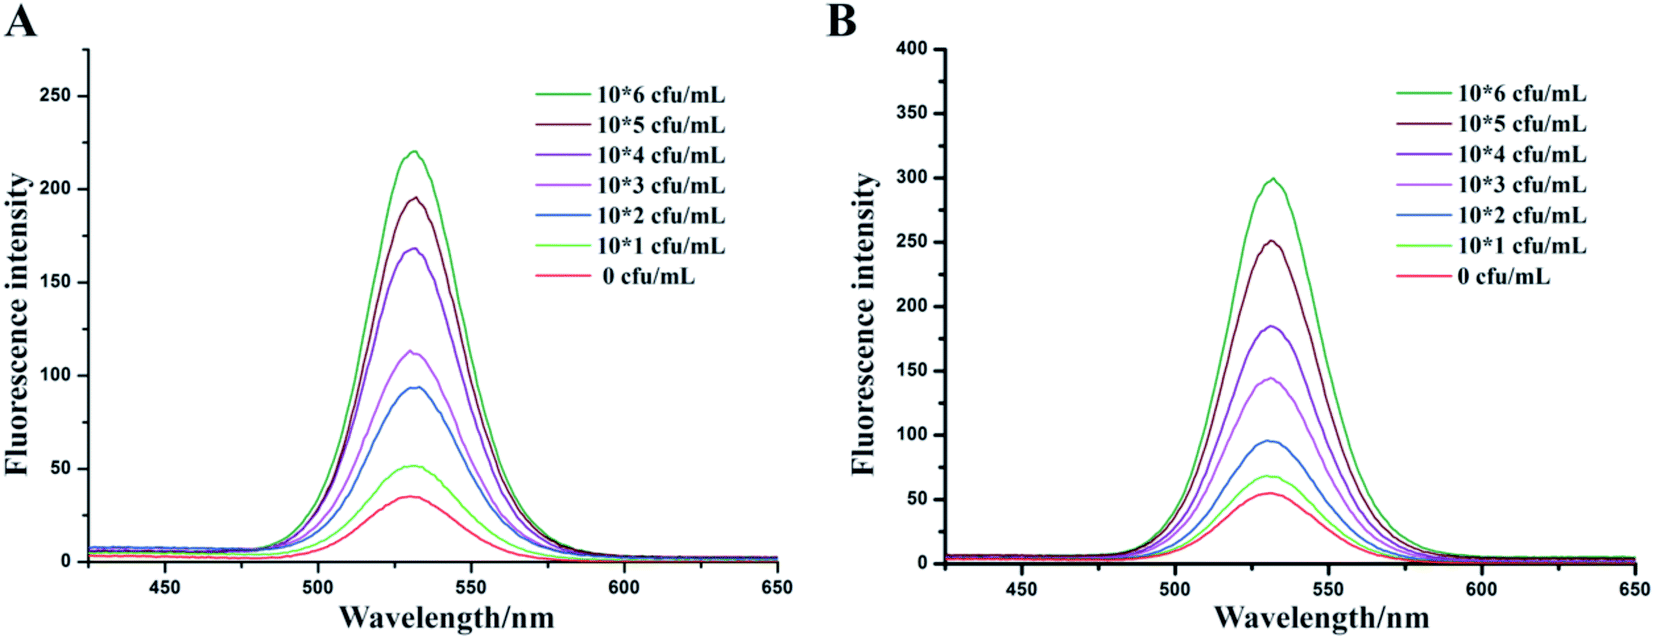 | ||
| Fig. 5 Fluorescence intensity of various concentration of V. parahaemolyticus detection in the simulation sample for 1 μm IMBs-QDs group (A) and 180 nm IMBs-QDs group (B). The LOD could both reach 102 CFU mL−1. | ||
![[x with combining macron]](https://www.rsc.org/images/entities/i_char_0078_0304.gif) ± s, n = 4)
± s, n = 4)
| Samples | Found (cfu mL−1) | Added (cfu mL−1) | Recovered (cfu mL−1) | Recovery (%) | RSD (%) |
|---|---|---|---|---|---|
| clam1 | BDL | 100 | 105.742 ± 6.704 | 105.74 | 6.34 |
| clam2 | BDL | 500 | 503.911 ± 15.520 | 100.789 | 3.08 |
| clam3 | BDL | 1000 | 983.485 ± 27.243 | 98.35 | 2.77 |
Conclusions
In conclusion, we combined the IMBs based separation technology with the QDs based fluorescent labeling technology to establish a sensitive and rapid method for detecting V. parahaemolyticus in samples. The two sizes of IMBs were optimized and compared and they showed no significant difference in both detection time and detection limit. However, when compared with 1 μm MBs, 180 nm MB showed significantly reduced amount of antibody conjugation. Finally, a reliable and robust assay was developed for highly sensitive and selective detection without sophisticated instrument and longtime pre-enrichment. Therefore, we envision that the proposed assay will be widely applicable for rapid detection of V. parahaemolyticus and other foodborne pathogens.Author contributions
Yue Zhai: formal analysis, data curation, writing – original draft; Xiangjun Meng: conceptualization, methodology; Li Li and Juan Wang: resources, software; Yushen Liu: methodology; Kun Xu and Chao Zhao: project administration; Xiuling Song, Juan Li and Minghua Jin: validation, supervision.Conflicts of interest
There are no conflicts to declare.Acknowledgements
This study was funded by the Scientific and Technological Research Project of Jilin Province (Grant number: 20210101365JC, 20200602010ZP), the Development of Education in Jilin Province of China (Grant number: JJKH20211220KJ), the National Natural Science Foundation of China (Grant number: 81872668), Health commission of Jilin Province (2019Q011), Project of industrial independent innovation capacity of Jilin Provincial Development and Reform Commission (2020C038-7), the Bethune Medical Scientific Research Fund Project of Jilin University (Grant number: 2018B20).References
- X. Yang, P. Zhao, Y. Dong, X. Shen, H. Shen, J. Li, G. Jiang, W. Wang, H. Dai, J. Dong, S. Gao and X. Si, J. Food Sci., 2020, 85, 1834–1844 CrossRef CAS.
- K. Makino, K. Oshima, K. Kurokawa, K. Yokoyama, T. Uda, K. Tagomori, Y. Iijima, M. Najima, M. Nakano, A. Yamashita, Y. Kubota, S. Kimura, T. Yasunaga, T. Honda, H. Shinagawa, M. Hattori and T. Iida, Lancet, 2003, 361, 743–749 CrossRef CAS.
- A. V. Rizvi, G. Panicker, M. L. Myers and A. K. Bej, FEMS Microbiol. Lett., 2006, 262, 185–192 CrossRef CAS PubMed.
- C. W. Tan, Y. Rukayadi, H. Hasan, N. A. Abdul-Mutalib, N. N. Jambari, H. Hara, T. Y. Thung, E. Lee and S. Radu, Front. Microbiol., 2021, 12, 616548 CrossRef PubMed.
- K. Chonsin, N. Supha, C. Nakajima, Y. Suzuki and O. Suthienkul, FEMS Microbiol. Lett., 2021, 368, fnaa209 CrossRef CAS PubMed.
- M. Abanto, R. G. Gavilan, C. Baker-Austin, N. Gonzalez-Escalona and J. Martinez-Urtaza, Emerg. Infect. Dis., 2020, 26, 323–326 CrossRef.
- J. Martinez-Urtaza, J. Trinanes, M. Abanto, A. Lozano-Leon, J. Llovo-Taboada, M. Garcia-Campello, A. Pousa, A. Powell, C. Baker-Austin and N. Gonzalez-Escalona, Emerg. Infect. Dis., 2018, 24, 852–859 CrossRef.
- J. Tada, T. Ohashi, N. Nishimura, Y. Shirasaki, H. Ozaki, S. Fukushima, J. Takano, M. Nishibuchi and Y. Takeda, Mol. Cell. Probes, 1992, 6, 477–487 CrossRef CAS.
- B. K. Kumar, P. Raghunath, D. Devegowda, V. K. Deekshit, M. N. Venugopal, I. Karunasagar and I. Karunasagar, Int. J. Food Microbiol., 2011, 145, 244–249 CrossRef CAS PubMed.
- T. Koga, Y. Nakajyo and A. Komoto, Lett. Appl. Microbiol., 1996, 23, 295–298 CrossRef CAS PubMed.
- R. Ben-Yaakov and D. Salomon, Environ. Microbiol., 2019, 21, 2248–2260 CrossRef CAS PubMed.
- D. Wang, F. Lian, S. Yao, Y. Liu, J. Wang, X. Song, L. Ge, Y. Wang, Y. Zhao, J. Zhang, C. Zhao and K. Xu, ACS Omega, 2020, 5, 23070–23080 CrossRef CAS PubMed.
- W. Sun, Y. Zhang, X. Ju, G. Li, H. Gao and Z. Sun, Anal. Chim. Acta, 2012, 752, 39–44 CrossRef CAS.
- H. Di, L. Ye, S. B. Neogi, H. Meng, H. Yan, S. Yamasaki and L. Shi, Biol. Pharm. Bull., 2015, 38, 82–87 CrossRef CAS PubMed.
- Y. Mao, X. Huang, S. Xiong, H. Xu, Z. P. Aguilar and Y. Xiong, Food Control, 2016, 59, 601–608 CrossRef CAS.
- J. Zeng, H. Wei, L. Zhang, X. Liu, H. Zhang, J. Cheng, D. Ma, X. Zhang, P. Fu and L. Liu, Int. J. Food Microbiol., 2014, 174, 123–128 CrossRef CAS PubMed.
- J. Zhou, C. Zhang, X. Zhang, C. Lu, T. Ming, Y. Li and X. Su, Arch. Microbiol., 2020, 202, 1025–1033 CrossRef CAS PubMed.
- H. Li, Z. Li, J. Zhao, B. Tang, Y. Chen, Y. Hu, Z. He and Y. Wang, Nanoscale Res. Lett., 2014, 9, 146 CrossRef.
- P. L. Guo, M. Tang, S. L. Hong, X. Yu, D. W. Pang and Z. L. Zhang, Biosens. Bioelectron., 2015, 74, 628–636 CrossRef CAS PubMed.
- Z. Wang, R. Cai, Z. Gao, Y. Yuan and T. Yue, Compr. Rev. Food Sci. Food Saf., 2020, 19, 3802–3824 CrossRef CAS PubMed.
- J. Lee and R. A. Deininger, Luminescence, 2004, 19, 31–36 CrossRef CAS PubMed.
- L. D. Stewart, N. Tort, P. Meakin, J. M. Argudo, R. Nzuma, N. Reid, R. J. Delahay, R. Ashford, W. I. Montgomery and I. R. Grant, BMC Vet. Res., 2017, 13, 131 CrossRef PubMed.
- L. M. O'Brien, L. D. Stewart, S. A. J. Strain and I. R. Grant, PLoS One, 2016, 11, e0147870 CrossRef.
- M. Bruchez Jr, M. Moronne, P. Gin, S. Weiss and A. P. Alivisatos, Science, 1998, 281, 2013–2016 CrossRef CAS.
- N. I. Chalmers, R. J. Palmer Jr, L. Du-Thumm, R. Sullivan, W. Shi and P. E. Kolenbrander, Appl. Environ. Microbiol., 2007, 73, 630–636 CrossRef CAS.
- H. Yang, L. Qin, Y. Wang, B. Zhang, Z. Liu, H. Ma, J. Lu, X. Huang, D. Shi and Z. Hu, Int. J. Nanomed., 2015, 10, 77–88 Search PubMed.
- H. Kuang, G. Cui, X. Chen, H. Yin, Q. Yong, L. Xu, C. Peng, L. Wang and C. Xu, Int. J. Mol. Sci., 2013, 14, 8603–8610 CrossRef.
- H. Wang, Y. Li, A. Wang and M. Slavik, J. Food Prot., 2011, 74, 2039–2047 CrossRef PubMed.
- C. Wang, J. Qian, K. Wang, K. Wang, Q. Liu, X. Dong, C. Wang and X. Huang, Biosens. Bioelectron., 2015, 68, 783–790 CrossRef CAS.
- Y. Liu, C. Zhao, K. Fu, X. Song, K. Xu, J. Wang and J. Li, Food Control, 2017, 80, 380–387 CrossRef CAS.
- D. Song, X. Qu, Y. Liu, L. Li, D. Yin, J. Li, K. Xu, R. Xie, Y. Zhai, H. Zhang, H. Bao, C. Zhao, J. Wang, X. Song and W. Song, Nanoscale Res. Lett., 2017, 12, 179 CrossRef PubMed.
- A. C. Grodzki and E. Berenstein, in Immunocytochemical methods and protocols, Springer, 2010, pp. 15–26 Search PubMed.
- E. H. Abdel-Rahman, J. K. El-Jakee, M. E. Hatem, N. S. Ata and E. A. Fouad, Vet. World, 2017, 10, 92–100 CrossRef CAS PubMed.
- X. Li, P. He, L. Yu, Q. He, C. Jia, H. Yang, M. Lu, X. Wei and S. Zhao, J. Oral Microbiol., 2020, 12, 1831374 CrossRef CAS PubMed.
- D. Yin, L. Li, X. Song, H. Li, J. Wang, W. Ju, X. Qu, D. Song, Y. Liu, X. Meng, H. Cao, W. Song, R. Meng, J. Liu, J. Li and K. Xu, BMC Infect. Dis., 2016, 16, 219 CrossRef PubMed.
- X. Yang, X. Zhang, Y. Wang, H. Shen, G. Jiang, J. Dong, P. Zhao and S. Gao, Front. Microbiol., 2020, 11, 586981 CrossRef PubMed.
- Y. Zhai, C. Zhao, L. Li, K. Xu, J. Wang, X. Song and H. Li, Food Anal. Methods, 2020, 13, 1906–1917 CrossRef.
- D. Xu, L. Ji, X. Wu, W. Yan and L. Chen, Can. J. Microbiol., 2018, 64, 809–815 CrossRef CAS PubMed.
- K. Cheng, D. Pan, J. Teng, L. Yao, Y. Ye, F. Xue, F. Xia and W. Chen, sensors, 2016, 16, 1600 CrossRef PubMed.
- K. Fu, H. Zhang, Y. Guo, J. Li, H. Nie, X. Song, K. Xu, J. Wang and C. Zhao, RSC Adv., 2020, 10, 14305–14312 RSC.
- Y. Zhang, C.-q. Xu, T. Guo and L. Hong, Sci. Rep., 2018, 8, 1–8 Search PubMed.
- B. Froelich, B. Phippen, P. Fowler, R. Noble and J. Oliver, Appl. Environ. Microbiol., 2017, 83, e02265-16 CrossRef PubMed.
- W.-T. Yu, K.-J. Jong, Y.-R. Lin, S.-e. Tsai, Y. H. Tey and H.-c. Wong, Int. J. Food Microbiol., 2013, 160, 185–192 CrossRef PubMed.
- D. Song, X. Qu, Y. Liu, L. Li, D. Yin, J. Li, K. Xu, R. Xie, Y. Zhai and H. Zhang, Nanoscale Res. Lett., 2017, 12, 1–9 CrossRef CAS PubMed.
- A. Tyagi, V. Saravanan, I. Karunasagar and I. Karunasagar, Int. J. Food Microbiol., 2009, 129, 124–130 CrossRef CAS PubMed.
Footnotes |
| † Electronic supplementary information (ESI) available. See DOI: 10.1039/d1ra07580b |
| ‡ These authors contributed equally to this work. |
| This journal is © The Royal Society of Chemistry 2021 |