 Open Access Article
Boronate-modified polyethyleneimine dendrimer as a solid-phase extraction adsorbent for the analysis of luteolin via HPLC†
Baoyue Zhang‡
a,
Yukui Tong‡a,
Jianghua Heb,
Baodong Sunc,
Feng Zhang *a and
Miaomiao Tian
 *a
*a
aKey Laboratory of Photochemical Biomaterials and Energy Storage Materials, Heilongjiang Province, College of Chemistry and Chemical Engineering, Harbin Normal University, Harbin 150025, P. R. China. E-mail: Zhangfeng@hrbnu.edu.cn; mmttqqq@163.com
bRuyuan Hec Pharm Co., Ltd., Shaoguan 512700, Guangdong Province, P. R. China
cKey Laboratory for Photonic and Electronic Bandgap Materials, Ministry of Education, Harbin Normal University, Harbin, 150025, China
First published on 14th December 2021
Abstract
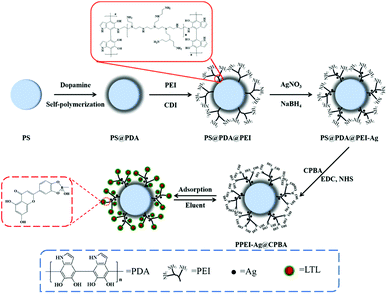
Luteolin (LTL) is a flavonoid containing a cis-diol, which has significant anti-inflammatory, anti-allergic, anti-diabetic, anti-cancer and neuroprotective activities. In this work, a silver modified boric acid affinity polyvinyl imine (PEI) dendritic adsorbent (PPEI-Ag@CPBA) was prepared on polystyrene (PS) for the rapid recognition and selective separation of LTL. A thin layer of polydopamine (PDA) was formed on the surface of the substrate by self-polymerization, and a PDA-coated PS material (PS@PDA) was obtained. PEI with sufficient active amino groups was grafted onto PS@PDA to obtain a PEI-modified material (PS@PDA@PEI), then AgNO3 was reduced with NaBH4, and PS@PDA@PEI was embedded on Ag. Finally, PPEI-Ag@CPBA was obtained through the condensation reaction of PEI with 4-carboxyphenyl boric acid (CPBA). The adsorption conditions were optimized, the optimal pH and the optimum amount of adsorbent were determined, and the maximum adsorption capacity was found to be 2.49 mg g−1. This method has been successfully applied to the selective identification of LTL in peanut shell samples, and provides a practical platform for the detection of LTL in complex substrates.
Introduction
In China, peanuts are one of the main food crops, with an annual yield of more than 5 million tons.1 At present, peanut shells are common agricultural waste in peanut cultivation. In addition to the small amount of peanut shells used as animal feed, most of them are dumped or piled up and burned, causing pollution to the environment.2 There are a lot of useful substances in peanut shells that can be used by people, such as luteolin (LTL). LTL is a typical type of flavonoid containing a cis-diol, which has antiinflammatory, antibacterial, antioxidant and anticancer properties, and other beneficial biological activities, and it plays an important role in human therapy.3–5 Therefore, selective capture and enrichment of LTL in peanut shells is a good strategy. On the other hand, the composition of peanut shells is complex, and the interactions between components are significant, which brings some difficulties to the extraction process.6,7 Thus, it is particularly important to choose an appropriate pretreatment method.In recent years, some common methods for separation and purification of LTL have been reported, such as thin-layer chromatography, resin adsorption, column chromatography, acid precipitation, and so on.8 These methods need to spend a lot of time and money, and the recovery efficiency and purity are not very high, often not selected by the majority of people.9 At present, covalent affinity is of interest among various research groups. Methods of covalent affinity include chemical like hydrazine,10,11 ammonia,12,13 and boric acid.14,15 Boric acid based chemical method has special recognition function for cis-1,2/1,3-diol due to its simple preparation process and low cost.16,17 In recent years, more and more attention has been paid to the research of borate affinity materials.18,19 Boronic acid groups can capture LTL through the reversible covalent reaction, when the surrounding pH is greater than their pKa value. Commonly used boronate affinity ligands are 3-aminophenylboronic acid (APBA), 4-vinylphenylboronic acid (VPBA), and 4-carboxyphenylboronic acid (CPBA). Their structures and the interaction between cis-diol and boric acid groups are shown in ESI (Fig. S1†). LTL is a substance that can be specifically recognized and captured by borate affinity materials. Therefore, the introduction of the boronic acid group into the adsorption process is a reliable guarantee.
In general, the coordination affinity method needs to be combined with solid-phase extraction (SPE) technology. The common combination methods include the chemical bond method, doping method, and physical adsorption method. However, by these methods, boronic acid groups almost concentrate on the surface of the adsorbent, which reduces the maximum adsorption capacity of the adsorbent and affects the adsorption efficiency. Through a large number of studies, researchers found that the introduction of functional polymer graft compounds in chemical bonding can increase the number of modifiable functional groups, to greatly enhance the adsorption capacity and adsorption efficiency of the adsorbent.20–22 Polyethyleneimine (PEI) is a dendritic polymer molecule with modified amino and imino groups in its structure.23,24 PEI has many advantages, such as a flexible polymer chain, low modification cost, and high amino density.25–27 It is expected that the introduction of PEI will greatly change the inefficiency of SPE.
Herein, a novel graft boronate affinity SPE adsorbent (PPEI-Ag@CPBA) was synthesized. In the experiment, polystyrene (PS) microspheres were coated with a polydopamine (PDA) coating for bonded PEI, silver nanoparticles were reduced AgNO3 by sodium borohydride (NaBH4) to increase biocompatibility and dispersibility. Finally, the CPBA with boronic acid groups were modified on the surface of PEI to obtain PPEI-Ag@CPBA. As expected, the hyperbranched boronic components can effectively serve as a recognition site for the cis-diol portion, thereby improving LTL capture capability. The isothermal adsorption model and adsorption kinetics model were studied, and the adsorption conditions were optimized. The excellent reproducibility and significant selectivity make PPEI-Ag@CPBA a promising candidate for LTL selective adsorption.
Experimental
Materials and chemicals
Dopamine hydrochloride (DA), polyvinylpyrrolidone (PVP, Mr = 8000), azobisisobutyronitrile (AIBN), tris(hydroxymethyl)aminomethane (Tris), polyethyleneimine (PEI, Mr = 70![[thin space (1/6-em)]](https://www.rsc.org/images/entities/char_2009.gif) 000), N,N′-carbonyldiimidazole (CDI), 1,6-diaminohexane, LTL were purchased from Macklin Biochemical Co., Ltd (Shanghai, China). AgNO3, NaBH4, CPBA, N-(3-dimethylaminopropyl)-N′-ethylcarbodiimide hydrochloride (EDC), N-hydroxy succinimide (NHS), and hydroquinone (HDQ) were obtained from Aladdin Reagent (Shanghai, China). Quercetin (QRT), p-nitrophenol (P-NP) were purchased from Rhawn Chemical Technology (Shanghai, China). Analytical grade sodium phosphate monobasic dihydrate (NaH2PO4), phosphoric acid (H3PO4), styrene (St), methanol (MeOH), ethanol (EtOH), hydrochloric acid (HCl), and sodium hydroxide (NaOH) were purchased from Beijing Chemical Works (Beijing, China). HPLC grade MeOH was purchased from Fisher Scientific (New Jersey, USA).
000), N,N′-carbonyldiimidazole (CDI), 1,6-diaminohexane, LTL were purchased from Macklin Biochemical Co., Ltd (Shanghai, China). AgNO3, NaBH4, CPBA, N-(3-dimethylaminopropyl)-N′-ethylcarbodiimide hydrochloride (EDC), N-hydroxy succinimide (NHS), and hydroquinone (HDQ) were obtained from Aladdin Reagent (Shanghai, China). Quercetin (QRT), p-nitrophenol (P-NP) were purchased from Rhawn Chemical Technology (Shanghai, China). Analytical grade sodium phosphate monobasic dihydrate (NaH2PO4), phosphoric acid (H3PO4), styrene (St), methanol (MeOH), ethanol (EtOH), hydrochloric acid (HCl), and sodium hydroxide (NaOH) were purchased from Beijing Chemical Works (Beijing, China). HPLC grade MeOH was purchased from Fisher Scientific (New Jersey, USA).
Apparatus
A Millipore Milli-Q water purification system (Millipore, Bedford, MA, USA) was used to purify deionized water (DDW), and the DDW produced at 18.2 MΩ cm were prepared for sample solutions. A Model DOA-P504-BN pump (IDEX, USA) was used. A ZK-82BB electric vacuum drying oven (Shanghai Experimental Instrument Co. Ltd., China) was applied. A KQ-100E ultrasonic cleaner (Kunshan Ultrasonic Instruments Co. Ltd., China) and an LD5-2A centrifuge (Beijing Jingli centrifuge Co. Ltd., China) were utilized for dispersing and centrifuging, respectively. The 79-1 magnetic stirrer (Changzhou Guohua Instruments Co. Ltd, China) was utilized. A PHSF-3F pH meter (Shanghai Precision and Scientific Instrument, Shanghai, China) was applied to measure the pH of solutions. The Fourier transform infrared spectra (FT-IR) instrument was acquired with a Bruker TENSOR II instrument (Bruker, Germany). The nanoparticle morphologies were observed by a scanning electron microscope (SEM, JSM 6700-F) and a transmission electron microscopy (TEM, JSM 2000-F, JEOL Company, Japan). X-ray photoelectron spectra were obtained using an X-ray photoelectron spectroscope (XPS, PHI 5700 ESCA System, USA) with an Al Kα (1486.6 eV) as an X-ray source. The surface charge of the samples in zeta potential and dynamic light scattering (DLS) was carried out using a NanoBrook ZetaPALS zeta potential analyzer (Brookhaven, USA). The X-ray diffraction (XRD) patterns were recorded on a Rigaku R-AXIS RAPID-F X-ray diffractometer (Rigaku Co., Japan) with Cu Kα radiation.Methods
Using an LC-20A HPLC system (Shimadzu, Japan) consisted of an ultraviolet detector (SPD-20A), an auto sample injector (SIL-20A), a liquid delivery pump (LC-20AT), a column oven (CTO-20A), and the LabSolutions workstation (Shimadzu, Japan) for HPLC analysis. A syncronis C18 column (4.6 × 250 mm, 5 μm, Thermoscientific, USA) as the chromatographic separation. The gradient mobile phases using 0.5% H3PO4 in DDW (A) and MeOH (B), filtered by a 0.45 μm millipore filter and a Model DOA-P504-BN pump (IDEX, USA) was applied to degas for 20 min. The ratio of the mobile phase was 1![[thin space (1/6-em)]](https://www.rsc.org/images/entities/char_2009.gif) :
:![[thin space (1/6-em)]](https://www.rsc.org/images/entities/char_2009.gif) 9 (v/v) of pump A to pump B, the column temperature was 35 °C, the flow rate of 1.0 mL min−1, the injection volume of 10 μL, and the detection wavelengths of 360 nm.
9 (v/v) of pump A to pump B, the column temperature was 35 °C, the flow rate of 1.0 mL min−1, the injection volume of 10 μL, and the detection wavelengths of 360 nm.
The next step was to modify multi-CPBA on PEI. 1 mmol CPBA (0.16 g) was dissolved in water with 360 mg EDC and stirred for 15 min to form a preactivated solution. After that, 120 mg NHS was added to the solution and stirred for 15 min to activate the carboxyl group in CPBA. The particles PS@PDA@PEI obtained above were dispersed in solution and stirred for 6 h to obtain the adsorbent of PPEI-Ag@CPBA used in this experiment.
The other three polymers were synthesized in parallel via the same steps as PPEI-Ag@CPBA, including the polymers PS@PDA@PEI, PS@PDA@PEI-Ag, and PPEI@CPBA. Moreover, single-chain boronic acids-functionalized PSC-Ag@CPBA were also prepared by taking place of PEI with 1,6-diaminohexane.
The adsorption capacities of PPEI-Ag@CPBA, PPEI@CPBA, PPEI-Ag, PPEI, and PSC-Ag@CPBA were tested respectively. 50 mg adsorbent was added into 10.0 mL LTL solution (10.0 mg L−1). The mixture was placed in a water bath shaker at 25 °C and oscillated for 45 min. The supernatant was then removed after centrifugation. The solution was filtered with a 0.45 μm millipore filter to remove the suspended insoluble particles. The solution concentration was detected by HPLC. The following experimental method was the same as the previous one.
The adsorption amount (Q, mg g−1) of the adsorbent is calculated according to eqn (1),
 | (1) |
The adsorption kinetics and the isothermal adsorption test are other important indexes to evaluate the adsorption performance of the adsorbent. The adsorption kinetics experiment was used to evaluate the adsorption efficiency through the study of the concentration and the adsorption amount. 50 mg adsorbent were added to 14 centrifuge tubes with a concentration of 10 mg L−1 to investigate the adsorption amount at different concussion times (0.5, 1, 2, 3, 5, 10, 12, 15, 18, 23, 25, 30, 45, 60 min). The isothermal adsorption test was used to evaluate the adsorption model and mechanism by examining the time and adsorption amount. 50 mg of the adsorbent were added to the LTL solution with different concentrations (4, 6, 8, 10, 12, 14, 16 mg L−1) stirred for 45 min. The adsorbent was separated from the solution, and the upper layer was passed through a 0.45 μm filter membrane and detected by HPLC.
The adsorption kinetic models were evaluated by the pseudo-first-order kinetic model and the pseudo-second-order kinetic model. Pseudo-first-order kinetic model and pseudo-second-order kinetic model were calculated according to eqn (2) and (3), respectively.
ln(Q − Qt) = ln![[thin space (1/6-em)]](https://www.rsc.org/images/entities/char_2009.gif) Q − K1t Q − K1t
| (2) |
 | (3) |
| h = K2Q2 | (4) |
 | (5) |
The results of isothermal adsorption were evaluated by the Langmuir isothermal model and the Freundlich isothermal model. Langmuir and Freundlich adsorption isotherms are presented in eqn (6) and (7), respectively.
 | (6) |
 | (7) |
![[thin space (1/6-em)]](https://www.rsc.org/images/entities/char_2009.gif) :
:![[thin space (1/6-em)]](https://www.rsc.org/images/entities/char_2009.gif) 2, v/v) until no LTL residue was detected in the eluent. The above procedure was repeated for 10 times. The reuse rate is represented by eqn (8),
2, v/v) until no LTL residue was detected in the eluent. The above procedure was repeated for 10 times. The reuse rate is represented by eqn (8),
 | (8) |
![[thin space (1/6-em)]](https://www.rsc.org/images/entities/char_2009.gif) :
:![[thin space (1/6-em)]](https://www.rsc.org/images/entities/char_2009.gif) 100 mole ratio was adopted for LTL and three other interfering substances.
100 mole ratio was adopted for LTL and three other interfering substances.Results and discussion
Characterization of PPEI-Ag@CPBA adsorbent
The morphology and structure of the prepared PPEI-Ag@CPBA were characterized by various characterization methods. Fig. 2A–D and E are SEM and TEM images, respectively. It is clear from Fig. 2A that PS is monodisperse and uniform in size. Fig. 2B shows an increase in size and a thin layer, presumably due to the presence of DA. Fig. 2C gradually increases in size, possibly due to the grafting of PEI, and it can be seen that Ag is attached on the surface of the material in Fig. 2D. As can be seen from Fig. 2E, a certain amount of Ag is dispersed and attached around the adsorbent. Fig. 2F shows the DLS test results of the adsorbent materials, the size of the synthesized material is concentrated at about 1 μm. It shows that the preparation of adsorbent material is successful. The zeta potential was also determined to measure the surface charges of the materials (Fig. S2†). The amino groups on the surface makes PS@PDA@PEI positively charged. DA is rich in –OH groups and PEI is rich in amino groups, and PEI modification of PS@PDA results in an increase of zeta potential from −35.41 mV to 30.85 mV, and the zeta potential decreased to 14.89 mV after grafting CPBA.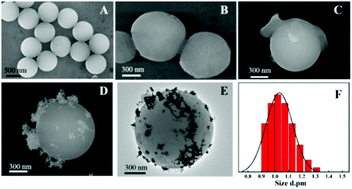 | ||
| Fig. 2 SEM image of PS (A), PS@PDA (B), PS@PDA@PEI (C), and PPEI-Ag@CPBA (D); TEM image of PPEI-Ag@CPBA (E); DLS analysis data of PPEI-Ag@CPBA adsorbent (F). | ||
FT-IR spectra were employed to ascertain the successful synthesis of PPEI-Ag@CPBA material (Fig. 3A). In the spectrum, the peaks at 3025 and 3062 cm−1 are the stretching vibration of C–H bond on benzene ring, and the peaks at 2844 and 2925 cm−1 are caused by tensile vibrations of saturated C–H bonds. In addition, the peaks at 1448 and 1492 cm−1 are from the bending vibration of saturated C–H bond in alkane. The peaks at 3231, 3246, and 3290 cm−1 are assigned to the stretching vibrations of N–H, respectively. The FT-IR spectra of CPBA is shown in Fig. S3.† The significant peak at 1689 cm−1 is possibly assigned to the C![[double bond, length as m-dash]](https://www.rsc.org/images/entities/char_e001.gif) O stretching vibration of carboxyl in CPBA and two new peaks at 1310 and 1380 cm−1 can be assigned to the B–O stretching, indicating that CPBA is successfully bonded in PPEI-Ag@CPBA. Compared with the infrared data of the four products, the adsorbent was successfully synthesized.
O stretching vibration of carboxyl in CPBA and two new peaks at 1310 and 1380 cm−1 can be assigned to the B–O stretching, indicating that CPBA is successfully bonded in PPEI-Ag@CPBA. Compared with the infrared data of the four products, the adsorbent was successfully synthesized.
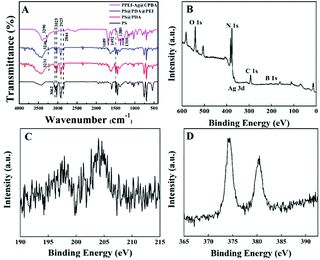 | ||
| Fig. 3 FT-IR spectra of PS, PS@PDA, PS@PDA@PEI, PPEI-Ag@CPBA (A); XPS spectrum of PPEI-Ag@CPBA (B); the peaks of B elements from PPEI-Ag@CPBA (C); the peaks of Ag elements from PPEI-Ag@CPBA (D). | ||
The analysis of the elements contained in the adsorbent is also crucial. Through the analysis of the elements in the adsorbent (Fig. 3B–D), PPEI-Ag@CPBA is mainly composed of O, N, C, B, and Ag elements. B element is derived from CPBA, and Ag element comes from Ag reduced by AgNO3. It can be known that in the synthesis process, every new element added to the synthesis process will be detected, which can also indicate the success of the synthesis of the adsorbent. More detailed XRD analysis results are provided in Fig. S4.† It shows that the crystal structure of Ag modified by CPBA is well maintained.
Optimization of the SPE conditions
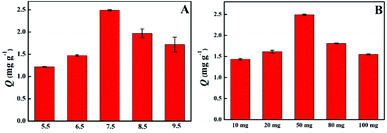
In the boronate affinity ligand, there is a special interaction between the boric acid group and the cis-diol at a particular pH value. Therefore, the adsorption capacity of the material under different pH conditions was evaluated. As can be seen from Fig. 4A, the adsorption capacity first increased and then decreased. LTL is a weakly acidic compound with a negative charge at high pH and boronic acid is of similar properties. At higher and lower pH conditions, the two structures with the same charge are difficult to combine into a relatively stable covalent structure. In the near-neutral condition, boronic acid groups are opposed to the charge carried by LTL, which is easy to combine to obtain a stable covalent structure. Therefore, the LTL solution with a pH of 7.5 was selected for the experiment.Similarly, the amount of adsorbent will also affect the adsorption efficiency of the adsorbent. In the experiment, the adsorption capacity of different adsorbents amount to LTL solution with the same concentration and volume were investigated (Fig. 4B). When the amount of adsorbent increases from 10 mg to 50 mg, the adsorption capacity initially increases and reaches a maximum. Upon further increasing the amount of adsorbent, the adsorption capacity decreases, thus reaching a optimal condition at 50 mg with respect to adsorbent amount. Therefore, the optimal amount of adsorbent used in this experiment is 50 mg.
Adsorption kinetics and isotherm
Using models to explain adsorbent adsorption behavior is an important means to study the adsorbent adsorption process. By measuring the adsorption capacity of LTL at a certain time interval and establishing the adsorption kinetic model, the necessary information of binding rate and binding mechanism can be provided. Fig. S5† indicates the relevant data of adsorption equilibrium time and adsorption kinetics model. Equilibrium adsorption time is a visual display of adsorbent adsorption rate. In Fig. S5A,† at the beginning of the adsorption process (within 10 min), the adsorption amount of LTL by the adsorbent increase sharply. Then, the adsorption amount increases with the increase of time until the equilibrium is reached after 45 min. Therefore, the adsorption time of this experiment is 45 min. Fig. S5B and C† show the pseudo-first-order kinetic adsorption curves and pseudo-second-order kinetic curves of PPEI-Ag@CPBA on LTL, respectively. At the same time, Table S1† illustrates the relevant data used for the analysis of pseudo-first-order dynamics and pseudo-second-order dynamics models, the linear correlation coefficient (R2) of adsorbents to the pseudo-second-order adsorption dynamics model is much larger than that of the pseudo-first-order adsorption dynamics model. The experimental value of equilibrium adsorption amount (Qe) of PPEI-Ag@CPBA is 2.49 mg g−1, which is well agreed with the calculated values from the pseudo-second-order rate equation. Thus, the pseudo-second-order rate model is more suitable to describe the adsorption kinetics data of adsorbents, which means that the adsorption rate model may belong to the chemical adsorption process.30 Due to the high proportion of binding sites for target molecules, PPEI-Ag@CPBA has a higher binding ability, faster adsorption rate, and mass transferability. Besides, the initial adsorption rate h (mg g−1 min−1) and the half-equilibrium time t1/2 (min) based on the pseudo-second-order kinetic model can also be considered.31To quantitatively describe the equilibrium adsorption characteristics, the adsorption isotherm of the adsorbent was performed (Fig. S6†). Langmuir adsorption isotherm model and Freundlich adsorption isothermal model are used to evaluating the adsorption ability. The experimental data are fitted to the two adsorption isothermal models, and the corresponding data are shown in Table S2.† It can be observed that the calculated value of PPEI-Ag@CPBA adsorption is similar to the experimental value, which also indicates that boronic acid groups have excellent adsorption performance. From the correlation coefficient analysis, the fitted degree of the Freundlich model (R2 = 0.996) is higher than that of the Langmuir model (R2 = 0.875), and the updated isotherm shape also conform to this fact, indicate that the material has heterogeneous surface adsorption to LTL.32
Selectivity and competitive experiments
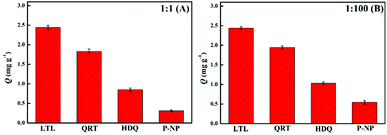
To investigate the selectivity and competitiveness of PPEI-Ag@CPBA for LTL, we consider a structural analogue (QRT) and two other structurally different substances as competitors (HDQ and P-NP). Two different concentration ratios of 1![[thin space (1/6-em)]](https://www.rsc.org/images/entities/char_2009.gif) :
:![[thin space (1/6-em)]](https://www.rsc.org/images/entities/char_2009.gif) 1 (Fig. 5A) and 1
1 (Fig. 5A) and 1![[thin space (1/6-em)]](https://www.rsc.org/images/entities/char_2009.gif) :
:![[thin space (1/6-em)]](https://www.rsc.org/images/entities/char_2009.gif) 100 (Fig. 5B) towards LTL and three interfering substances were applied to study the competitive adsorption capacity of PPEI-Ag@CPBA adsorbent. It can be seen from Fig. 5 that although other substances also have certain adsorption capacity, their adsorption capacity is lower than LTL. Among them, the QRT as a structural analogue of LTL, has higher adsorption capacity than HDQ and P-NP, which is caused by their lack of cis-diol structure. This indicates that the boronic acid group in the adsorbent can capture the cis-diol structure well.
100 (Fig. 5B) towards LTL and three interfering substances were applied to study the competitive adsorption capacity of PPEI-Ag@CPBA adsorbent. It can be seen from Fig. 5 that although other substances also have certain adsorption capacity, their adsorption capacity is lower than LTL. Among them, the QRT as a structural analogue of LTL, has higher adsorption capacity than HDQ and P-NP, which is caused by their lack of cis-diol structure. This indicates that the boronic acid group in the adsorbent can capture the cis-diol structure well.
Reusability experiments
Reusability is a key factor affecting the regeneration ability of adsorbents, so we used MeOH/AA (8![[thin space (1/6-em)]](https://www.rsc.org/images/entities/char_2009.gif) :
:![[thin space (1/6-em)]](https://www.rsc.org/images/entities/char_2009.gif) 2, v/v) to remove LTL to study the reusability of adsorbents. We recycled PPEI-Ag@CPBA 10 times, with a recovery rate of over 95% (Fig. S7†). It shows that the material has good stability and reusability.
2, v/v) to remove LTL to study the reusability of adsorbents. We recycled PPEI-Ag@CPBA 10 times, with a recovery rate of over 95% (Fig. S7†). It shows that the material has good stability and reusability.
Methodological evaluation
In this experiment, LTL was used as the analyte for detection, a good linear range in 0.1–100 mg L−1 with a linearly dependent coefficient (R2) in 0.998 can be found. Limit of detection (LOD, S/N = 3) and limit of quantification (LOQ, S/N = 10) are 0.017 mg mL−1 and 0.057 mg mL−1, respectively (S/N is signal-to-noise). Besides, the RSDs of intra-day and inter-day is lower than 3.7% and 4.8%, respectively.To verify the effect of PEI, Ag, and CPBA on LTL adsorption capacity, PS@PDA@PEI, PS@PDA@PEI-Ag, PPEI@CPBA, and PSC-Ag@CPBA were used as controls (Fig. 6). The adsorption capacity of PS@PDA@PEI and PPEI@CPBA is less than PS@PDA@PEI-Ag and PSC-Ag@CPBA, which may be because Ag plays a certain role. Meanwhile, the adsorption capacity of the single-chain boronate affinity material PSC-Ag@CPBA is smaller than that of PPEI-Ag@CPBA, which may be the reason that PEI can provide polyboric acid sites. The adsorption capacity of CPBA-free materials PS@PDA@PEI and PS@PDA@PEI-Ag is weaker than that of boronate modified materials, which is due to the presence of boronate affinity.
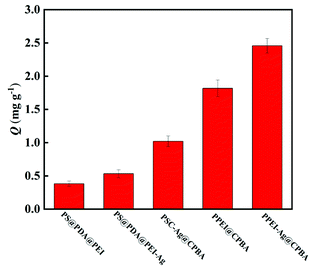 | ||
| Fig. 6 The comparison of maximum adsorption capacity of the PS@PDA@PEI, PS@PDA@PEI-Ag, PSC-Ag@CPBA, PPEI@CPBA and PPEI-Ag@CPBA adsorbents. | ||
At the same time, to show that this analysis method has a good adsorption capacity for LTL, we compared the maximum adsorption capacity obtained in this experiment with the current reported literatures, and the comparison results are shown in Table 1. The results indicate that the maximum adsorption capacity of the adsorbent synthesized in this experiment is higher than that reported in the existing literatures.33–37 Therefore, PPEI-Ag@CPBA is a novel adsorbent for selective extraction of LTL from complex matrices.
| Adsorbent | Detector | Adsorption pH | Desorption solvent | Equilibrium time (min) | Adsorption amount (mg g−1) | Ref. |
|---|---|---|---|---|---|---|
| a Molecularly imprinted polymers.b Polyurethane sponge/graphite oxide/boronic acid functionalized metal–organic framework.c GA-affinity molecularly imprinted polymer adsorbent.d Borate acid-affinity molecularly imprinted polymer nanoparticles. | ||||||
| MIPsa | HPLC | — | MeOH/AA (9![[thin space (1/6-em)]](https://www.rsc.org/images/entities/char_2009.gif) : :![[thin space (1/6-em)]](https://www.rsc.org/images/entities/char_2009.gif) 1, v/v) 1, v/v) |
60 | 1.42 | 33 |
| Macroporous resins AL-2 | HPLC | 5.0 | EtOH/water (8![[thin space (1/6-em)]](https://www.rsc.org/images/entities/char_2009.gif) : :![[thin space (1/6-em)]](https://www.rsc.org/images/entities/char_2009.gif) 2, v/v) 2, v/v) |
240 | 0.34 | 34 |
| Macroporous resins D3520 | 0.32 | |||||
| Macroporous resins D101 | 0.31 | |||||
| Torispherical nanocrystalline cellulose | UV-vis | 6.9 | — | 50 | 0.01 | 35 |
| PU/GO/BA-MOFb | HPLC | — | MeOH/AA (9![[thin space (1/6-em)]](https://www.rsc.org/images/entities/char_2009.gif) : :![[thin space (1/6-em)]](https://www.rsc.org/images/entities/char_2009.gif) 1, v/v) 1, v/v) |
120 | 0.03 | 36 |
| G-MIPsc | HPLC | 7.5 | MeOH/1% AA (9![[thin space (1/6-em)]](https://www.rsc.org/images/entities/char_2009.gif) : :![[thin space (1/6-em)]](https://www.rsc.org/images/entities/char_2009.gif) 1, v/v) 1, v/v) |
30 | 1.24 | 37 |
| B-MIPsd | 1.05 | |||||
| PPEI-Ag@CPBA | HPLC | 7.5 | MeOH/AA (8![[thin space (1/6-em)]](https://www.rsc.org/images/entities/char_2009.gif) : :![[thin space (1/6-em)]](https://www.rsc.org/images/entities/char_2009.gif) 2, v/v) 2, v/v) |
45 | 2.49 | This work |
Analysis of actual sample
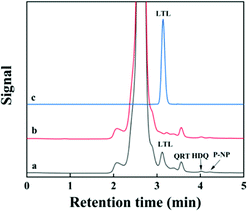
In order to demonstrate the practical application of the adsorbent, the proposed PPEI-Ag@CPBA were used to measure the content of LTL in peanut shell sample. The peanut shell sample was pretreated and analyzed by HPLC, and the results show that the content of LTL in the peanut shell is 8.48 (±0.03) mg g−1. We further analyzed the actual sample of peanut shells extracted by Soxhlet, and added LTL standard solution to the actual sample with three different concentration levels, level 1 (0.5 mg L−1), level 2 (1.0 mg L−1), and level 3 (2.0 mg L−1). The LTL recoveries are 97.3–100.4% with RSD value 3.3–4.5% (n = 3). Compared with the existing literatures, the experimental results are reliable.38 As shown in Fig. 7, the chromatograms of peanut shell samples extracted with PPEI-Ag@CPBA adsorbent and eluted with MeOH/AA (8![[thin space (1/6-em)]](https://www.rsc.org/images/entities/char_2009.gif) :
:![[thin space (1/6-em)]](https://www.rsc.org/images/entities/char_2009.gif) 2, v/v) show that LTL signals increase significantly after the extraction of PPEI-Ag@CPBA, while other structural analogues can hardly be adsorbed. These results indicate good selectivity of PPEI-Ag@CPBA.
2, v/v) show that LTL signals increase significantly after the extraction of PPEI-Ag@CPBA, while other structural analogues can hardly be adsorbed. These results indicate good selectivity of PPEI-Ag@CPBA.
Conclusion
In this study, the Ag-functionalized CPBA based PEI dendritic affinity materials were prepared and LTL was selectively enriched. By combining with HPLC determinations, a fast and efficient method for LTL enrichment was established. The adsorption properties, rebinding equilibrium, kinetics, selectivity, and regeneration of PPEI-Ag@CPBA were investigated. Three significant advantages of PPEIAg@CPBA were noted: (1) the introduction of PEI dendrimers improve the adsorption capacity of adsorbent; (2) boronate affinity-responsive-covalent interaction can provide specific affinity with cis-diol-containing biomolecules; (3) this method can be applied to biological waste peanut shell to efficiently recover the active compound LTL. All in all, PPEI-Ag@CPBA is a promising adsorption material, which provides a new method for the selective enrichment of LTL. This work is also expected to be used for the detection of LTL in other biological samples.Author contributions
Baoyue Zhang: experimental feasibility investigation, writing – original draft. Yukui Tong: data verification and storage. Jianghua He: methodological evaluation. Baodong Sun: formal analysis. Feng Zhang: validation. Miaomiao Tian: experimental conceptualization, writing – review & editing.Conflicts of interest
There are no conflicts to declare.Acknowledgements
The study was financially supported by the National Natural Science Foundation of China (No. 21771047), 2020 scientific research project of basic scientific research business expenses of provincial colleges and universities in Heilongjiang Province (No. 2020-KYYWF-0354), and the Natural Science Foundation of Heilongjiang Province (YQ2021B006).References
- J. T. Yao, Y. Ma, J. X. Liu, S. C. Liu and J. M. Pan, Chem. Eng. J., 2019, 356, 436–444 CrossRef CAS.
- S. L. Zhang, L. C. Tao, Y. L. Zhang, Z. K. Wang, G. J. Guo, M. Jiang, C. P. Huang and Z. W. Zhou, Powder Technol., 2016, 295, 152–160 CrossRef.
- A. D. Capua, R. Adami and E. Reverchon, Ind. Eng. Chem. Res., 2017, 56, 4334–4340 CrossRef.
- D. Gao, D. D. Wang, Q. Zhang, F. Q. Yang, Z. N. Xia, Q. H. Zhang and C. S. Yuan, J. Agric. Food Chem., 2017, 65, 1158–1166 CrossRef CAS PubMed.
- R. S. Jones, M. D. Parker and M. E. Morris, Mol. Pharmaceutics, 2017, 14, 2930–2936 CrossRef CAS PubMed.
- F. J. Osonga, P. Le, D. Luther, L. Sakhaee and O. A. Sadik, Environ. Sci.: Nano, 2018, 5, 917–932 RSC.
- L. C. Lin, Y. F. Pai and T. H. Tsai, J. Agric. Food Chem., 2015, 63, 7700–7706 CrossRef CAS PubMed.
- S. C. Liu, J. X. Liu, J. M. Pan, J. L. Luo, X. H. Niu, T. Zhang and F. X. Qiu, ACS Appl. Mater. Interfaces, 2017, 9, 33191–33202 CrossRef CAS PubMed.
- X. D. Zheng, E. L. Liu, F. S. Zhang, Y. S. Yan and J. M. Pan, Green Chem., 2016, 18, 5031–5040 RSC.
- S. S. Sun, G. L. Yang, T. Wang, Q. Z. Wang, C. Chen and Z. Li, Anal. Bioanal. Chem., 2010, 396, 3071–3078 CrossRef CAS PubMed.
- Q. C. Cao, C. Ma, H. H. Bai, X. Y. Li, H. Yan, Y. Zhao, W. T. Ying and X. H. Qian, Analyst, 2014, 139, 603–609 RSC.
- W. L. Miao, C. Zhang, Y. Cai, Y. Zhang and H. J. Lu, Analyst, 2016, 141, 2435–2440 RSC.
- Y. Zhang, M. Yu, C. Zhang, W. F. Ma, Y. T. Zhang, C. C. Wang and H. J. Lu, Anal. Chem., 2014, 86, 7920–7924 CrossRef CAS PubMed.
- X. D. Wang, G. Chen, P. Zhang and Q. Jia, Anal. Methods, 2021, 13, 1660 RSC.
- X. Y. Hou, W. Huang, Y. K. Tong and M. M. Tian, Microchim. Acta, 2019, 186, 686 CrossRef CAS PubMed.
- N. G. Zhao, Z. Q. Liu, J. P. Xing, Z. Zheng, F. R. Song and S. Liu, Chem. Eng. J., 2020, 383, 123079 CrossRef CAS.
- Q. Jia, Y. Ma, Y. X. Peng, Y. H. Liu and W. L. Zhang, Chem. Eng. J., 2018, 342, 293–303 CrossRef CAS.
- B. Akgun, C. Li, Y. Hao, G. Lambkin, R. Derda and D. G. Hall, J. Am. Chem. Soc., 2017, 139, 14285–14291 CrossRef CAS PubMed.
- L. Li, Y. Lu, Z. J. Bie, H. Y. Chen and Z. Liu, Angew. Chem., 2013, 125, 7599–7602 CrossRef.
- H. W. Zheng, F. Han, H. Lin, L. M. Cao and T. R. Pavase, Food Chem., 2019, 294, 468–476 CrossRef CAS PubMed.
- L. L. Ying, D. Y. Wang, H. P. Yang, X. Y. Deng, C. Peng, C. Zheng, B. Xu, L. Y. Dong, X. Wang, B. Xu, Y. W. Zhang and X. H. Wan, J. Chromatogr. A, 2018, 1544, 23–32 CrossRef CAS.
- J. X. Liu, K. G. Yang, W. Y. Sha, Y. Y. Qu, S. W. Li, Q. Wu, L. H. Zhang and Y. K. Zhang, ACS Appl. Mater. Interfaces, 2016, 8, 9552–9556 CrossRef CAS PubMed.
- S. A. Didas, S. Choi, W. Chaikittisilp and C. W. Jones, Acc. Chem. Res., 2015, 48, 2680–2687 CrossRef CAS PubMed.
- H. Y. Li, X. M. Zhang, L. Zhang, W. H. Cheng, F. Y. Kong, D. H. Fan, L. Li and W. Wang, Anal. Chim. Acta, 2017, 985, 91–100 CrossRef CAS.
- N. Li, J. Chen and Y. P. Shi, Anal. Chim. Acta, 2017, 949, 23–34 CrossRef CAS PubMed.
- R. Y. Zhang, Q. Li, Y. Gao, J. Li, Y. D. Huang, C. Song, W. Q. Zhou, G. H. Ma and Z. G. Su, J. Chromatogr. A, 2014, 1343, 109–118 CrossRef CAS PubMed.
- J. N. Li, F. J. Wang, H. Wan, J. Liu, Z. Y. Liu, K. Cheng and H. F. Zou, J. Chromatogr. A, 2015, 1425, 213–220 CrossRef CAS PubMed.
- Y. Hu, Q. F. Xia, W. Huang, X. Y. Hou and M. M. Tian, Microchim. Acta, 2018, 185, 46 CrossRef PubMed.
- A. Hasanzadeh, B. Gholipour, S. Rostamnia, A. Eftekhari, A. Tanomand, A. K. Valizadeh, S. Khaksar and R. Khalilov, J. Colloid Interface Sci., 2021, 585, 676–683 CrossRef CAS PubMed.
- J. C. Ma, X. Q. Wang, Q. X. Fu, Y. Si, J. Y. Yu and B. Ding, ACS Appl. Mater. Interfaces, 2015, 7, 15658–15666 CrossRef CAS PubMed.
- J. M. Pan, Y. J. Yin, Y. Ma, F. X. Qiu, Y. S. Yan, X. H. Niu, T. Zhang and X. Bai, Chem. Eng. J., 2016, 301, 210–221 CrossRef CAS.
- Z. Guan, X. Y. Tang, T. Nishimura, Y. M. Huang and B. J. Reid, J. Hazard. Mater., 2017, 322, 205–214 CrossRef CAS PubMed.
- D. Gao, F. Q. Yang, Z. N. Xia and Q. H. Zhang, J. Sep. Sci., 2016, 39, 3002–3010 CrossRef CAS PubMed.
- Y. J. Fu, Y. G. Zu, W. Liu, T. Efferth, N. J. Zhang, X. N. Liu and Y. Kon, J. Chromatogr. A, 2006, 1137, 145–152 CrossRef CAS PubMed.
- W. X. Qing, Y. Wang, Y. Y. Wang, D. B. Zhao, X. H. Liu and J. H. Zhu, Appl. Surf. Sci., 2016, 366, 404–409 CrossRef CAS.
- S. C. Liu, J. M. Pan, Y. Ma, F. X. Qiu, X. H. Niu, T. Zhang and L. L. Yang, Chem. Eng. J., 2016, 306, 655–666 CrossRef CAS.
- Y. K. Tong, B. Y. Zhang, B. L. Guo, W. J. Wu, Y. X. Jin, F. Geng and M. M. Tian, J. Chromatogr. A, 2021, 1637, 61829 CrossRef PubMed.
- B. L. Guo, Y. K. Tong, B. Y. Zhang and M. M. Tian, Microchem. J., 2021, 160, 105670 CrossRef CAS.
Footnotes |
| † Electronic supplementary information (ESI) available. See DOI: 10.1039/d1ra07564k |
| ‡ These authors contributed equally in this work. |
| This journal is © The Royal Society of Chemistry 2021 |

