
 Open Access Article
 This Open Access Article is licensed under a Creative Commons Attribution-Non Commercial 3.0 Unported Licence
Phase transition behavior and deformation mechanism of polytetrafluoroethylene under stretching
Cong Luoa,
Jingke Peiab,
Wenyue Zhuoa,
Yanhua Niu *a and
Guangxian Lia
*a and
Guangxian Lia
aCollege of Polymer Science and Engineering, State Key Laboratory of Polymer Materials Engineering of China, Sichuan University, Chengdu 610065, China. E-mail: yhniu@scu.edu.cn; Fax: +86-28-85401841; Tel: +86-28-85401841
bDEC Academy of Science and Technology Co, Ltd, China
First published on 14th December 2021
Abstract
The deformation mechanism and phase transition behavior of polytetrafluoroethylene (PTFE) under stretching conditions (25, 50, 100 °C) were investigated by using differential scanning calorimetry (DSC), small angle X-ray scattering (SAXS), and X-ray diffraction (XRD). Compared to the unstretched PTFE samples, stretching at all temperatures results in a reduced phase transition temperature (IV–I and II–IV). Above a critical strain εH,c (∼0.6), the decrease of phase transition temperature becomes more significant with the increasing strain. At higher stretching temperature, the value of the εH,c becomes smaller. By separating the recoverable (εH,r) and irreversible (εH,i) deformation, a similar εH,c (∼0.6) is found, beyond which the recoverable part remains basically unchanged while the unrecoverable part increases sharply. It is considered that as the strain reaches 0.6, both the untwisting of molecular chain and destroy of the crystal structure could occur, which leads to the increased plastic deformation of the system. Upon the strain is beyond 0.9, the degree of chain untwisting reaches the maximum, and a stable oriented fiber network structure forms, showing the phenomenon of elasticity enhancement. The deformation mechanism of PTFE changes from lamella slip at small strain to stretching induced formation of stable fibrils as evidenced by SEM and SAXS.
Introduction
Polytetrafluoroethylene (PTFE) has been a special engineering plastic for the aerospace, chemical, and pharmaceutical industries due to its excellent mechanical performances, superior heat resistance and chemical inertness, low surface energy, and good dielectric properties. The stretching behavior of PTFE has been extensively investigated, after the first report of its basic mechanical performance parameters by Renfrew in 1946.1 Results indicated that the mechanical properties of PTFE are strongly dependent on temperature,2,3 crystallinity, applied strain and stretching rate.4–7 In many cases, PTFE as artificial organs or sealing washer usually services under cyclic loading or extreme conditions for a long time.8–10 It is of great importance for us to clarify the deformation mechanism, microstructure evolution of PTFE under different stretching conditions.PTFE as a crystalline polymer exhibits complex phase transition behavior because of its simplest chemical structure. Three crystal forms (phase II, phase IV, and phase I) can be observed under normal pressure, and the transition among them could occur between 19 °C and 30 °C (ref. 11–13) that reflects the changes in both short and long range ordering of the polymer chains.14 For example, at 19 °C, the crystal form of PTFE changes from phase II to phase IV under stretching, and the crystal structure changes from ordered triclinic to partially ordered hexagonal with the expansion of the helical conformation between phases II and IV.14–17 At 25 °C, the crystal form of PTFE is phase IV, which transforms into phase I at a higher temperature. Above 30 °C, further rotational disordering and untwisting of the helices occurs indicating that the crystal form changes to phase I.17,18 It has been reported that the deformation and orientation behavior under stretching of PTFE directly correlate with its special crystal phases and their transitions.4,7,19 Besides, Brown20 found that crack propagation in PTFE is also strongly dependent on the brittle-to-ductile transition associating with the two phase transitions at room temperature, and the enhanced fracture toughness is ascribed to the formation of initial fibrils, which bridges the crack planes and enhances the plastic deformation. Obviously, the previous investigations9,21,22 more focused on the role of crystalline phase as an integrity on the fracture and microstructure evolution of PTFE, but the deformation mechanism and phase transition under stretching are somewhat rarely involved due to the various types of crystal form and their complex transition behaviors. In addition, the temperature dependent of the deformation and phase transition of PTFE has never been reported to the best of our knowledge.
In this work, we aim to construct an interrelation among the phase transition temperature, evolution of microstructures, and the deformation under stretching. The temperature dependent deformation and microstructure evolution are particularly emphasized. There exists a critical value of strain (εH,c) at each stretching temperature, which corresponds to formation of the stable oriented fiber network structure. A correlation between the elastic strain (εH,e) and plastic strain (εH,p)23–30 has been constructed by performing cyclic tensile experiments. In the process of stretching, there are obvious fibrillation and elasticity reinforcement phenomena at larger strain above εH,c.
Experimental section
Materials and sample preparation
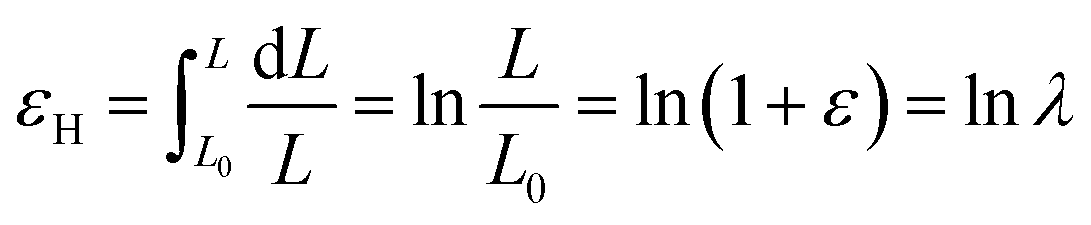
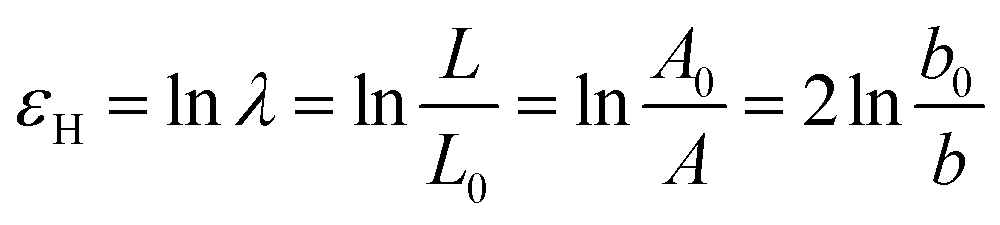
The PTFE raw materials used in this work were all from Jiangsu Meilan Chemical Co., Ltd. Miflon 3214 brand (medium granularity, Tg = 130 °C, Tm = 329 °C). All the tensile samples were dumbbell-shaped splines of the same size cut by a punching machine with a middle length of 10 mm and a width of 5 mm and then kept at 200 °C for 24 h to remove internal stress. All tensile tests were performed on a tensile hot stage (TXT-350 British Linkam Company), and the tensile rates were 500 μm s−1. To better separate the recoverable deformation (εH,e) and irreversible deformation (εH,p), the cyclic tensile measurements were carried out. The samples were stretched step-by-step at a constant speed and returned to the zero stress, then continued to be stretched at this given speed until it reached a larger strain.24,31Actually, the sample is usually non-uniformly deformed under certain stretching conditions. The Hencky strain ε can be used to represent the local strain of polymer during the stretching process. The expression is:
 | (1) |
 | (2) |
DSC measurements
Differential scanning calorimeter (DSC) measurements were carried out with a Q20 and TA Q200 System (American) calibrated by using indium as a standard under N2 atmosphere. For the study of phase transition temperature, the samples were first quenched to −40 °C and kept for 5 min, and then heated to 50 °C at a rate of 10 °C min. For molten samples, it was also first quenched to −40 °C for 5 min and then heated to 350 °C at a rate of 10 °C min.Scanning electron microscope (SEM) observation
The scanning electron microscope (SEM) observation were performed on the JSM-5900LV, JEOL, Japan. The fracture surface was sprayed with gold at a voltage of 10 kV and a current of 10 mA before observation.Small-angle X-ray scattering (SAXS) measurements
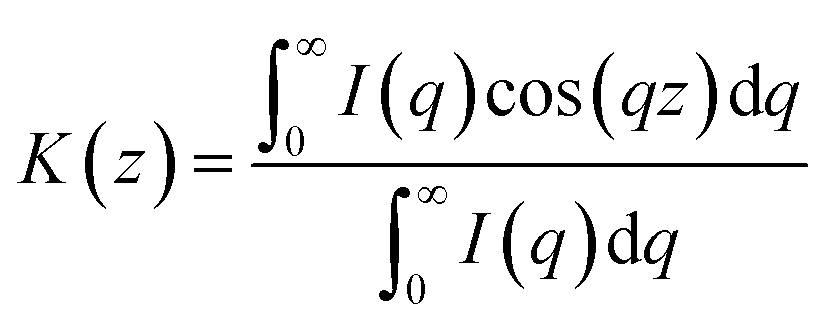
The SAXS experiments were carried out on XENOCS, France. The changes of long period and lamellar thickness for the pre-stretched samples could be calculated. The wavelength of X-ray radiation was 0.154 nm and the sample-to-detector distance was 3070 mm. The pre-stretched samples were prepared by a Linkam TXT 350 stretching hot-stage at different stretching rates. The lamella thickness (l) and the long spacing (lc) are derived from Lorentz correction.31,32 The correlation function K(z) was calculating by inverse Fourier transformation of the experimental intensity distribution I(q) as follows:
 | (3) |
X-ray diffraction (XRD) measurements
To investigate the effect of tensile deformation on the crystal structure of PTFE, XRD measurements (Ultima IV, Rigaku, Japan) were performed. The experimental data was collected between 2θ = 15° and 60° at 2° intervals. A copper target and a high-speed array detector were employed. The tube voltage and current are 20–60 kV and 20–60 mA, respectively.Results and discussion
Fig. 1a shows the true stress–strain curves of PTFE before fracture at a stretching temperature of 25, 50, and 100 °C, respectively, with a stretching rate of 500 μm s−1. All curves could be roughly divided into two stages, namely elastic deformation at small strain, and strain hardening. As the temperature rises, the elastic modulus of PTFE gradually decreases due to the accelerated relaxation of polymer chains. At higher temperature, such as 50 and 100 °C, there is an evident phase transition as the deformation is larger than 60%. This is because the frozen chain segment starts to move with the help of a large external force, thereby presenting a forced high elastic deformation at a high temperature.6 The DSC heating curves of the samples experienced stretching (fractured) at different temperatures are shown in Fig. 1b. Besides the melting point, there are two phase transition temperatures locating at ∼22 °C and ∼30 °C, which correspond to the transformation of II–IV phase and IV–I phase. With increasing stretching temperature, the melting point and crystallinity basically do not change, while the two phase transition peaks coherently shift to lower temperatures. This might be due to the occurrence of the phase transition at different conditions. For the samples stretching at 50 and 100 °C, the phase transitions form in the subsequent cooling process because they could be destroyed at higher temperature, while stretched at 25 °C, the transformation happens directly during the stretching. Thus the slight shift to lower temperature of the phase transition peak with the increased stretching temperature might be explained from the higher degree of untwisting of the polymer chain.33–35 Fig. 1c shows the SEM micrographs of the fractured cross-section under different stretching conditions. As the stretching temperature rises, the oriented structure and even fibrils can be clearly observed. Brown20 et al. considered that fibrils nucleate from a point of stress concentration and form in the principle stress direction. Alternately, Ariawan36 et al. suggest that fibrils are oriented amorphous PTFE formed by unwinding of the crystalline domains. Moreover, fibril formation is an orientation process and provides significant increases in the elastic strength of PTFE.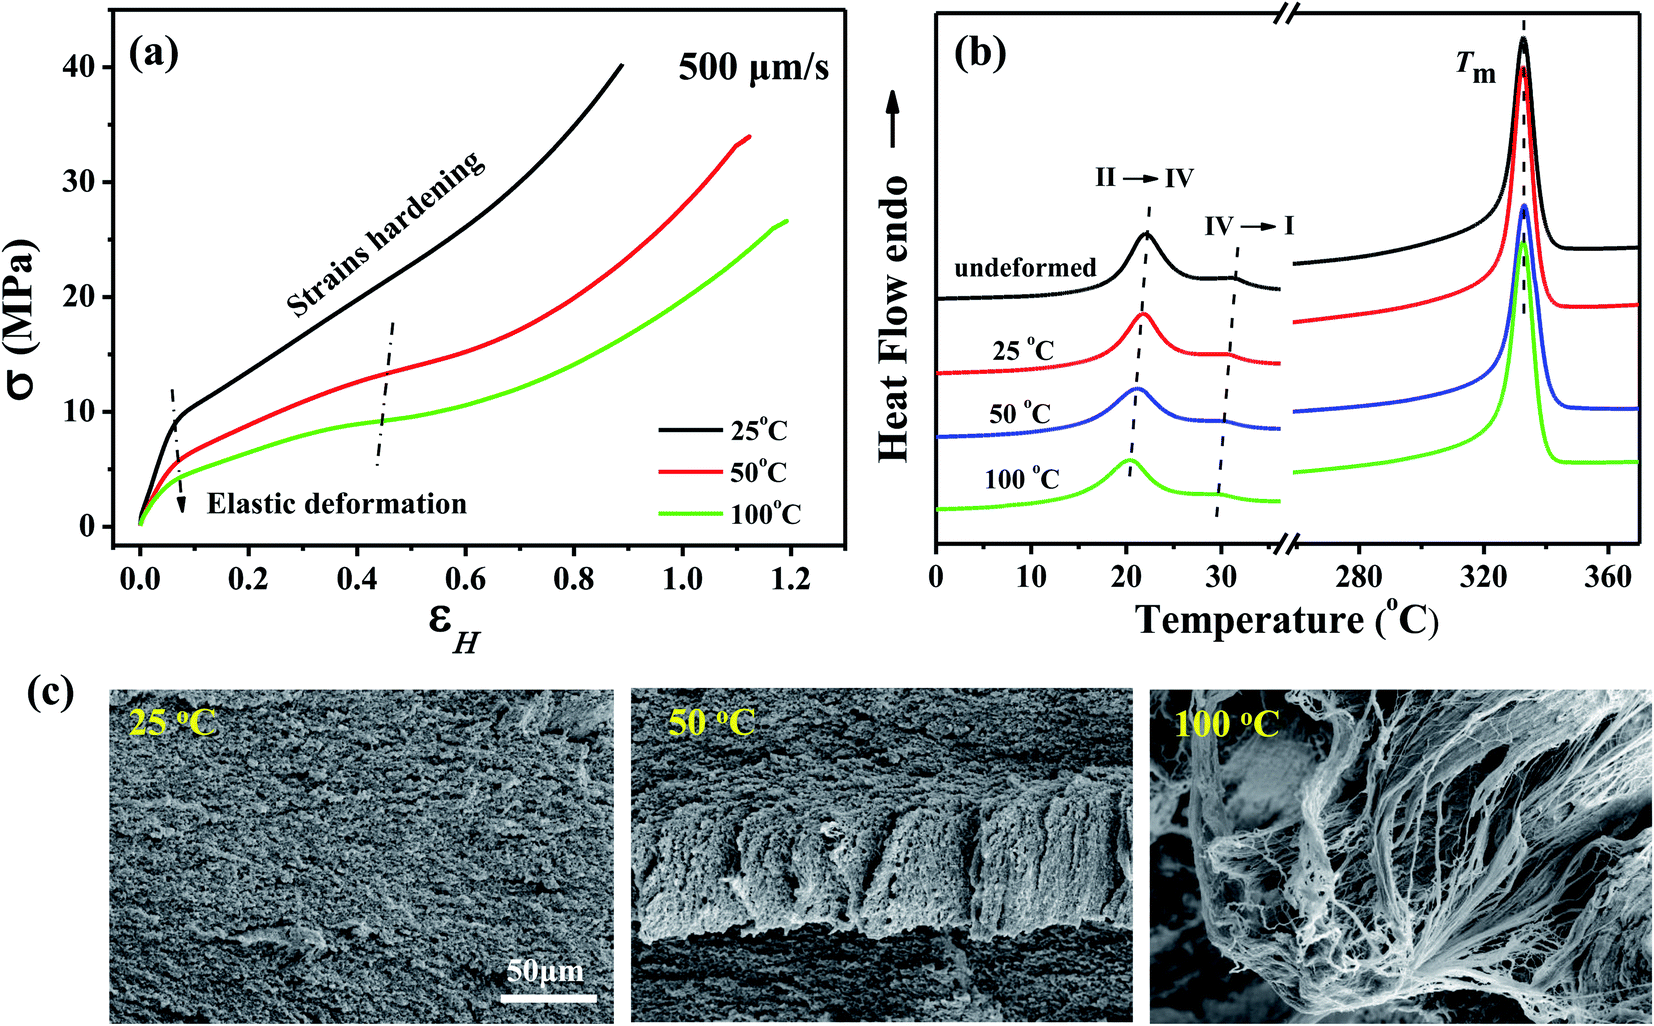 | ||
| Fig. 1 The true stress–strain curves (a), changes in phase transition temperature and melting point (b) and section morphology of PTFE (c) at 25, 50 and 100 °C with a tensile rate of 500 μm s−1. | ||
In order to study the relationship between deformation and phase transition temperature of PTFE in the stretching process, DSC experiments were conducted to detect the phase transformation under cyclic tensile conditions as shown in Fig. 2. One can see that at lower stretching temperature such as 25 °C, both the two phase transitions shift to lower temperatures above a critical value of strain. At higher stretching temperatures, such a critical strain influencing the changes of the phase transition temperature becomes more subtle or even disappears. Comparing with the low temperature transition II–IV at ∼20 °C, the transition of IV–I near 30 °C looks blurred, especially at larger strain. One reason is that the small heat changes of rotational disordering and untwisting of the helices during the transition, and the other reason might be due to the wider scale of the figures. However, as referring to previous publications,14,18 there indeed exists a transition of IV–I phase at 30 °C rather than experimental errors.
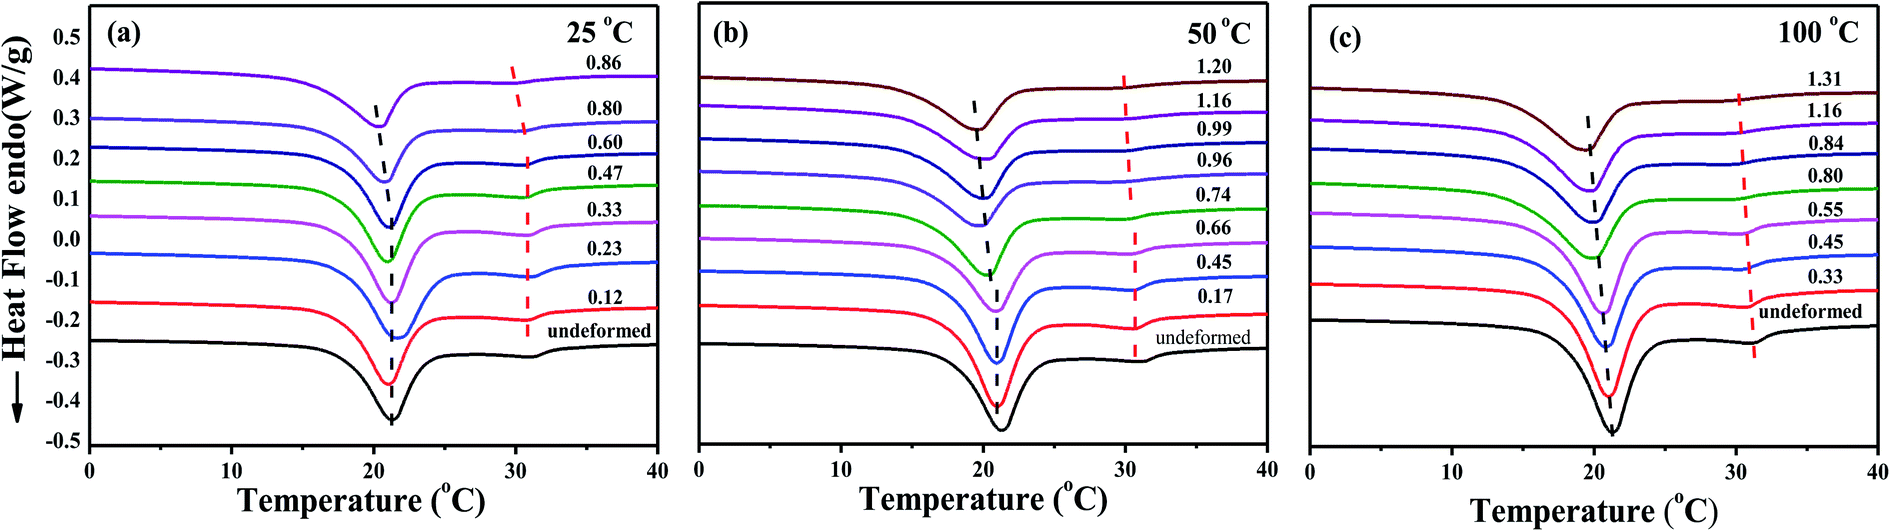 | ||
| Fig. 2 Changes of DSC curves for the PTFE samples experienced cyclic stretching at varying strains under different stretching conditions of 25, 50, 100 °C with a tensile rate of 500 μm s−1. | ||
For clarity, Fig. 3 summarizes the strain dependence of the two phase transition temperatures (II–IV and IV–I) under different stretching conditions. It can be seen that the phase transition temperature of II–IV and IV–I in the small strain region was basically unchanged at 25 °C and 50 °C, and after the strain reached the first critical point of 0.6, the phase transition temperature decreased evidently with increasing strain. As the strain reaches the second critical strain of 0.9, the phase transition temperature in the large strain region remains also unchanged. At higher stretching temperature such as 100 °C, the first critical strain is hardly detectable. Generally speaking, the decrease of the phase transition temperature of PTFE is related to the degree of its helix conformation and the size of lamellar.31 The first critical strain at 100 °C is lower, which is due to the larger free volume and the enhanced molecular chain movement ability at high temperature.36,37 In addition, at higher stretching temperature of 50 and 100 °C, the phase transition temperature of large strain zone no longer changes significantly, indicating that the thickness of PTFE lamellar and the degree of untwisting of the molecular chains reach an equilibrium state. In other words, the lamellar slips into fibers, and the molecular chains were fully extended to form a stable fiber structure.20 And under the action of stress, the fiber network deformed, and the molecular chains and lamellar existed stably. Of course, the temperature scale is very small in Fig. 3 and lack of error bar. This is due to the experimental limits, in which we cannot accurately control the strain for each sample. However, the changes of phase transition of II–IV under different stretching conditions show the similar trend, indicating the reliability of our data.
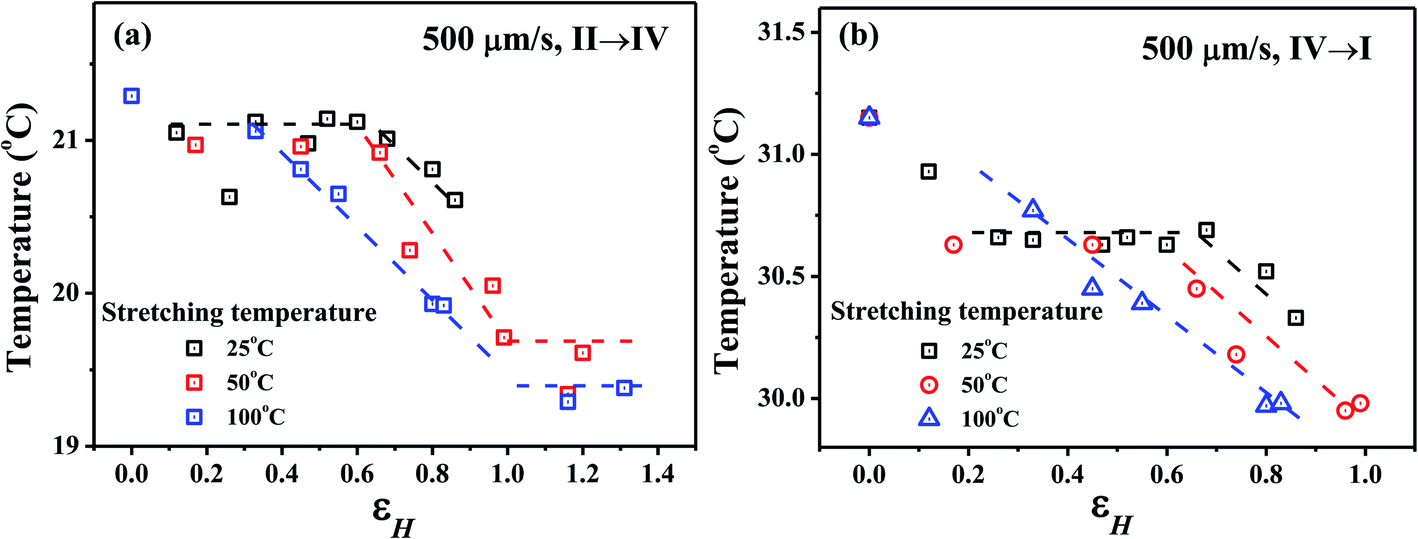 | ||
| Fig. 3 Changes of phase transition temperature II–IV (a) and IV–I (b) with stretching strain for PTFE samples under different conditions of 25, 50, 100 °C with a tensile rate of 500 μm s−1. | ||
To understand the microstructure changes of the samples during stretching, the 2D SAXS diagram of PTFE under different stretching conditions of 25, 50, 100 °C with a tensile rate of 500 μm s−1 are shown in Fig. 4a. At small stretching strain, isotropic scattering patterns are expected,38 with the increasing deformation an isotropic to anisotropic transition occurs for all the samples indicating the gradual formation of oriented structure. Comparing different stretching conditions, the critical transition strain shows a decreasing trend with the increasing temperature indicating the faster orientation at higher temperatures.31 This phenomenon is coincident with the DSC result, indicating the deformation has great influence on the phase transition of PTFE. Based on 1D SAXS data, we calculated the lamellar thickness (lc) as shown in Fig. 4b. Considering the small changes in the crystal structure of each phase and similar densities, the one-dimensional correlation function was used.39 With the increase of strain, the lamella thickness shows a decreasing trend, while at larger strain the decreasing is more significant under higher temperature stretching. There also exists a critical strain near 0.6, beyond which the changes of lc becomes more evident. It is also interesting that there is a crossover point at a strain of ∼0.7 for the corves at different temperatures. This might be due to the exhaustion of the lamella slip capacity. At the same time, the molecular chain is untwisted under the action of stress and the lamellar begin to become fibers, which accelerates the decrease in the size of the lamellar.
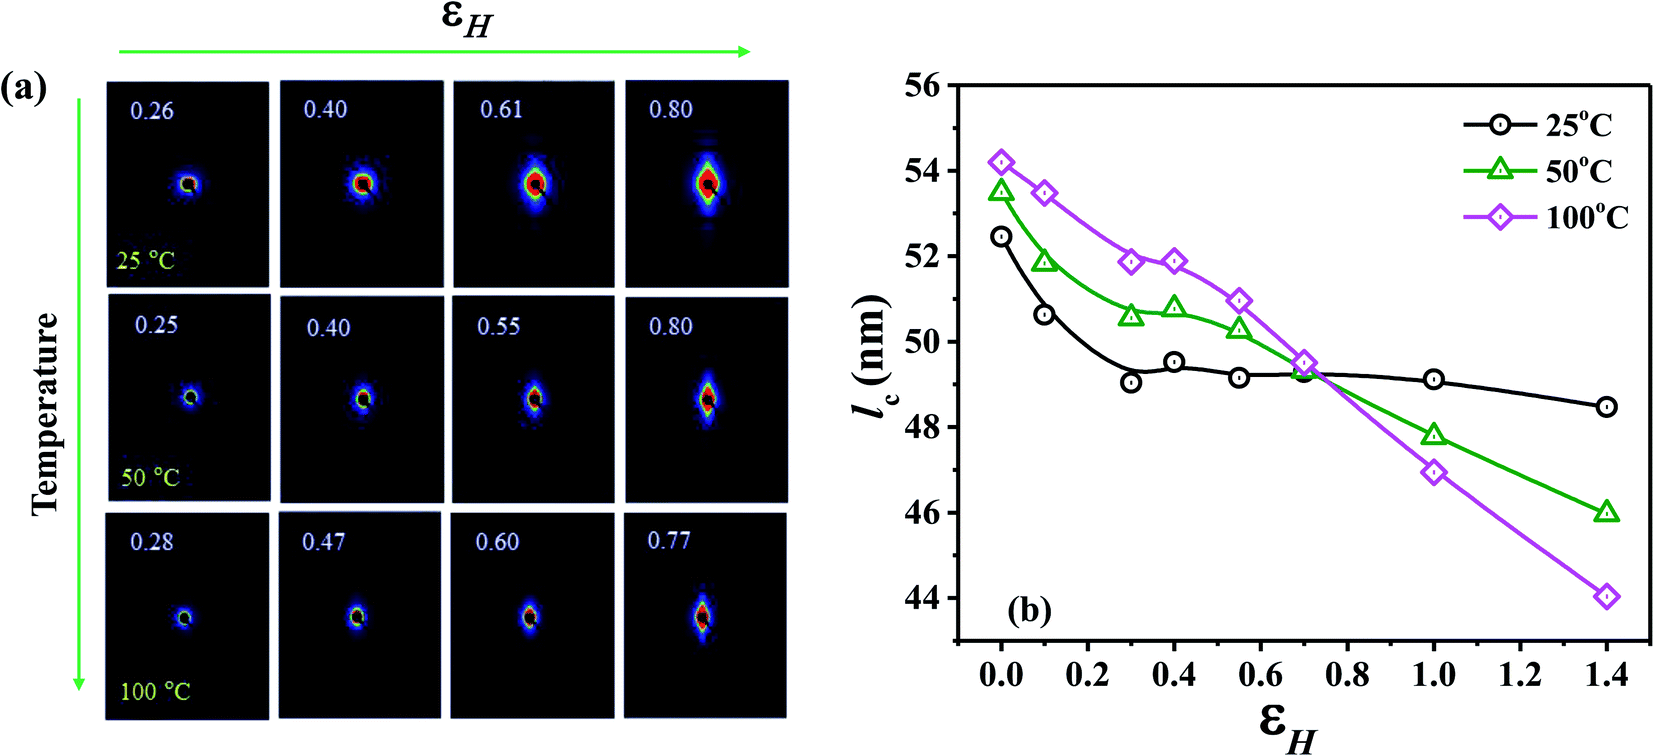 | ||
| Fig. 4 Two-dimensional SAXS diagram (a) and the changes of lamellar thickness (lc) with total strain at different stretching temperatures (b). | ||
In order to further study the changes of crystal structure under deformation, XRD measurement was carried out for the stretched samples and the results are shown in Fig. 5. Noted only the characteristic peaks within the range of 30–50° are selected for qualitative analysis because of the much stronger diffraction of (100) crystal plane near 18°. The (107), (108) and (117) peaks corresponds to phase II and IV, and (200), (210) peaks are assigned to phase I. From Fig. 5, we can see that the (107) and (108) peaks disappear at the strain of ∼0.6 under the condition of 25 and 50 °C, while for the higher stretching temperature of 100 °C, the disappearance of these two peaks occurs at a smaller strain of ∼0.3. This indicates that the destruction of the crystal structure is easier at higher stretching temperature. Furthermore, the enhancement of (210) peaks is more obvious with the increasing strain at 100 °C,21,35 which might be due to the easier transformation from phase IV to phase I. The above phenomena are consistent with the results of DSC and SAXS.
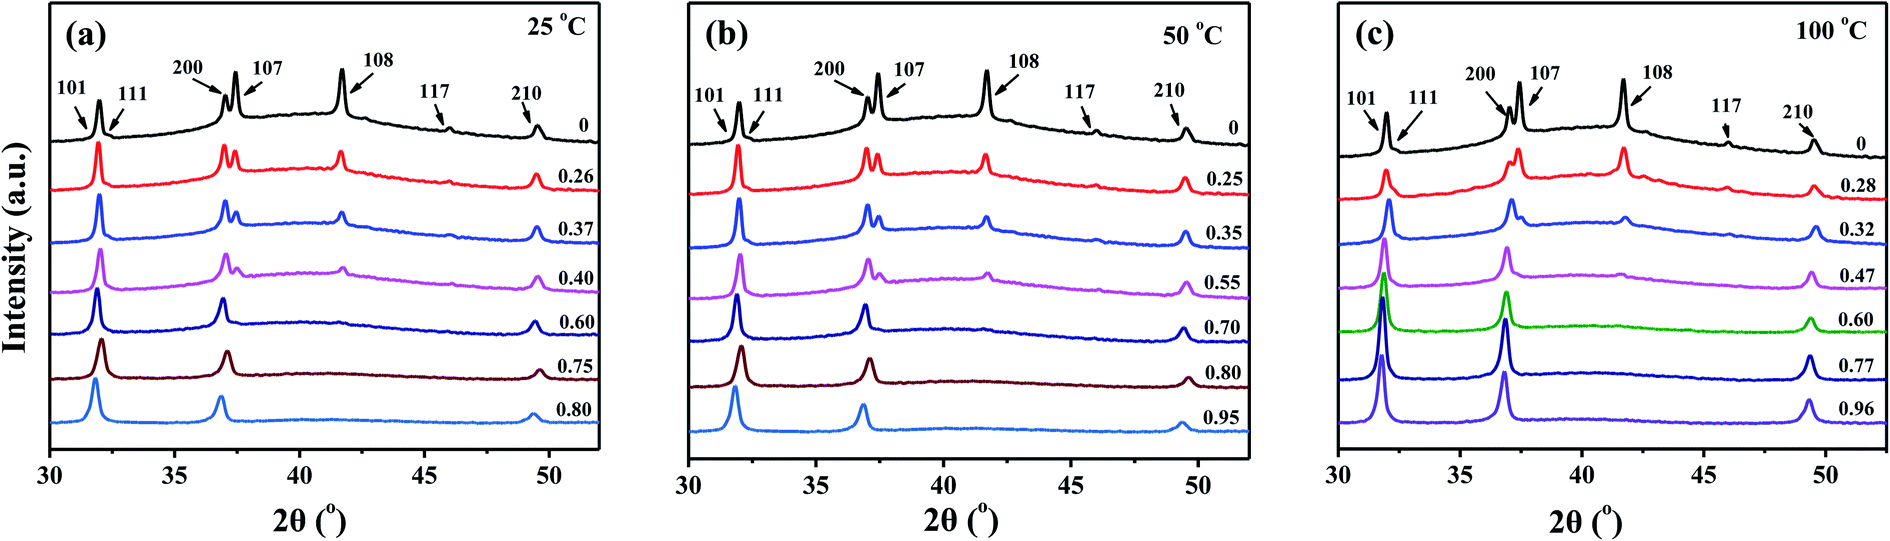 | ||
| Fig. 5 Changes of crystal plane with increasing strain for PTFE samples stretched at 25, 50 and 100 °C with a tensile rate of 500 μm s−1. | ||
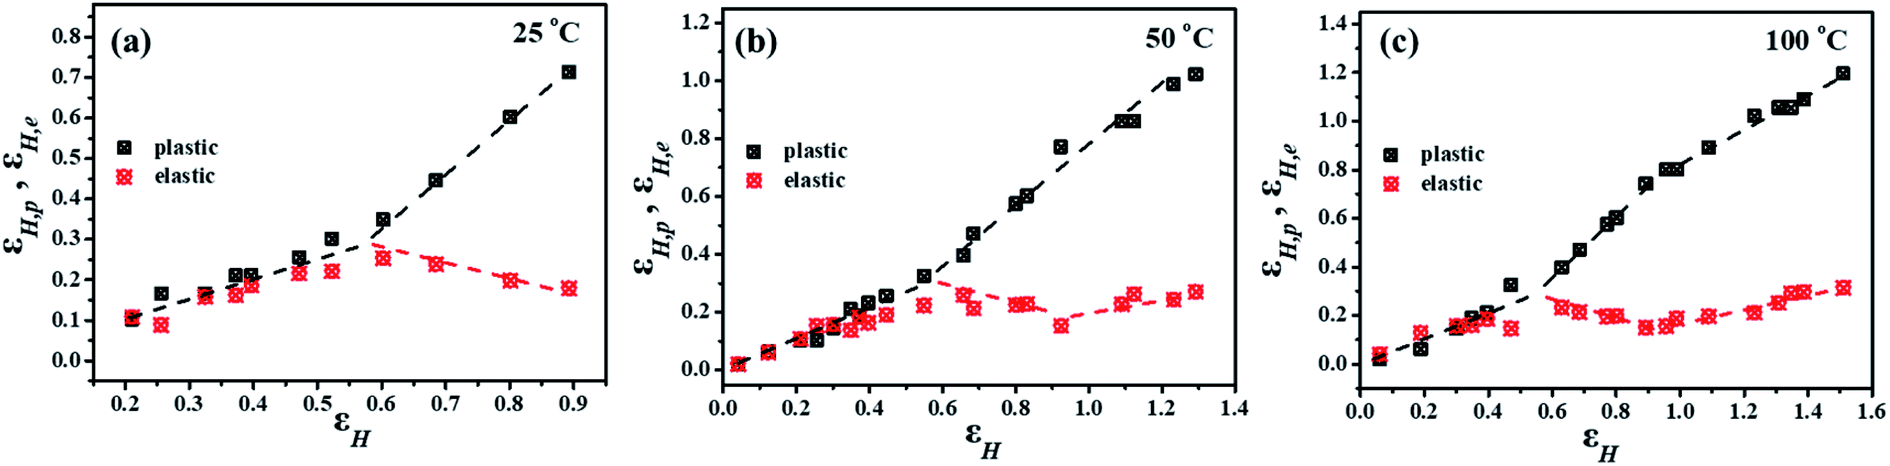
The cyclic stretching experiments for PTFE samples at different temperature are carried out in order to investigate the elastic and plastic deformation.24,31 The relationship between elastic strain (εH,e), plastic strain (εH,p) and total strain (εH,c) during cyclic stretching is shown in Fig. 6. We can see that the elastic strain and plastic strain increase simultaneously in the small strain zone. When the total strain increases to the first critical strain, the elastic strain begins to decrease. At this point, the slippage of the lamellar ends, and the molecular chains are untwisted and oriented, which correspondingly causes the plastic strain increases sharply. When the strain was greater than 0.9 at the higher stretching temperature (50, 100 °C), the elastic strain reminded constant, indicating the elasticity reinforcement occurs in the last stage of stretching.31
 | ||
| Fig. 6 Changes of plastic strain (εH,p) and elastic strain (εH,e) with increasing total strain (εH,c) at different temperatures with a tensile rate of 500 μm s−1. | ||
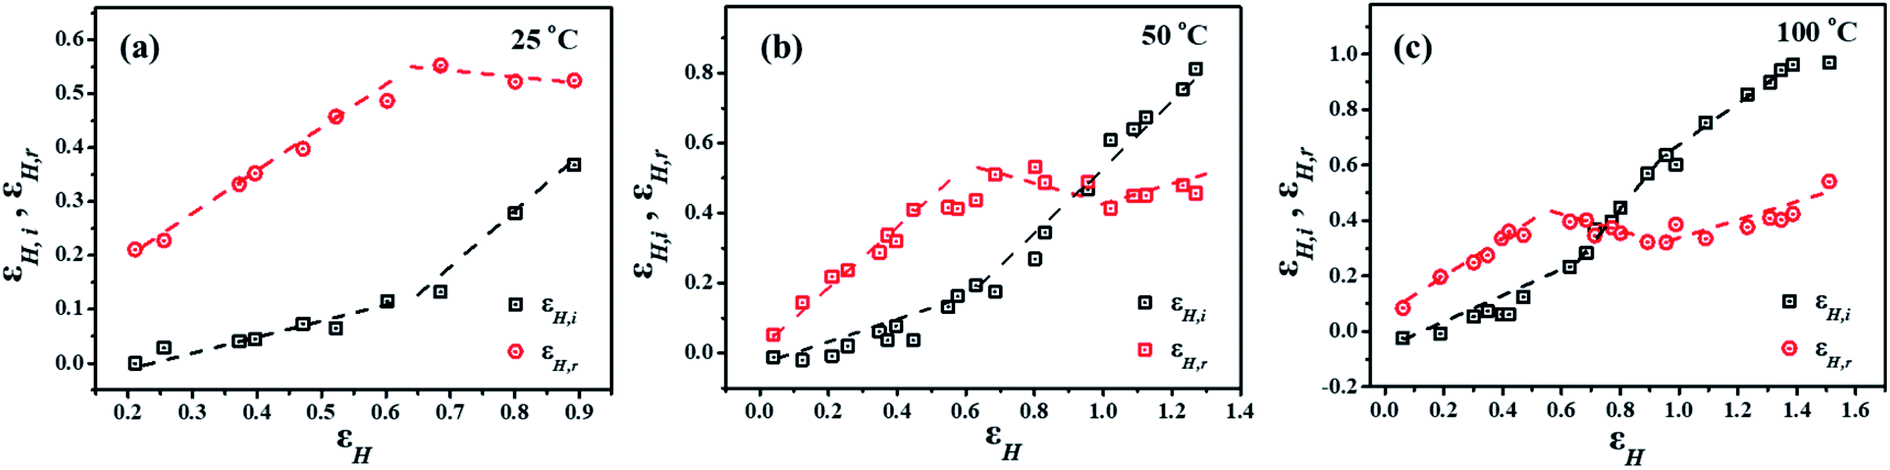
In order to separate the irreversible plastic deformation εH,i and reversible deformation εH,r, the stretched samples were heated above the melting point of PTFE and then cooled down to measure the reversible deformation.23–30 As shown in Fig. 7, both the εH,i and εH,r increase gradually at the beginning of stretching, while above a critical strain the reversible deformation remains constant and the irreversible part continuously increases. This indicates that irreversible deformation is induced by the slippage of lamella20 and the recoverable deformation is ascribed to the uncoiling of molecular chain. The recoverability of the sample increased at strain larger than 0.9 due to reinforcement of fibrils.40 In Fig. 8, we have compared the changes of phase transition temperature and the reversible deformation with the total strain. One can see that there exists two similar critical strains (0.6 and 0.9) for both the phase transition and the reversible deformation. Based on the results, it seems that the phase transition and deformation of PTFE correlate closely with each other and might be driven by the same mechanism, which has never been reported and need further investigation.
 | ||
| Fig. 7 Changes of permanent strain (εH,i) and recoverable strain (εH,r) with increasing total strain (εH,c) at different temperatures with a tensile rate of 500 μm s−1. | ||
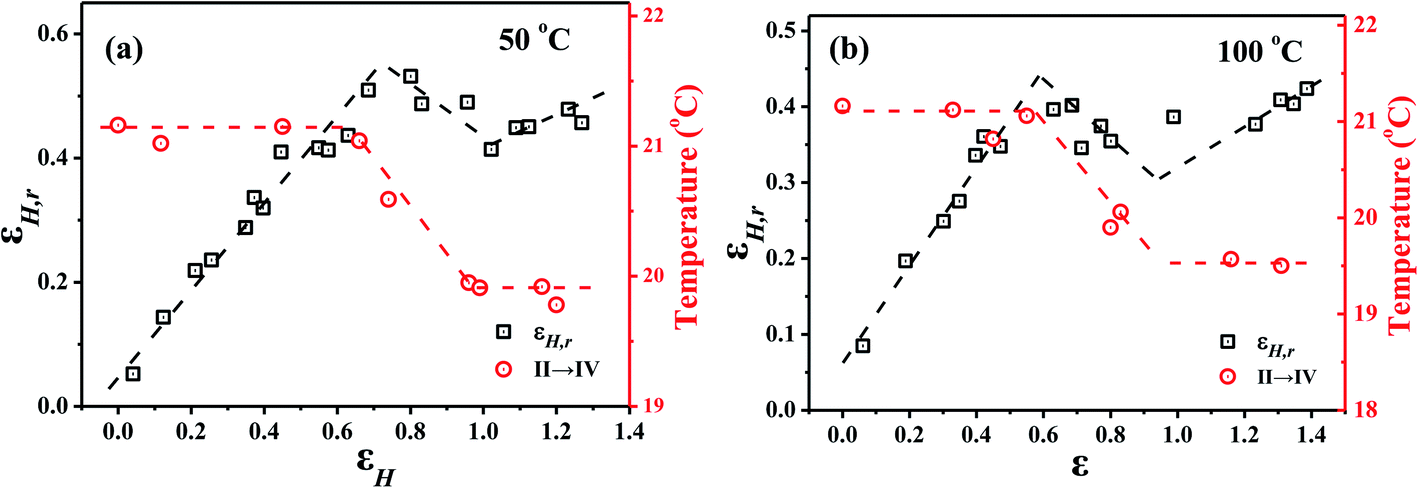 | ||
| Fig. 8 The correspondence between phase transition temperature change and recoverable deformation at the stretching temperature of 50 °C and 100 °C. | ||
Conclusions
A series of stretching deformation experiments were performed to clarify the phase transition behavior under different stretching conditions. After PTFE was stretched, the phase transition temperature of IV–I and II–IV decreased. The II–IV phase transition temperature had a critical strain point with the change of strain while the value of εH,c becomes smaller at higher temperature. Since the free volume is larger and the mobility of the molecular chain is enhanced, which could cause the phase transition temperature dropping at a low strain at a stretching temperature of 100 °C. By separating the recoverable (εH,r) and irreversible (εH,i) deformation, a similar εc is found, beyond which the recoverable part remains basically unchanged while the unrecoverable part increases sharply. It is considered that as the strain reaches 0.6, both the untwisting of molecular chain and destroy of the crystal structure could occur, which leads to the increased plastic deformation of the system. Upon the strain is beyond 0.9, the degree of chain untwisting reaches the maximum, and a stable oriented fiber network structure forms, showing the phenomenon of elasticity enhancement.Conflicts of interest
There are no conflicts to declare.Acknowledgements
We acknowledges the financial supports from the National Natural Science Foundation of China with grant numbers 51873125, 52073184, 51721091 and Research Foundation (International Program) of Science and Technology Department of Sichuan Province with grant number 2019YFH0027.References
- M. M. Renfrew and E. E. Lewis, Polytetrafluoroethylene; heat-resistant, chemically inert plastic, Ind. Eng. Chem., 1946, 38(9), 870–877 CrossRef CAS.
- R. C. Doban, C. A. Sperati and B. W. Sandt, The physical properties of 'teflon', polytetrafluoroethylene, Soc. Plast. J., 1955, 11, 17–21 CAS.
- P. E. Thomas, J. F. Londz, C. A. Sperati and J. L. McPherson, Effects on fabrication on the properties of teflon resins, Soc. Plast. J., 1956, 12, 89–95 Search PubMed.
- B. Norman and F. P. Mark, et al., Effect of liquid nitrogen on the tensile strength of polyethylene and polytetrafluoroethylene, J. Polym. Sci., Part B: Polym. Lett., 1972, 10(10), 777–779 Search PubMed.
- S. Fischer and N. Brown, Deformation of polytetrafluoroethylene from 78 to 298 k and the effect of environmental crazing, J. Appl. Phys., 1973, 44(10), 4322–4327 CrossRef CAS.
- J. Joyce, Fracture toughness evaluation of polytetrafluoroethylene, Polym. Eng. Sci., 2003, 43, 1702–1714 CrossRef CAS.
- P. J. Rae and E. N. Brown, The properties of poly(tetrafluoroethylene) (PTFE) in tension, Polymer, 2005, 46, 8128–8140 CrossRef CAS.
- E. S. Leibner, Jet Blown PTFE for Control of Biocompatibility, Dissertations & Theses Gradworks, PhD thesis, The Pennsylvania State University, 2009, Publication Number: AAT 3480768, ISBN: 9781124959627, Source: Dissertation Abstracts International, Volume: 73-01, Section: B, page: 0301, p. 163.
- S. B. Yang, X. X. Pu, Z. Y. Huang and Q. Y. Wang, et al., Crystalline phase transformation of polytetrafluoroethylene in a fatigue test, J. Appl. Polym. Sci., 2015, 131(22), 41113 Search PubMed.
- A. D. Resnyansky, N. K. Bourne and E. N. Brown, et al., Phase transition modeling of polytetrafluoroethylene during Taylor impact, J. Appl. Phys., 2014, 116(22), 223502 CrossRef.
- C. W. Bunn and E. R. Howells, Structures of Molecules and Crystals of Fluoro-Carbons, Nature, 1954, 174(4429), 549–551 CrossRef CAS.
- E. S. Clark, The molecular conformations of polytetrafluoroethylene: forms II and IV, Polymer, 1999, 40(16), 4659–4665 CrossRef CAS.
- C. K. Wu and M. Nicol, Chem. Phys. Lett., 1973, 21(1), 153–157 CrossRef CAS.
- C. A. Sperati and H. W. Starkweather, Fluorine-containing polymers. II. Polytetrafluoroethylene, Fortschr. Hochpolym.-Forsch., 1961, 2(4), 465–495 CrossRef CAS.
- C. W. Bunn, A. J. Cobbold and R. P. Palmer, The fine structure of polytetrafluoroethylene, J. Polym. Sci., Part A: Polym. Chem., 2010, 28(117), 365–376 Search PubMed.
- C. A. Sperati, Physical constants of poly(tetrafluoroethylene), Polymer Handbook, 1975, pp. V29–V36 Search PubMed.
- J. J. Weeks, I. C. Sanchez and R. K. Eby, et al., Order–disorder transitions in polytetrafluoroethylene, Polymer, 1980, 21(3), 325–331 CrossRef CAS.
- H. A. Rigby and C. W. Bunn, Nature, 1949, 164, 583 CrossRef CAS.
- S. M. Wecker, Preferred orientation of crystallites in uniaxially deformed polytetrafluoroethylene, J. Appl. Phys., 1972, 43(11), 4344–4348 CrossRef CAS.
- E. N. Brown and D. M. Dattelbaum, The role of crystalline phase on fracture and microstructure evolution of polytetrafluoroethylene (PTFE), Polymer, 2005, 46(9), 3056–3068 CrossRef CAS.
- E. N. Brown, P. J. Rae and D. M. Dattelbaum, et al., In situ Measurement of Crystalline Lattice Strains in Polytetrafluoroethylene, Exp. Mech., 2008, 48(1), 119–131 CrossRef CAS.
- C. A. Sperati, Polytetrafluoroethylene: History of its Development and Some Recent Advances, Springer, Netherlands, 1986 Search PubMed.
- M. Al-Hussein and G. Strobl, Strain-Controlled Tensile Deformation Behavior of Isotactic Poly(1-butene) and Its Ethylene Copolymers, Macromol. Symp., 2004, 214(22), 8515–8520 Search PubMed.
- R. Hiss, S. Hobeika and C. Lynn, et al., Network Stretching, Slip Processes, and Fragmentation of Crystallites during Uniaxial Drawing of Polyethylene and Related Copolymers. A Comparative Study, Macromolecules, 1999, 32(13), 4390–4403 CrossRef CAS.
- K. Hong, A. Rastogi and G. Strobl, A Model Treating Tensile Deformation of Semicrystalline Polymers: Quasi-Static StressStrain Relationship and Viscous Stress Determined for a Sample of Polyethylene, Macromolecules, 2004, 37(26), 10165–10173 CrossRef CAS.
- K. Hong and G. Strobl, Network Stretching during Tensile Drawing of Polyethylene: A Study Using X -rayScattering and Microscopy, Macromolecules, 2006 Search PubMed.
- Y. Men, J. Rieger and G. Strobl, Role of the Entangled Amorphous Network in Tensile Deformation of Semicrystalline Polymers, Phys. Rev. Lett., 2003, 91(9), 095502 CrossRef PubMed.
- Y. Men and G. Strobl, Critical strains determining the yield behavior of s-PP*, J. Macromol. Sci., Part B: Phys., 2001, 40(5), 775–796 CrossRef.
- Y. Men and G. Strobl, Critical strains in poly(ε-caprolactone) and blends with poly(vinyl methyl ether) and poly(styrene-co-acrylonitrile), Macromolecules, 2003, 36(6), 1889–1898 CrossRef CAS.
- A. Tawansi, A. H. Oraby and S. I. Badr, et al., Effect of CuCl2 and CoCl2 mixed fillers on the physical properties of polyvinylidene fluoride films, J. Mater. Sci.: Mater. Electron., 2003, 14(3), 135–141 CrossRef CAS.
- J. Zhao, Y. Sun and Y. Men, Elasticity Reinforcement in Propylene–Ethylene Random Copolymer Stretched at Elevated Temperature in Large Deformation Regime, Macromolecules, 2016, 49(2), 609–615 CrossRef CAS.
- Y. Tanabe, G. R. Strobl and E. W. Fischer, Surface melting in melt-crystallized linear polyethylene, Polymer, 1986, 27(8), 1147–1153 CrossRef CAS.
- C. D. Rosa, F. Auriemma and C. Perretta, Structure and Properties of Elastomeric Polypropylene from C2 and C2v-Symmetric Zirconocenes. The Origin of Crystallinity and Elastic Properties in Poorly Isotactic Polypropylene, Macromolecules, 2004, 37(18), 6843–6855 CrossRef.
- C. Challice, International Conference on Electron Microscopy: London, 1954, Nature, 1954, 174, 824–826 CrossRef.
- C. Marega, A. Marigo and V. Causin, et al., Relationship between the Size of the Latex Beads and the Solid–Solid Phase Transitions in Emulsion Polymerized Poly(tetrafluoroethylene), Macromolecules, 2004, 37(15), 5630–5637 CrossRef CAS.
- A. B. Ariawan, S. Ebnesajjad and S. G. Hatzikiriakos, Preforming Behavior of Polytetrafluoroethylene Paste, Powder Technol., 2001, 121(2–3), 249–258 CrossRef CAS.
- G. Masetti, F. Cabassi and G. Morelli, et al., Conformational Order and Disorder in Poly(tetrafluoroethylene) from the Infrared Spectrum, Macromolecules, 1973, 6(5), 700–707 CrossRef CAS.
- X. Li, F. Tian and Z. Tang, et al., Study on structural evolution of polytetrafluoroethylene irradiated by electron beam under stretching using SAXS/WAXS, Eur. Polym. J., 2016, 83, 35–41 CrossRef CAS.
- C. Buckley, The Physics of Polymers, ed. G. R. Strobl, Springer, Berlin, 1996, xii, p. 439, soft- cover, DM 54.00, ISBN 3-540-60788-4 Search PubMed.
- Y. J. Tang and Z. J. Jiang, et al., Uniaxial deformation of overstretched polyethylene: In situ synchrotron small angle X-ray scattering study, Polymer, 2007, 48(17), 5125–5132 CrossRef CAS.
| This journal is © The Royal Society of Chemistry 2021 |