
 Open Access Article
 This Open Access Article is licensed under a Creative Commons Attribution-Non Commercial 3.0 Unported Licence
Ionic liquid-based liposome for selective SERS detection†
Huiting Wanga,
Hairan Zhangb,
Ling Zhangc,
Shibo Zhaoa,
Yaxian Chena,
Yu Wana,
Qian Zhang *a and
Lixin Xia*ad
*a and
Lixin Xia*ad
aCollege of Chemistry, Liaoning University, Shenyang 110036, China. E-mail: zhangq@lnu.edu.cn; lixinxia@lnu.edu.cn
bSchool of Chemical and Environment Science, Shaanxi Key Laboratory of Catalysis, Shaanxi University of Technology, Hanzhong 723001, China
cCollege of Chemistry and Life Science, Shenyang Normal University, Shenyang 110034, China
dYingkou Institute of Technology, Yingkou 115014, China
First published on 22nd November 2021
Abstract
An ionic liquid (IL)-based liposome was utilized as a substrate to construct a SERS platform. The isotropy of the IL outer surface together with its ion-exchange property led to the array-like growth of Au nanoparticles (NPs), generating hot-spots and resulting in anionic probes being present on the hot-spot regions. The simultaneous strategy of enrichment and localization endowed the platform with ability to detect trace amounts of anionic probes.
1. Introduction
In recent years, liposomes have been used to construct surface-enhanced Raman spectroscopy (SERS) substrates.1–3 Owing to their excellent biocompatibility, isotropic surface and abundant surface functional groups, liposome-based SERS substrates can achieve uniform loading of metallic nanoparticles (NPs) and organic Raman probes.4 The combination of these two components has been found to effectively promote the formation of hot-spots and the localization of probes in these hot-spots, thereby achieving SERS.5,6 However, to achieve the uniform co-assembly of the two components, it is necessary to introduce appropriate functional groups that can integrate both components into the structure of the liposome. Recent studies have shown that the introduction of a third component into the lipid can enable such effective assembly.7,8 Therefore, designing new types of lipid systems is of great significance for the construction of liposome-based SERS systems.Ionic liquids (ILs) have been widely applied as modifiers of matrix materials due to their property of structural designability.9–11 The ability of ILs to bind metallic NPs with high stability via the coordination effect has been confirmed.12 In addition, the inherent anion-exchange capability of ILs can enable their capture of various anionic reporters.13 Therefore, as ILs can simultaneously interact with metallic NPs and anionic species, they are potential candidates to serve as internal linkers for the integration of inorganic Au NPs and organic probes. The introduction of an ILs segment into a lipid would enable to construction of an isotropic outer surface composed of ILs, with this surface integrating the two components.
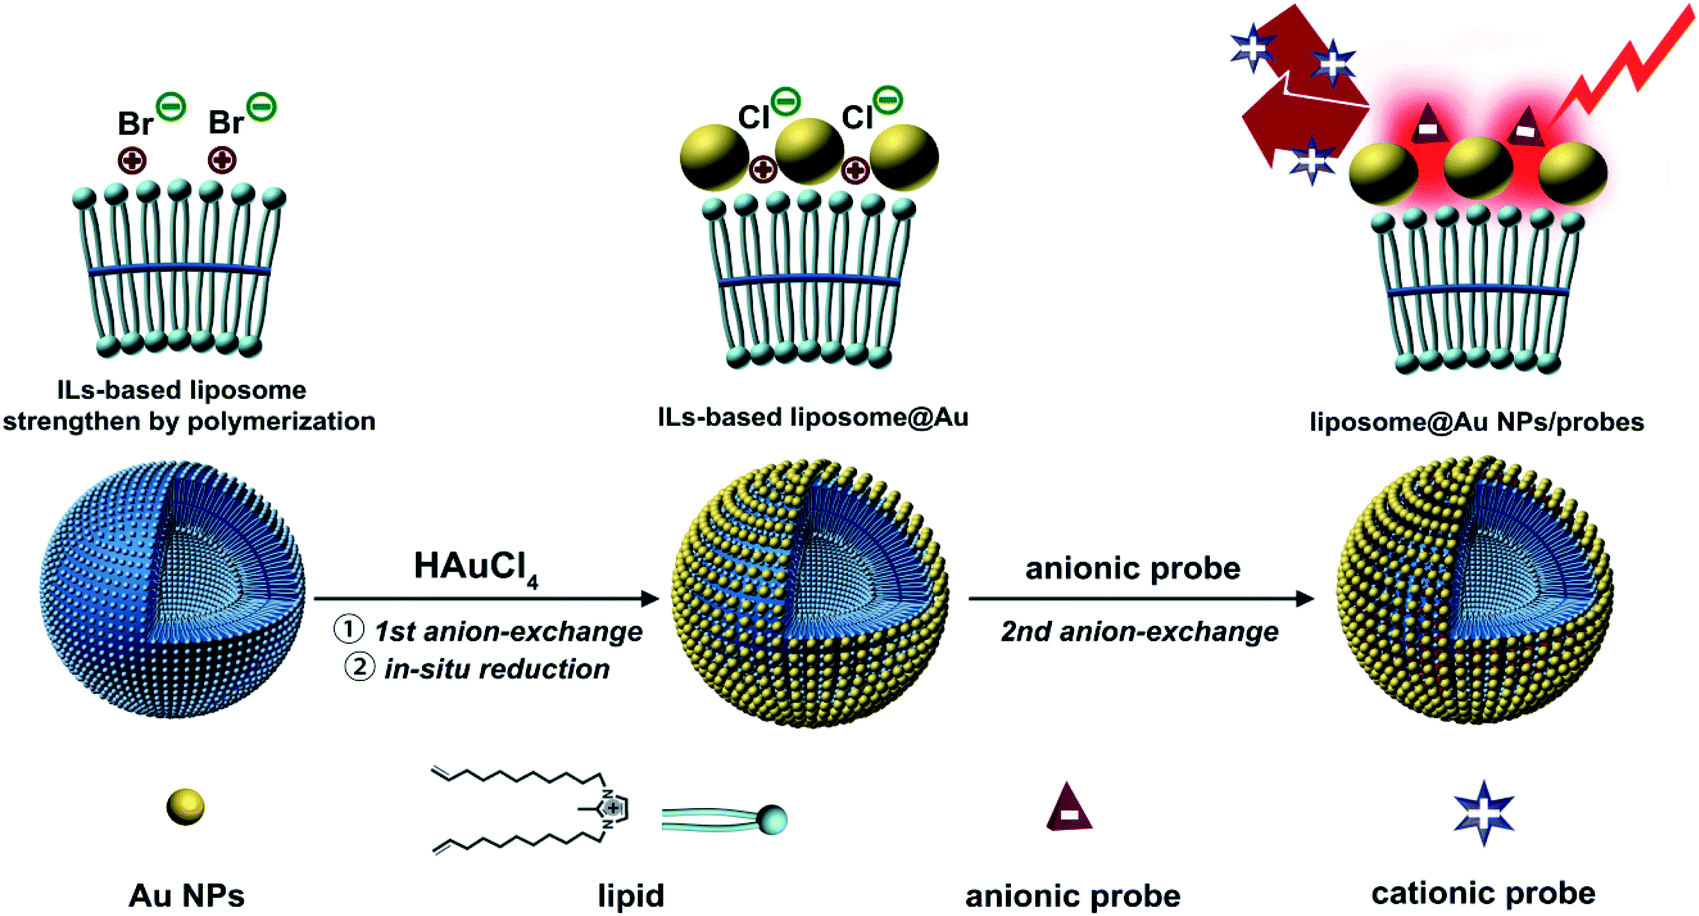
The co-assembly of Au NPs and Raman probes on ILs-based liposome is shown in Scheme 1. N,N′-Bis(10-undecenyl)-2-methylimidazolium bromide, which contains both an ILs terminal and a C![[double bond, length as m-dash]](https://www.rsc.org/images/entities/char_e001.gif) C bond, was used as the lipid to form the liposome. The structural stability of liposome has previously been improved by the polymerization of CC bonds.14 For the first step of incorporating Au NPs, AuCl4− was pre-seeded on the ILs-terminal of the liposome via ion-exchange from Br− to AuCl4−. The distribution of AuCl4− led to the growth and uniform anchoring of the Au NPs on liposome.15 Due to the unique high-density ILs surface structure, the Au NPs were arranged tightly and uniformly through coordination after in situ reduction by NaBH4. This allowed the Au NPs to form an array-like structure, thereby promoting the generation of hot-spots.16 During the process of in situ growth of Au NPs, it was observed that the AuCl4− was converted to Cl−, which resulted in the liposome@Au NPs species still retaining ion-exchange capacity. This meant that some anions could be anchored on the platform using this specific anion-exchange property. In addition, this anion-exchange could also be used to prevent binding of positively charged probes. In the resulting SERS system, the probes and Au NPs were indirectly connected via the exposed ILs terminals. That is, the ILs provided an anchor point through ion-exchange, which subsequently facilitated the precise positioning of probes at the hot-spots generated by array-like Au NPs. This was a completely different approach to that of the traditional SERS system, in which connections are based on sulfhydryl bonds.
C bond, was used as the lipid to form the liposome. The structural stability of liposome has previously been improved by the polymerization of CC bonds.14 For the first step of incorporating Au NPs, AuCl4− was pre-seeded on the ILs-terminal of the liposome via ion-exchange from Br− to AuCl4−. The distribution of AuCl4− led to the growth and uniform anchoring of the Au NPs on liposome.15 Due to the unique high-density ILs surface structure, the Au NPs were arranged tightly and uniformly through coordination after in situ reduction by NaBH4. This allowed the Au NPs to form an array-like structure, thereby promoting the generation of hot-spots.16 During the process of in situ growth of Au NPs, it was observed that the AuCl4− was converted to Cl−, which resulted in the liposome@Au NPs species still retaining ion-exchange capacity. This meant that some anions could be anchored on the platform using this specific anion-exchange property. In addition, this anion-exchange could also be used to prevent binding of positively charged probes. In the resulting SERS system, the probes and Au NPs were indirectly connected via the exposed ILs terminals. That is, the ILs provided an anchor point through ion-exchange, which subsequently facilitated the precise positioning of probes at the hot-spots generated by array-like Au NPs. This was a completely different approach to that of the traditional SERS system, in which connections are based on sulfhydryl bonds.
 | ||
| Scheme 1 Schematic diagram of constructing efficient SERS platform based on ILs-liposome. | ||
2. Experimental
2.1 Materials
Methylimidazole (C4H6N2, 99%) and potassium persulfate (K2S2O8, 99.5%) were obtained from Sinopharm Chemical Reagent Co. Ltd (Shanghai, China). Methyl orange (MO), methyl blue (MB), crystal violet (CV), 4-ethynylbenzoate (EBA) and 11-bromo-1-undecene (C11H21Br, 95%) were purchased from J&K Scientific Ltd. Sodium borohydride (NaBH4, 98%) was purchased from Aladdin Industrial Corporation (Shanghai, China). The reagents were all of analytical grade and used directly without further purification. All aqueous solutions were freshly prepared using Milli-Q purified water (>18 MΩ cm−1).2.2 Apparatus and measurements
The surface morphologies of materials were analyzed by scanning electron microscopy (SEM; JEOL JSM-7400F) at 15 kV, and corresponding energy dispersive spectrometry (EDS) was conducted utilizing a microscope equipped with an X-ray energy analyser. Transmission electron microscopy (TEM; JEM-2100) was performed at an acceleration voltage of 200 kV. 1H nuclear magnetic resonance (1H NMR) spectroscopy was performed using a Mercury-Plus 300 spectrometer (300 MHz, Varian, USA) at 25 °C with TMS as the internal reference and CD3OD as the deuterated sample solvent. Dynamic light scattering (DLS) and zeta potential measurements of various liposome-based materials were collected using a Zetasizer Nano-ZS particle analyzer (Malvern Corp, England). Ultraviolet-visible (UV-vis) spectroscopy was performed using a PerkinElmer Lambda 35 spectrophotometer (Norwalk, CT, USA). Fourier-transform infrared (FT-IR) spectroscopy was performed using a PerkinElmer instrument with a thin KBr pellet. X-ray photoelectron spectroscopy (XPS) was carried out using a Thermo Fisher Scientific ESCALAB 250 instrument (150 W, spot size of 500 μm and Al Kα radiation at 1486.6 eV) to determine the surface elements of various materials. The contact angle— a characteristic of surface hydrophobicity—was measured using a Rame-Hart model 100 contact angle goniometer, with a deionized water droplet (5 μL) gently deposited on the substrate using a micropipette. Raman spectroscopy was performed at 633 nm using a Renishaw inVia Raman microscope equipped with a high-resolution grating of 1800 lines per mm (vis), additional band-pass filter optics, a confocal microscope and a Renishaw CCD camera. The laser power of the Raman spectrometer was 1.7 mW and the magnification of the objective was 50×. Before data acquisition, the intensity of the Raman peak at an excitation wavelength of 633 nm was normalized on a silicon wafer. The Raman spectra were then recorded in the range of 400–3000 cm−1 for 10 s. All spectroscopic data were acquired and processed using the WiRE 4.1 (Renishaw). The finite-difference time-domain (FDTD) simulations reported in this paper were performed using FDTD Solutions (version 8.5; Lumerical Solutions, Inc., Vancouver, Canada). This simulation method was based on the Yee algorithm wherein a discrete grid was used to convert Maxwell's rotation equation with time variables into a differential form, simulating the time-domain response of the electronic pulse and the ideal conductor action. Furthermore, the perfectly matched layer (PML) absorbing boundary conditions were used in this process, and the frequency-domain field monitor was employed to evaluate the electric field distribution in the vicinity of Au NPs.2.3 Synthesis of the lipid imidazolium ionic liquids (ILs)-based N,N′-bis(10-undecenyl)-2-methylimidazolium bromide
To prepare lipid, typically, 2-methylimidazole (3.05 mmol, 0.25 g) and triethylamine (3.65 mmol, 0.51 g) were added to anhydrous toluene (30 mL). Subsequently, 11-bromo-1-undecene (6.10 mmol, 1.33 mL) was added to the above system. The mixture was then constantly stirred at 90 °C for 48 h. After cooling to room temperature, the resulting ammonium salt was removed by filtration and the toluene was evaporated. The resulting oily product was then purified by recrystallisation from acetonitrile and ethyl acetate to yield the lipid as a yellowish powder (0.21 g, 83.4%).2.4 Synthesis of polymerized ILs-based liposome
The as-prepared lipid (0.05 mmol, 0.05 g) was dissolved in water (100 mL) and ultrasonically dispersed for 1 h to form the liposome via self-assembly. Potassium persulfate (0.015 g) was then added to the lipid dispersion. Afterwards, the system was purged with highly purified nitrogen for at least 30 min. Under these conditions, the mixture was heated to 100 °C and constantly stirred for 24 h for cross-linking polymerization. The resulting dispersion was subsequently cooled to room temperature and centrifuged at 8000 rpm for 15 min. The supernatant was removed to afford the polymerized liposome as a white powder (71.5%).2.5 Synthesis of liposome@Au NPs
The polymerized liposome (0.05 mmol, 0.05 g) was dissolved in water (100 mL) and stirred for 30 min. Tetrachloroauric acid (0.04 mmol, 0.016 g) dissolved in water (10 mL) was added into this dispersion and the resulting mixture was stirred for 12 h. The mixture was then centrifuged at 8000 rpm for 10 min to remove excess tetrachloroauric acid. The centrifuged product was redispersed into water before sodium borohydride (0.52 mmol, 0.02 g) was added and allowed to react for 30 min. The solid was then removed by filtered and dried in a vacuum oven to afford the liposome@Au NPs (0.041 g, 82%).2.6 Preparation of the SERS platform liposome@Au NPs/probes by anion-exchange
The liposome@Au NPs/probes system was derived from an anion-exchange reaction of liposome@Au NPs with probe molecules. Taking the fabrication of liposome@Au NPs/MO as an example, liposome@Au NPs (20 mg) was dispersed in MO solution (10−6 M, 20 mL), stirred for 24 h and the product was collected by filtration. The precipitate was washed three times with deionized water to remove excess MO. The integrated hybrid of liposome@Au NPs/MO was obtained after drying in a vacuum oven. By using a similar method, liposome@Au NPs/methyl blue (MB) and liposome@Au NPs/4-ethynylbenzoate (EBA) could also be prepared.3. Results and discussion
3.1 Morphology characterization of liposome@Au NPs
The morphology of the liposome is shown in Fig. 1A and B. They had a smooth surface and were uniform in shape with diameters ranging from 150 to 250 nm (Fig. 1A, inset). The liposome@Au NPs species retained the same intrinsic spherical structure with no significant change in diameter (Fig. 1C and D), indicating that the in situ growth of the Au NPs did not affect the liposome morphology. However, in contrast to the smooth surface of the original liposome, many black spots were observed on the liposome@Au NPs. From the HRTEM image (Fig. 1D, inset), the interlayer spacing was measured to be 0.24 nm; this was ascribed to the face-centered cubic (FCC) structure of the (111) facet of the Au NPs, confirming the successful assembly of the inorganic Au NPs. Additionally, the decorated Au NPs were uniformly distributed in the particle size range of 2–5 nm, which was attributed to the special isotropic structure of the liposome. Specifically, as a result of the uniformly distributed and isotropic exposed ILs terminals, AuCl4− was uniformly immobilized on the substrate by ionic pairing, resulting in the array-like growth of Au NPs. This kind of array-like accumulation with an interparticle distance of 1–2 nm (<10 nm; Fig. S4†) is conducive to the formation of hot-spots.17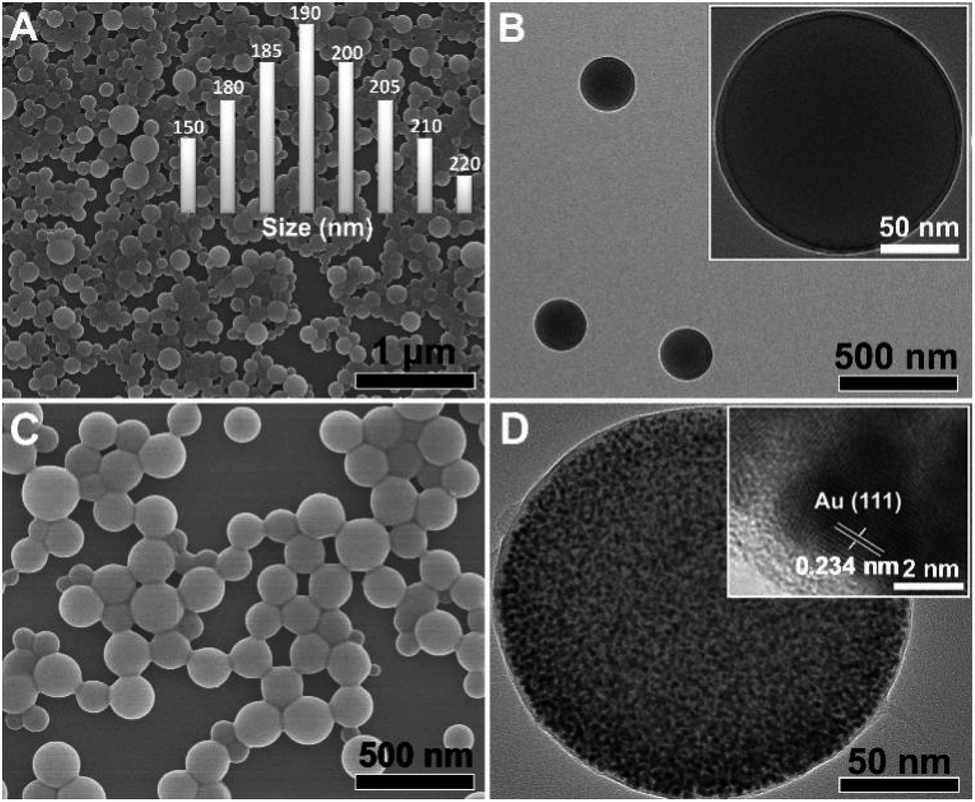 | ||
| Fig. 1 SEM image of liposome (A) and liposome@Au NPs (C). TEM images of liposome (B) and liposome@Au NPs (D). Inset of (A): particle size distribution of liposome recorded; inset of (B): enlarged TEM image of liposome; inset of (D): high resolution transmission electron microscopy (HRTEM) image of liposome@Au NPs. | ||
As shown in Fig. S5,† the zeta potential of the liposome@Au NPs species was +33.7 mV, which was similar to that of the original liposome (Fig. S5†). This result revealed that the surface charge of the liposome was not destroyed by modification with Au NPs, thus laying the foundation for further assembly of Raman probes.
3.2 Structural characterization of liposome@Au NPs
Due to the retained anion-exchange ability of the ILs terminals, anionic probes could be further assembled onto the liposome@Au NPs species. 4-Ethynylbenzoate (EBA), an anionic Raman reporter with a highly distinguishable fingerprint spectrum in the Raman-silent region, was taken as an example.18 To eliminate the possibility of physical adsorption, the samples loaded with EBA were washed three times with stirring before analysis. The FTIR spectrum of liposome@Au NPs/EBA revealed absorption peaks at 2212, 1605, 1413 and 610 cm−1, which were designated as the stretching vibration of C![[triple bond, length as m-dash]](https://www.rsc.org/images/entities/char_e002.gif) C, asymmetric/symmetrical stretching vibration of COO− and the deformation vibration mode of C–H (curve (b), Fig. 2A). These peaks, which were derived from characteristic bands of EBA, indicated that EBA had been successfully incorporated on the liposome@Au NPs. XPS also confirmed the successful modification with EBA (Fig. 2B), with peaks corresponding to Au 4f and Au 4d observed at 85.0 and 353.0 eV, and the C 1s core-level spectrum containing peaks corresponding to unsaturated C (284.2 eV), saturated C (284.6 eV) and C in C–N (285.0 eV), CN (286.3 eV) and –COO− (288.8 eV) (inset of Fig. 2B). These results all verified that EBA had been successfully immobilized onto the surface of the liposome@Au NPs species.
C, asymmetric/symmetrical stretching vibration of COO− and the deformation vibration mode of C–H (curve (b), Fig. 2A). These peaks, which were derived from characteristic bands of EBA, indicated that EBA had been successfully incorporated on the liposome@Au NPs. XPS also confirmed the successful modification with EBA (Fig. 2B), with peaks corresponding to Au 4f and Au 4d observed at 85.0 and 353.0 eV, and the C 1s core-level spectrum containing peaks corresponding to unsaturated C (284.2 eV), saturated C (284.6 eV) and C in C–N (285.0 eV), CN (286.3 eV) and –COO− (288.8 eV) (inset of Fig. 2B). These results all verified that EBA had been successfully immobilized onto the surface of the liposome@Au NPs species.
 | ||
| Fig. 2 FT-IR spectra of liposome@Au NPs (A-a) and liposome@Au NPs/EBA (A-b). XPS spectrum of liposome@Au NPs/EBA ((B) inset: C 1s core-level spectrum of liposome@Au NPs/EBA). Normal Raman spectrum of EBA (C-a), enhanced SERS spectra of Au–PAPT (C-b) and liposome@Au NPs/EBA (C-c). Inset: blow-up plot of the alkynyl stretching region. Schematic diagram of SERS enhancement mechanism for different systems and finite difference time domain (FDTD) simulations of the intensities of electrical fields upon excitation with a 633 nm laser line for single Au NPs and liposome@Au NPs (D and E). Conditions: concentration of target molecules: 1.0 × 10⁻⁶ M; excitation wavelength: 633 nm; power: 1.7 mW; Lens: 50× objective; exposure time: 10 s. | ||
3.3 Performance analysis
The Raman response of the liposome@Au NPs/EBA species is shown in Fig. 2C. In comparison, a binary SERS system composed of Au NPs and 4-ethynylthiophenol (PAPT) was also examined. In contrast to the modification of EBA onto liposome@Au NPs species through indirect assembly, the traditional Au–PAPT system relies on direct combination induced by sulfhydryl groups. As shown in Fig. 2C, the characteristic peaks at 2014 and 2202 cm−1 that appeared in both curves (b) and (c) were designated as typical alkynyl stretching Raman shifts,19 indicating that SERS could be achieved on both substrates. However, the relative intensity of the alkynyl band was eight times greater on the liposome@Au NPs species than on the Au NPs, demonstrating a significant amplification effect of the co-assembled liposome@Au NPs/EBA. It should be noted that the experimental conditions and probes concentrations were identical; that is, the difference in SERS performance was due to microstructural differences.The influence of the structure on the electromagnetic field is investigated using the fine difference time domain (FDTD) method. The results are shown in Fig. 2D and E. The enhancement of Raman signals is largely determined by the concentrated arrangement of metallic NPs as well as a reproducible number and position of label molecules in SERS-active regions.20 In the traditional mode (Au–PAPT), due to the lack of interaction between Au NPs the SERS substrate was just a single Au nanoparticle. Such individual Au NPs resulted in limited scattering cross-section and insufficient electromagnetic enhancement.21 In comparison, the isotropic ILs-based liposome@Au NPs substrate provided the possibility for the plasmonic Au NPs to be ordered as an evenly spaced array, resulting in the effective coupling of local electromagnetic fields and leading to the generation of strong and consistent hot-spots. At the same time, the reporters were also precisely located at the ILs terminal, which was the location of a hot-spot. Therefore, the introduction of ILs not only promoted the formation of hot-spots but also realized their effective utilization, thereby producing a larger amplification effect than in the traditional system.
The versatility of this co-assemblage strategy was further investigated via the SERS detection of methyl orange (MO) and methyl blue (MB). The successful immobilization of MO and MB onto the liposome@Au NPs was confirmed by FTIR and XPS spectroscopy (Fig. S10 and S11†). The SERS activity of the liposome@Au NPs for anionic targets is shown in Fig. 3, with the prominent Raman bands at 1115, 1141, and 1396/1443 cm−1 assigned to the Ph–N stretching, C–H deformation and NN stretching vibrations of MO (Fig. 3A, curve (c)).22 Similarly, the Raman shifts at 1180, 1361 and 1617 cm−1 represented the SO symmetric/asymmetric stretching and CN stretching vibration modes of MB (Fig. 3B, curve (c)).23
 | ||
| Fig. 3 Universal applicability of liposome@Au NPs for detection of different probe molecules: MO (A) and MB (B). SERS spectra of MO on liposome@Au NPs at different concentrations of MO (C). The process of solid phase micro-extraction (SPME) in SERS detection of MO (D). Conditions: concentration of target molecules: 1.0 × 10⁻⁶ M; excitation wavelength: 633 nm; power: 1.7 mW; lens: 50× objective; exposure time: 10 s. | ||
Taking MO as an example, the limit of detection (LOD) of the liposome@Au NPs towards MO was studied. The SERS responsiveness was recorded with the target concentration ranging from 1.0 × 10⁻⁶ to 1.0 × 10⁻¹² M. As shown in Fig. 3C, the signal intensities of MO declined with the decrease in concentration. It should be noted that even when concentration was 1.0 × 10⁻¹² M, the characteristic NN vibration modes of MO could still be detected, demonstrating that the LOD of the liposome@Au NPs for MO was as low as 1.0 × 10⁻¹² M. This was much lower than the LOD values of binary Au systems reported in the literature (usually 1.0 × 10⁻⁶ to 1.0 × 10⁻⁹ M),22,23 illustrating that the utilization of hot-spots effectively improved the analytical performance of the liposome@Au NPs. The low LOD was attributed to the extraction and enrichment effect of the liposome@Au NPs towards probes due to its anion-exchange property (Fig. 3D): low-concentration anionic targets were extracted from the surrounding environment and enriched on the liposome@Au NPs. More importantly, this induced enrichment of target molecules was also a localized process. That is, the simultaneous strategy of enrichment and localization endowed the Au-decorated substrate with the capability of solid-phase microextraction (SPME), thus achieving an ultra-sensitive detection limit due to these synergistic effects.
The unique reactivity of the ILs to anions also endowed the substrate with SERS detection selectivity. The Raman activity of the liposome@Au NPs toward cationic and anionic analytes was examined. Negatively charged MO, positively charged rhodamine 6G (R6G) and crystal violet (CV) were selected as the target analytes. After the pure cationic systems of R6G(+) or CV(+) interacted with the liposome@Au NPs, no representative Raman signal of R6G(+) or CV(+) was observed (Fig. 4), indicating that the response of the liposome@Au NPs towards cationic reporters was blocked. This was because the exposed imidazoline terminal equipped the liposome@Au NPs with a marked positive charge (+33.7 mV, Fig. S5†), which enabled this plasmonic substrate to capture and enrich anionic targets while rejecting cationic ones. For the simple anion/cation mixtures of MO(−)/R6G(+) or MO(−)/CV(+), no matter which system interacted with liposome@Au NPs, discernible peaks of only MO(−) appeared at 1116, 1142, and 1395/1443 cm−1 (green region). This confirmed that the liposome@Au NPs could selectively recognize the anionic reporter from complex systems. The treatment mixture was then changed to a three-component system, in which MO(−) and two interfering substances interacted with the liposome@Au NPs. Again, as shown in the corresponding SERS spectrum (Fig. 4), only characteristic peaks of MO(−) were present. It is noteworthy that the concentration of R6G(+) or CV(+) (1.0 × 10⁻⁵ M) was 10 times higher than that of MO(−) (1.0 × 10⁻⁶ M). That is, even when the dosage of cationic reporters was much higher than the concentration of anions, this SERS-active substrate still selectively captured the anions. Thus, the ILs-based liposome substrate demonstrated excellent anti-interference ability.
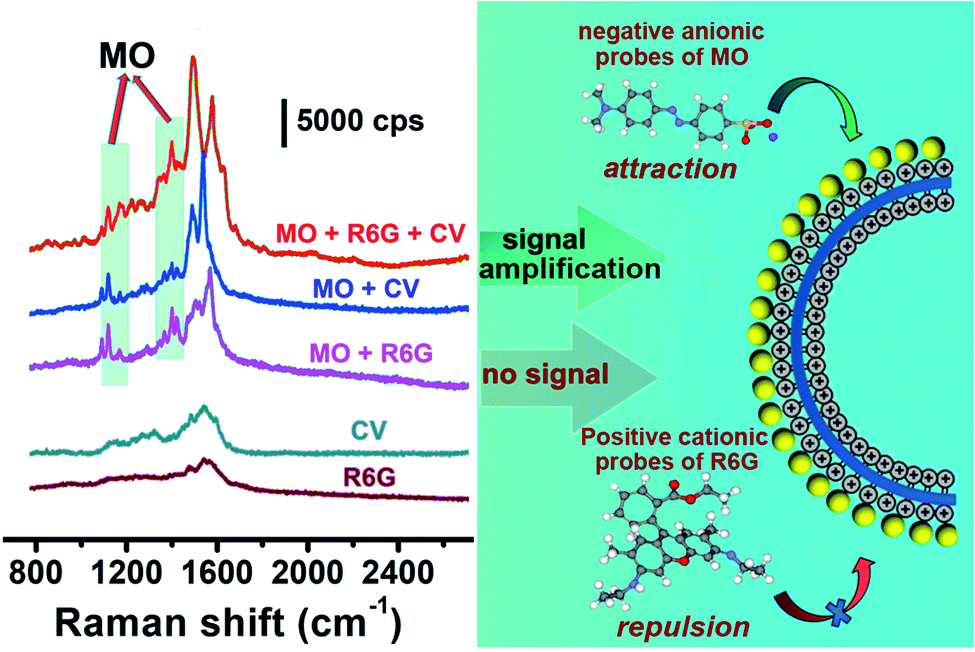 | ||
| Fig. 4 Charge-selective mechanism of the liposome@Au NPs and the corresponding SERS spectra. Concentration of target molecules: 1.0 × 10⁻⁵ M (R6G and CV) and 1.0 × 10⁻⁶ M (MO). Conditions: excitation wavelength: 633 nm; power: 1.7 mW; lens: 50× objective; exposure time: 10 s. | ||
4. Conclusions
In conclusion, a new ILs-based liposome substrate was used to construct a liposome@Au NPs/probes platform based on the strategy of co-assembly. The uniformly distributed ILs terminals on the isotropic liposome were conducive to the dense growth of array-like Au NPs, which contributed to the generation of hot-spots. Anionic targets were also localized in hot-spot regions due to the anion-exchange ability of the ILs terminals. This synergistic effect promoted the extreme enhancement of Raman signals. Additionally, the ILs-based liposome substrate also endowed the assembly with a series of properties, such as universality, high sensitivity and charge selectivity. Such ILs-based liposome assemblies are expected to enable highly efficient and sensitive detection for specific anionic Raman probes.Author contributions
Huiting Wang: investigation, writing – original draft, methodology. Hairan Zhang: investigation, methodology. Ling Zhang: conceptualization, writing – review and editing, formal analysis, supervision. Shibo Zhao: investigation, methodology. Yaxian Chen: investigation, methodology. Yu Wan: investigation, methodology. Qian Zhang: conceptualization, writing – review and editing, formal analysis, supervision. Lixin Xia: funding acquisition, formal analysis, supervision.Conflicts of interest
There are no conflicts to declare.Acknowledgements
Huiting Wang, Hairan Zhang, Shibo Zhao, Yaxian Chen, Yu Wan Qian Zhang and Lixin Xia received funding from the National Natural Science Foundation of China (21671089), and the Scientific Research Fund of Liaoning Provincial Education Department (LFW201706). Hairan Zhang received funding from the Natural Science Basic Research Plan in Shaanxi Province of China (2021JQ-754); Special Scientific Research Plan of Education Department of Shaanxi (21JK0561); Scientific Research Fund Project of Shaanxi University of Technology (209020281). Huiting Wang, Ling Zhang and Qian Zhang received funding from the Scientific Research Fund of Liaoning Provincial Education Department (LR2019029) and Scientific Research Fund from Key Laboratory of Functional Inorganic Material Chemistry (Heilongjiang University), Ministry of Education. Huiting Wang and Lixin Xia received funding from the Scientific Research Fund of Liaoning Provincial Education Department (2020-YKLH-22).Notes and references
- Y. Y. Zhao, J. Zhao, G. Y. Shan, D. M. Yan, Y. W. Chen and Y. C. Liu, Colloids Surf., B, 2017, 154, 150–159 CrossRef CAS PubMed
.
- W. Lum, I. R. Bruzas, Z. Gorunmez, S. A. Unser, T. L. Beck and L. B. Sagle, J. Phys. Chem. Lett., 2017, 8, 2639–2646 CrossRef CAS PubMed
- D. Zhu, Z. Y. Wang, S. F. Zong, H. Chen, X. Wu, Y. W. Pei, P. Chen, X. Q. Ma and Y. P. Cui, Nanoscale, 2014, 6, 8155–8161 RSC
- X. J. Liu, S. Y. Huan, Y. L. Bu, G. l. Shen and R. Q. Yu, Talanta, 2008, 75, 797–803 CrossRef CAS PubMed
- L. Cui, R. Li, T. Mu, J. Wang and M. Sun, Spectrochim. Acta, Part A, 2021, 264, 120283 CrossRef PubMed
- Y. T. Feng, M. Gao, Y. Wang, L. Y. Meng and M. T. Sun, J. Raman Spectrosc., 2020, 51, 476–482 CrossRef CAS
- L. L. Qu, N. Wang, G. Zhu, T. P. Yadav, X. T. Shuai, D. D. Bao, G. H. Yang, D. W. Li and H. T. Li, Talanta, 2018, 186, 265–271 CrossRef CAS PubMed
- Y. Wang, M. X. Shang, Y. N. Wang and Z. R. Xu, Anal. Methods, 2019, 11, 3966–3973 RSC
- K. Motobayashi, K. Minami, N. Nishi, T. Sakka and M. Osawa, J. Phys. Chem. Lett., 2013, 4, 3110–3114 CrossRef CAS
- Q. Zhang, S. Y. Wu, L. Zhang, J. Lu, F. Verproot, Y. Liu, Z. Q. Xing, J. H. Li and X. M. Song, Biosens. Bioelectron., 2011, 26, 2632–2637 CrossRef CAS PubMed
- T. R. Zhan, Z. W. Tan, X. Tian and W. G. Hou, Sens. Actuators, B, 2017, 246, 638–646 CrossRef CAS
- L. Luza, C. P. Rambor, A. Gual, F. Bernardi, J. B. Domingos, T. Grehl, P. Brüner and J. Dupont, ACS Catal., 2016, 6, 6478–6486 CrossRef CAS
- M. Buaki, C. Aprile, A. Dhakshinamoorthy, M. Alvaro and H. Garcia, Chem.–Eur. J., 2009, 15, 13082–13089 CrossRef CAS PubMed
- S. L. Regen, A. Singh, G. Oehme and M. Singh, J. Am. Chem. Soc., 1982, 104, 191–795 Search PubMed
- S. Fateixa, H. I. S Nogueira and T. Trindade, Phys. Chem. Chem. Phys., 2015, 17, 21046–21071 RSC
- C. J. Zhang, E. M. You, Q. Jin, Y. X. Yuan, M. M. Xu, S. Y. Ding, J. L. Yao and Z. Q. Tian, Chem. Commun., 2017, 53, 6788–6791 RSC
- X. L. Li, Z. W. Wang, C. K. Tan, Z. X. Shen and A. l. Y. Tok, Coatings, 2018, 9, 20 CrossRef
- M. LathaBeatrice, S. M. Delphine, M. Amalanathan, M. S. M. Mary, H. M. Robert and K. T. Mol, J. Mol. Struct., 2021, 1238, 130381 CrossRef
- Y. Chen, J. Q. Ren, X. G. Zhang, D. Y. Wu, A. G. Shen and J. M. Hu, Anal. Chem., 2016, 88, 6115–6119 CrossRef CAS PubMed
- Y. Q. Wang, B. Yan and L. X. Chen, Chem. Rev., 2013, 113, 1391–1428 CrossRef CAS PubMed
- M. Shanthil, R. Thomas, R. S. Swathi and K. G. Thomas, J. Phys. Chem. Lett., 2012, 3, 1459–1464 CrossRef CAS PubMed
- L. M. Tian, S. Tadepalli, M. E. Farrell, K. K. Liu, N. Gandra, P. M. Pellegrino and S. Singamaneni, J. Mater. Chem. C, 2014, 2, 5438–5446 RSC
- J. Lin, Y. Shang, X. X. Li, J. Yu, X. T. Wang and L. Guo, Adv. Mater., 2016, 29, 1604797 CrossRef PubMed
Footnote |
| † Electronic supplementary information (ESI) available. See DOI: 10.1039/d1ra07535g |
| This journal is © The Royal Society of Chemistry 2021 |