DOI:
10.1039/D1RA07048G
(Paper)
RSC Adv., 2021,
11, 40159-40172
On the resistivity, temperature coefficient of resistance, and ampacity of Cu–CNT and Ni–CNT composites†
Received
20th September 2021
, Accepted 9th December 2021
First published on 17th December 2021
Abstract
Cu–CNT composites are promising candidates to overcome the maximum current capacity limitation of most conductive materials. Yet, the ampacity gains reported in the literature are controversial, and the key to efficient Cu–CNT composites is not established. In this regard, the choice of the right type of CNT is instrumental. The use of Ni as interface is being increasingly investigated to enhance the electron transfer between Cu and the CNT. Here, Cu–CNT and Ni–CNT composites integrating MWCNT (ø = 80–90 nm – L = 800 μm) are investigated. This work presents a novel electroplating method to fabricate Cu/Ni–CNT composites with high degree of metal filling and high CNT vol% (∼42–43%). The resistivities of the Cu–CNT and Ni–CNT composites are 4.32 × 10⁻⁶ and 4.44 × 10⁻⁵ Ω cm, respectively. The annealing of the Cu–CNT composite is detrimental to its resistivity while it is beneficial for the Ni–CNT composite. The TCR of the composites suggests that the CNT–metal electron transfer is promoted by Ni. The metal–CNT composites display lower ampacities than pure metals. The importance of controlling the experimental parameters and the system architecture is instrumental to investigating the figure of merit of high ampacity materials. A lack of standardized experimental procedures may lead to biased conclusions as reported today in the literature.
1 Introduction
Due to its very low resistivity (1.68 × 10⁻⁸ Ω m),1 copper is commonly considered the best, and a rather abundant, conductive material. Copper is increasingly limited by its current carrying capacity (ampacity) in strongly miniaturized electronic devices that require higher current density.2 Furthermore, the specific mass of copper (8.96 g cm−3)3 becomes significant in several applications where the overall mass has to be minimized (e.g. lightning strike protection in aircraft).4 Since the electrical conductivity in carbon nanotubes (CNT) can be as high as in copper, with a low specific mass (∼ 1.74 g cm−3),5 high ampacity, and low temperature coefficient of resistance (TCR),6–9 the fabrication of Cu–CNT composites with these features is now a thriving topic. In 2013, Subramaniam et al.10 reported a Cu–CNT composite with an ampacity one hundred times higher than pure copper. In addition, they reported a conductivity similar to copper at room temperature and a very low TCR (7.5 × 10⁻⁴ K−1) compared to pure copper (3.9 × 10⁻³ K−1).11 Nevertheless, it remains unclear today how such an efficient material can be produced as the results reported in recent papers are controversial (Table 1), ranging from smaller ampacity gains (at most 82%)12 to ampacity loss.13 Similarly, the reported resistivity ranges from 1.65 × 10⁻⁸ to 5.1 × 10⁻⁵ Ω m14,15 and the reported TCR from 1.7 × 10⁻³ K−1 to values similar to pure copper.14,16 The strong divergence of these results highlights the need for further investigation to identify the key features to obtaining efficient Cu–CNT composites. Indeed, numerous parameters are expected to impact the composites' electrical properties, including CNT type, orientation, volume percentage, degree of metal filling, homogeneity of the composite and features of the CNT–metal interface.10,16–20 Long and large multi-walled CNT (MWCNT) were reported to be potentially highly conductive (similar to copper) with ballistic transport on macroscopic distances (≥25 μm).6,7,9 Hence, in this paper, we propose to investigate a Cu–NT composite comprising long and large MWCNT (L = 800 μm – ø = 80–90 nm). Following our precedent experiments proposing Cu-doped polydopamine to interface efficiently Cu and CNT,21 we present a novel method for fabricating Cu–CNT composites with high CNT vol% (i.e. ≥42%) by electroplating in aqueous solution. Furthermore, we used this method to fabricate and characterize an Ni–CNT composite. Indeed, increasing attention is given to the use of a second metal to tune the interface between CNT and copper.19,20,22 Milowska et al.20 reported that the electrical contact of CNT using Ni instead of Cu could be improved, leading to the efficient injection of electrons into the CNT. MWCNT connected electrically by side contacts are expected to transport electrons mainly through a small number of outer walls.23 Yet, it is primordial to promote conduction through all MWCNT walls to benefit from the high MWCNT conductivity.6 Due to the carbon solubility in nickel, Milwoska et al. also showed the possibility of connecting the inner shells of MWNCT using optimized annealing of Ni–NT systems.20 In this work, we thus investigate the effect that annealing Ni–CNT and Cu–CNT composites has on their electrical properties.
Table 1 Recent results obtained in the literature. For each paper, the ampacity value of pure copper is also given where measured (composite ampacity gain in comparison to pure copper given in %). ** Study over several line lengths, ampacity taken for 17 mm
| CNT type |
CNT vol% |
CNT alignment |
Ampacity (A cm−2) |
Resistivity (Ω m) |
TCR (K−1) |
Reference |
| MWCNT |
N/A |
Not aligned |
1.54 × 10⁴ |
2.44 × 10⁻⁸ |
N/A |
Chen et al.24 |
| Cu: 9.38 × 10³ |
| MWCNT |
20 |
Not aligned |
N/A |
∼ 3.83 × 10⁻⁸ |
N/A |
Daoush et al.25 |
| MWCNT |
N/A |
Aligned |
N/A |
5.1 × 10⁻⁵ |
N/A |
Feng et al.15 |
| MWCNT |
N/A |
Aligned |
N/A |
2.45 × 10⁻⁷ |
N/A |
Xu et al.26 |
| MWCNT |
1 |
Aligned |
1.16 × 10⁴ (32%) |
2.13 × 10⁻⁸ |
<Cu |
Shuai et al.27 |
| Cu: 8.84 × 10³ |
| SWCNT |
0–10 |
Not aligned |
N/A |
1.65 × 10⁻⁸ |
≈ Cu |
Yang et al.14 |
| SWCNT |
45 |
Aligned |
6 × 10⁸ |
2.12 × 10⁻⁸ |
7.5 × 10⁻⁴ |
Subramaniam et al.10,28 |
| Cu: 106 |
| MWCNT |
45 |
Aligned |
6.3 × 10⁴ (28%) |
1.6 × 10⁻⁷ |
1.7 × 10⁻³ |
Sundaram et al.16,17 |
| Cu: 4.9 × 10⁴ |
| N/A |
20–50 |
Aligned |
N/A |
4.19 × 10⁻⁷ |
2.1 × 10⁻³ |
Sun et al.29 |
| MWCNT |
40 |
Partially aligned |
2.74 × 10⁵ (∼82%)** |
1.82 × 10⁻⁸ |
N/A |
Bazbouz et al.12 |
| Cu: ∼1.5 × 10⁵ |
2 Materials and methods
The fabrication of Cu–CNT composite with high CNT vol% (i.e. 40–50%) fabrication remains challenging and is commonly obtained by electroplating in an organic solvent based solution.10,17 Here, we use an innovative method to produce Ni–CNT and Cu–CNT composites with a high CNT vol% and a continuous metal matrix using only aqueous solutions.
Nitric acid (65%), dopamine hydrochloride, boric acid, nickel sulphamate tetrahydrate, nickel sulphate hexahydrate, sodium hydroxide, polyethylene glycol (PEG), and hydrophilic PTFE membranes (Omnipore – 10 μm pore size) were bought from Sigma-Aldrich. Hydrochloric acid (37%, AnalaR NORMAPUR) and tissues were bought from VWR. Bis-(sodium sulfopropyl)-disulfide (SPS) was bought from Fluorochem. Tris(hydroxymethyl)aminomethane was bought from Euromedex. Commercial MWCNT (average length 800 μm, average diameter 80–90 nm, grown from Fe catalyst) were bought from NanoTechLabs, Inc. (NTL). Reference copper foils were provided by Circuit Foil Luxembourg Sarl.
2.1 CNT treatment
2.1.1 CNT oxidization. The MWCNT treatment was inspired by the protocol used in our preceding work.21 CNT (300 mg) were oxidized in a sonication bath in 150 mL of nitric acid (52%) for 30 min (at room temperature). They were then filtrated and rinsed with DI water using a vacuum filtration system.
2.1.2 Metal-doped polydopamine coating on CNT. CNT are coated with Cu doped polydopamine (CNT@PdaCu) by stirring oxidized CNT (100 mg) for 30 min in a solution (625 mL) composed of dopamine hydrochloride (0.065 mM) and CuSO4·5H2O (0.3 mM). Then, Tris–HCl (375 mL, 10 mM) was added to the solution to trigger the polymerization of the dopamine. The solution was left under stirring for 24 hours and NaOH (12.5 mL) was added to the solution. The CNT were filtrated, rinsed with EtOH, and dispersed in EtOH (100 mL). CNT coated with Ni doped polydopamine (CNT@PdaNi) were obtained by replacing the CuSO4·5H2O by NiSO4 (0.3 mM) in the previous protocol.
2.1.3 CNT carpet fabrication. CNT carpets were obtained directly by filtrating the CNT solution with a vacuum filtration apparatus, and the filtrated CNT layer was peeled from the membrane (ø = 3.9 cm). Oxidized CNT layers were more brittle than CNT@PdaCu and CNT@PdaNi layers. In order to facilitate their peeling and handling, 10 mL of oxidized CNT solution was filtrated for each CNT layer instead of 5 mL for the CNT@PdaCu and CNT@PdaNi layers. The peeled CNTs were dried at 353 K for 2 min to evaporate the remaining ethanol.
2.2 Metal–CNT composites and pure metal sample fabrication
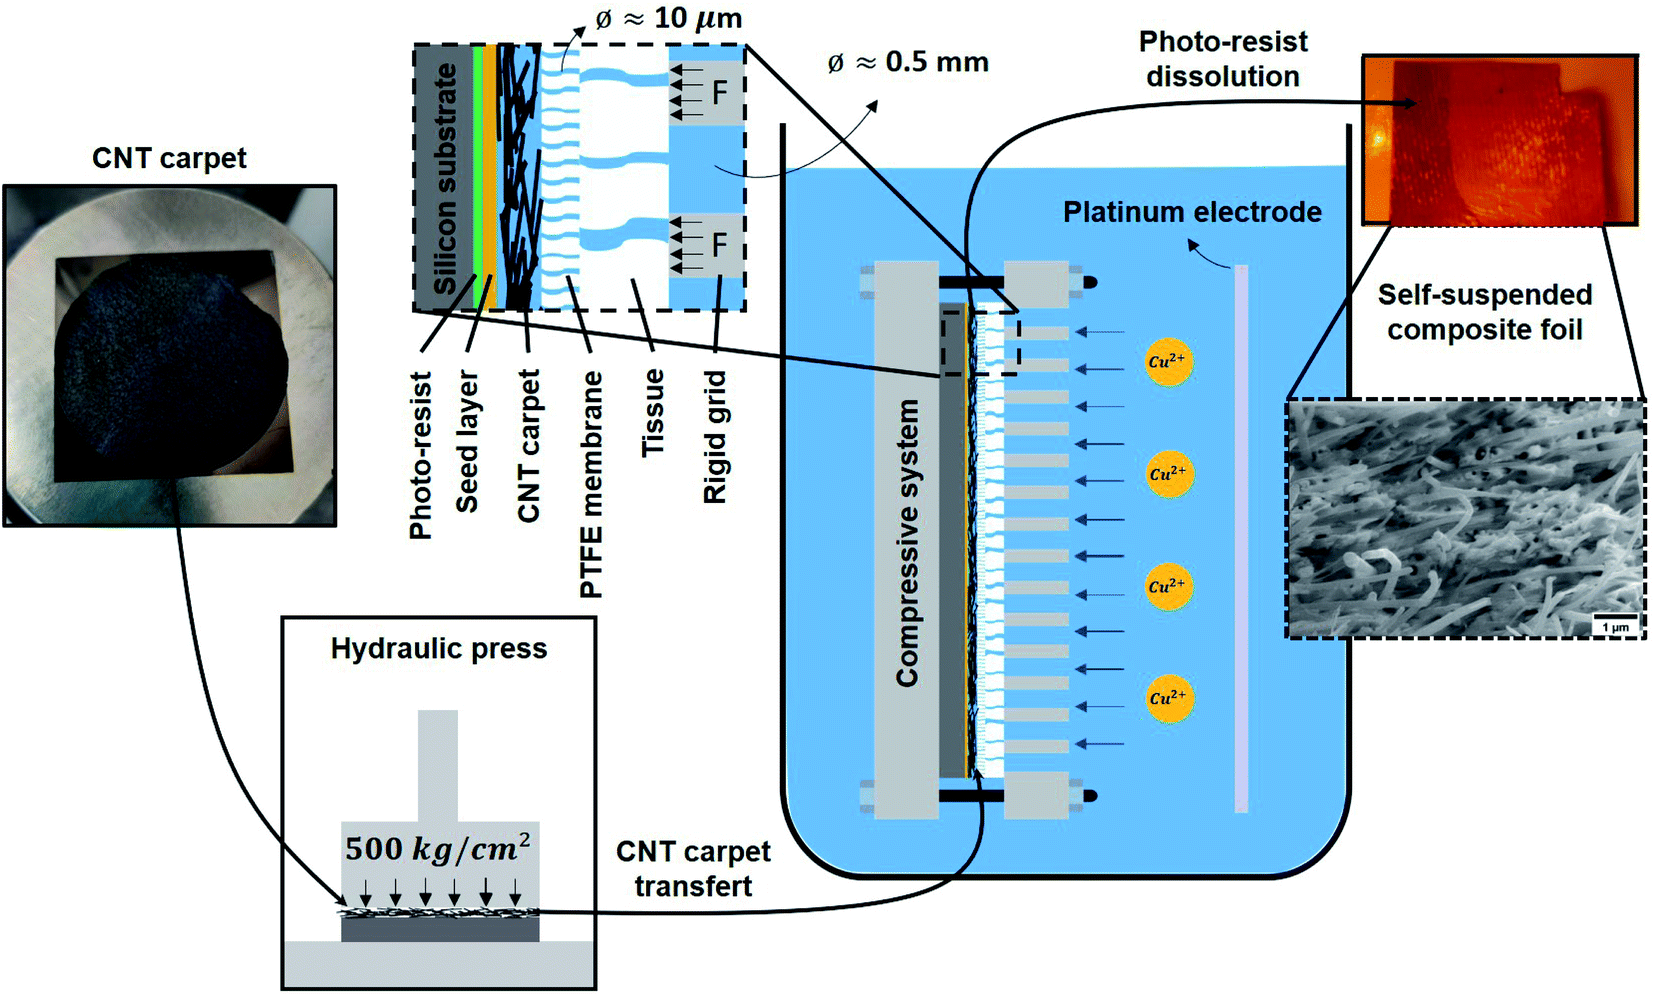
2.2.1 Cu–CNT composite sample fabrication. Photo-resist was spin-coated onto a standard silicon substrate and then covered by a thin layer of copper by sputtering (thickness ≈ 400 nm). As shown in Fig. 1, CNT layers were compressed using a hydraulic press (500 kg cm−2 for 5 min), placed on the substrate, and successively clamped in a compression system. The system was then immersed in an electroplating solution composed of CuSO4·5H2O (0.63 M), H2SO4 (0.1 M), HCl (50 ppm), polyethylene glycol (100 ppm), and bis-(sodium sulfopropyl)-disulfide (15 ppm). Electroplating was done at room temperature using current pulses of 35 mA cm−2 (ON – 0.02 s) and 0 mA cm−2 (OFF – 0.1 s) until the CNT layer was completely filled by Cu. The composite foil was separated from the substrate by dissolution of the resist in acetone. The PTFE membrane (Fig. 1) was slightly attached to the composite surface and was removed by peeling followed by gentle mechanical polishing. The composite sample was then cut into separate pieces for further characterization.
 |
| | Fig. 1 Schematic of the metal–CNT composite fabrication (e.g. for a Cu–CNT composite). The compression system used during electroplating to fabricate high CNT vol% composites is shown. In the inset, F represents the force applied by the rigid grid, the diameter of the pores in the PTFE membrane is 10 μm. | |
2.2.2 Ni–CNT composite and pure Ni sample fabrication. Ni–CNT composite was obtained following a protocol similar to the one of Cu–CNT composite. In this case, a Ni thin layer was sputtered instead of Cu and a compressed layer of CNT@PdaNi was used. The electroplating solution was composed of Ni sulphamate tetrahydrate (400 g L−1) and boric acid (30 g L−1). The plating was done at 323 K using current pulses of 35 mA cm−2 (ON – 0.02 s) and 0 mA cm−2 (OFF – 0.1 s) until the CNT layer was filled by Ni. The Ni–CNT composite foil was then recovered, polished and cut into pieces using the method detailed above. A pure Ni sample was fabricated by plating Ni on a substrate of silicon covered by Ni using the same plating solution and current pulses.
2.2.3 Annealing of composite samples. A Carbolite Gero CWF furnace upgraded with an internal retort was used to anneal samples of Cu–CNT and Ni–CNT composites at 673, 873, 1073 and 1173 K under argon. The heating rate was fixed at 5 K min−1 and the target temperature was maintained for 30 min (but only 15 min at 1173 K). The furnace was then left to cool down overnight until room temperature was reached.
2.3 Physical characterization
Table 2 summarizes the physical characterization that was done on the samples. The sheet resistance and the TCR were measured on the CNT layers used to fabricate the composites. Oxidized CNT (non-coated), CNT@PdaCu, and CNT@PdaNi layers are compared to assess the effect of the coating on the CNT electrical properties. The effect of the compression of the carpet at 500 kg cm−2 is also verified. One Cu–CNT composite sample and one Ni–CNT composite sample were cut into pieces to perform the annealing at different temperatures and to do the electrical measurements (sheet resistance, TCR, and ampacity). The morphology of each sample was characterized using SEM. EDX was performed on CNT carpet to highlight the presence of Cu and Ni in the CNT@PdaCu and CNT@PdaNi carpets, respectively.
Table 2 Summary of the characterized samples
| |
Sheet resistance |
TCR |
SEM |
Ampacity |
EDX |
| Oxidized CNT carpet |
✓ |
✓ |
✓ |
|
✓ |
| CNT@PdaCu carpet |
✓ |
✓ |
✓ |
|
✓ |
| CNT@PdaNi carpet |
✓ |
✓ |
✓ |
|
✓ |
| Compressed oxidized CNT carpet |
✓ |
✓ |
✓ |
|
✓ |
| Compressed CNT@PdaCu carpet |
✓ |
✓ |
✓ |
|
✓ |
| Compressed CNT@PdaNi carpet |
✓ |
✓ |
✓ |
|
✓ |
| Cu–CNT composite |
✓ |
✓ |
✓ |
✓ |
|
| Annealed at 673 K |
✓ |
✓ |
✓ |
✓ |
|
| Annealed at 873 K |
✓ |
✓ |
✓ |
✓ |
|
| Annealed at 1073 K |
✓ |
✓ |
✓ |
✓ |
|
| Ni–CNT composite |
✓ |
✓ |
✓ |
✓ |
|
| Annealed at 673 K |
✓ |
✓ |
✓ |
✓ |
|
| Annealed at 873 K |
✓ |
✓ |
✓ |
✓ |
|
| Annealed at 1073 K |
✓ |
✓ |
✓ |
✓ |
|
| Annealed at 1173 K |
✓ |
✓ |
✓ |
✓ |
|
2.3.1 Scanning electron microscopy (SEM) and energy dispersive X-ray spectroscopy (EDX). SEM and EDX were carried with an FEI Helios NanoLab™ 650 instrument. Sample cross-sections were observed using a 10 kV acceleration voltage in order to evaluate the degree of metal filling in the composite layers. Furthermore, all composite lines used for ampacity characterization were individually measured to determine their thickness accurately. CNT layers were also observed before and after compression. EDX was used to confirm the presence of copper and nickel in the CNT@PdaCu and CNT@PdaNi carpet samples.
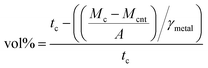
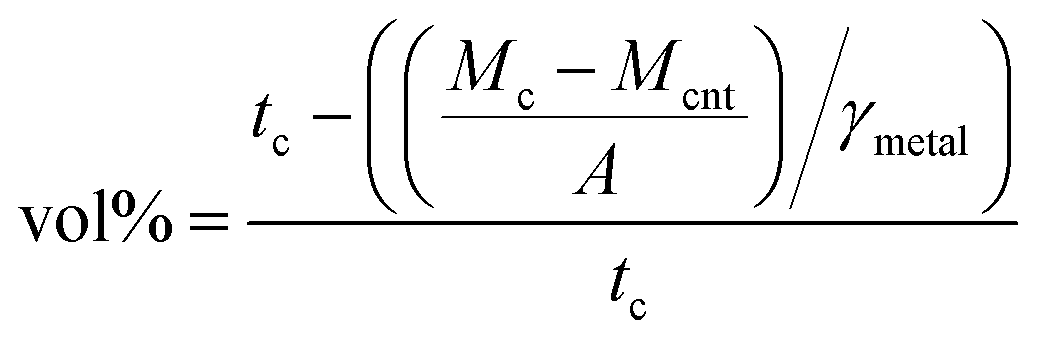
2.3.2 Composite CNT volume percentage and specific mass characterization. The volume percentage of CNT (CNT vol%) of the composite was measured before the annealing of the samples using| |
 | (1) |
where tc is the thickness of the composite, Mcnt is the mass of the CNT carpet, Mc is the mass of the composite, A is the area of the sample, and γmetal is the specific mass of Cu (8.96 g cm−3) and Ni (8.9 g cm−3).3 The CNT vol% was also determined for each sample used in the resistivity measurements. The average thickness of each sample was obtained from 15 measurements made with a micrometer. The CNT vol% and specific mass errors originate from the thickness variation.
2.3.3 Sheet resistance and TCR measurement on CNT layer samples. A four-probe measurement (1 mm space between probes) was used to obtain the sheet resistance and TCR of the oxidized CNT, CNT@PdaCu, and CNT@PdaNi carpets before and after compression. The TCR of the CNT carpets was obtained by measuring the sheet resistance between 298 and 443 K (using a temperature-controlled support and a Keithley 2634 B source-meter). The TCR and sheet resistance measurements were taken each time on three carpets of each type. The TCR was calculated from| | |
R = R0(1 + α(T − T0))
| (2) |
where R0 is the sheet resistance at room temperature and α is the TCR.
2.3.4 Resistivity and TCR measurement on CNT–metal composite samples. The resistance was measured between 298 and 443 K on 0.5 × 0.5 cm2 samples using the van der Pauw method. The samples were immersed in a temperature-controlled dielectric oil bath (Wacker AK 100 silicone oil – Lauda ECO RE 415). Resistance was measured three times at each temperature. Composites, annealed composites and reference samples (pure Ni and pure Cu) were characterized. The resistivity standard deviation arose mainly from the standard deviation of thickness (Fig. 7). The TCR is independent of the thickness. The TCR error is low and arises only from the errors made during the resistance measurement.
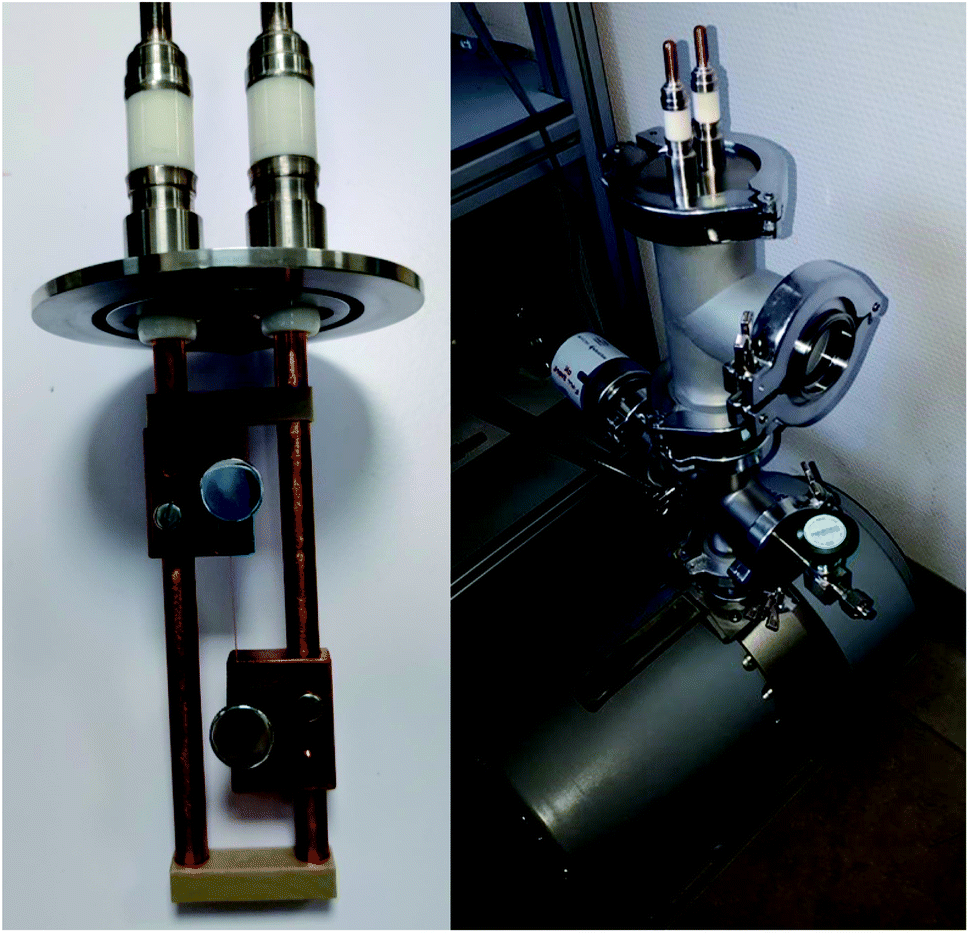
2.3.5 Ampacity measurement. Ampacity measurements were performed using a homemade setup (Fig. 2) allowing to control the distance between electrodes (set to 0.5 cm) and the pressure (set to 0.5 mbar) to be carefully controlled. The lines were fabricated by stamping the foils with two razor blades clamped together. The width of the lines were measured by optical microscopy (250 μm). The current was increased at a 0.5 A s−1 rate while the voltage was measured. The maximum current density (at line failure) was taken as ampacity. The ampacity was measured on three lines of each type of material. The main contribution to the ampacity standard deviation arises from the standard deviation of the line thickness.
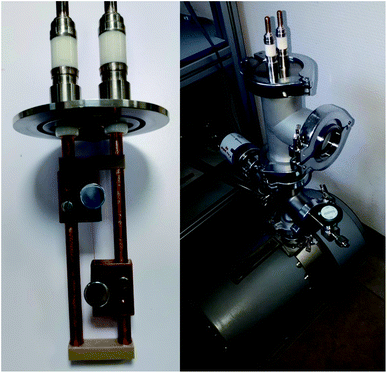 |
| | Fig. 2 Setup used for ampacity measurements. The sample line is mounted on a support allowing to control the distance between the two electrodes (left). This support is inserted in a pressure controlled chamber (right). | |
3 Results
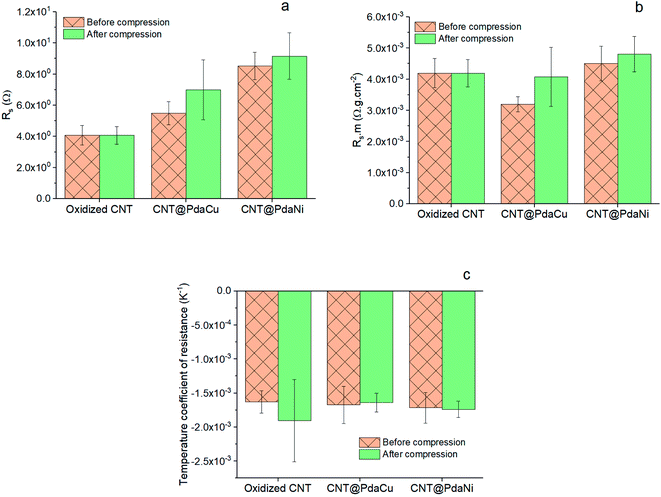
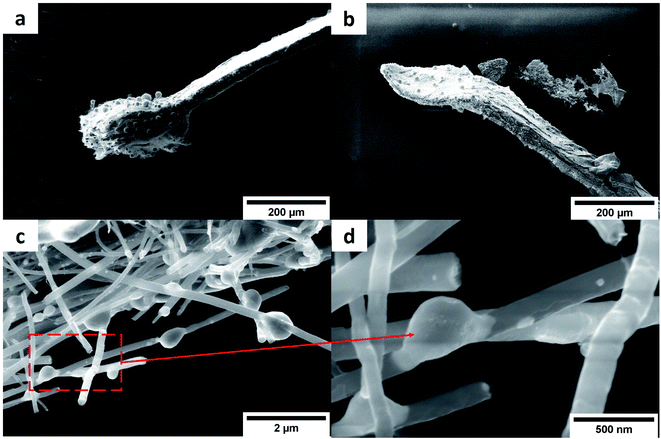
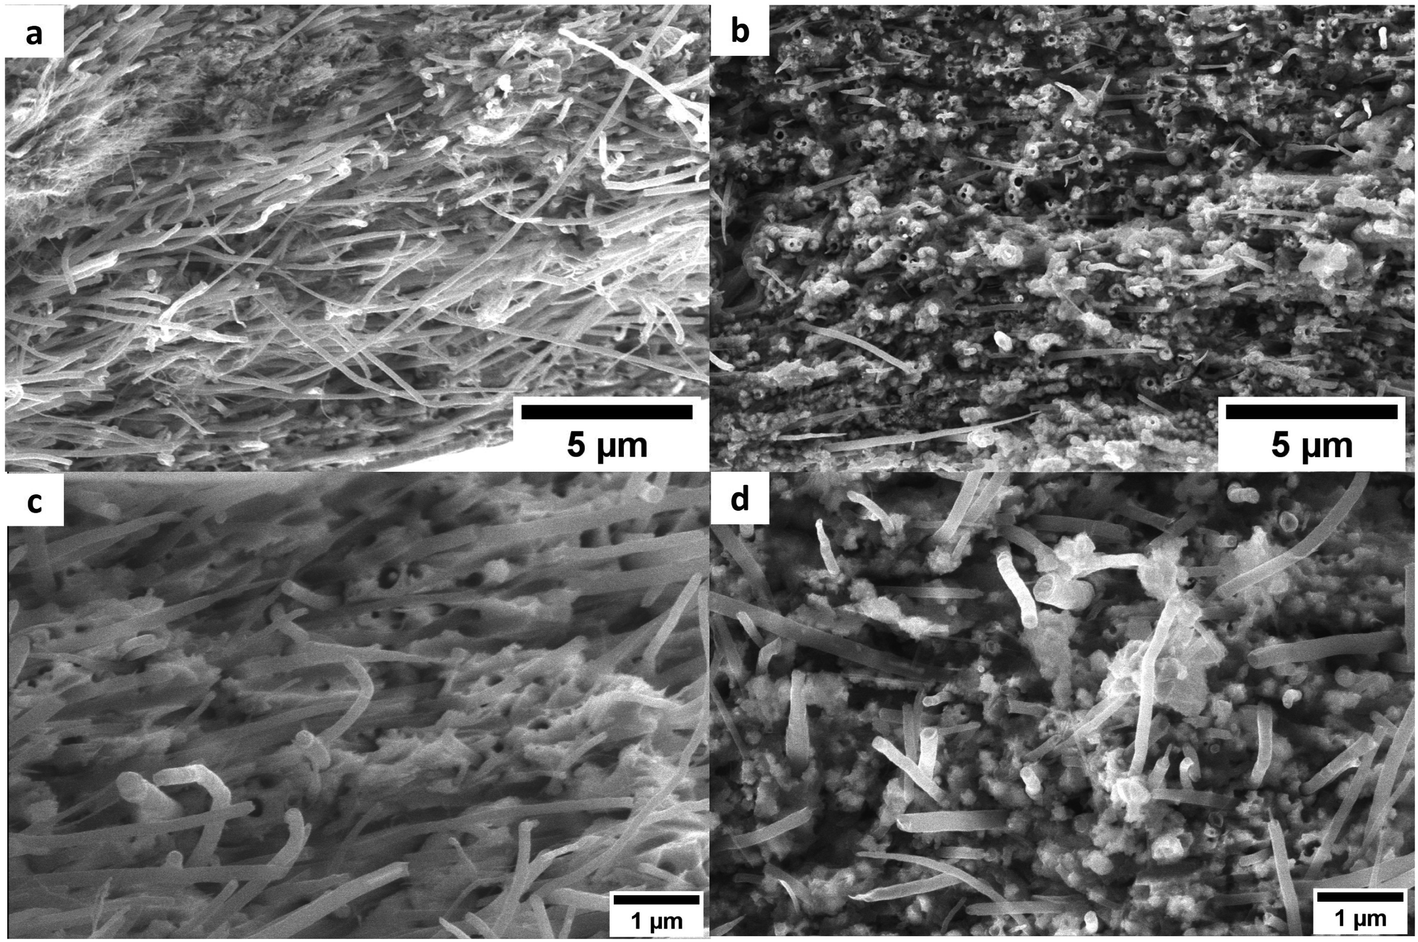
In our previous work,21 we used XPS to evidence the presence of the Cu-doped Pda on our CNT after a similar coating protocol. Here, Cu and Ni were directly confirmed by EDX (Fig. S1 in the ESI) in the CNT@PdaCu and CNT@PdaNi carpets, respectively. Aiming to increase the CNT vol% in our CNT–metal composites, we compressed the CNT layers before the metal was electroplated. Fig. 3 shows SEM pictures of CNT carpets, made with (Fig. 3a and b) oxidized CNT, (Fig. 3c and d) CNT@PdaCu, and (Fig. 3e and f) CNT@PdaNi, before (left) and after compression (right). CNT carpets feature an entangled network of CNT with planar isotropic orientation. CNT carpets obtained by filtration have an irregular thickness characterized by bulges (Fig. 3a, c and e). A compression step at 500 kg cm−2 reduces the height of the bulges and flattens the sample (Fig. 3b, d and f).
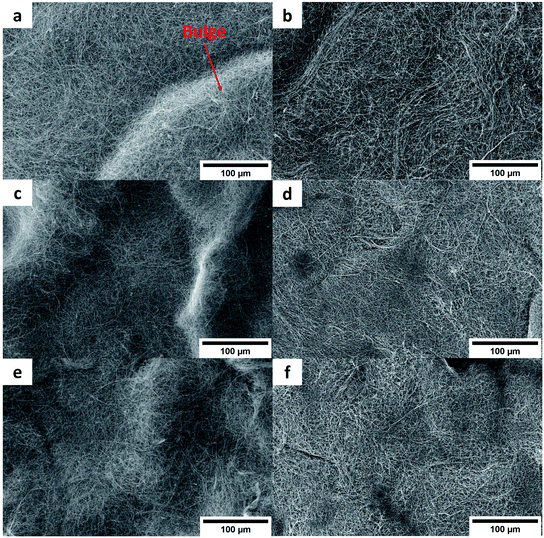 |
| | Fig. 3 SEM top-views of Oxidized CNT (a and b), CNT@PdaCu (c and d), and CNT@PdaNi (e and f) carpets before (left) and after compression (right). | |
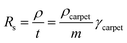
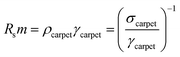
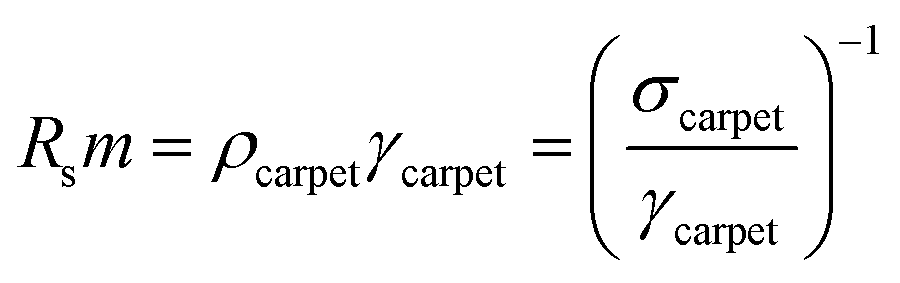
As highlighted in Fig. 4a, the sheet resistance of the compressed layers of oxidized CNT, CNT@PdaCu, and CNT@PdaNi are similar to their respective values before compression (comprised within the error bar). The large difference of sheet resistance between the oxidized CNT, the CNT@PdaCu and the CNT@PdaNi samples is due to a variation of the quantity of CNT in each kind of sample. In order to factor in this difference, we define the specific resistivity as the inverse of the specific conductivity derived from the following equations:
| |
 | (3) |
and
| |
 | (4) |
where
m is the measured mass per square centimetre of the CNT carpet,
ρ is the resistivity, and
γ is the specific mass.
Fig. 4b shows that compressed CNT@PdaCu, CNT@PdaNi, and un-compressed CNT@PdaNi carpets have a similar specific resistivity to oxidized CNT carpets, suggesting that the Pda coating does not hinder the electron conduction through the CNT carpets. Interestingly, the un-compressed carpet of CNT@PdaCu would be even more conductive than the non-coated system, although the rationale of this remains unclear. The TCR of all the samples is negative (
Fig. 4) as expected for large diameter MWCNT
6,7,21 and has a similar value independent of the coating or compression steps. Compared to the TCR of carpets containing oxidized CNT with a length of 200 μm and a diameter of 80–90 nm (see our previous paper
21), we find here a similar TCR in our oxidized CNT systems (800 μm, 80–90 nm), suggesting that the variation of the CNT length does not drastically affect the TCR. Furthermore, in our previous paper, we also observed that the TCR of CNT coated with Cu-doped Pda was lower than un-coated CNT. In this paper, values of TCR are similar for all samples. This is attributed to the much lower amount of the dopamine used in the coating solution (0.065 mM in this paper instead of 0.527 mM (ref.
21)). This result suggests that a higher concentration of dopamine in the coating solution can lead to the TCR value of CNT carpets being tailored (decreased), and could be attributed to the log(
σ) ∝−1/
T semi-conductor behaviour of dry Pda.
30,31 It is beyond the scope of this paper to study this phenomenon which calls for additional experiments.
 |
| | Fig. 4 Sheet resistance (a), Rs m (b), and TCR (c) of CNT carpet samples before and after compression. | |
CNT vol% as high as 42.5 and 43.3% was obtained in the Cu–CNT and Ni–CNT composites, respectively (Table 3). The average specific mass of Cu–CNT and Ni–CNT composites is 5.38 and 5.24 g cm−3, respectively, which is significantly lower than pure Cu (8.96 g cm−3) and Ni (8.9 g cm−3).3 The variation of CNT vol% in Table 3 originates from the increase of the current density on the sample edges;32 leading to metal over-deposition on the top of the composite layer for the pieces taken from the sample edges.
Table 3 CNT vol% and specific mass of Cu–CNT and Ni–CNT composites samples used for the resistivity measurements
| Samples |
CNT vol% |
Specific mass (g cm−3) |
| Cu–CNT composite not annealed |
45.9 ± 2.2 |
5.05 ± 0.20 |
| Cu–CNT composite 673 K |
41.7 ± 2.6 |
5.46 ± 0.24 |
| Cu–CNT composite 873 K |
36.2 ± 4.1 |
5.95 ± 0.38 |
| Cu–CNT composite 1073 K |
46.1 ± 8.4 |
5.03 ± 0.79 |
| Average of Cu–CNT composites samples |
42.5 ± 6.3 |
5.38 ± 0.59 |
| Ni–CNT composite not annealed |
47.8 ± 2.8 |
4.87 ± 0.26 |
| Ni–CNT composite 673 K |
40.9 ± 7.8 |
5.45 ± 0.62 |
| Ni–CNT composite 873 K |
38.7 ± 13.3 |
5.6 ± 1.22 |
| Ni–CNT composite 1073 K |
47.8 ± 4.1 |
4.89 ± 0.38 |
| Ni–CNT composite 1173 K |
41.2 ± 4.3 |
5.41 ± 0.39 |
| Average of Ni–CNT composites samples |
43.3 ± 8.1 |
5.24 ± 0.73 |
Fig. 5 shows the cross-sections of the Cu–CNT (Fig. 5a and c) and Ni–CNT (Fig. 5b and d) composites, featuring an isotropic orientation of the CNT and highlighting the presence of a continuous metal matrix in the interstices between the CNT. In literature, the deposition of a continuous copper matrix in the CNT interstices is usually obtained using organic plating solution in order to facilitate solution penetration in dense and hydrophobic CNT carpets.10,16,24 Indeed, it is worth noting that, when using only an aqueous solution, a high degree of filling of the CNT network by Cu seems to be limited to composites with a thickness of around 8 μm.12 Our method enables the fabrication of thicker composites (e.g. composites with a thickness ≈ 30 μm were obtained here). Several authors stressed the interest of chemically functionalizing the CNT surface to improve the homogeneous growth of copper in a CNT matrix. In particular, oxygen and hydroxide surface chemical groups can enhance the binding and nucleation of copper on CNT24,33,34 following the equation of nucleation rate35
| |
J = K![[thin space (1/6-em)]](https://www.rsc.org/images/entities/char_2009.gif) exp(−ΔGc/KBT) exp(−ΔGc/KBT)
| (5) |
where
J is the rate of nucleation, Δ
Gc is the critical free energy, and
K is a constant taking into account the number of adsorption sites and the rate of attachment of atoms. In our specific case, the Pda coating is hydrophilic
36 and drastically increases the penetration of the aqueous plating solution inside the CNT carpet. Furthermore, we already highlighted
21 the presence of partially reduced copper ions in Pda that are cross-linked by the catechols/quinones moieties of Pda. Therefore, we believe that the metal-doped Pda coating provide a very high density of Cu ions trapped at the CNT surface. The nucleation rate is increased by this “internal” source of ions which are further reduced during the first steps of the electroplating process. They act as effective nucleation sites for the metal ions contained in the solution. However, when put in contact with a polar solvent, the CNT layer was observed to swell. To avoid this phenomenon and attain a high CNT vol%, we developed a compression system (
Fig. 1) preventing the swelling of the CNT layer while remaining fully permeable to the electroplating solution.
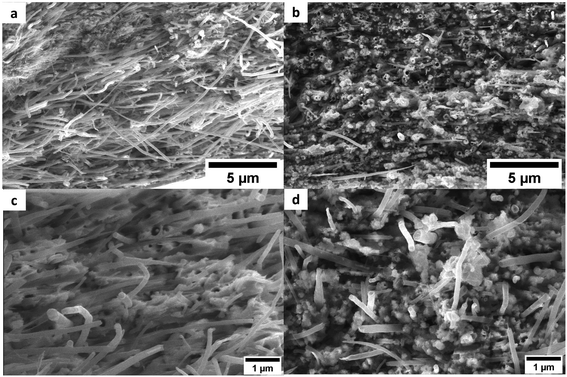 |
| | Fig. 5 SEM cross-sections of Cu–CNT (a and c) and Ni–CNT (b and d) composites before annealing. | |
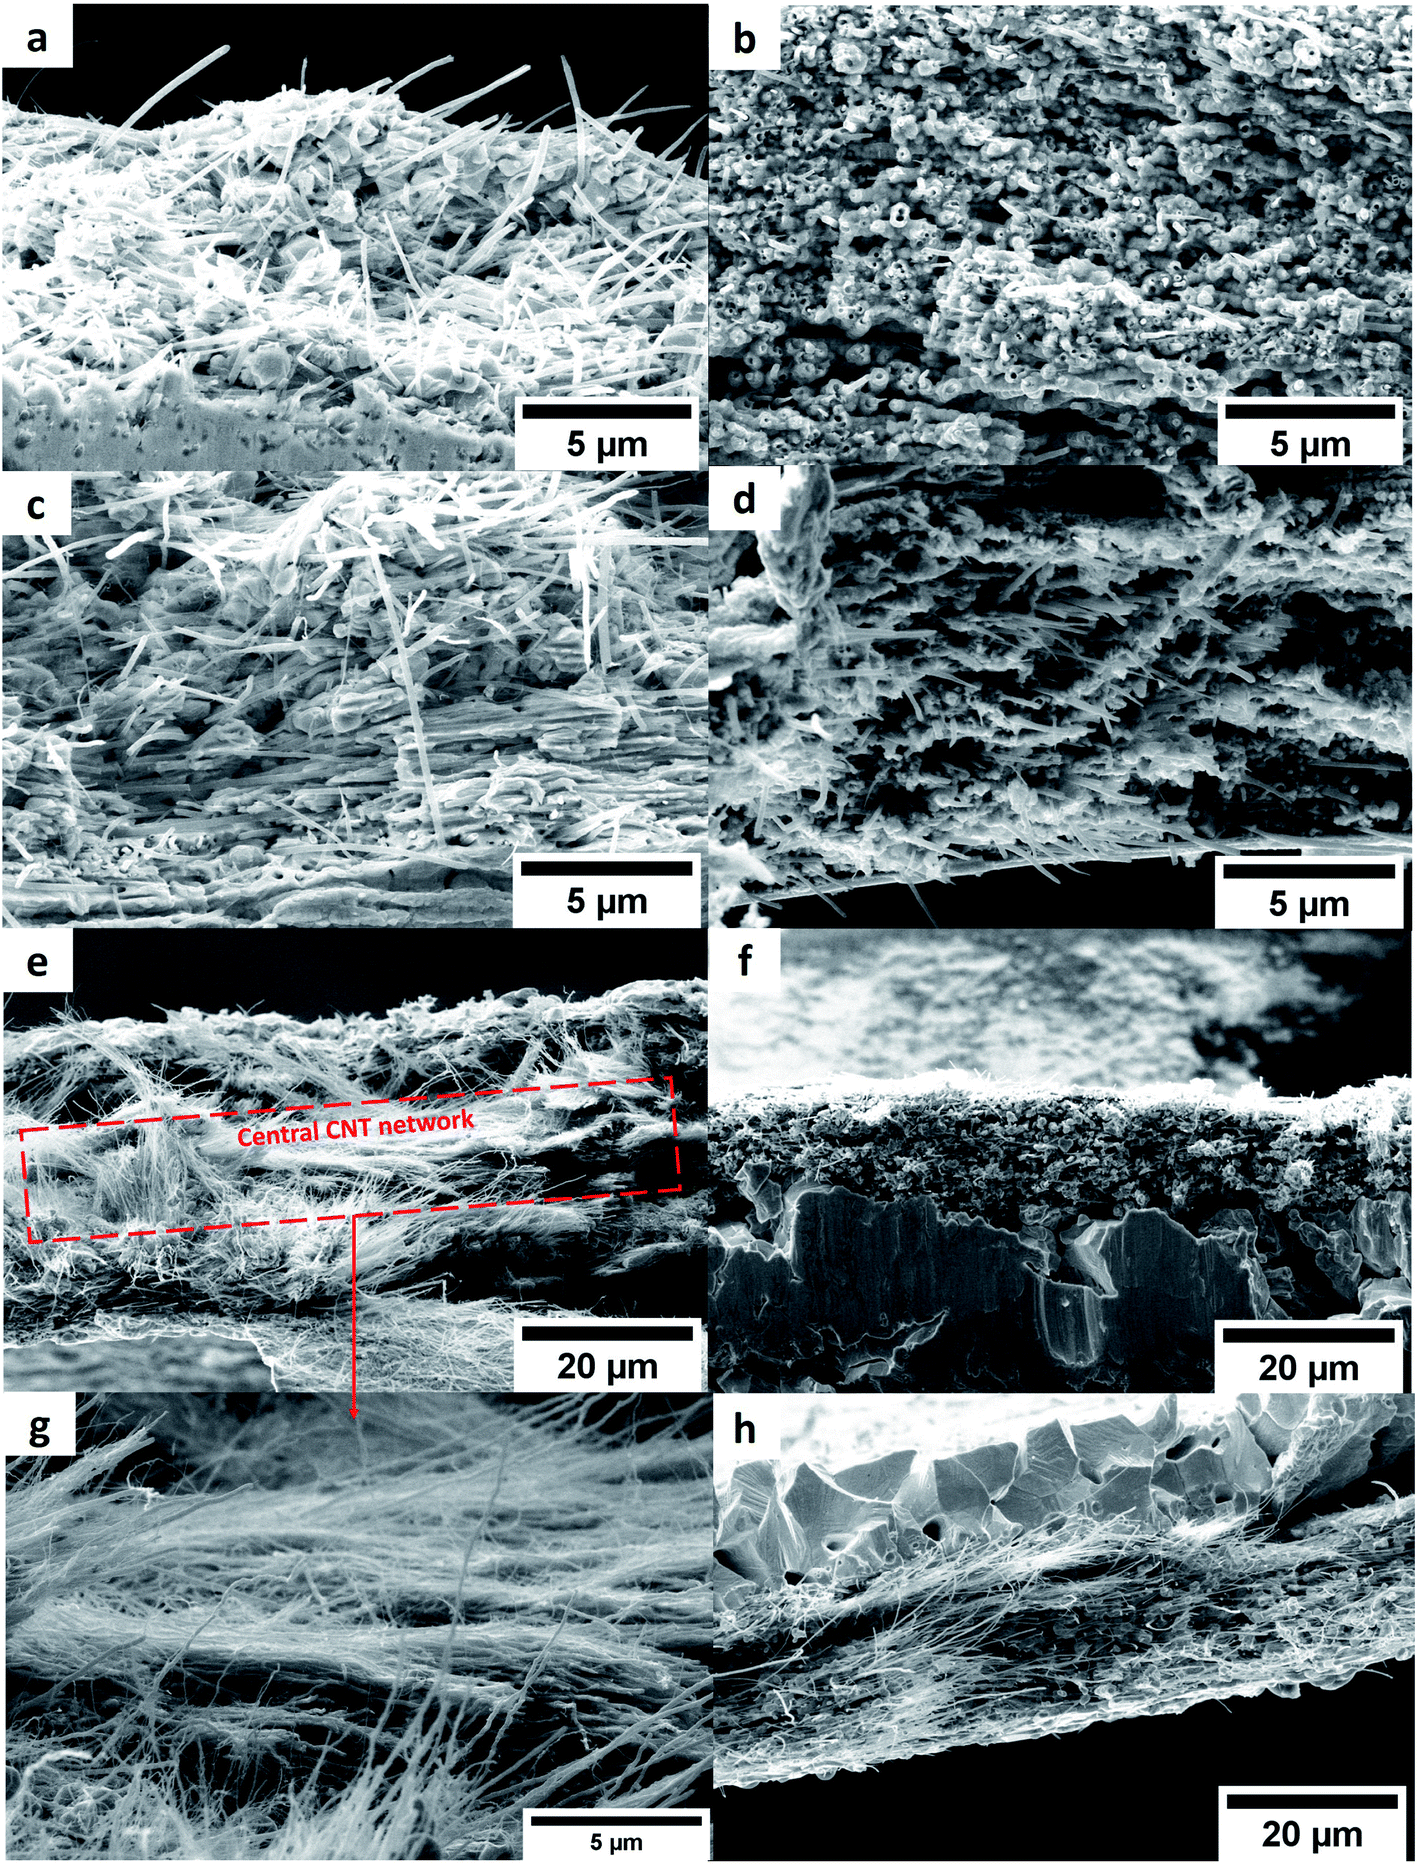
Fig. 6a–d shows that the interstices between the CNT in the composites remain filled by a continuous metal matrix after annealing at 673 and 873 K. However, annealing at 1073 and 1173 K triggers a phase separation between metals and the CNT network; in the Cu–CNT composite annealed at 1073 K (Fig. 6e and g), the central CNT network is almost completely depleted of Cu. In the Ni–CNT composite, a large number of Ni nodules are still visible in the vicinity of the CNT network when samples are annealed at 1073 K and 1173 K (Fig. 6f and h). We attribute this difference to the preferred wetting ability of Ni onto CNT (in comparison to Cu).22 Compared to the weak coupling between C-p and Cu-d orbitals, Ni can form strong chemical bonding with CNT due to the overlap between the C-p and Ni-d states20,37 and can even lead to carbide phases when CNT are annealed at high temperatures (≥1073 K).19,20
 |
| | Fig. 6 SEM cross-sections of Cu–CNT (left) and Ni–CNT (right) composites annealed at 673 (a and b), 873 (c and d), 1073 (e and f), and 1173 K (h). Zoom of the central CNT network of Cu–CNT annealed at 1073 K (g). | |
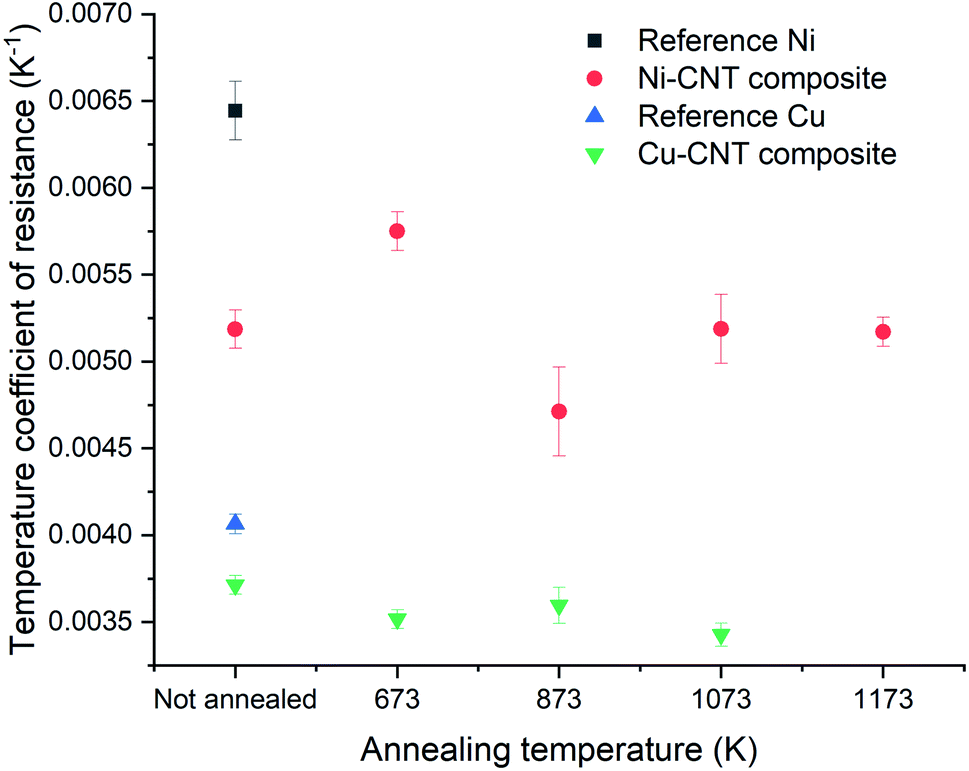
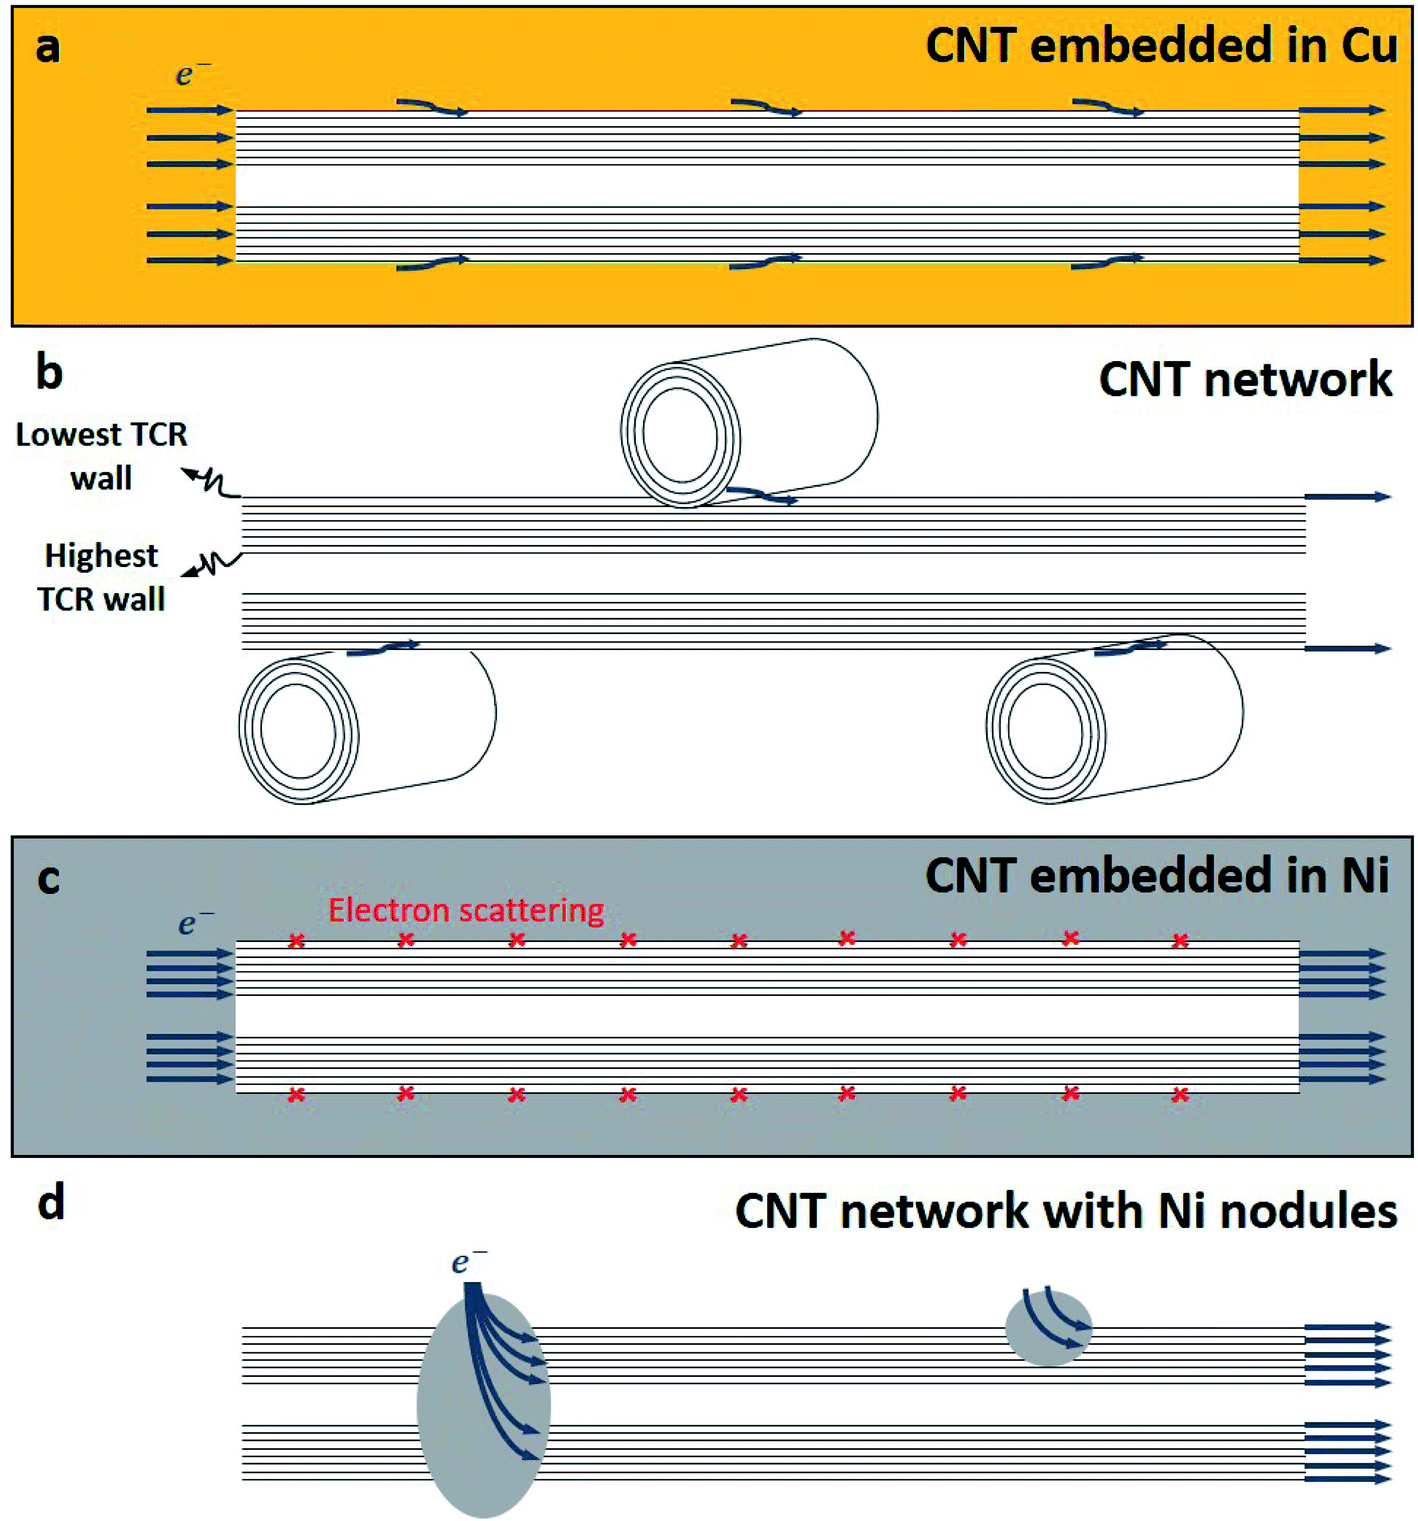
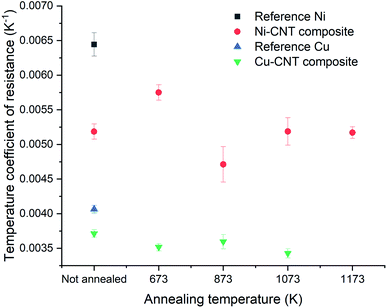
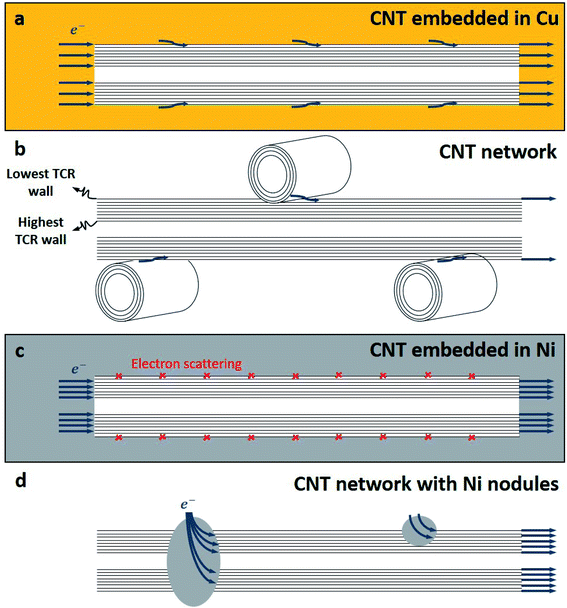
The resistivity of the Cu–CNT composite sample is 4.32 × 10⁻⁶ Ω cm and is 2.5× the one of the reference copper (at 298 K – Fig. 7a). Compared to the Cu–CNT composites reported in the literature, we find that our composite with non-aligned MWCNT shows a resistivity (at room temperature) about four times lower than the resistivity of a highly filled Cu-MWCNT composite (45% of CNT in volume) with aligned CNT (Sundaram et al. in Table 1). We may expect that the alignment of the CNT along the flow of the electrical current leads to the decrease of the overall resistivity of the composite.18,19,38 However, one should note that the diameter of the MWCNT used by Sundaram et al. is 20 nm while ours is 80–90 nm. Acknowledging that electron mean free path grows in proportion with the diameter of the wall and that more conduction channels are available to electrons in larger diameter walls,6 Naeemi et al.7 calculated that, for a sufficient CNT length, increasing the diameter of a MWCNT can significantly increase its conductivity (e.g. for l ≈ 100 μm, a MWCNT with a diameter of 100 nm would have a conductivity ∼3× higher than that of an MWCNT with a diameter of 20 nm). Hence, our lower resistivity, compared to published results, could be partially attributed to the large dimensions of our MWCNT. When samples are annealed at 673, 873 and 1073 K, the composite resistivity becomes 2.77, 2.34, and 3.52× higher than that of the reference copper, respectively. It should be recalled that CNT vol% is not equal in all samples and can induce a variation of the composite resistivity. In order to factor in this variation and more carefully measure the effect of the annealing on the electrical properties, we use the specific resistivity (Fig. 7b) of the composite (2.18 × 10⁻⁵ Ω g cm−2) which is 1.44× higher than the specific resistivity of pure copper, and becomes 1.69, 1.55 and 1.98× higher when annealed at 673, 873, and 1073 K, respectively. The TCR of the Cu reference sample (0.00406 K−1 in Fig. 8) is close to values reported in literature (between 0.00369 and 0.00409 K−1 at room temperature11). The TCR of the Cu–CNT composites vary from 0.00343 K−1, when annealed at 1073 K, to 0.00371 K−1 when not annealed. This represents a decrease of 15.5% and 8.6%, respectively, in comparison to the value measured for the reference copper. The non-alignment of CNT is expected to decrease their contribution to the current conduction as electron is mainly transported along the tube axis.8,10,16 Sundaram et al.16 shows that the TCR drops progressively with the filling degree of the Cu–CNT composite (from 0.003, when poorly filled, to 0.0017 K−1 when highly filled) due to the increase of the CNT–Cu contact surface. We look closely at the morphology of the composites (Fig. 5 and 6) to explain a large resistivity increase (at 1073 K) alongside a stable TCR, in comparison to non-annealed composites. We suggest that after annealing at 1073 K (Fig. 6e), the central network of CNT has a very large resistivity in the direction perpendicular to the foil because of the Cu–CNT contact surface reduction. The resistivity increase is attributed to the lower contribution of the CNT network to electron transport and to the confinement of the current in the top copper crust (where electrical contact was taken for the measurement). The stability of the TCR in the composite after annealing (compared to before annealing) is attributed to a decrease of the effective TCR of the CNT network (Fig. 9a and b), because of the CNT–CNT side contacts favouring electron transport only through the outer walls23 (outer walls have a lower TCR than inner walls6) counteracting the lower contribution of the CNT network to electron transport.
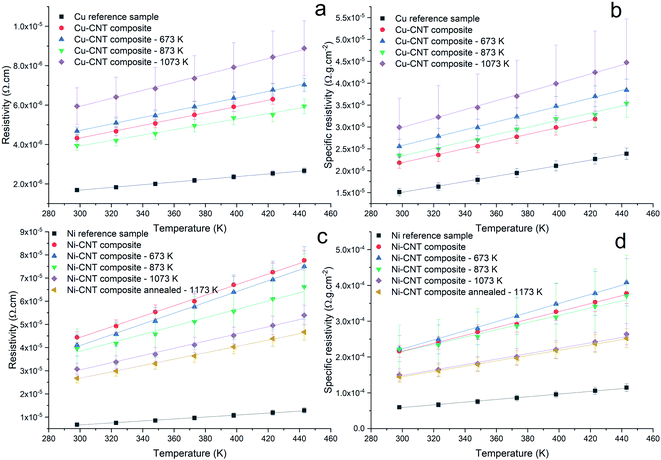 |
| | Fig. 7 Resistivity ρ and specific resistivity  versus temperature of Cu–CNT (a and b) and Ni–CNT (c and d) composites. versus temperature of Cu–CNT (a and b) and Ni–CNT (c and d) composites. | |
 |
| | Fig. 8 Temperature coefficient of resistance of Ni–CNT and Cu–CNT composites. | |
 |
| | Fig. 9 Schema of proposed mechanism of electron transport in case of (a) CNT embedded in Cu in Cu–CNT composite, (b) CNT central network in Cu–CNT composite after annealing at 1073 K, (c) CNT embedded in Ni in CNT–Ni composite, and (d) CNT network highly interconnected with Ni nodules after annealing at 1073 and 1173 K. | |
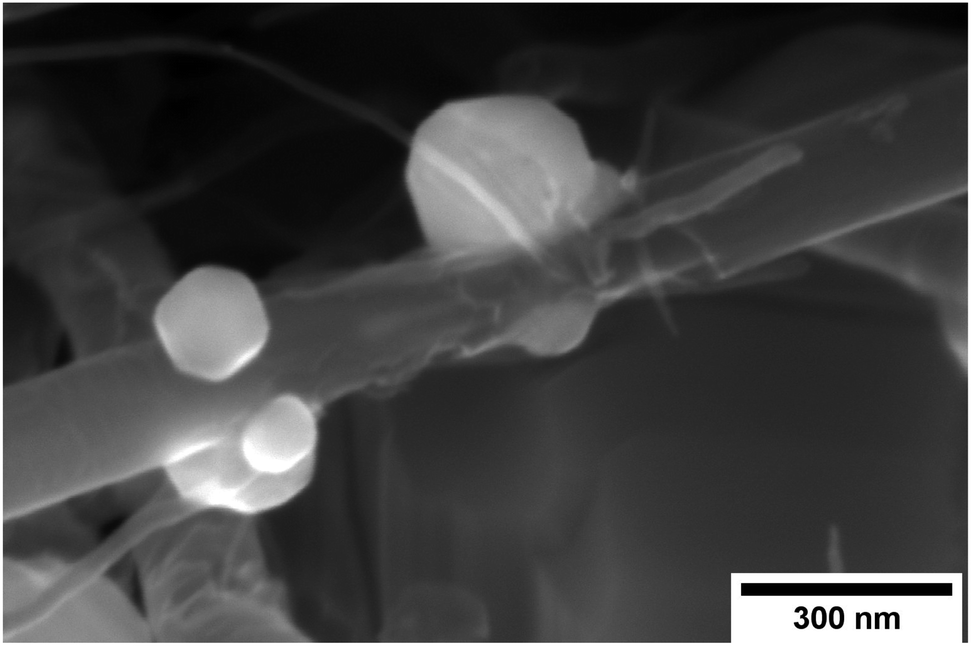
In Fig. 7c, the resistivity of the non-annealed Ni–CNT composite (4.44 × 10⁻⁵ Ω cm) is 6.6× higher than that of pure nickel. This is also ∼4.2 times higher than the resistivity a Ni–CNT composite obtained the literature and integrating 5% vol. of CNT (∼ 1.05 × 10⁻⁵ Ω cm).39 Annealed samples have resistivities that are 6.1, 5.9, 4.6, and 4.0× higher than pure nickel when annealed at 673, 873, 1073, and 1173 K, respectively. The specific resistivity (at room temperature) of the Ni–CNT composite (2.16 × 10⁻⁴ Ω g cm−2) is 3.6× higher than pure Ni and remains the same after annealing at 673 and 873 K. The specific resistivity of Ni–CNT composites annealed at 1073 and 1173 K (1.44 and 1.5 × 10⁻⁴ Ω g cm−2, respectively) drops by 33.3 and 30.5%, respectively, to reach values that are roughly 2.5× higher than those of pure Ni. The TCR of the Ni–CNT composite is 0.00519, representing a 18.9% decrease in comparison to pure Ni (0.00644 K−1). It ranges from 0.00575 to 0.00471 (a 10.7 and 26.8% decrease) when annealed at 673 and 873 K, respectively. It stabilizes around 0.00519 when annealed at 1073 and 1173 K. In comparison to the Cu–CNT composite, the higher magnitude of the TCR decrease in Ni–CNT system indicates that the current flowing through CNT is favoured when Ni is used. It is still being debated wether Cu–CNT has a higher or lower contact resistance than Ni–CNT.20,37 However, the calculations of Milowska et al.20 have shown that Ni would be able to increase the local density of state at the CNT–Ni interface thus increasing the injection of electrons into CNT in comparison to Cu–CNT materials. For our Ni–CNT composite, CNT are fully embedded within the Ni matrix, promoting electrical contact on CNT sides and ends. When the Ni–CNT system is annealed at 1073 and 1173 K, it leads to a layered system constituted of pure Ni and a layer of CNT highly interconnected by Ni nodules. In the fully embedded system, electrons can be efficiently injected, at the CNT end contact, into all the CNT walls (Fig. 9c). When annealed at 1073 and 1173 K, Ni nodules make electrical contact with CNT inner walls (Fig. 10a) due to the high carbon solubility in Ni20 (Fig. 9d). The apparent TCR remains equivalent before and after annealing; in both cases, the electrons are efficiently injected into the inner walls of the CNT. After annealing at 1073 and 1173 K, the resistivity is decreased, because of the formation of a pure and dense Ni layer on top of a CNT network highly interconnected with Ni nodules. In the CNT–Ni layer, CNT are highly interconnected with Ni nodules while the CNT outer walls got rid of Ni encapsulation, which is known to promote localized electronic states20 all along the CNT–Ni interface. Hence, we believe that the CNT network with Ni-dot contacts, which enable the electronic conduction through the inner walls of CNT, is a key feature for fabricating highly conductive Ni–CNT systems.
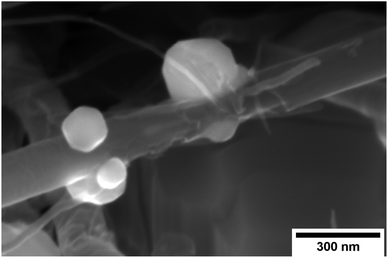 |
| | Fig. 10 SEM images of Ni–CNT composite annealed at 1173 K. | |
For reference copper (Fig. 11a), we observed a higher ampacity with thinner lines (for a same inter-electrode distance and same line width). The ampacity of an electrical line is principally determined by the exchange of heat with its environment.40,41 When the line reaches a temperature higher than its operational temperature (depending on the failure mechanism, e.g. melting or electromigration), it is doomed to fail. We use a rapid ramp of current increase (0.5 A s−1), and, in our case, we attribute the failure of the line to metal melting. In our ampacity measurement setup, the line was clipped at the electrodes (heat sink) and the surface of contact between the electrode and the line was proportional to the width of the line. Thus, the heat produced by Joule heating increases with the line thickness while the heat dissipated at the electrode is limited by the line width, leading to a 38% increase in ampacity for thin lines (7 μm) in comparison to thicker lines (47 μm). Furthermore, for pure copper, we observed a 25% increase in ampacity when the line was exposed to air, in comparison to low pressure conditions (Fig. 11b). We attribute this behaviour to the heat dissipation improvement in the presence of air. Literature reported that the line ampacity would be decreased when exposed to air due to oxidation.10,16 We attribute our higher ampacity, when exposed to air, to our higher current increase rate while testing the line (0.5 A s−1 vs. e.g. 1 mA s−1 (ref. 16)), leading to a significantly shorter time of exposure to oxidation. We deduce that, for a high current increase rate, heat dissipation by air leads to higher ampacity. It is worth noting that the literature also reports an increase in ampacity for shorter lines.12,27 This is, according to us, expected to be highly dependent on the measurement method (presence of a heat sink as atmosphere, substrate, …). Here, we highlight the importance of measuring reference lines and composite lines of the same geometry as the resulting ampacity variation can be in the same range of composite ampacity gain vs. copper reported in the literature (∼32%,27 ∼28%,16 ≥82%12). More generally, we stress the importance of measuring ampacity on reference lines and composite lines in the same conditions to allow a non-ambiguous comparison between copper and composite. The ampacity measurement parameters and ampacity values vary widely between the papers (Table 4). There is also sometimes deviation or potential deviation between the parameters used to measure reference Cu and Cu–CNT composites. As a consequence, it is difficult to compare the ampacity gains obtained in different works as they can involve different heat exchanges, chemical environments and probably failure mechanisms (e.g. electromigration vs. melting).
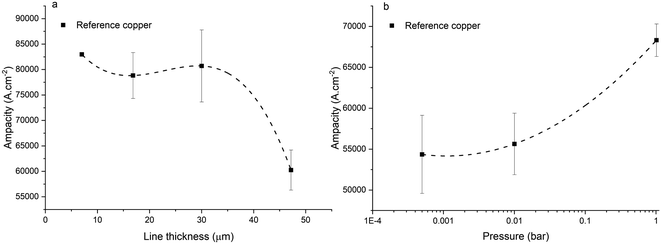 |
| | Fig. 11 Ampacity of reference copper for (a) different line thicknesses, and (b) different pressures (at same thickness and distance between electrodes). | |
Table 4 Summary of the measurement parameter in the literature. Line dimensions are given as length × width × thickness. The ampacity gain of Cu–CNT vs. Cu is given in %. * means that the value given in the paper was unclear/supposed for/by the reader. ** Study over several line lengths, ampacity taken for 17 mm. *** Cu–CNT composite ageing experiment was also carried at 108 A cm−2 over 1200 h
| Atmosphere |
Current ramp |
Substrate |
Lines dimensions |
Ampacity |
Reference |
| N/A |
N/A |
Free standing |
40 mm × 1 mm × 20.4 μm |
1.54 × 10⁴ A cm−2 (63%) |
Chen et al.24 |
| Cu: 40 mm × 1 mm × 18.3 μm |
Cu: 9.4 × 10³ A cm−2 |
| Ar |
N/A |
Free standing |
50 mm × 2 mm × 60 ≤ t ≤ 80 μm |
1.16 × 10⁴ A cm−2 (32%) |
Shuai et al.27 |
| Cu: 50 mm × 2 mm × 50 and/or 75 μm* |
Cu: 8,84 × 10³ A cm−2 |
| 10−3 Pa |
1 mA s−1 |
Free standing |
ø = 100 μm |
6.3 × 10⁴ A cm−2 (28%) |
Sundaram et al.16 |
| Cu: similar |
Cu: 4.9 × 10⁴ A cm−2 |
| Air |
N/A |
Free standing |
ø ≈ 10.88 μm for 1.5 ≤ l ≤ 17 mm |
2.74 × 10⁵ A cm−2 (∼82%)** |
Bazbouz et al.12 |
| Cu: ø = 50 μm for 1.5 ≤ l ≤ 17 mm |
Cu: ∼1.5 × 10⁵ A cm−2 |
| 1.3 × 10⁻⁴ Pa |
N/A*** |
Substrate |
50 μm × 800 nm × 900 nm |
6 × 10⁸ A cm−2 (10000%) |
Subramaniam et al.10,28 |
| Cu: similar |
Cu: 6 × 10⁶ A cm−2 |
Fig. 12 shows samples used to measure the ampacity (lines of composites after the measurement). The failure of the sample were characterized by their melting. The failure zone of the Cu–CNT composite (Fig. 12a) lines is few hundred μm long and is featured by a swelled layer of CNT that is highly depleted of copper (only few copper globules remain). The failure zone had a similar morphology independent of the annealing of the composites and hence, of the initial degree of the copper filling. In the Ni–CNT composite case (Fig. 12b), the failure zone is not swelled and the remaining content of Ni in the CNT network is significantly larger than in the Cu–CNT composite lines (see also Fig. S2). Also, in the case of Ni–CNT materials, the morphology of the failure zone is independent of the annealing of the composite. We note the presence of Ni nodules, fusing CNT (Fig. 12c and d) in the Ni–CNT lines (failure zone) after the ampacity measurement and which are formed by Joule heating.
 |
| | Fig. 12 SEM image of the failure zone of (a) Cu–CNT and (b) Ni–CNT composites lines (both annealed at 873 K) after the ampacity measurement. Zoom on the line of Ni–CNT composite (annealed at 873 K) after ampacity measurement in the failure zone showing Ni nodules fused with CNT (c and d). | |
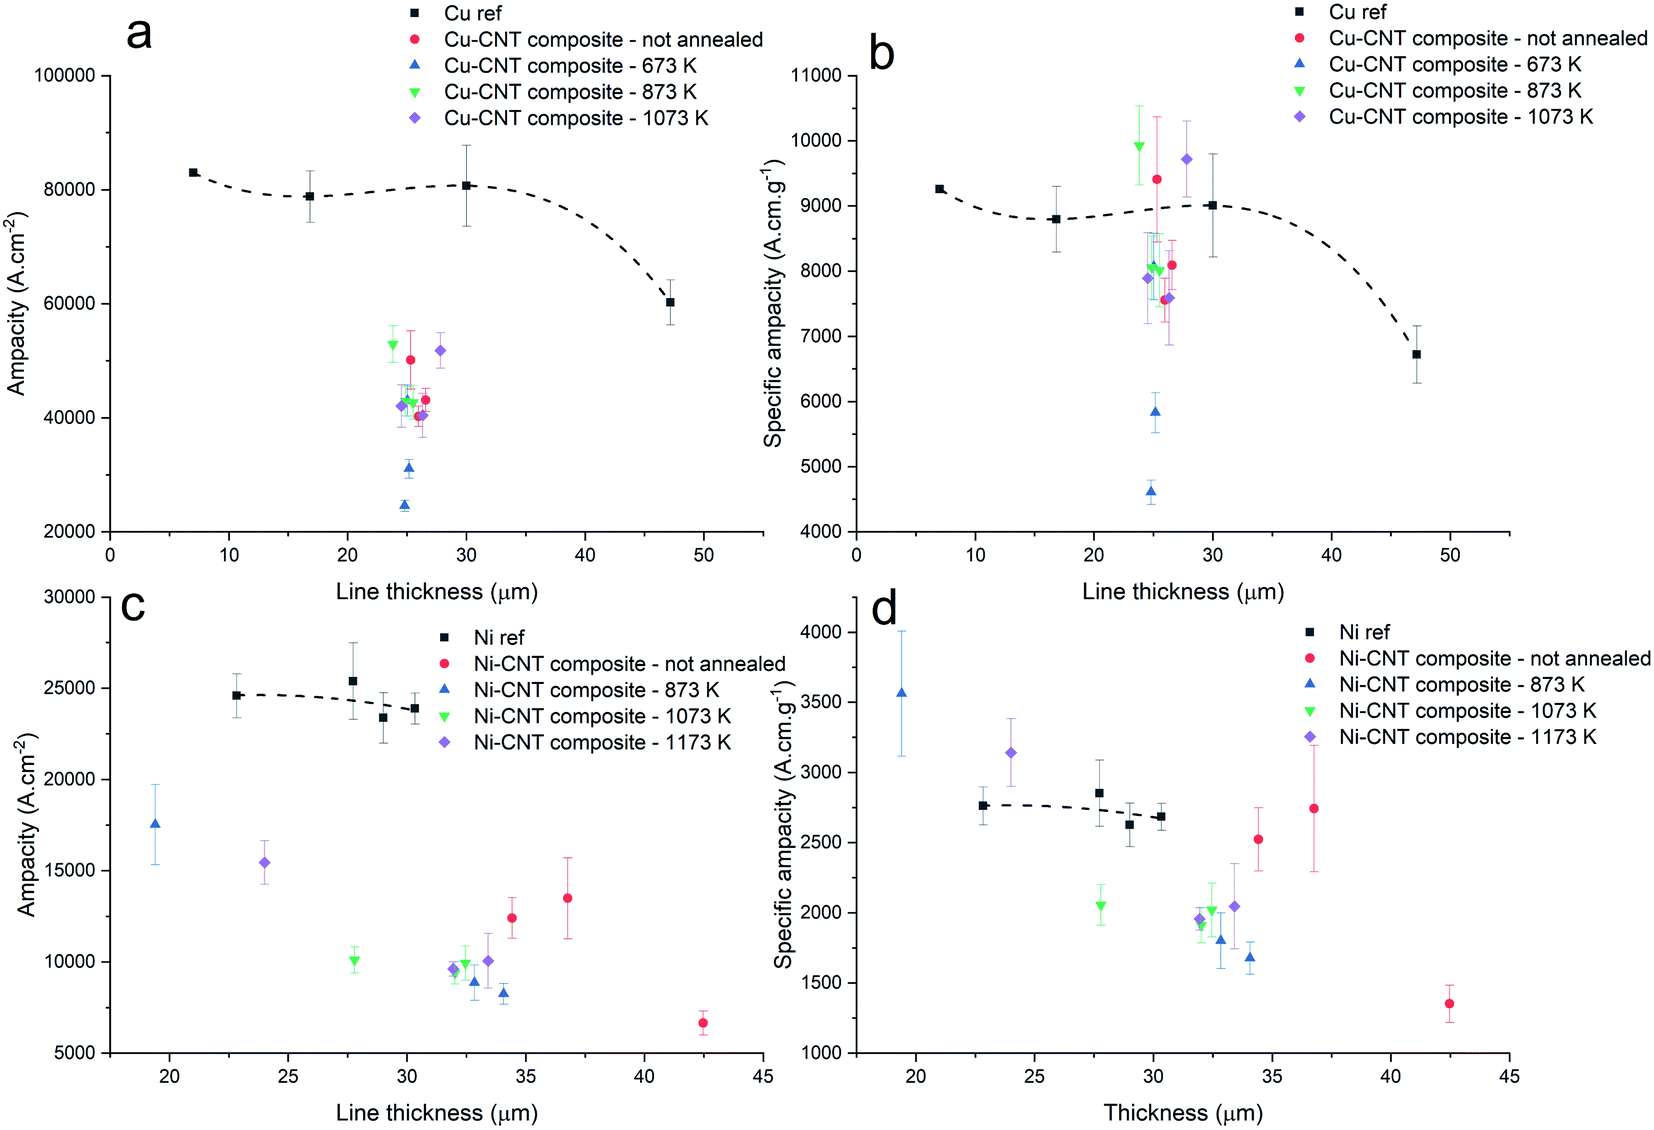
The composite ampacity is compared to the ampacity of reference copper lines with a similar thickness, the same measured pressure, same line width, and same inter-electrode distance. Most of the Cu–CNT lines had an ampacity between 40276 and 52929 A cm−2 (Fig. 13a) and a specific ampacity (Fig. 13b) between 7591 and 9930 A cm g−1. A few lines displayed a specific ampacity of 9409, 9722, and 9930 A cm g−1 (Cu–CNT composite, Cu–CNT composite annealed at 1073 K, and Cu–CNT composite annealed at 873 K, respectively), which is higher than pure copper (around 9000 A cm g−1). In contrast with a recent paper,24 our results indicates that a composite characterized by a randomly aligned CNT carpet highly filled by copper has a lower ampacity than pure copper. Shuai et al.27 also reported an ampacity increase of 32% (with 1.04 vol% of aligned MWCNT). Sundaram et al.16 reported a 28% increase in a composite constituted of 45% vol. of aligned MWCNT (but with a room temperature resistivity four times higher than ours). And finally, Subramaniam et al.10,28 reported an ampacity one hundred times higher than pure copper. For Ni–CNT composite samples, most of the lines had an ampacity between 8250 and 13500 A cm−2 while pure Ni displayed ampacity between 23900 and 25400 A cm−2 (Fig. 13c). The majority of the lines had a lower specific ampacity than pure Ni, while a few lines presented a specific ampacity of 3150 and 3560 A cm g−1 in comparison to a value of around 2700 A cm g−1 for pure Ni (Fig. 13d). Interestingly, the lowering of the resistivity in Ni–CNT composites when annealed at 1073 and 1173 K did not improve the ampacity of the system while, similarly, the increasing of the resistivity of the Cu–CNT composite when annealed at 1073 K did not significantly lower its ampacity. Alongside the resistivity changes, the change of metal–CNT composite morphology (e.g. highly filled CNT matrix to depleted CNT matrix in the Cu–CNT annealed sample at 1073 K) did not seem to impact the ampacity.
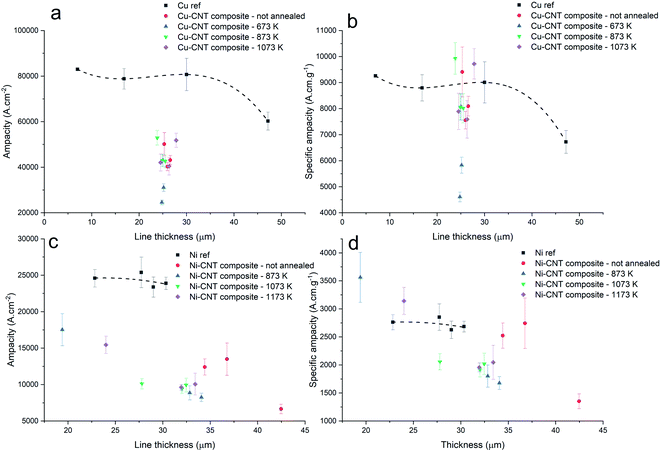 |
| | Fig. 13 Ampacity and specific ampacity of the Cu–CNT composite lines (a and b) and Ni–CNT lines (c and d). | |
4 Conclusion
We observed that the TCR of CNT carpets could be tailored (decreased) by coating the CNT with Cu-doped polydopamine. We also presented a novel electroplating method enabling the fabrication of Cu–CNT composites with a high CNT vol% (∼ 42.5%), a high degree of metal filling, and over a large thickness (∼30 μm), something which has not only never before been attained in the literature (to the best of our knowledge) when using only an aqueous plating solution, but is also effective for the fabrication of the Ni–CNT composite. We highlight that long and large MWCNT could be used in the Cu–CNT composite to reach low resistivity. Also, the CNT contribution to the electronic transport was higher in the Ni–CNT composite than in the Cu–CNT composite. In addition, the resistivity of the CNT network, featuring dot-contacts by Ni particles (after annealing of the Ni–CNT composite), is lower than the Ni–CNT composite, where CNT are fully embedded in Ni; featuring the potential interest of tailoring the CNT–Cu interface with such Ni electrical contacts to promote effective electronic transport in the Cu–CNT composite. Controversially to the literature, we report a loss of ampacity in our metal–CNT composites compared to the pure reference metal. Also, we show that the atmosphere used for the measurement and the dimension of the sample can have a significant impact on its ampacity, leading to variations typically in the range of the ampacity gains of Cu–CNT composite (compared to reference copper), which can be seen in the literature. Therefore, we stress the importance of controlling and disclosing the experimental parameters of the ampacity measurement accurately in order to provide reliable comparisons of published results between the Cu–CNT composites and pure copper.
Conflicts of interest
There are no conflicts of interest to declare.
Acknowledgements
This work was financially supported by the Luxembourg National Research Fund (C-PPP16/MS/11515319), the Luxembourg Institute of Science and Technology, and Circuit Foil Luxembourg Sàrl. We thank J. Polesel for his help during the sample preparation and L. Auguin for proofreading the text.
References
- R. A. Matula, J. Phys. Chem. Ref. Data, 1979, 8, 1147–1298 CrossRef CAS.
- U. S. Congress, Office of Technology Assessment. Miniaturization Technologies OTA-TCT-514, U. S. Government Printing Office, Washington, DC, 1991 Search PubMed.
- C. J. Smithells, in Metals Reference Book, Butterworth-Heinemann, 5th edn, 1976, pp. 940–974 Search PubMed.
- G. Gardiner, Lightning strike protection for composite structures, https://www.compositesworld.com/articles/lightningstrike-protection-for-composite-structures, accessed September 2021 Search PubMed.
- S. Kim, et al., Carbon, 2009, 47, 1297–1302 CrossRef CAS.
- A. Naeemi and J. D. Meindl, IEEE Electron Device Lett., 2007, 28, 135–138 CAS.
- A. Naeemi and J. Meindl, IEEE Electron Device Lett., 2006, 27, 338–340 Search PubMed.
- R. Saito et al., Physical Properties of Carbon Nanotubes, Imperial College Press, 1998 Search PubMed.
- H. J. Li, et al., Phys. Rev. Lett., 2005, 95, 086601 CrossRef CAS PubMed.
- C. Subramaniam, et al., Nat. Commun., 2013, 4, 2202 CrossRef PubMed.
- J. Dellinger, J. Franklin Inst., 1910, 170, 213–216 CrossRef.
- M. B. Bazbouz, et al., Adv. Electron. Mater., 2021, 7, 2001213 CrossRef CAS.
- H. C. de Groh, MRS Adv., 2017, 2, 71–76 CrossRef CAS.
- Y. Yang, et al., Mater. Lett., 2008, 62, 47–50 CrossRef CAS.
- Y. Feng and S. L. Burkett, J. Vac. Sci. Technol., B, 2015, 33, 022004 CrossRef.
- R. Sundaram, et al., Sci. Rep., 2017, 7, 9267 CrossRef PubMed.
- R. Sundaram, et al., Jpn. J. Appl. Phys., 2018, 57, 04FP08 CrossRef.
- R. M. Sundaram, et al., R. Soc. Open Sci., 2018, 5, 180814 CrossRef CAS PubMed.
- D. Janas and B. Liszka, Mater. Chem. Front., 2018, 2, 22–35 RSC.
- K. Z. Milowska, et al., Nanoscale, 2017, 9, 8458–8469 RSC.
- A. Duhain, et al., RSC Adv., 2021, 11, 11900–11909 RSC.
- S. C. Lim, et al., Appl. Phys. Lett., 2009, 95, 264103 CrossRef.
- A. Bachtold, et al., Nature, 1999, 397, 673–675 CrossRef CAS.
- X. Chen, et al., J. Alloys Compd., 2018, 735, 163–171 CrossRef CAS.
- W. Daoush, et al., Mater. Sci. Eng., A, 2009, 513–514, 247–253 CrossRef.
- G. Xu, et al., Nanoscale, 2011, 3, 4215–4219 RSC.
- J. Shuai, et al., Composites, Part A, 2016, 88, 148–155 CrossRef CAS.
- C. Subramaniam, et al., Nanoscale, 2016, 8, 3888–3894 RSC.
- S. Sun, et al., Nanotechnology, 2016, 27, 335–705 Search PubMed.
- M. M. Jastrzebska, et al., J. Biomater. Sci., Polym. Ed., 1996, 7, 577–586 CrossRef PubMed.
- A. Mostert, et al., Proc. Natl. Acad. Sci. U. S. A., 2012, 109, 8943–8947 CrossRef CAS PubMed.
- Y.-J. Tan and K. Lim, Surf. Coat. Technol., 2003, 167, 255–262 CrossRef CAS.
- M. Park, et al., Carbon, 2011, 49, 811–818 CrossRef CAS.
- P.-M. Hannula, et al., Electrochim. Acta, 2017, 232, 495–504 CrossRef CAS.
- G. Zangari, Coatings, 2015, 5, 195–218 CrossRef CAS.
- C. Shi, et al., ACS Appl. Mater. Interfaces, 2013, 5, 7770–7776 CrossRef CAS PubMed.
- A. Fediai, et al., Nanoscale, 2016, 8, 10240–10251 RSC.
- M. Ghorbani-Asl, et al., Phys. Chem. Chem. Phys., 2015, 17, 18273–18277 RSC.
- S. Yamanaka, et al., Mater. Trans., 2007, 48, 2506–2512 CrossRef CAS.
- J. H. Neher and M. H. McGrath, Transactions of the American Institute of Electrical Engineers, Part III: Power Apparatus and Systems, The calculation of the temperature rise and load capability of cable system, 1957, vol. 76, pp. 752–764 Search PubMed.
- T. Linenbrink, The history and mystery of the: Neher-McGrath formula, Consulting Specifying Engineer, 2014, vol. 61, p. 50 Search PubMed.
Footnote |
| † Electronic supplementary information (ESI) available. See DOI: 10.1039/d1ra07048g |
|
| This journal is © The Royal Society of Chemistry 2021 |
Click here to see how this site uses Cookies. View our privacy policy here. 
 Open Access Article
 This Open Access Article is licensed under a Creative Commons Attribution-Non Commercial 3.0 Unported Licence
 *ab,
Guillaume Lamblina and
Damien Lenoblea
*ab,
Guillaume Lamblina and
Damien Lenoblea


 versus temperature of Cu–CNT (a and b) and Ni–CNT (c and d) composites.