 Open Access Article
Oxygen-vacancy-rich BiOCl materials with ultrahigh photocatalytic efficiency by etching bismuth glass†
Wenjing Dongab,
Tianyi Xiea,
Zhilun Wud,
Haiyi Penga,
Haishen Rena,
Fancheng Meng*c and
Huixing Lin *ab
*ab
aKey Laboratory of Inorganic Functional Materials and Devices, Shanghai Institute of Ceramics, Chinese Academy of Sciences, Shanghai 201800, China
bEducation Ministry Key Lab of Resource Chemistry and Shanghai Key Laboratory of Rare Earth Functional Materials, Shanghai Normal University, Shanghai, 200234, China. E-mail: huixinglin@mail.sic.ac.cn
cCollege of Materials Science and Engineering, Chongqing University of Technology, Chongqing 400054, China. E-mail: mengfancheng@cqut.edu.cn
dUnited Microelectronics Center Ltd, China
First published on 3rd December 2021
Abstract
Bismuth oxychloride (BiOCl) is a promising photocatalyst material for water purification to remove organic pollutants. However, BiOCl materials can only degrade pollutants under ultraviolet-light owing to their wide band gap. Herein, we propose a simple synthesis route based on Bi2O3–B2O3–ZnO–SrO–Na2O (BBZSN) glass to fabricate 3D hierarchical-structured BiOCl materials with rich oxygen vacancies (OVs), which were introduced from BBZSN glass and inhibited the recombination of electron–hole pairs and adjusted the band structure. The photocatalytic activity of the obtained 3D hierarchical-structured BiOCl photocatalyst was evaluated by the degradation of Rhodamine B (RhB) under ultraviolet light and visible light. The experimental results suggested that the as-fabricated flower-shape BiOCl–NaCl could effectively degrade RhB under ultraviolet light (92.7%/20 min) or visible light (71.4%/20 min, 92.8%/100 min) respectively, which indicates its potential to be applied in environmental remediation.
Introduction
Owing to its layered crystal structure consisting of a [Bi2O2]2+ layer sandwiched between two Cl− plates, the BiOCl photocatalytic material possesses excellent catalytic and photoluminescence properties, and consequently has attracted widespread attention as a potential photocatalyst for energy and environment applications.1–7 The connection of [Cl–Bi–O–Bi–Cl] through an internal electrostatic field can enhance the separation and transport of electron–hole pairs (EHPs). However, only under ultraviolet (UV)-light (λ <400 nm) conditions the BiOCl material can be excited due to its wide band gap energy (∼3.5 eV).8,9 Specifically, only if the appropriate band gap between the edge potential of the conduction band (CB) and the valence band (VB) is satisfied, a large amount of reactive oxygen species (ROS) can be produced by the excited photogenerated e− and h+. Among these ions, superoxide radicals (˙O2−) and hydroxyl radicals (˙OH) can realize the effective neutralization of organic pollutants, such as rhodamine B, which could be applied to alleviate environmental pollution.10–12The existing current research suggests that there are three effective strategies for the fabrication of BiOCl materials with high catalytic performance:3,5,6 crystal facet tailoring, 3D hierarchical structure control, and evolution of the band gap.
First, crystal facet tailoring is an effective method of optimizing the photocatalytic properties of semiconductor materials.3 The exposed facets on BiOCl play crucial roles in charge-carrier separation and transportation, impacting the selectivity and rate of photocatalysis reactions.13 The preparation of BiOX with specific exposed crystal facets was first realized using H+ as a capping agent.13–16 Jiang et al. conducted a comparative study on the photoactivity of BiOCl nanosheets with main surfaces through adjusting the pH.17 It was confirmed that BiOCl single-crystalline nanosheets with exposed facets exhibited higher activity for direct semiconductor photoexcitation pollutant degradation under UV light, whereas its counterpart with exposed facets possessed superior activity for indirect dye photosensitization degradation under visible light.18
Second, photocatalysts with hierarchical structures usually exhibit better performance than bulk photocatalysts, which can be attributed to their high specific surface area, efficient light harvesting, accessibility, and easy transport of the reactants of the former catalysts.5 Therefore, the design and synthesis of 3D hierarchical-structured BiOCl materials have attracted much attention.18,19 Through modification of the polar organic molecules (thiourea) at room temperatures, Hou et al. prepared BiOCl materials with an adjustable 3D layered structure featuring the characteristics of a comparatively positive valence band, high specific surface, area and efficient EHPs' separation.20 Under visible light, the reaction between photogenerated h+ and water molecules directly generated sufficient ˙OH; thereby effectively degrading tetracycline and RhB, for which the efficiency was approximately 20 times better than using pure BiOCl. Wu et al.21 used protonated branched polyethyleneimine (BPEI) to prepare BiOCl with facets. The interaction between the protonated positive and negative charges was utilized to induce the shape evolution of BiOCl and the facet exposure of BiOCl nanosheets. As the concentration of BPEI decreased, the shape of the resulting BiOCl accordingly transformed from 2D nanosheets into 3D assembled flower-like shapes; thereby realizing the efficient removal of Cr(VI) under sunlight.
Last but not least, the band structures, such as valence band (VB), conduction band (CB), and band gap, commonly determine the inherent photoexcitation, migration of carriers, and the redox capacities of electron–hole pairs. Research results show that oxygen vacancies (OVs) enriched in BiOX (X = Cl, Br, and I) materials can extend the long-wave photoresponse to visible light. BiOCl materials with a band gap of about 3.3 eV only show ultraviolet absorption, whereas adding OVs produces visible light-driven photocatalytic activity. Wang et al.22,23 synthesized BiVO4 materials with oxygen-rich vacancies by a calcination method to enhance the light absorption intensity and carrier separation efficiency, which greatly improved hydrogen production for the photoelectric catalytic decomposition of water. Ye et al.24 synthesized BiOCl nanoplates and nanosheets with the assistance of polyvinyl pyrrolidone and mannitol solution via a hydrothermal method. When the thickness of the BiOCl nanosheets decreased from 30 nm down to the atomic level (2.7 nm), the type of vacancy changed from V′′′ Bi to V′′′Bi  V′′′Bi associated vacancies, apparently narrowing the band energy of BiOCl from 3.25 to 3.00 eV. Huang et al.25 prepared BiOI nanosheets with oxygen vacancies by electroreduction. After introducing oxygen vacancies, the prepared material exhibited a red-shift of ∼100 nm in the light absorption band, which led to a tenfold increase in the photocatalytic activity for MO degradation compared to untreated BiOI nanosheets.
In addition, the OVs on BiOX materials could serve as potential centers for the photogenerated electrons on the CB; thus impeding the direct recombination of EHPs.26–28 Meanwhile, OVs can improve the electron-transfer rate through strong coupling, which is beneficial for capturing typical molecules (O2, H2O, CO2, and N2). OV-mediated photocatalysis technology can not only realize the sustainable activation of oxygen molecules, but also overcome the spin forbidden reaction of oxygen in the triplet state. Therefore, oxidants (such as O2) can directly generate reactive oxygen species (ROS) to degrade pollutants, which is conducive to elevating the photocatalytic performance of the BIOX surface.29,30
Although the above research is beneficial to improving the photocatalytic activity of BiOCl materials, the conventional solvothermal and hydrothermal methods usually need polyvinylpyrrolidone, ethylene glycol, and mannitol to be introduced in a tedious treatment to obtain BiOCl materials with oxygen vacancies or a hierarchical structure,20,21,26,31,32 which is difficult to achieve in industrial production. In contrast to the aforementioned works, Bi2O(OH)2SO4 prepared by the sulfuric acid corrosion of BBZSN glass containing oxygen vacancies33–35 was innovatively used as the bismuth source and chlorine source to assemble the BiOCl material in the present study. The effects of the bismuth source morphology changes and chlorine source types on the 3D hierarchical structure and catalytic performance of BiOCl materials were studied. The morphological structure, band gap structure, oxygen vacancies, and photocatalytic performance of the prepared BiOCl materials were characterized, and the mechanism of enhancing the photocatalytic activity was determined and explained herein.
Experimental settings and parameters
Preparation of the as-prepared BBZSN glass
Bi2O3, B2O3, ZnO, SrO, and Na2O with a molar ratio of 4![[thin space (1/6-em)]](https://www.rsc.org/images/entities/char_2009.gif) :
:![[thin space (1/6-em)]](https://www.rsc.org/images/entities/char_2009.gif) 3
3![[thin space (1/6-em)]](https://www.rsc.org/images/entities/char_2009.gif) :
:![[thin space (1/6-em)]](https://www.rsc.org/images/entities/char_2009.gif) 1
1![[thin space (1/6-em)]](https://www.rsc.org/images/entities/char_2009.gif) :
:![[thin space (1/6-em)]](https://www.rsc.org/images/entities/char_2009.gif) 1
1![[thin space (1/6-em)]](https://www.rsc.org/images/entities/char_2009.gif) :
:![[thin space (1/6-em)]](https://www.rsc.org/images/entities/char_2009.gif) 1, respectively, were taken as the raw materials, among which Na2O was obtained from sodium carbonate, mixed uniformly on a ball mill, and melted at 900 °C for 45 min to obtain a uniform glass liquid. Afterward, quenching was performed to gain glass fragments, which were then ground to obtain bismuth glass powder.
1, respectively, were taken as the raw materials, among which Na2O was obtained from sodium carbonate, mixed uniformly on a ball mill, and melted at 900 °C for 45 min to obtain a uniform glass liquid. Afterward, quenching was performed to gain glass fragments, which were then ground to obtain bismuth glass powder.
All the used chemicals needed no further purification. The characteristics of the intermediate product Bi2O(OH)2SO4 featuring fibrous and agglomerated bundle-shaped structures are shown as follows:
Preparation of the as-prepared BiOCl samples
The preparation of BiOCl powder using bismuth glass can be primarily categorized into two methods, which depended on whether the intermediate Bi2O(OH)2SO4 was dried: the one-step method and the two-step method.One-step method: first, 5 g BBZSN glass powder was added into 100 mL of 6 wt% H2SO4 solution, and then the mixture was stirred for 2 h to obtain a Bi2O(OH)2SO4 suspension of the fibrous intermediate product. The remaining suspension was allowed to stand to wait for its settling. When the precipitate appeared, the upper layer of waste liquid containing sulfuric acid was discarded, and the remaining was washed to neutrality with deionized water and ethanol. After that, either 100 mL of 2 wt% HCl solution or 100 mL of 3 wt% NaCl solution was added into the washed solid-state precipitate, with the former mixture then magnetically stirred at room temperature of about 25 °C for 2 h, while the latter solution was magnetically stirred at 60 °C for 4 h; thus preparing two kinds of synthetic BiOCl powder (BiOCl–HCl and BiOCl–NaCl), respectively. The products were washed to neutrality with deionized water and then dried at 100 °C for 4 h.
Two-step method: first, 3 g of dried Bi2O(OH)2SO4 powder (agglomerated bundle-shaped structure) was added into either 100 mL of 2 wt% HCl solution or 100 mL of 3 wt% NaCl solution, with the former mixture magnetically stirred at room temperature for 2 h, while the latter was magnetically stirred at 60 °C for 4 h; thereby preparing two kinds of synthetic BiOCl powder (BiOCl–HCl-2 and BiOCl–NaCl-2), respectively. The products were washed to neutrality with deionized water and then dried at 100 °C for 4 h.
Characterization
X-ray diffraction analysis (XRD) was conducted using a Bruker D8 Advance diffractometer with Cu Kα radiation in the 2θ range from 20° to 80°. The morphology was analyzed by scanning electron microscopy (SEM) (FEI Verios G4). A JEM-2010 instrument with an accelerating voltage of 200 kV was utilized for the transmission electron microscopy (TEM) analysis. The N2 physical adsorption and desorption isotherms were obtained using a Quadrasorb SI apparatus (Quantachrome). Ultraviolet-visible diffuse reflectance spectroscopy (UV-vis DRS) measurements were conducted on an UV-vis spectrophotometer (Shimadzu UV-3600). An ESCAlab MKII X-ray photoelectron spectrometer with Mg Kα source was used to obtain the X-ray photoelectron spectroscopy (XPS) results. Photoluminescence (PL) spectroscopy was performed using a fluorescence spectrometer (Edinburgh Instruments FLS980).Photocatalytic activity
The photocatalytic activities of the prepared BiOCl materials were evaluated by the photocatalytic decomposing of RhB (10 mg L−1), which was prepared with deionized water, under UV light and visible light irradiation, respectively. A Xe lamp (300 W) with a 400 nm cut-off filter and 200–400 nm quartz filter was used to obtain visible light and UV light, respectively. In the photocatalysis experiments, 10 mg of BiOCl photocatalyst was mixed with 100 mL of RhB solution; then the mixture was placed in the dark and stirred for 60 min to reach absorption–desorption equilibrium before irradiation. After a given time, 3 mL of the mixture was sampled and centrifugated to remove the BiOCl materials. The RhB concentration was measured by a UV-vis spectrophotometer according to its absorbance at 553 nm.Photoelectrochemical measurements
The photocurrent was studied by preparing modified electrodes in a standard tri-electrode system comprising a reference electrode Ag/AgCl (saturated KCl), a counter electrode (Pt wire), and a working electrode (prepared sample). The working electrode was obtained by spreading 20 μL of a sample containing 2 mg BiOCl and 0.2 mL of ethanol on a fixed area of a 1 cm2 ITO slice. A Xe arc lamp (300 W) was adopted as the light source. A phosphate buffer solution (Na2HPO4/NaH2PO4 mixed solution, 0.1 mol L−1) was used in the photocurrent process. The electrolyte for the electrochemical impedance spectroscopy (EIS) was 0.2 mol L−1 KCl.Results and discussion
Structure and morphology
The morphology of BiOCl synthesized through the different preparation methods was observed using SEM. It is generally acknowledged that the aggregation of nanoparticles will affect the surface activity of the material.36 Hence, it can be seen from Fig. 1 that with respect to BiOC1–HCl-2, the agglomerated structure was jointly formed by the random nanoplates and the microplates. Due to the monodisperse properties of BiOCl–HCl, BiOCl–NaCl, and BiOCl–NaCl-2, the samples' photocatalysis capacity could be improved. Meanwhile, we found that Bi2O(OH)2SO4 plays a crucial role in determining the morphology of BiOCl during the reaction, in which it acts as a reactant while simultaneously functioning as a template. Among the above materials, BiOCl–HCl and BiOCl–NaCl were formed by the direct reaction between fibrous Bi2O(OH)2SO4 and a chlorine source. When HCl was chosen as the chlorine source, Bi2O(OH)2SO4 dissolved further, with finer fibers therefore formed, shaping the fibrous discoidal skeleton approximately 3 μm in size through “Ostwald” ripening under magnetic stirring. When using NaCl as the chlorine source, fibrous Bi2O(OH)2SO4 tended to agglomerate within a small area. Furthermore, due to the high nucleation rate exhibited by BiOCl under a neutral environment, a complete sheet could therefore be formed more easily,37 in which the formed micron flakes were composed of a flower-shaped structure approximately 3 μm in size.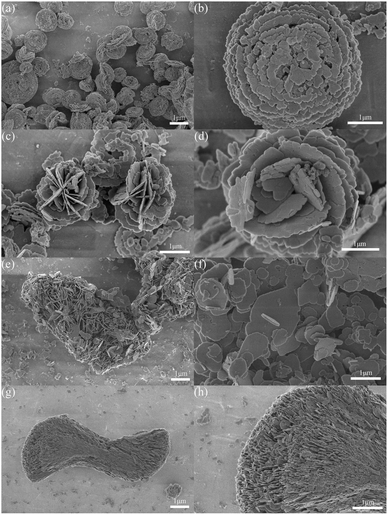 | ||
| Fig. 1 SEM images of the as-prepared BiOCl samples: (a and b) BiOCl–HCl; (c and d) BiOCl–NaCl; (e and f) BiOCl–HCl-2; (g and h) BiOCl–NaCl-2. | ||
Interestingly, the agglomerated bundle-shaped structure of Bi2O(OH)2SO4 was shaped after drying its fibrous form, after which bundles of Bi2O(OH)2SO4 were added to the HCl solution to partially decompose the agglomerated structure; thereby forming sheet-structured BiOCl–HCl-2 approximately 1.5 μm in size. When the agglomerated bundle-shaped Bi2O(OH)2SO4 was added to the NaCl solution, its initial structure remained still, during which the bundle-shaped structure of BiOCl–NaCl-2 approximately 10 μm in size was subsequently formed by the directional arrangement of the nanosheets. A schematic diagram illustrating the formation process of the BiOCl sample is shown in Fig. S1.†
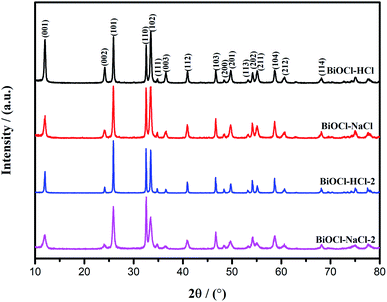
The crystal structure of the BiOCl material was studied by XRD. All the peaks of the as-prepared BiOCl samples could be indexed into the tetragonal phase of BiOCl with clear and narrow reflection (Fig. 2), from which no other characteristic peaks were obtained; thereby proving the purity of the as-prepared BiOCl samples.
The samples of BiOCl–HCl and BiOCl–HCl-2 exhibited an obvious diffraction intensity of the (001) crystal plane, which could be attributed to the following explanation. Under acidic conditions, large amounts of H+ ions are easily adsorbed on the O-terminated (001) surface of BiOCl. Thus, the strong binding interaction between the H+ ions and terminated oxygen on the (001) surface favors the formation of BiOCl materials enclosed with dominant facets. When the solution approximates neutrality, the H+ ions' content decreases, thereby weakening the bonding interaction with the terminated oxygen on the (001) surface and inhibiting the growth of the (001) plane; thereby allowing the appearance of the38 faceted surface during the growth of BiOCl materials.17 This is consistent with the fact that BiOCl–NaCl and BiOCl–NaCl-2 had higher (101) and (110) crystal plane diffraction intensities. In addition, a larger lateral dimension implies a stronger exposure of the (001) crystal planes, which means the lateral dimension positively correlates with the exposure degree of the crystal planes. Thus, BiOCl–HCl and BiOCl–NaCl had a large lateral dimension, whereby the (001) crystal plane was noticeably exposed.
Fig. 3 shows the detailed structural information of the as-prepared BiOCl samples obtained by transmission electron microscopy (TEM). As shown in Fig. 4(a), (c), (e), (g), and (i), the TEM images further verified the special morphology of the as-prepared BiOCl samples, with the results showing good consistency with the SEM results. As shown in the high-resolution TEM images in Fig. 4(b), (d), and (f), the lattice fringes featured a 0.367 nm lattice spacing, corresponding to the (002) atomic plane of BiOCl. The corresponding selected area electron diffraction (SAED) mode in the inset shows the single-crystal nature of the as-prepared BiOCl samples. The included angle between two neighboring point series of two different particles marked in the SAED pattern was 45°, which was the included angle between the (102) and (002) planes.
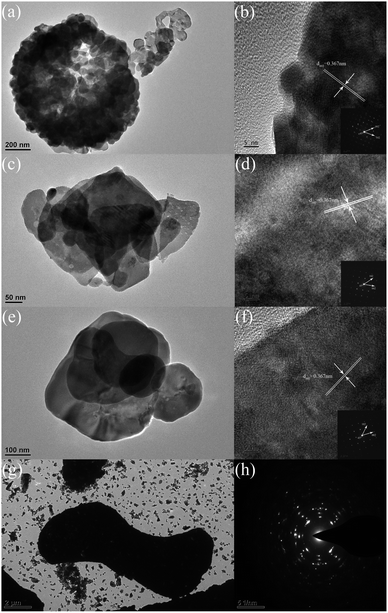 | ||
| Fig. 3 TEM images of the as-prepared BiOCl samples: (a and b) BiOCl–HCl; (c and d) BiOCl–NaCl; (e and f) BiOCl–HCl-2; (g and h) BiOCl–NaCl-2. | ||
Defect verification
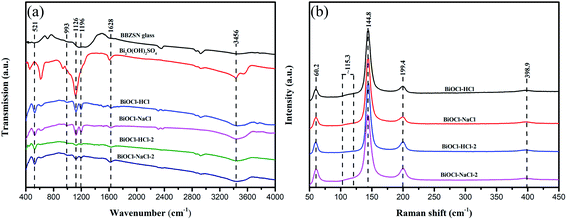
As shown in Fig. 4(a), Fourier transform infrared spectroscopy (FTIR) could specifically distinguish surface-useful bunches in the as-prepared BiOCl samples. The absorption peaks of BiOCl were mainly concentrated around 521, 993, 1126, 1196, 1628, and 3456 cm−1. Among these, the peaks at 521, 1628, and 3456 cm−1 represent the Bi–O extensional vibration, the stretching vibration of Bi–Cl, and the extensional vibration of the surface hydroxyl beam, respectively.39–41 It could also be found that the hydroxyl group in the BiOCl material was mainly introduced by BBZSN glass and by the intermediate product Bi2O(OH)2SO4, among which BiOCl–HCl and BiOCl–NaCl exhibited the highest surface hydroxyl peak intensity; thereby facilitating the absorption of pollutants.42As shown in Fig. 4(b), Raman spectra were obtained to test the normal mode vibration of the as-prepared BiOCl samples. The peaks at 60.2, 144.8, and 199.4 cm−1 were paired with the vibration of the Bi–Cl bond, in which the peak at 403.5 cm−1 was caused by the motion of oxygen molecules.43 In addition, all the as-prepared BiOCl samples exhibited a new diffraction peak at 115.3 cm−1, through which the significant defects of these samples were therefore proved. Nevertheless, appropriate defects help improve the catalytic efficiency of the proposed material.20
The surface element compositions of the as-prepared BiOCl samples were analyzed by XPS. The entire measurement spectrum (Fig. 5(a)) showed the composition of Bi, O, and Cl elements. The detailed element compositions of BiOCl are listed in Table S1.†
 | ||
| Fig. 5 (a) XPS patterns; and XPS spectra of the (b) Bi 4f region, (c) Cl 2p region, and (d) O 1s region of the as-prepared BiOCl samples. | ||
For all the as-prepared BiOCl samples, the proportion of Bi and Cl was approximately 1![[thin space (1/6-em)]](https://www.rsc.org/images/entities/char_2009.gif) :
:![[thin space (1/6-em)]](https://www.rsc.org/images/entities/char_2009.gif) 1, illustrating that the BiOCl substance existed in all samples. As shown in Fig. 5(b), the binding energies of Bi 4f5/2 and Bi 4f7/2 were located at 165 and 159 eV and validated the existence of Bi ions.44,45 It can be seen from Fig. 5(c) that the Cl 2p3/2 and Cl 2p1/2 binding energies of the as-prepared BiOCl samples exhibited a similar shift tendency. The XPS spectrum of O 1s is displayed in Fig. 5(d). The O 1s range of the as-prepared BiOCl samples at 530 eV indicated the existence of O2− from the Bi–O bond in BiOCl and the peak at 532 eV was related to the O–H bond, corresponding to the hydroxyl group adsorbed on the surface. The as-prepared BiOCl samples showed obvious hydroxyl peaks, which were due to Bi2O(OH)2SO4 being used as a template to introduce more hydroxyl active components; thereby improving the photocatalytic activity of the as-prepared BiOCl samples.1
1, illustrating that the BiOCl substance existed in all samples. As shown in Fig. 5(b), the binding energies of Bi 4f5/2 and Bi 4f7/2 were located at 165 and 159 eV and validated the existence of Bi ions.44,45 It can be seen from Fig. 5(c) that the Cl 2p3/2 and Cl 2p1/2 binding energies of the as-prepared BiOCl samples exhibited a similar shift tendency. The XPS spectrum of O 1s is displayed in Fig. 5(d). The O 1s range of the as-prepared BiOCl samples at 530 eV indicated the existence of O2− from the Bi–O bond in BiOCl and the peak at 532 eV was related to the O–H bond, corresponding to the hydroxyl group adsorbed on the surface. The as-prepared BiOCl samples showed obvious hydroxyl peaks, which were due to Bi2O(OH)2SO4 being used as a template to introduce more hydroxyl active components; thereby improving the photocatalytic activity of the as-prepared BiOCl samples.1
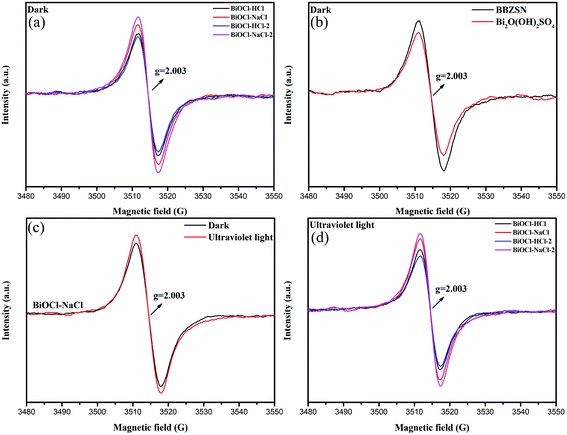
To investigate the existence of oxygen defects in the as-prepared BiOCl samples using different preparation methods, we used electron spin resonance (EPR) measurements.46 As the typical g factor of electrons is approximately 2.0, the EPR signal can reflect the existence of unpaired electrons in the as-prepared BiOCl samples.44 Fig. 6(a) shows that all the as-prepared BiOCl samples exhibited significant signals at g = 2.003, suggesting that the EPR signals detected from the as-prepared BiOCl samples originated from the inherent oxygen vacancies.47,48
In order to further ascertain the originating source of the oxygen vacancies existing in the as-prepared BiOCl samples, the EPR was conducted on BBZSN glass and on the intermediate product Bi2O(OH)2SO4. As shown in Fig. 6(b), it was found that the signals occur at g = 2.003; thereby validating that the existing oxygen vacancies in the as-prepared BiOCl samples originated from the common oxygen vacancies in BBZSN glass.33–35 In Fig. 6(c) and (d), it can be seen that under UV irradiation, the intensity of the as-prepared BiOCl samples increased when g = 2.003. This situation is attributed to the oxygen vacancies formed by the adsorbed hydroxyl groups detaching away from the sample surface,1 which shows good consistency with the results for O 1s by XPS. The existence of oxygen vacancies helps improve the catalytic efficiency of BiOCl materials.49–51
Band gap structure
The band gap structure determines the photocatalytic action of semiconductor materials. Fig. 7(a) shows the UV-vis diffuse reflectance spectra of the as-prepared BiOCl samples. The maximum absorbance wavelengths of BiOCl–HCl, BiOCl–HCl-2, BiOCl–NaCl, and BiOCl–NaCl-2 were 367.26, 367.64, 370.32, and 382.46 nm, respectively, throughout which no visible light absorption was observed. Moreover, the band gap energy of the as-prepared BiOCl samples could be assessed by utilizing the following condition:52| hν = A(hν − Eg)n/2 | (1) |
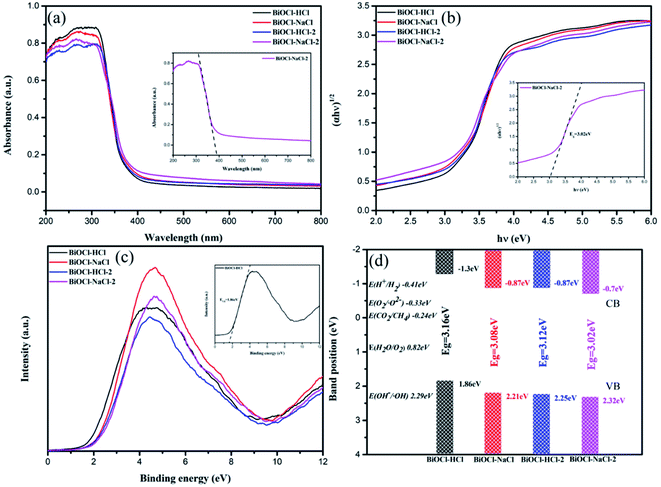 | ||
| Fig. 7 (a) UV-vis diffuse reflectance spectra; (b) curves of (αhν)1/2 with respect to hν; (c) XPS valence band spectra; (d) band gap structures of the as-prepared BiOCl samples. | ||
Fig. 7(b) shows the plots of (αhν)1/2 versus photon energy (hν), through which the corresponding band gaps (Eg) of BiOCl–HCl, BiOCl–HCl-2, BiOCl–NaCl, and BiOCl–NaCl-2 were calculated to be approximately 3.16, 3.12, 3.08, and 3.02 eV, respectively. In addition, VB-XPS was used to determine the VB values of BiOCl–NaCl-2, BiOCl–HCl-2, BiOCl–NaCl, and BiOCl–HCl, which were 2.32, 2.25, 2.21, and 1.86 eV, respectively (Fig. 7(c) and (d)). Then, the CB bottom potentials can be obtained using the following equation:56
| ECB = EVB − Eg | (2) |
Accordingly, the calculated minimum ECB values of BiOCl–NaCl-2, BiOCl–HCl-2, BiOCl–NaCl and BiOCl–HCl were −0.7, −0.87, −0.87, and −1.3 eV, respectively.
The variations of the maximum absorption wavelength and of band gap could be attributed to the morphological transformation of the as-prepared BiOCl samples. Normally, the VB edge of the (110) crystal plane is 0.36 eV higher than that of the (001) plane.57 In addition, the decrease in thickness of the BiOCl materials also enabled the upward shift of the VB and CB.58 Therefore, BiOCl–HCl exposing stronger (001) crystal planes and possessing a smaller thickness had the smallest VB value. The decrease in Eg was caused by the oxygen vacancies in the as-prepared BiOCl samples, by which Eg therefore narrowed.51,59 The corresponding band gap structures are illustrated in Fig. 7(d).
Photocatalysis performance
In order to examine the catalytic performance of the as-prepared BiOCl samples, the commonly used RhB dye that has been widely applied for industrial purposes was adopted as the simulated pollutant.
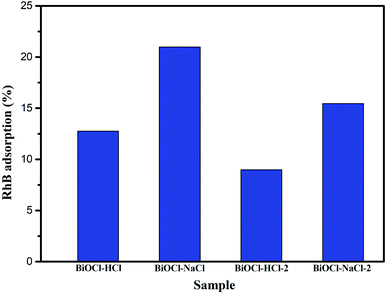
As previously discussed, the mixture containing the photocatalyst and RhB needed to be stirred in the dark for 60 min to achieve the adsorption–desorption equilibrium between the catalyst and the dye. It can be seen from Fig. 8 that BiOCl–NaCl featuring a flower-shaped structure possessed the highest adsorption capacity among the as-prepared samples, reaching up to 20.98%. Similarly, the adsorption capacities of the agglomerated bundle-shaped BiOCl–NaCl-2 (15.46%) and of the discoid-shaped BiOCl–HCl (12.76%) were also higher than that of the sheet-structured BiOCl–HCl-2 (8.98%), which can be attributed to the layered porous structure formed and the high BET.20 In addition, with respect to BiOCl materials, the adsorption capacity enjoys higher priority than the conduction band in terms of degradation, for which reason a higher adsorption efficiency was more prioritized in improving the photocatalysis efficiency of the prepared materials.21
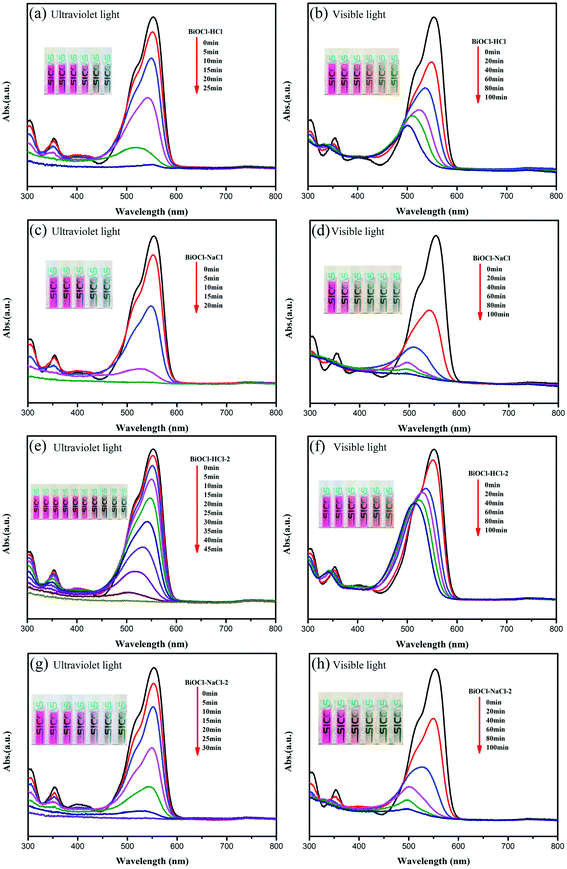 | ||
| Fig. 9 Absorption curves of RhB with respect to the irradiation time for the as-prepared BiOCl samples (a), (c), (e) and (g) under Ultraviolet light and (b), (d), (f) and (h) under visible light. | ||
Interestingly, the as-prepared BiOCl samples still retained excellent catalytic performance for RhB degradation under visible-light irradiation. For an exposure time of 100 min under visible light, the RhB degradation efficiency of BiOCl–NaCl-2, BiOCl–NaCl, and BiOCl–HCl reached up to 93.3%, 92.8%, and 84.4%, respectively. In addition, the RhB degradation efficiency of BiOCl–NaCl reached up to 71.4% when exposed under visible light for 20 min, whereas BiOCl–HCl-2 with a larger sheet structure only reached an efficiency of 61.8% and after 100 min exposure under visible light.
The data were replotted on the basis of a pseudo-first-order kinetic model to quantitatively obtain the reaction kinetics of RhB degradation with the different samples (Fig. 10).
| ln(C0/C) = kt | (3) |
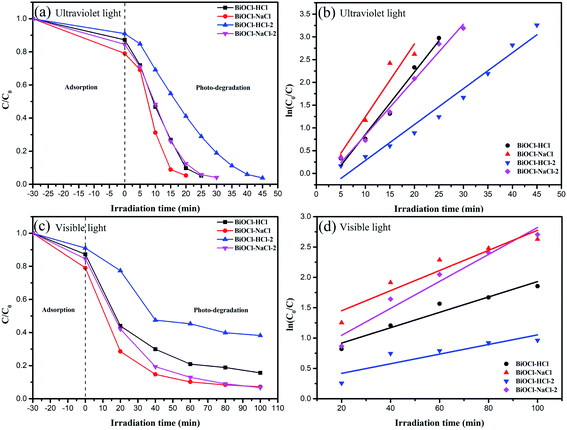 | ||
| Fig. 10 Photocatalytic activities (a) and (c) and kinetics (b) and (d) of the as-prepared BiOCl samples for RhB degradation. | ||
In the above equation, k denotes the rate constant, t denotes the irradiation time, and C0 and C are the RhB concentrations when the time is 0 and t, respectively. Under UV light, BiOCl–NaCl possessed the maximum k of 0.16016 min−1, which was approximately 1.17, 1.31, and 2.03 times higher than that of BiOCl–HCl, BiOCl–NaCl-2, and BiOCl–HCl-2, respectively. Interestingly, BiOCl–NaCl-2 possessed the maximum k of 0.02221 min−1, which was about 1.34, 1.75, and 2.8 times higher than that of BiOCl–NaCl, BiOCl–HCl, and BiOCl–HCl-2 under visible light, respectively. The rate constants of all the as-prepared samples are shown in Table S3.†
In order to investigate the stability of the BiOCl–NaCl photocatalyst, we conducted a cycle test for the RhB degradation under UV-light irradiation. It can be seen from Fig. S3† that no obvious decrease was observed in photocatalytic activity after conducting four cycles; thereby proving the stability of BiOCl–NaCl during the degradation experiment. In addition, micro-sized structures can be easily and conveniently recycled from solution, through which the high stability may be facilitated to some extent.
The above results suggest that BiOCl–NaCl possessed excellent photocatalytic activity under both visible-light and UV-light irradiation. In contrast to other BiOCl-based or BiOCl-based composite materials (Table S4†), BiOCl–NaCl prepared using bismuth glass exhibited excellent photocatalytic performance.60–66 With respect to the as-prepared BiOCl samples, their photocatalytic activity and ability to degrade pollutants can be attributed to their properties, including their special hierarchical structure, adjustable energy band structure, high specific surface area, and controllable crystal face changes, and to the defects being introduced in the raw material bismuth glass.67,68
Photocatalytic mechanism
In order to further figure out the high catalytic efficiency of the as-prepared BiOCl samples, we studied the photocatalytic reaction mechanism. It is generally acknowledged that the content of ROS (˙OH, ˙O2−) can directly affect the catalytic efficiency.4 Quantitative analysis of the ROS generated by the as-prepared BiOCl samples in the dark and under UV irradiation was conducted by EPR spectroscopy,40 confirming its effect on the catalytic efficiency (Fig. 11).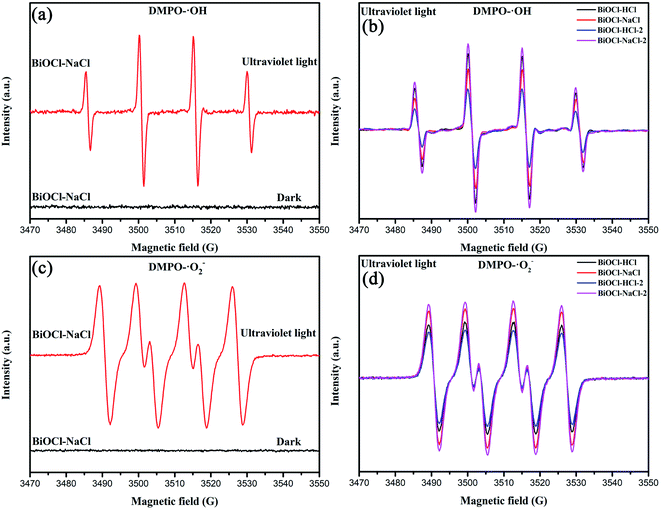 | ||
| Fig. 11 EPR signals of (a and b) DMPO-˙OH and (c and d) (DMPO)-˙O2− in aqueous dispersions of the as-prepared BiOCl samples. | ||
Typically, the ˙O2− derived from the O2 reduction by electrons can be detected by probing the 5,5-dimethyl-pyrroline N-oxide (DMPO)-˙O2− complex in methanol medium.69 The ˙OH originating from the OH−/H2O oxidation in water by holes can be detected by probing the DMPO-˙OH in water medium.40 It can be observed here from Fig. 11(a) and (c) that no obvious EPR signal could be observed in BiOCl–NaCl in the dark environment. Under UV-light irradiation, an EPR signal was observed that could be attributed to (DMPO)-˙O2− and DMPO-˙OH, which indicated that both electrons and holes were generated in BiOCl–NaCl. Meanwhile, as shown in Fig. 11(b) and (d), the as-prepared BiOCl samples had obvious EPR signals of (DMPO)-˙O2− and DMPO-˙OH. Due to the square of the EPR signal intensity being approximately proportional to the number of free radicals, the as-prepared BiOCl samples could produce more light-excited electrons and holes, thereby generating more ROS.44,69 Furthermore, the change in the crystal plane also imposed certain impacts on the generation of ROS. Compared with the (010) crystal plane, the (001) crystal plane is more inclined to produce a large amount of ˙O2− and ˙OH.30
It is generally recognized that the photocatalytic dye degradation is realized via two ways: direct semiconductor photoexcitation and indirect dye photosensitization.17 According to the DRS results, the absorption limits of all the as-prepared BiOCl samples were less than the visible-light range (400 nm). However, the as-prepared BiOCl samples still exhibited excellent photocatalytic performance under visible-light irradiation, which was mainly due to the effect of indirect dye sensitization.17
The as-prepared BiOCl samples with a high specific surface area could adsorb a large amount of colored dyes, such as RhB, to which the absorption limit of the samples were shifted toward high wavelength, thereby realizing catalytic decomposition of the dye under visible light.70–72 The difference in catalytic efficiency of the as-prepared BiOCl samples under visible-light irradiation was mainly due to the change in the crystal plane. Under the condition of UV-light irradiation through direct semiconductor photoexcitation, the (001) facet-dominant BiOCl nanosheets exhibited higher photocatalytic activity than the (010) facet-dominant BiOCl nanosheets in terms of RhB degradation. Conversely, the (010) facet-dominant BiOCl nanosheets exhibited higher photocatalytic activity than the (001) facet-dominant BiOCl nanosheets under visible-light irradiation via indirect dye photosensitization.73–75
In addition, a higher VB potential implies a stronger oxidation capacity of photogenerated holes in removing different pollutant molecules, thereby emphasizing the critical role of h+ throughout the photodegradation process,55 in which the detailed photocatalytic process of BiOCl system can be expressed as follows.76
| BiOCl + hν → h+ + e− | (4) |
| O2 + e− → ˙O2− | (5) |
| ˙O2− + ˙O2− + 2H+ → H2O2 + O2 | (6) |
| H2O2 + e− → ˙OH + OH− | (7) |
| RhB + h+, ˙O2−, ˙OH → degradation product | (8) |
Electrochemistry analysis
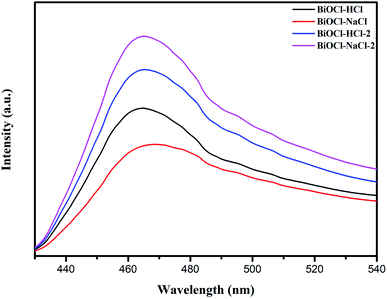
The influence of BiOCl's morphology and structure changes on the behavior of the charge carriers was further verified by steady-state photoluminescence spectroscopy (PL), transient photocurrent response, and by electrochemical impedance spectroscopy (EIS).Fig. 12 shows the PL spectra of the as-prepared BiOCl samples at an excitation wavelength of 300 nm, through which the recombination rate of e− and h+ could be obtained. It can be seen from Fig. 12 that the peak intensities of the flower-shaped BiOCl–NaCl and of the discoid-shaped BiOCl–HCl in the PL spectra were significantly lower than that of the other samples, by which the samples' low recombination rate of e− and h+ was therefore validated; thus further suggesting a sufficient catalytic effect of e− and h+ throughout the catalytic process.19
The difference in the PL spectra of the as-prepared BiOCl samples depended primarily on the samples' oxygen vacancies and morphology, among which the former could be used as active sites to improve the efficiency of carrier separation. More oxygen vacancies impose more significant encumbrance on the recombination of e− and h+. Similarly, excellent interface contact is also conducive to a faster interface charge transfer, making it more difficult for e− and h+ to recombine.30
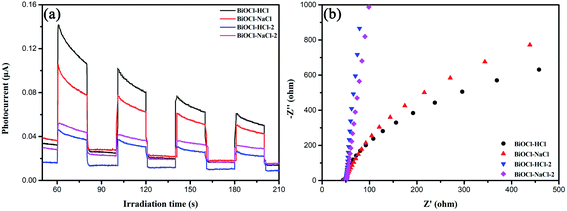
The transient photocurrent response and EIS of the as-prepared BiOCl samples are shown in Fig. 13(a) and (b). It is commonly known that the photocurrent of the ITO electrode can be neglected. Among all the as-prepared BiOCl samples, the discoid-shaped BiOCl–HCl exhibited outstanding transient photocurrent response and small resistance characteristics, to which its special layered structure and (001) crystal plane can be primarily attributed.
As mentioned above, BiOCl has an interestingly unique layered structure, which is characterized by the [Bi2O2] plates interlacing with double anion [Cl2] plates. The strong intralayer covalent bonding of the [Bi2O2] plate together with the van der Waals force interaction between the thin layers of the [Cl2] plate jointly cause a nonuniform charge distribution between the cation [Bi2O2] and anion [Cl2] layers, by which the constituent atoms and orbitals are therefore polarized; thus forming an internal electrostatic field (IEF).77
Considering that the IEF direction is perpendicular to the (001) crystal plane but parallel to the (010) crystal plane, therefore, the large charge transfer promoted by IEF possesses more advantages for the (001) crystal plane than the (010) crystal plane due to the shorter diffusion distance. That said, the transient photocurrent response of the (001) crystal plane was far higher than that of the (010) crystal plane, which indicated a higher charge-separation efficiency of the (001) crystal plane under light. In addition, the intensity of the IEF and the separation efficiency of charge carriers could be further improved by increasing the exposure of the (001) crystal plane in the as-prepared BiOCl samples.77
Conclusions
In this paper, we innovatively prepared Bi2O(OH)2SO4 as the source bismuth through the etching of BBZSN glass with rich oxygen vacancies. The crystal face, 3D hierarchical structure, and band gap structure of the BiOCl materials were effectively controlled by changing the bismuth source morphology and chlorine source type. All the as-prepared BiOCl samples had excellent photocatalytic activity, which was attributed to their special structure, controllable crystal face, high surface area, oxygen vacancies, low recombination rate of photogenerated electron–hole pairs, enhanced dye adsorption capacity, and faster interface charge separation. Among the aforementioned diverse samples, the flower-shaped BiOCl–NaCl possessed excellent photocatalytic performance under both UV and visible light, thereby verifying its prosperous application for various purposes.Conflicts of interest
We declare that we have no financial and personal relationships with other people or organizations that can inappropriately influence our work, there is no professional or other personal interest of any nature or kind in any product, service and/or company that could be construed as influencing the position presented in, or the review of, the manuscript entitled.References
- Q. Gong, P. Ding, M. Xu, X. Zhu, M. Wang, J. Deng, Q. Ma, N. Han, Y. Zhu, J. Lu, Z. Feng, Y. Li, W. Zhou and Y. Li, Nat. Commun., 2019, 10, 2807 CrossRef PubMed.
- S. J. Wu, J. W. Xiong, J. G. Sun, Z. D. Hood, W. Zeng, Z. Z. Yang, L. Gu, X. X. Zhang and S. Z. Yang, ACS Appl. Mater. Interfaces, 2017, 9, 16620–16626 CrossRef CAS PubMed.
- J. Di, J. X. Xia, H. M. Li, S. J. Guo and S. Dai, Nano Energy, 2017, 41, 172–192 CrossRef CAS.
- X. L. Jin, L. Q. Ye, H. Q. Xie and G. Chen, Coord. Chem. Rev., 2017, 349, 84–101 CrossRef CAS.
- H. Li, J. Li, Z. H. Ai, F. L. Jia and L. Z. Zhang, Angew. Chem., Int. Ed., 2018, 57, 122–138 CrossRef CAS PubMed.
- R. A. He, D. F. Xu, B. Cheng, J. G. Yu and W. K. Ho, Nanoscale Horiz., 2018, 3, 464–504 RSC.
- S. Wang, L. Wang and W. Huang, J. Mater. Chem. A, 2020, 8, 24307–24352 RSC.
- J. B. Zhong, Y. K. Zhao, L. Y. Ding, H. W. Ji, W. H. Ma, C. C. Chen and J. C. Zhao, Appl. Catal., B, 2019, 241, 514–520 CrossRef CAS.
- Q. Y. Li, Z. P. Guan, D. Wu, X. G. Zhao, S. Y. Bao, B. Z. Tian and J. L. Zhang, ACS Sustainable Chem. Eng., 2017, 5, 6958–6968 CrossRef CAS.
- Y. Su, L. Zhang, W. Z. Wang and D. K. Shao, ACS Sustainable Chem. Eng., 2018, 6, 8704–8710 CrossRef CAS.
- W. W. Liu, Y. Y. Shang, A. Q. Zhu, P. F. Tan, Y. Liu, L. L. Qiao, D. W. Chu, X. Xiong and J. Pan, J. Mater. Chem. A, 2017, 5, 12542–12549 RSC.
- H. Li, F. Qin, Z. P. Yang, X. M. Cui, J. F. Wang and L. Z. Zhang, J. Am. Chem. Soc., 2017, 139, 3513–3521 CrossRef CAS PubMed.
- J. Li, H. Li, G. M. Zhan and L. Z. Zhang, Acc. Chem. Res., 2017, 50, 112–121 CrossRef CAS PubMed.
- L. Wang, D. D. Lv, Z. J. Yue, H. Zhu, L. Wang, D. F. Wang, X. Xu, W. C. Hao, S. X. Dou and Y. Du, Nano Energy, 2019, 57, 398–404 CrossRef CAS.
- J. Rashid, A. Abbas, L. C. Chang, A. Iqbal, I. Ul Haq, A. Rehman, S. U. Awan, M. Arshad, M. Rafique and M. A. Barakat, Sci. Total Environ., 2019, 665, 668–677 CrossRef CAS PubMed.
- X. M. Sun, J. Wu, Q. Z. Liu and F. G. Tian, Appl. Surf. Sci., 2018, 455, 864–875 CrossRef CAS.
- J. Jiang, K. Zhao, X. Y. Xiao and L. Z. Zhang, J. Am. Chem. Soc., 2012, 134, 4473–4476 CrossRef CAS PubMed.
- J. Y. Xiong, Z. B. Jiao, G. X. Lu, W. Ren, J. H. Ye and Y. P. Bi, Chem.–Eur. J., 2013, 19, 9472–9475 CrossRef CAS PubMed.
- S. O. Zhao, Y. W. Zhang, Y. M. Zhou, C. Zhang, X. L. Sheng, J. S. Fang and M. Y. Zhang, ACS Sustainable Chem. Eng., 2017, 5, 1416–1424 CrossRef CAS.
- J. Hou, D. Dai, R. Wei, X. Wu, X. Wang, M. Tahir and J.-J. Zou, ACS Sustainable Chem. Eng., 2019, 7, 16569–16576 CrossRef CAS.
- Z. H. Wu, Z. F. Li, Q. Y. Tian, J. Liu, S. M. Zhang, K. Q. Xu, J. Shen, S. Y. Zhang and W. Wu, Cryst. Growth Des., 2018, 18, 5479–5491 CrossRef CAS.
- S. Wang, T. He, P. Chen, A. Du, K. K. Ostrikov, W. Huang and L. Wang, Adv. Mater., 2020, 32, e2001385 CrossRef PubMed.
- S. Wang, P. Chen, Y. Bai, J. H. Yun, G. Liu and L. Wang, Adv. Mater., 2018, 30, e1800486 CrossRef PubMed.
- L. Ye, X. Jin, Y. Leng, Y. Su, H. Xie and C. Liu, J. Power Sources, 2015, 293, 409–415 CrossRef CAS.
- Y. C. Huang, H. B. Li, M. S. Balogun, W. Y. Liu, Y. X. Tong, X. H. Lu and H. B. Ji, ACS Appl. Mater. Interfaces, 2014, 6, 22920–22927 CrossRef CAS PubMed.
- J. Jiang, L. Z. Zhang, H. Li, W. W. He and J. J. Yin, Nanoscale, 2013, 5, 10573–10581 RSC.
- H. Li and L. Z. Zhang, Nanoscale, 2014, 6, 7805–7810 RSC.
- H. Li, J. G. Shi, K. Zhao and L. Z. Zhang, Nanoscale, 2014, 6, 14168–14173 RSC.
- S. Polarz, J. Strunk, V. Ischenko, M. W. E. van den Berg, O. Hinrichsen, M. Muhler and M. Driess, Angew. Chem., Int. Ed., 2006, 45, 2965–2969 CrossRef CAS PubMed.
- K. Zhao, L. Z. Zhang, J. J. Wang, Q. X. Li, W. W. He and J. J. Yin, J. Am. Chem. Soc., 2013, 135, 15750–15753 CrossRef CAS PubMed.
- L. Ye, Y. Su, X. Jin, H. Xie and C. Zhang, Environ. Sci.: Nano, 2014, 1, 90–112 RSC.
- Y. H. Wu, B. Yuan, M. R. Li, W. H. Zhang, Y. Liu and C. Li, Chem. Sci., 2015, 6, 1873–1878 RSC.
- L. D. Bogomolova, Y. G. Teplyakov, A. A. Deshkovskaya and F. Caccavale, J. Non-Cryst. Solids, 1996, 202, 185–193 CrossRef CAS.
- S. Bale and S. Rahman, J. Non-Cryst. Solids, 2009, 355, 2127–2133 CrossRef CAS.
- F. A. Abdel-Wahab, A. Abdallah and H. AbdelMaksoud, J. Non-Cryst. Solids, 2020, 545, 120170–120175 CrossRef CAS.
- J. Di, C. Zhu, M. X. Ji, M. L. Duan, R. Long, C. Yan, K. Z. Gu, J. Xiong, Y. B. She, J. X. Xia, H. M. Li and Z. Liu, Angew. Chem., Int. Ed., 2018, 57, 14847–14851 CrossRef CAS PubMed.
- Z. T. Liang, Y. L. Cao, H. Y. Qin and D. Z. Jia, Mater. Res. Bull., 2016, 84, 397–402 CrossRef CAS.
- A. Q. Wang, Z. K. Zheng, H. Wang, Y. W. Chen, C. H. Luo, D. J. Liang, B. W. Hu, R. L. Qiu and K. Yan, Appl. Catal., B, 2020, 277, 119171–119183 CrossRef CAS.
- L. M. Zhou, J. H. Liu and Z. R. Liu, J. Hazard. Mater., 2009, 172, 439–446 CrossRef CAS PubMed.
- V. Stavila, K. H. Whitmire and I. Rusakova, Chem. Mater., 2009, 21, 5456–5465 CrossRef CAS.
- L. Q. Ye, C. Q. Gong, J. Y. Liu, L. H. Tian, T. Y. Peng, K. J. Deng and L. Zan, J. Mater. Chem., 2012, 22, 8354–8360 RSC.
- Z. S. Liu, J. L. Liu, H. Y. Wang, G. Cao and J. N. Niu, J. Colloid Interface Sci., 2016, 463, 324–331 CrossRef CAS PubMed.
- C. L. Mao, H. G. Cheng, H. Tian, H. Li, W. J. Xiao, H. Xu, J. C. Zhao and L. Z. Zhang, Appl. Catal., B, 2018, 228, 87–96 CrossRef CAS.
- L. Wang, D. D. Lv, F. Dong, X. L. Wu, N. Y. Cheng, J. Scott, X. Xu, W. C. Hao and Y. Du, ACS Sustainable Chem. Eng., 2019, 7, 3010–3017 CrossRef CAS.
- H. F. Cheng, B. B. Huang, X. Y. Qin, X. Y. Zhang and Y. Dai, Chem. Commun., 2012, 48, 97–99 RSC.
- D. D. Cui, L. Wang, K. Xu, L. Ren, L. Wang, Y. X. Yu, Y. Du and W. C. Hao, J. Mater. Chem. A, 2018, 6, 2193–2199 RSC.
- L. Q. Ye, L. Zan, L. H. Tian, T. Y. Peng and J. J. Zhang, Chem. Commun., 2011, 47, 6951–6953 RSC.
- W. J. Fan, H. B. Li, F. Y. Zhao, X. J. Xiao, Y. C. Huang, H. B. Ji and Y. X. Tong, Chem. Commun., 2016, 52, 5316–5319 RSC.
- J. Wang, W. J. Jiang, D. Liu, Z. Wei and Y. F. Zhu, Appl. Catal., B, 2015, 176, 306–314 CrossRef.
- Y. J. Cai, D. Y. Li, J. Y. Sun, M. D. Chen, Y. R. Li, Z. W. Zou, H. Zhang, H. M. Xu and D. S. Xia, Appl. Surf. Sci., 2018, 439, 697–704 CrossRef CAS.
- F. Fu, H. D. Shen, X. Sun, W. W. Xue, A. Shoneye, J. N. Ma, L. Luo, D. J. Wang, J. G. Wang and J. W. Tang, Appl. Catal., B, 2019, 247, 150–162 CrossRef CAS.
- Z. Wan, G. K. Zhang, X. Y. Wu and S. Yin, Appl. Catal., B, 2017, 207, 17–26 CrossRef CAS.
- K. L. Zhang, C. M. Liu, F. Q. Huang, C. Zheng and W. D. Wang, Appl. Catal., B, 2006, 68, 125–129 CrossRef CAS.
- J. Di, J. X. Xia, Y. P. Ge, L. Xu, H. Xu, M. Q. He, Q. Zhang and H. M. Li, J. Mater. Chem. A, 2014, 2, 15864–15874 RSC.
- C. H. Wang, C. L. Shao, Y. C. Liu and L. Zhang, Scripta Mater., 2008, 59, 332–335 CrossRef CAS.
- Q. Wang, W. Wang, L. L. Zhong, D. M. Liu, X. Z. Cao and F. Y. Cui, Appl. Catal., B, 2018, 220, 290–302 CrossRef CAS.
- L. Zhang, W. Z. Wang, S. M. Sun, D. Jiang and E. P. Gao, Appl. Catal., B, 2015, 162, 470–474 CrossRef CAS.
- Y. D. Hu, G. Chen, C. M. Li, Y. S. Zhou, J. X. Sun, S. Hao and Z. H. Han, J. Mater. Chem. A, 2016, 4, 5274–5281 RSC.
- D. Chen, F. Niu, L. S. Qin, S. Wang, N. Zhang and Y. X. Huang, Sol. Energy Mater. Sol. Cells, 2017, 171, 24–32 CrossRef CAS.
- X. Zhang, X. B. Wang, L. W. Wang, W. K. Wang, L. L. Long, W. W. Li and H. Q. Yu, ACS Appl. Mater. Interfaces, 2014, 6, 7766–7772 CrossRef CAS PubMed.
- M. Li, J. Y. Zhang, H. Gao, F. Li, S. E. Lindquist, N. Q. Wu and R. M. Wang, ACS Appl. Mater. Interfaces, 2016, 8, 6662–6668 CrossRef CAS PubMed.
- M. C. Gao, D. F. Zhang, X. P. Pu, X. Shao, H. Li and D. D. Lv, J. Am. Ceram. Soc., 2016, 99, 881–887 CrossRef CAS.
- H. Wang, X. Z. Yuan, Y. Wu, G. M. Zeng, W. G. Tu, C. Sheng, Y. C. Deng, F. Chen and J. W. Chew, Appl. Catal., B, 2017, 209, 543–553 CrossRef CAS.
- F. N. Zhang, Y. Zhao, Y. W. Li, G. J. Wu and J. Z. Zhao, J. Colloid Interface Sci., 2017, 505, 519–527 CrossRef CAS PubMed.
- Y. C. Sun, C. L. Shao, X. H. Li, X. H. Guo, X. J. Zhou, X. W. Li and Y. C. Liu, J. Colloid Interface Sci., 2018, 516, 110–120 CrossRef CAS PubMed.
- Y. Tan, C. Q. Li, Z. M. Sun, C. Liang and S. L. Zheng, J. Colloid Interface Sci., 2020, 564, 143–154 CrossRef CAS PubMed.
- B. Xu, Y. An, Y. Liu, X. Qin, X. Zhang, Y. Dai, Z. Wang, P. Wang, M.-H. Whangbo and B. Huang, J. Mater. Chem. A, 2017, 5, 14406–14414 RSC.
- Y. Tian, C. F. Guo, Y. J. Guo, Q. Wang and Q. Liu, Appl. Surf. Sci., 2012, 258, 1949–1954 CrossRef CAS.
- Y. X. Li, S. X. Ouyang, H. Xu, X. Wang, Y. P. Bi, Y. F. Zhang and J. H. Ye, J. Am. Chem. Soc., 2016, 138, 13289–13297 CrossRef CAS PubMed.
- H. Gnayem and Y. Sasson, ACS Catal., 2013, 3, 861 CrossRef CAS.
- L. Zhang, C. G. Niu, G. X. Xie, X. J. Wen, X. G. Zhang and G. M. Zeng, ACS Sustainable Chem. Eng., 2017, 5, 4619–4629 CrossRef CAS.
- J. Q. Chane, Y. Zhong, C. H. Hu, J. L. Luo and P. G. Wang, J. Environ. Chem. Eng., 2018, 6, 6971–6978 CrossRef.
- S. X. Weng, Z. X. Pei, Z. Y. Zheng, J. Hu and P. Liu, ACS Appl. Mater. Interfaces, 2013, 5, 12380–12386 CrossRef CAS PubMed.
- S. X. Weng, J. Hu, M. L. Lu, X. X. Ye, Z. X. Pei, M. L. Huang, L. Y. Xie, S. Lin and P. Liu, Appl. Catal., B, 2015, 163, 205–213 CrossRef CAS.
- G. G. Liu, T. Wang, W. Zhou, X. G. Meng, H. B. Zhang, H. M. Liu, T. Kako and J. H. Ye, J. Mater. Chem. C, 2015, 3, 7538–7542 RSC.
- S. W. Gao, C. S. Guo, J. P. Lv, Q. Wang, Y. Zhang, S. Hou, J. F. Gao and J. Xu, Chem. Eng. J., 2017, 307, 1055–1065 CrossRef CAS.
- J. Li, L. Z. Zhang, Y. J. Li and Y. Yu, Nanoscale, 2014, 6, 167–171 RSC.
Footnote |
| † Electronic supplementary information (ESI) available. See DOI: 10.1039/d1ra06961f |
| This journal is © The Royal Society of Chemistry 2021 |


