 Open Access Article
Synthesis of a plasmonic AgCl and oxygen-rich Bi24O31Cl10 composite heterogeneous catalyst for enhanced degradation of tetracycline and 2,4-dichlorophenoxy acetic acid†
Dorcas Adenuga *,
Sifiso Skosana,
Shepherd Tichapondwa and
Evans Chirwa
Water Utilization Division, Department of Chemical Engineering, University of Pretoria, Pretoria, Private Bag X20, Hatfield, 0028, South Africa. E-mail: dorcasadenuga@yahoo.co.uk; sifiso897@gmail.com; shepherd.tichapondwa@up.ac.za; evans.chirwa@up.ac.za
First published on 16th November 2021
Abstract
In this study, a AgCl/Bi24O31Cl10 composite heterostructure was constructed. Varying ratios of AgCl nanoparticles were immobilised onto the Bi24O31Cl10 rod-like structure. The physical and optical properties of the synthesised catalysts were characterised using a range of techniques. The photocatalytic activity of the catalysts was investigated by the degradation of 2,4-dichlorophenoxy acetic acid (2,4-D) and tetracycline (TC) under visible light irradiation. The performance of the composite photocatalysts was 18 and 3.4 times better in 2-4,D and TC photodegradation when compared to Bi24O31Cl10 alone. The improved photocatalytic performance was due to the surface plasmon resonance (SPR) effects of the Ag nanoparticles deposited on the surface of the Xwt%AgCl/BOC thereby improving the separation of the electron–hole pair. The effects of the initial contaminant concentration, pH, photocatalyst loading were investigated. Trapping experiments were also carried out to deduce the reactive species responsible for the degradation process and a preliminary mechanism of degradation was proposed. Successful mineralisation of 2,4-D and TC at 65% and 63% efficiency was also measured after 24 h and the potential for reusability of the as-synthesised photocatalyst was established. This work reports a promising heterogeneous photocatalyst for the removal of pollutants such as TC and 2,4-D from wastewater.
Introduction
Non-biodegradable organic contaminants in wastewater such as herbicides and antibiotics stem from large scale farms, pharmaceutical industries and hospitals.1 Antibiotics such as tetracycline, one of the most commonly used, are used in the treatment of bacterial infections in humans and animals.2 They are not fully utilised in their bodies and as such, about 50% of the antibiotics enters the environment as metabolites.3 2,4-D commonly used in farmland for the control of leaf weeds and grasses is a chlorinated hydrocarbon (Table S1†) widely known to be carcinogenic and mutagenic while having low biodegradability in the environment.4,5 2,4-D is included in the WHO Recommended Classification of Pesticides by Hazard (WHO Class II) and rated in category 4 as having an LD50 of 300–2000 mg kg−1 in the Globally Harmonized System of Classification and Labelling of Chemicals (GHS). Different wastewater treatment techniques such as adsorption, biological treatment combined with advanced oxidation process (AOP), filtration, reverse osmosis, electrochemistry has been employed in the removal of persistent organic pollutants in wastewater.6,7 However, there have been many limitations in the application of these conventional wastewater methods such as high energy consumption, low efficiency and the production of secondary waste streams.Photocatalysis has attracted attention as a viable technology for use in the environmental and energy generation fields.8 In the last couple of decades, researchers have continued to develop new photocatalysts in the area of photocatalysis and give more attention to more toxic compounds.9 This is especially true in cases where non-biodegradable, recalcitrant organic compounds are present in wastewater.10 The highly reactive free radicals generated when photocatalysts are irradiated with suitable light sources are capable of degrading and mineralizing recalcitrant compounds.11 However, commonly used photocatalysts such as TiO2 and ZnO have a major drawback in that they are only active under ultraviolet light irradiation, which constitutes less than 5% of solar radiation.12 This limits the practical application of these materials, as external sources of energy are required. It is therefore important to develop photocatalysts that are capable of functioning under visible light irradiation and ultimately utilise direct sunlight for the degradation and mineralisation of organic contaminants in wastewater.
In recent years, Bismuth oxyhalide photocatalysts BiOX (X = Cl, Br, and I) have been widely investigated due to their excellent electrical, catalytic and optical characteristics.13 Bismuth based materials are characterised by a narrow bandgap that aids photocatalytic activity in visible light due to their hybridized O 2p and Bi 6s2 valence bands.14 They have been used in the photodegradation and decolouration of dyes, water splitting and the removal of contaminants in wastewater systems.15 Literature shows that various BixOyClz forms have been synthesised and studied. Examples include Bi24O31Cl10,13 Bi12O17Cl2,16 Bi3O4Cl (ref. 17) and Bi12O15Cl6.18 It is generally accepted that the superior photocatalytic activity of these compounds is a result of their lower bandgap and superior surface area.19,20 Bi24O31Cl10 is said to have high electron mobility making it a good material for photoanode and photocatalysis applications.14 Bi24O31Cl10 is produced through the thermal decomposition of BiOCl at temperatures above 600 °C.21–24 The compound is a non-stoichiometric oxide of BiOCl with more O and less Cl atoms, it has high chemical and physical stability and a narrow bandgap (2.78 eV)25 in comparison to BiOCl (3.19–3.6 eV)23 thereby improving its visible-light absorption potential. The efficiency of a photocatalyst is measured by its (i) absorption in light, (ii) separation of charge and (iii) photocatalytic reaction.20
Studies have shown that neat Bi24O31Cl10 has low photocatalytic activity under visible light irradiation as a result of its high electron–hole recombination rate.25,26 Therefore, band engineering is used to prepare heterojunction photocatalysts to overcome the intrinsic disadvantage of a single component photocatalyst.27
Noble-metal based nanoparticles such as Au, Pt and Ag are characterised by strong absorption in the UV-Vis region as a result of the oscillations of surface electrons.28 This phenomenon is referred to as surface plasmon resonance (SPR). Ag-based nanoparticles are selected as a result of their relatively cheaper cost which makes them a good candidate for the fabrication of nanocomposite photocatalyst.29 AgCl is reported to have a wide bandgap of 3.25–3.26 eV which is only excited by UV light irradiation.30,31 During irradiation, plasmonic Ag is formed on the surface of the AgCl, therefore improving the photocatalytic activity of the photocatalyst.
Herein, we report the in situ fabrication of AgCl/Bi24O31Cl10 composite photocatalyst. The modification of AgCl on the surface of BOC broadened the photoabsorption of the synthesised composite photocatalyst in the visible light region hereby enhancing the photocatalytic activity. The Ag0 formed during irradiation acted as an electron mediator thereby inhibiting the re-combination of the photogenerated carriers. Successful mineralisation of 2,4-D and TC at 65% and 63% efficiency was measured after 24 h and the reusability of the photocatalyst was investigated. Finally, a charge transfer mechanism was postulated with the aid of species trapping experiments.
Experimental
Chemicals and materials
Materials used in the synthesis process were of analytical grade and used without special treatment. Bismuth(III) nitrate pentahydrate (Bi(NO3)3·5H2O), cetyltrimethylammonium chloride (CTAC), tetracycline, 2,4 dichloro phenoxy acetic acid (2,4-D), HPLC grade methanol, 2-propanol, p-benzoquinone and oxalic acid dehydrate were purchased from Sigma Aldrich. Glacial acetic acid, silver nitrate (AgNO3) and trimethylamine were purchased from Glassworld, South Africa. Deionised water used in this study was from an Elga Purelab Chorus unit.Preparation of Bi24O31Cl10
Bi(NO3)3·5H2O (4.85 g) was dissolved in 30 mL water and 15 mL acetic acid. 1 mol (3.2 g) of CTAC was dissolved in 30 mL water. The CTAC solution was added to the bismuth nitrate solution and the mixture was continuously stirred for one hour. The solution was then put in the autoclave for 12 h at 120 °C. The precursor material (BiOCl) was then collected and washed three times with ethanol and three times with water. This was then dried at 80 °C for 4 h. The dried white particles were calcined in a furnace at 660 °C for 6 h until a light yellow powder is noticed.14Preparation of AgCl/Bi24O31Cl10
The synthesised Bi24O31Cl10 (0.2 g) was added into 50 mL of water while being continuously stirred. A 10 mL solution containing 50 mg CTAC was added to the suspension and stirred for 1 h. AgNO3 (27 mg) dissolved in 10 mL water was slowly added into the Bi24O31Cl10/CTAC suspension and stirred continuously for 2 h. The collected precipitate was washed with ethanol and water before being dried at 60 °C for 8 h. This resulted in 10% AgCl on a mass basis being deposited on the BOC to form a composite photocatalyst. The process was then repeated using different stoichiometric amounts to prepare 20%AgCl/BOC and 50%AgCl/BOC as illustrated in Scheme 1 and eqn (1)–(4).32| Bi(NO3)3 + C16H33(CH3)3N–Cl + H2O → BiOCl + C16H33(CH3)3N+ + 2H+ + 3NO3− | (1) |
 | (2) |
| Bi24O31Cl10 + AgNO3 → Ag+–Bi24O31Cl10 + NO3− | (3) |
| Ag+–Bi24O31Cl10 + C16H33(CH3)3N–Cl → AgCl/Bi24O31Cl10 + C16H33(CH3)3N+ | (4) |
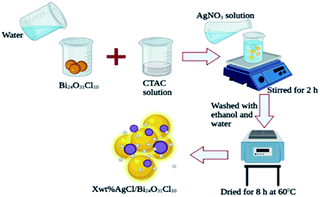 | ||
| Scheme 1 Schematic diagram illustrating the preparation process of Xwt%AgCl/BOC heterojunction photocatalyst. | ||
Characterisation
Scanning electron microscopy (SEM) images and energy dispersive spectroscopy (EDS) spectrum were obtained using a Zeiss Crossbeam 540 FEG SEM instrument. The morphologies were further investigated by transmission electron microscopy (TEM) (JEOL JEM 2100F). The X-ray diffraction (XRD) analysis was performed using a PANalytical X'Pert Pro powder diffractometer in θ–θ configuration with an X'Celerator detector, variable divergence- and fixed receiving slits with Fe filtered Co-Kα radiation (λ = 1.789 A). UV-Vis spectra were recorded using a VWR UV-1600PC Spectrophotometer at an interval of 1 nm from 600 nm to 200 nm. The nitrogen sorption isotherm and BET surface area were measured on a Micromeritics TriStar II. Thermogravimetric analysis (TGA) was done using an SDT Q600 instrument with heating in Nitrogen gas from ambient temperature to 800 °C. Photoluminescence (PL) spectra of the photocatalyst were measured on a Shimadzu RF-6000 Spectro fluorophotometer.Photocatalytic tests
Stock solutions (100 mg L−1) were prepared by dissolving 0.1 g of 2,4-D and TC in 5 mL of acetonitrile and methanol respectively before being topped with water to the 1 L mark. Consequently, dilutions were prepared from these stock solutions to make the required concentrations. Typically, 0.1 g of the synthesised photocatalyst was added to a 200 mL pollutant solution (20 mg L−1) and stirred for 30 min in the dark to achieve the adsorption–desorption equilibrium. Thereafter, the suspension was irradiated under six 30 W Fluoro lamps to simulate solar light. The photocatalytic experiments were carried out in a 400 mL beaker containing a 200 mL solution and a magnetic stirrer to ensure a homogenous solution of pollutant and catalyst. Aliquot of 3 mL samples were collected at 60 min intervals. These aliquots were centrifuged and filtered using a 0.45 μm syringe filter to remove particles before analysis. The unadjusted pH of 2,4-D and TC are 4 and 5.3 and the pH was adjusted using 0.1 M H2SO4 and NaOH.Analytical measurements
The concentration of 2,4-D and TC was quantified on a Waters HPLC with a Waters 2489 UV/VIS detector using a Waters PAH C18 (4.6 × 250 mm, 5 μm) column. The mobile phases for 2,4-D detection consist of two solvents 40% 0.1% acetic acid in water and 60% methanol. The injection volume was 10 μL at a flow rate of 1 mL min−1, detector wavelength was set at 284 nm and column temperature at 35 °C. Tetracycline was detected using two solvents 47% methanol and 53% 0.01 mol L−1 oxalic acid. Detector wavelength was set to 355 nm at 10 μL and a flow rate of 1 mL min−1 with column temperature at 40 °C. The mineralisation of TC and 2,4-D were measured using a Shimadzu Total organic carbon TOC-V WP analyser.Results and discussion
Catalyst characterisation
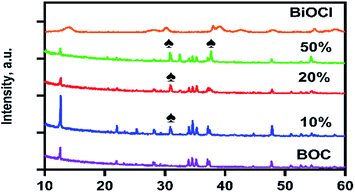
The crystalline structure and purity of the synthesised materials were investigated using XRD and the spectra are illustrated in Fig. 1. The particles had a high crystallinity with monoclinic Bi24O31Cl10 (JCPD no. 75-0877)25 as indexed in diffraction peaks present at 12.6°, 29°, 34.5°, 36.6°, 35.2°, and 37.5°. It is evident that the characteristic peaks of BOC remain present in the composite photocatalyst, depicting the assembly of AgCl on the surface of BOC does not change its characteristics. The intensities of the diffraction peaks of BOC reduced as the AgCl content in the composite photocatalyst increased. The presence of AgCl was evidenced by the appearance of new peaks at 30.8° and 37.7° in the composite spectra. A comparison of the spectra for the BiOCl precursor and the calcined BOC revealed a clear phase transformation from the near amorphous BiOCl to a highly crystalline BOC product. The average crystallite size of the photocatalysts could be estimated from the Scherrer formula: D = Kλ/β![[thin space (1/6-em)]](https://www.rsc.org/images/entities/char_2009.gif) cos
cos![[thin space (1/6-em)]](https://www.rsc.org/images/entities/char_2009.gif) θ where D is the crystallite size in nm, K is a constant of 0.9, λ is 0.1789 in nm, β is the width of the line at half-maximum height in radians and θ is the angle of diffraction. The calculated average crystallite size of the synthesised photocatalyst based on two prominent peaks (12.6° and 47.7°) of BOC are calculated to be 52.5–82.8 nm.
θ where D is the crystallite size in nm, K is a constant of 0.9, λ is 0.1789 in nm, β is the width of the line at half-maximum height in radians and θ is the angle of diffraction. The calculated average crystallite size of the synthesised photocatalyst based on two prominent peaks (12.6° and 47.7°) of BOC are calculated to be 52.5–82.8 nm.
Fig. 2a shows the SEM image of the as-prepared BOC. Clustered, micron-sized, rod-like particles with angular surfaces were observed. Fig. 2b–d, reveal that the AgCl precipitated on the surface of the BOC with near-spherical particles forming agglomerates. As expected, there was a noticeable increase in the density of AgCl particles with an increase in the percentage content with the highest coating observed in the 50%AgCl/BOC composite. The presence of irregular structural morphologies was confirmed in the TEM image of the synthesised 50%AgCl/BOC in Fig. 2e. This confirms the presence of two different materials in the synthesised composite material. Nano-sized AgCl particles are seen to be self-assembled on the surface on larger rod-like BOC materials. EDS mapping, spectra and elemental analysis of the synthesised photocatalysts indicated the presence of Bi, O and Cl in the BOC photocatalyst Table S2 and Fig. S1† and the weight ratio of Bi![[thin space (1/6-em)]](https://www.rsc.org/images/entities/char_2009.gif) :
:![[thin space (1/6-em)]](https://www.rsc.org/images/entities/char_2009.gif) Cl corresponds to a 2.4/1 molecular ratio showing that BOC was formed.24 Xwt%AgCl was loaded on the surface of the BOC using pre-calculated stoichiometric ratios and the elemental mapping are shown in Fig. S2 to S4† depicting the presence and distribution of Ag, Bi, O and Cl in the prepared composite catalyst.
Cl corresponds to a 2.4/1 molecular ratio showing that BOC was formed.24 Xwt%AgCl was loaded on the surface of the BOC using pre-calculated stoichiometric ratios and the elemental mapping are shown in Fig. S2 to S4† depicting the presence and distribution of Ag, Bi, O and Cl in the prepared composite catalyst.
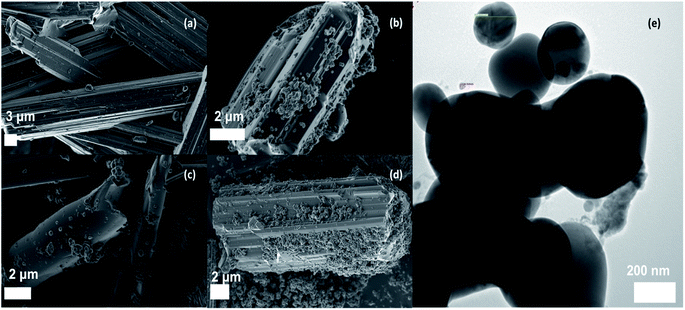 | ||
| Fig. 2 SEM image of (a) Bi24O31Cl10, (b) 10%AgCl/Bi24O31Cl10, (c) 20%AgCl/Bi24O31Cl10, (d) 50%AgCl/Bi24O31Cl10, (e) TEM image of 50%AgCl/Bi24O31Cl10. | ||
It should be noted that the optical properties of a given material are extremely important when selecting an efficient photocatalyst. The light absorption ranges of the synthesised catalysts were investigated using UV-Vis analysis. The resulting spectra are presented in Fig. 3a. The pure BOC photocatalyst featured higher adsorption in the ultraviolet light region with minimal adsorption recorded beyond the visible range. The addition of AgCl immediately widened the light adsorption into the visible light absorption region (400 to 600 nm). The increase in visible light adsorption with an increase in wt% of AgCl was attributed to the SPR effects of the silver nanoparticles.33 This enabled the synthesised composite photocatalyst, Xwt%AgCl/BOC to absorb visible light and potentially improve its photocatalytic activity. The absorption band edge of BOC was estimated at 420 nm. The photoluminescence spectra of the synthesised photocatalysts are shown in Fig. 3b with excitation and emission wavelength at 241 nm and 246 nm. The intensity of the emission illustrates the rate of electron–hole separation of the synthesised photocatalyst. The higher the intensity, the higher the probability of electron–hole pair recombination ultimately resulting in reduced photocatalytic activity.34 The intensity of the PL spectra increases in the following order: BOC > 10AgCl/BOC > 20AgCl/BOC > 50AgCl/BOC. This trend showed that assembling different wt% of AgCl on the surface of BOC resulted in improved electron–hole separation which hints towards improved photocatalytic efficiency from the material.
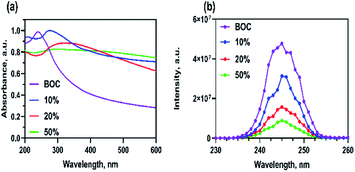 | ||
| Fig. 3 Optical properties of synthesised materials showing (a) UV-vis spectra and (b) photoluminescence spectra (PL). | ||
N2 desorption–adsorption isotherms of the synthesised photocatalysts are shown in Fig. S5a.† BOC has a Brunauer–Emmert–Teller (BET) surface area of 0.0092 m2 g−1. This low surface area is consistent with the SEM image (Fig. 2a) with a smooth BOC surface. After the introduction of AgCl on the surface, the BET surface area increases to 0.55 m2 g−1 for 10%AgCl/BOC, 1.09 m2 g−1 for 20%AgCl/BOC and 1.50 m2 g−1 for 50%AgCl/BOC. The surface area increases with an increasing amount of AgCl. This is advantageous for photocatalysis as the photocatalyst with a higher surface area will have more active sites and therefore exhibit better photocatalytic performance.35 The adsorption–desorption isotherms show a type IV isotherm with an H3 hysteresis loop indicating the presence of mesopores on the surface of the BOC as there are no pores present in the AgCl.36 Thermogravimetric analysis was performed on the synthesised photocatalyst to determine the thermal stability of BOC and X%AgCl/BOC (Fig. S5b†). The overall weight loss in the BOC was 7%. Gradual weight loss in all materials occurs until 600 °C at which 2% weight loss had occurred which is attributed to loss of moisture. The weight loss observed after 600 °C was attributed to chlorine ions volatilizing into the air due to heating.37 The relatively low mass loss observed in this temperature range reveals the thermal stability of the as-prepared photocatalysts.
Photocatalytic activity
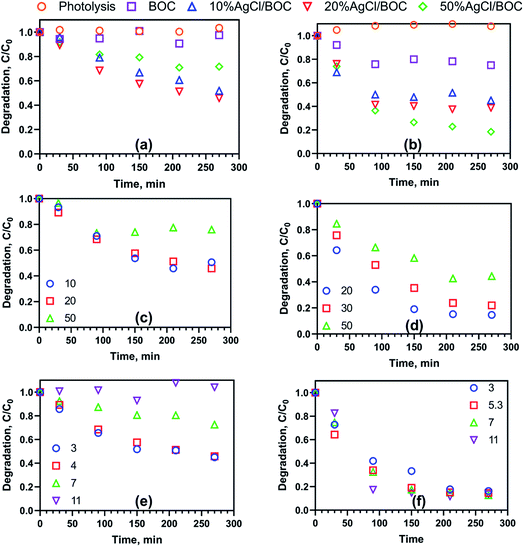
The photocatalytic activity of the synthesised materials was evaluated using 20 mg L−1 of simulated TC and 2,4-D wastewater under visible light irradiation and a catalyst loading of 0.5 g L−1. In Fig. 4a, after 4 h of light irradiation only, there is no degradation measured and it points to the stability of 2,4-D under the irradiation of light. BOC showed minimal degradation (3%) of 2,4-D under visible light irradiation. As a result of the wide bandgap of BOC and the combination of photogenerated carriers, the photocatalytic degradation of 2,4-D is unable to proceed. After 4 h of irradiation, the photodegradation efficiency of 2,4-D using 10%AgCl/BOC, 20%AgCl/BOC and 50%AgCl/BOC were 48%, 54% and 55% respectively. There was no significant increase in the photodegradation efficiency when 20%AgCl/BOC and 50%AgCl/BOC was used in 2,4-D degradation. As seen from the SEM images, increasing the amount of AgCl nanoparticles on the surface of BOC caused the agglomeration of the particles. This could have inhibited degradation due to the lack of reactive sites and insufficient contact with BOC. The results, therefore, show that to harness the advantage of depositing AgCl with BOC, there is a maximum amount of AgCl suitable for efficient photodegradation. The adsorption (dark only) result using 20%AgCl/BOC in the degradation of 2,4-D had a photocatalytic efficiency of 10%. Therefore, for the removal of 2,4-D using the synthesised photocatalyst to proceed, light irradiation is of utmost importance.Tetracycline degradation in the presence of visible light alone was negligible. After 4 h, 10%AgCl/BOC, 20%AgCl/BOC, 50%AgCl/BOC had a TC degradation efficiency of 55%, 61% and 82% respectively (Fig. 4b). This is 2.2, 2.44 and 3.28 more efficient than using BOC (25%). The adsorption of TC using 50%AgCl/BOC also measured 24% degradation. These results show the effectiveness of combining AgCl and BOC to form a composite photocatalyst for the visible light photodegradation of 2,4-D and tetracycline. The activity and progress of degradation differ in both pollutants. TC is characterised by a yellow colour which has a major absorption range in wavelength 300–430 nm (ref. 38) while 2,4-D is colourless. This enables TC molecules to be sensitised by visible light and be easily adsorbed on the surface of the photocatalysts thereby enhancing photodegradation due to the closeness of the adsorbed contaminants with that of the reactive sites. Wu et al. (2020)39 report the degradation of TC in visible light using TiO2 where they also note that the visible light absorption of TC causes it to excite electrons which are then transferred from its LUMO to the conduction band of the photocatalyst. While the composite photocatalyst of various mass compositions behaves similarly to 2,4-D degradation, the 50%AgCl/BOC has the highest degradation efficiency in TC degradation. In the rest of this study, 20%AgCl/BOC was used in the degradation of 2,4-D while 50%AgCl/BOC was used in the degradation of TC.
The effects of catalyst loading were investigated and the results are presented in Fig. S6.† The optimum catalyst loading varied depending on the nature of the target pollutant. For 2,4-D, the degradation efficiency increased from 31.3% to 54.2% when catalyst loading increased from 0.25 g L−1 to 0.5 g L−1. A further two-fold increase to 1 g L−1 resulted in decreased degradation efficiency to 38.7%. An increase in catalyst loading generally increases the number of active sites and reactive radicals produced, resulting in enhanced degradation.40 However, beyond a certain loading, the increased concentration of the photocatalyst results in a turbid suspension. This in turn reduces the amount of light incident on the surface of the photocatalyst as shielding and refraction occur. Also, there could be a possible aggregate of particles as the mass of photocatalyst increases. This reduces the availability of active sites and the photodegradation efficiency decreases.41 Meanwhile, in TC degradation, an initial increase is measured from 64.3% to 81.6% and while the photocatalyst concentration is doubled, a further increase of 3% is measured.
Further investigation was carried out in Fig. 4c and d to study the effect of the initial concentration of 2,4-D and TC on photocatalytic degradation efficiency. The initial concentration of 2,4-D was investigated in the range of 10 mg L−1 to 50 mg L−1 while that of TC was studied from 20 mg L−1 to 50 mg L−1. 2,4-D showed degradation efficiency of 49%, 54% and 24% illustrating a trend of 20 mg L−1 > 10 mg L−1 > 50 mg L−1. 50%AgCl/BOC showed reasonable degradation across the different initial concentrations of TC. TC measured a degradation efficiency of 85%, 78% and 56% at 20, 30 and 50 mg L−1. The results favour quicker degradation of organic pollutants at lower concentrations. At lower initial concentrations of pollutants, there are more reactive sites to contact the pollutant molecules thereby improving the degradation efficiency.45
The effect of pH on the visible-light photodegradation of pollutants was done at selected pH of 3, 7 and 11 which represents the acidic, neutral and basic conditions (Fig. 4e and f). In the degradation of 2,4-D, the optimum degradation of 54% was realised at pH 3 and the unadjusted pH 4. At the neutral pH of 7, degradation efficiency was reduced to 27% while no degradation occurred under alkaline conditions (pH 11). The photodegradation of 2,4-D decreased with increasing pH.
The inhibition in photodegradation measured at the alkaline environment is that as 2,4-D ionizes as anionic in solution, the surface charge of the photocatalyst is negative causing a repulsive force that decreases photodegradation. TC degradation was shown to be independent of pH with degradation efficiencies of 85 and 87% recorded in the 3 to 11 pH range. TC has been reported to be an amphoteric molecule as it is cationic at pH less than 3.3, neutral in the pH range of 3.3–7.68 and anionic at pH above 7.68.46,47 Therefore, TC will have a significant degradation across a wider pH range as a result of its unique nature of speciation and characteristicS.48
Table 1 summarises the various recently reported Bi24O31Cl10-based heterogeneous photocatalysts in comparison with the present study. Six low wattage (30 W) Fluoro lamps were used to carry out the photodegradation experiments in this study and the efficiency measured in both the degradation of 2,4-D and TC showed great potential when compared to the other studies.
| Photocatalyst | Light source | Pollutant | Degradation | Ref. |
|---|---|---|---|---|
| AgCl/Bi24O31Cl10 | 30 W (6) | 2,4-D and TC | 54.2% and 82% | This study |
| MoS2/g-C3N4/Bi24O31Cl10 | 300 W Xe lamp | TC | 97.5% | 25 |
| BiOCl/Bi24O31Cl10 | 350 W Xe lamp | MO, RhB and 4-CP | 74.5%, 98.1% and 88.2% | 23 |
| BiOCl/Bi24O31Cl10/rGO | 400 W halogen lamp | OFL, CIP and LVO | 84.8%, 57.2% and 70.7% | 15 |
| g-C3N4/Eu(III) doped Bi24O31Cl10 | 250 W Xe lamp | RhB | 91.9% | 8 |
| SnO2/Bi2S3/BiOCl–Bi24O31Cl10 | Simulated sunlight | RhB | 80.8% | 42 |
| Pt/Bi24O31Cl10 | 300 W Xe lamp | MO | 84% | 43 |
| AgI/Ag/Bi24O31Cl10 | 300 W Xe lamp | MO and phenol | 84.3% and 55.1% | 44 |
| Ag/Bi24O31Cl10 | 240 W Xe lamp | RhB | 95.8% | 26 |
Kinetics
The experiments were modelled using the zero-order, pseudo-first-order and pseudo-second-order kinetics represented in eqn (5)–(7) for quantitative evaluation using the obtained result from Fig. 4 and the rate constants and regression coefficients are presented in Table S3 and Table S4.†
 | (5) |
 | (6) |
 | (7) |
Mineralisation, reusability and mechanism discussion
One of the major drivers for the use of advanced oxidation processes such as photocatalysis is their ability to degrade and mineralize target pollutants resulting in environmentally benign reaction products. An analysis of the total organic carbon (TOC) present after treatment gives an indication of the extent of mineralisation and points towards the possible formation of intermediate degradation products. In this study, TOC analysis was conducted on both 2,4-D and TC after photodegradation. Degradation test removals of 54% and 81% for 2,4-D were recorded after 4 and 24 h, respectively. The corresponding TOC removals were 50% and 65% for the same time frames. TC degradation results indicated that 85.4% had been removed after 4 h, and complete degradation was recorded after 24 h. The measured mineralisation rate was 13% and 63% after 4 h and 24 h respectively. The TOC removal depicts that intermediates were formed during the degradation process. 2,4-D also had a faster rate of mineralisation in the first 4 h compared to TC. It is hypothesised that since 2,4-D is a less complex compound compared to TC, it has fewer competing intermediates in comparison to TC in the initial degradation period. Researchers have identified that a range of intermediate compounds are produced when 2,4-D and TC are degraded using advanced oxidation processes. 2,4-dichlorophenol, 2-chlorophenol, 3,5-dichlorobenzene-1,2-diol, 2-chlorobenzene-1,4-diol, succinic acid and acetic acid are the major intermediates formed through photodegradation of 2,4-D.50–52 The intermediates produced during the degradation of tetracycline (C22H24N2O8) include: C22H26N2O9, C22H23NO9, C12H12O4 and carboxylic acid.53,54 Although, 2,4-D and TC were not completely mineralised in the experimental time, it is believed that with a longer residence time, the intermediates will eventually be broken down into CO2 and water.The reusability potential of the as-prepared photocatalyst was explored in Fig. S7.† In the photocatalytic degradation of TC using 50%AgCl/BOC, after three cycles of using the same photocatalyst, 79% TC removal is measured which demonstrates good reusability and stability of the photocatalyst in polluted water.
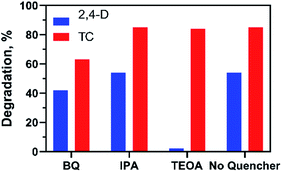
The photocatalytic reaction mechanism of the photocatalysts was investigated through capture experiments (Fig. 5). P-Benzoquinone (BQ), 2-propanol (IPA) and triethanolamine (TEOA) were used as superoxide radical (˙O2−), hydroxyl radical (˙OH) and hole (h+) scavengers to investigate their roles in the photocatalytic process.55 The addition of BQ and TEOA to 2,4-D reduced the degradation efficiency by 12% and 52% while the addition of IPA did not suppress the efficiency of the 20%AgCl/BOC. In the degradation of TC using 50%AgCl/BOC, the addition of BQ reduced the degradation efficiency to 63% while IPA and TEOA did not impact the degradation efficiency negatively. The 2,4-D scavenger degradation results show that the main reactive species responsible for the degradation are ˙O2− and h+ while the reactive species in TC degradation was the superoxide radical. This difference is attributed to the TC-sensitization that occurred whereby TC molecules are absorbed on the surface of the photocatalyst56 possibly taking prevalence over the activity of holes during photodegradation. The results also reveal that hydroxyl radicals are not an important reactive agent in this degradation process. A photodegradation mechanism can be proposed for the degradation when Xwt%AgCl/BOC is used in the degradation of organic contaminants in visible light as illustrated in eqn (8)–(12) and Fig. 6.
 | (8) |
| AgCl(e−, h+)/Ag/BOC(e−, h+) → AgCl(e−) + BOC(h+) | (9) |
| BOC(h+) + pollutants → intermediates → CO2 + H2O | (10) |
| AgCl(e−) + O2 → AgCl + ˙O2− | (11) |
| ˙O2− + pollutants → products | (12) |
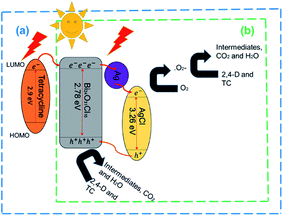 | ||
| Fig. 6 Proposed degradation mechanism of Xwt%AgCl/BOC in the photocatalytic degradation of (a) TC and (b) 2,4-D. | ||
During the irradiation and photodegradation process, Ag0 is expected to form due to light irradiation and acts as an electron mediator between AgCl and BOC.57 This formation was validated and illustrated in Fig. S8† where a colour change is seen when 50%AgCl/BOC is irradiated in visible light in comparison to being stirred in the dark. This colour is attributed to the formation of Ag0 photoreduced on the surface of the AgCl during irradiation.58 The formed Ag0 is photoexcited as a result of its SPR effects,59 thereby transporting electrons from the conduction band (CB) of BOC to that of AgCl while the holes in the valence band of AgCl is transferred to that of BOC where it directly degrades the organic contaminants.60 This ensures that the photogenerated carriers are effectively separated. AgCl has a bandgap of 3.26 eV with valence band and conduction band of +3.20 eV and −0.06 eV (ref. 61) while BOC has a valence band and conduction band of +1.49 eV and −1.29 eV. The reduction potential of oxygen E0(O2/˙O2) is −0.046 eV.62 The CB of AgCl being more negative than that of oxygen means that O2 could be reduced ˙O2− which is also a reactive species responsible for photodegradation in this study. In the TC mechanism, as a result of TC adsorbed on the surface of BOC, a TC complex is formed39 which can be excited by visible light thereby causing electron transfer from the LUMO of TC to the conduction band of the photocatalyst.
Conclusion
In summary, a novel AgCl/Bi24O31Cl10 composite photocatalyst was developed successfully by loading AgCl nanoparticles on the surface of rod-like Bi24O31Cl10 and showed good photodegradation efficiency in the removal of 2,4-D and TC under visible light irradiation. The heterojunction formed improved the photoabsorption of the photocatalyst in the visible light region and improved the separation of photogenerated carriers which was evidenced by the improved photocatalytic activity. Reasonable mineralisation of both pollutants at 63% and 65% efficiency is measured. The proposed mechanism suggests that holes and oxygen radicals are the main reactive species responsible for the mineralisation of 2,4-D and TC. The results show that this technology can be combined with other technologies for the successful removal of toxic pollutants in wastewater.Author contributions
Dorcas Adenuga: conceptualization, methodology, investigation, writing-original draft, visualization. Sifiso Skosana: investigation. Shepherd Tichapondwa: conceptualization, resources, writing – review & editing, supervision. Evans Chirwa: conceptualization, resources, writing – review & editing, supervision, funding acquisition.Conflicts of interest
There are no conflicts to declare.Acknowledgements
This work was financially supported by the National Research Foundation of South Africa (Grant numbers: CSUR180215313534, TTK18024324064, MND190514436254) awarded to Prof. Evans Chirwa, Dr Shepherd Tichapondwa and Dorcas Adenuga. Dorcas Adenuga also acknowledges the Doctoral scholarship received from the University of Pretoria.Notes and references
- S. Tang, M. Zhao, D. Yuan, X. Li, Z. Wang, X. Zhang, T. Jiao and J. Ke, Chemosphere, 2021, 268, 129315 CrossRef CAS.
- C. Jin, W. Li, Y. Chen, R. Li, J. Huo, Q. He and Y. Wang, Ind. Eng. Chem. Res., 2020, 59, 2860–2873 CrossRef CAS.
- Z. Wang, L. Jiang, K. Wang, Y. Li and G. Zhang, J. Hazard. Mater., 2021, 410, 124948 CrossRef CAS PubMed.
- L. F. Leon-Fernandez, J. Villaseñor, L. Rodriguez, P. Cañizares, M. A. Rodrigo and F. J. Fernández-Morales, J. Electroanal. Chem., 2019, 854, 113564 CrossRef CAS.
- N. Alikhani, M. Farhadian, A. Goshadrou, S. Tangestaninejad and P. Eskandari, Environ. Nanotechnol. Monit. Manag., 2021, 15, 100415 Search PubMed.
- A. Majumder and A. K. Gupta, J. Environ. Chem. Eng., 2020, 8(6), 104463 CrossRef CAS.
- J. Liu, B. Zhou, H. Zhang, J. Ma, B. Mu and W. Zhang, Bioresour. Technol., 2019, 294, 122152 CrossRef CAS.
- Z. Li, C. Jin, C. Lv, M. Wang, J. Kang, S. Liu, Y. Xie and T. zhu, Mater. Chem. Phys., 2019, 237, 121829 CrossRef CAS.
- A. Majumder, D. Saidulu, A. K. Gupta and P. S. Ghosal, J. Environ. Manage., 2021, 293, 112858 CrossRef CAS PubMed.
- O. Fónagy, E. Szabó-Bárdos and O. Horváth, J. Photochem. Photobiol. A, 2021, 407, 113057 CrossRef.
- C. Bi, J. Cao, H. Lina, Y. Wang and S. Chen, Appl. Catal., B, 2016, 195, 132–140 CrossRef CAS.
- Q. Yan, X. Xie, Y. Liu, S. Wang, M. Zhang, Y. Chen and Y. Si, J. Hazard. Mater., 2019, 371, 304–315 CrossRef CAS PubMed.
- X. Jin, L. Ye, H. Wang, Y. Su, H. Xie, Z. Zhong and H. Zhang, Appl. Catal., B, 2015, 165, 668–675 CrossRef CAS.
- L. Wang, J. Shang, W. Hao, S. Jiang, S. Huang, T. Wang, Z. Sun, Y. Du, S. Dou, T. Xie, D. Wang and J. Wang, Sci. Rep., 2014, 4, 7384 CrossRef PubMed.
- M. Shabani, M. Haghighi, D. Kahforoushan and A. Haghighi, Sol. Energy Mater. Sol. Cells, 2019, 193, 335–350 CrossRef CAS.
- X. Xiao, J. Jiang and L. Zhang, Appl. Catal., B, 2013, 142–143, 487–493 CrossRef CAS.
- B. Xu, Y. Gao, Y. Li, S. Liu, D. Lv, S. Zhao, H. Gao, G. Yang, N. Li and L. Ge, Appl. Surf. Sci., 2020, 507, 144806 CrossRef CAS.
- C.-Y. Wang, X. Zhang, X.-N. Song, W.-K. Wang and H.-Q. Yu, ACS Appl. Mater. Interfaces, 2016, 8, 5320–5326 CrossRef CAS.
- X. Jin, L. Ye, H. Xie and G. Chen, Coord. Chem. Rev., 2017, 349, 84–101 CrossRef CAS.
- L. Yao, H. Yang, Z. Chen, M. Qiu, B. Hu and X. Wang, Chemosphere, 2021, 273 Search PubMed.
- M. Shabani, M. Haghighi and D. Kahforoushan, Catal. Sci. Technol., 2018, 8, 4052–4069 RSC.
- S.-m. Fu, G.-s. Li, X. Wen, C.-m. Fan, J.-x. Liu, X.-c. Zhang and R. Li, Trans. Nonferrous Met. Soc. China, 2020, 30, 765–773 CrossRef CAS.
- F.-t. Li, Q. Wang, X.-j. Wang, B. Li, Y.-j. Hao, R.-h. Liu and D.-s. Zhao, Appl. Catal., B, 2014, 150–151, 574–584 CrossRef CAS.
- X. Jin, C. Lv, X. Zhou, C. Zhang, B. Zhang, H. Su and G. Chen, J. Mater. Chem. A, 2018, 6, 24350–24357 RSC.
- J. Kang, C. Jin, Z. Li, M. Wang, Z. Chen and Y. Wang, J. Alloys Compd., 2020, 825, 153975 CrossRef CAS.
- J. Song, L. Zhang, J. Yang, J.-S. Hu and X.-H. Huang, J. Alloys Compd., 2018, 735, 660–667 CrossRef CAS.
- X. Fang, J. Chen and J. Zhan, Ceram. Int., 2020, 46, 23245–23256 CrossRef CAS.
- Z. Feng, J. Yu, D. Sun and T. Wang, J. Colloid Interface Sci., 2016, 480, 184–190 CrossRef CAS PubMed.
- M. Ai, W. Qin, T. Xia, Y. Ye, X. Chen and P. Zhang, Int. J. Photoenergy, 2019, 2019, 1–11 CrossRef.
- J. Gou, X. Li, H. Zhang, R. Guo, X. Deng, X. Cheng, M. Xie and Q. Cheng, J. Ind. Eng. Chem., 2018, 59, 99–107 CrossRef CAS.
- P. Raizada, P. Thakur, A. Sudhaik, P. Singh, V. K. Thakur and A. Hosseini-Bandegharaei, Arabian J. Chem., 2020, 13, 4538–4552 CrossRef CAS.
- X. Li, C. Zhu, Y. Song, D. Du and Y. Lin, RSC Adv., 2017, 7, 10235–10241 RSC.
- X. Liang, P. Wang, M. Li, Q. Zhang, Z. Wang, Y. Dai, X. Zhang, Y. Liu, M.-H. Whangbo and B. Huang, Appl. Catal., B, 2018, 220, 356–361 CrossRef CAS.
- S. Ghattavi and A. Nezamzadeh-Ejhieh, Compos. B Eng., 2020, 183, 107712 CrossRef CAS.
- X.-J. Wen, C.-G. Niu, D.-W. Huang, L. Zhang, C. Liang and G.-M. Zeng, J. Catal., 2017, 355, 73–86 CrossRef CAS.
- T. Xiong, H. Zhang, Y. Zhang and F. Dong, Chin. J. Catal., 2015, 36, 2155–2163 CrossRef CAS.
- P. Cui, J. Wang, Z. Wang, J. Chen, X. Xing, L. Wang and R. Yu, Nano Res., 2016, 9, 593–601 CrossRef CAS.
- A. Zyoud, W. Jondi, N. AlDaqqah, S. Asaad, N. Qamhieh, A. Hajamohideen, M. H. Helal, H. Kwon and H. S. Hilal, Solid State Sci., 2017, 74, 131–143 CrossRef CAS.
- S. Wu, H. Hu, Y. Lin, J. Zhang and Y. H. Hu, Chem. Eng. J., 2020, 382, 122842 CrossRef CAS.
- D. Zhang, S. Lv and Z. Luo, RSC Adv., 2020, 10, 1275–1280 RSC.
- M. Abdellah, S. Nosier, A. El-Shazly and A. Mubarak, Alexandria Eng. J., 2018, 57, 3727–3735 CrossRef.
- E. Fenelon, D.-P. Bui, H. H. Tran, S.-J. You, Y.-F. Wang, T. M. Cao and V. Van Pham, ACS Omega, 2020, 5, 20438–20449 CrossRef CAS PubMed.
- B. Xu, J. Li, L. Liu, Y. Li, S. Guo, Y. Gao, N. Li and L. Ge, Chin. J. Catal., 2019, 40, 713–721 CrossRef CAS.
- P. Wang, J. Chen, Y. Bai, P. Yang, Y. Du and H. Zhang, J. Mater. Sci.: Mater. Electron., 2019, 30, 10606–10618 CrossRef CAS.
- F. Chang, F. Wu, W. Yan, M. Jiao, J. Zheng, B. Deng and X. Hu, Ultrason. Sonochem., 2019, 50, 105–113 CrossRef CAS PubMed.
- M. Ahmadi, H. R. Motlagh, N. Jaafarzadeh, A. Mostoufi, R. Saeedi, G. Barzegar and S. Jorfi, J. Environ. Manag., 2017, 186, 55–63 CrossRef CAS PubMed.
- H. Derikvandi, M. Vosough and A. Nezamzadeh-Ejhieh, Int. J. Hydrogen Energy, 2021, 46, 2049–2064 CrossRef CAS.
- J. Cao, Z. Xiong and B. Lai, Chem. Eng. J., 2018, 343, 492–499 CrossRef CAS.
- X. Hou, Z. Wang, J. Chen, J. Wang, Q. Lu and D. Wu, Chem. Eng. J., 2021, 414, 128915 CrossRef CAS.
- T. S. Natarajan, P. K. Gopi, K. Natarajan, H. C. Bajaj and R. J. Tayade, Water-Energy Nexus, 2021, 4, 103–112 CrossRef.
- N. Orooji, A. Takdastan, R. Jalilzadeh Yengejeh, S. Jorfi and A. H. Davami, Res. Chem. Intermed., 2020, 46, 2833–2857 CrossRef CAS.
- S. Sandeep, K. L. Nagashree, T. Maiyalagan and G. Keerthiga, Appl. Surf. Sci., 2018, 449, 371–379 CrossRef CAS.
- S. Zhong, C. Li, M. Shen, C. Lv and S. Zhang, J. Mater. Res. Technol., 2019, 8, 1849–1858 CrossRef CAS.
- Z. Li, C. Guo, J. Lyu, Z. Hu and M. Ge, J. Hazard. Mater., 2019, 373, 85–96 CrossRef CAS PubMed.
- P. Wang, Y. Cao, X. Zhou, C. Xu and Q. Yan, Appl. Surf. Sci., 2020, 531, 147345 CrossRef CAS.
- A. H. Zyoud, A. Zubi, S. H. Zyoud, M. H. Hilal, S. Zyoud, N. Qamhieh, A. Hajamohideen and H. S. Hilal, Appl. Clay Sci., 2019, 182, 105294 CrossRef CAS.
- M. Li, D. Li, Z. Zhou, P. Wang, X. Mi, Y. Xia, H. Wang, S. Zhan, Y. Li and L. Li, Chem. Eng. J., 2020, 382, 122762 CrossRef CAS.
- D. O. Adenuga, S. M. Tichapondwa and E. M. N. Chirwa, J. Photochem. Photobiol. A, 2020, 401 Search PubMed.
- Q. Liu, C. Zeng, L. Ai, Z. Hao and J. Jiang, Appl. Catal., B, 2018, 224, 38–45 CrossRef CAS.
- W. Wang, Q. Han, Z. Zhu, L. Zhang, S. Zhong and B. Liu, Adv. Powder Technol., 2019, 30, 1882–1896 CrossRef CAS.
- Q. Liu, C. Zeng, L. Ai, Z. Hao and J. Jiang, Appl. Catal., B, 2018, 224, 38–45 CrossRef CAS.
- X. Yao and X. Liu, J. Hazard. Mater., 2014, 280, 260–268 CrossRef CAS PubMed.
Footnote |
| † Electronic supplementary information (ESI) available. See DOI: 10.1039/d1ra06855e |
| This journal is © The Royal Society of Chemistry 2021 |

