
 Open Access Article
 This Open Access Article is licensed under a Creative Commons Attribution-Non Commercial 3.0 Unported Licence
Kinetic coherence underlies the dynamics of disordered proteins†
Alexander Tenenbaum
Physics Department, Sapienza University, Piazzale Aldo Moro 5, 00185 Roma, Italy. E-mail: tenen314@gmail.com
First published on 10th November 2021
Abstract
The dynamics of two proteins of similar size, the globular lysozyme and the intrinsically disordered Huntingtin interacting protein, has been simulated in three states resembling a globule, a pre-molten globule, and a molten globule. A coherence time τ has been defined, measuring the delay in the display of a stochastic behaviour after a perturbation of the system. This time has been computed for two sets of collective variables: the projection of the phase point onto the positions and momenta subspaces (τr and τp), and the principal components (PCs) of positions q and momenta π produced by a covariance analysis in these subspaces (τq and τπ). In all states τp ≈ 3.5τr, and τπ ≈ 3.5τq. The coherence times of individual PCs, τ(l)q and τ(l)π, have also been computed, and τ(l)π > τ(l)q in all states. The prevalence of τp over τr, or of τπ over τq, drives the dynamics of the protein over a time range of ≈1–2 ps; moreover, a hidden synchronism appears to raise the momenta subspace's coherence above that of its individual PCs. In the transition of lysozyme to the molten globule the τ(l)q decrease but, unexpectedly, the τ(l)π increase; after this transition τp ≈ 5τr and τπ ≈ 5τq. A gain of kinetic coherence accompanies thus the loss of structural coherence caused by the denaturation of the protein in the transition from globule to molten globule. The increase of the τ(l)π does not take place in the analogous transition of the Huntingtin protein. These results are compared with those of a similar analysis performed on three pseudo-proteins designed by scrambling the primary sequence of the Huntingtin interacting protein, and on two oligopeptides. The hidden synchronism appears to be a generic property of these polypeptides. The τ(l)π spectrum is similar in denaturated and in intrinsically disordered biomolecules; but the gain of kinetic coherence as a result of denaturation seems to be a specific property of the biologically functional lysozyme.
1 Introduction
In recent years the traditional structure–function or “lock-and-key” paradigm has been shown to be insufficient to account for the complexity of binding scenarios among biomolecules. It is now recognized that structural dynamism – supporting molecular recognition that doesn't depend only upon structural and electrostatic complementarity between the binding partners – is more common in functional proteins than previously assumed.1,2The loosening of the stereochemical constraints required for a binding process to take place has shifted the attention to collective modes supporting conformational transitions functional to said process.3 Both experiment4,5 and atomistic simulation6 have contributed to the study of low frequency collective motions – usually in the THz range – that are interwoven with the binding process. These collective modes could also provide a clue to understand a long-range interaction among biomolecules, possibly a key component of some binding processes.7
An analysis of an α-helix and of a 13-residue protein fragment performed via molecular dynamics simulation pointed at the chaotic nature of their motion.8,9 This was ascribed to the nonlinear interactions in the system's force field, and to the stochastic forces generated by the solvent; it has also been stated that a noisy environment is a necessary complement of collective motions driving a protein across its conformational ensemble.10 On the other hand, it has also been argued that the dynamics of a protein is piecewise integrable, and becomes chaotic only during conformational transitions supported by fast collective motions.11 Moreover, a protein can undergo a transition from an incoherent to a coherent dynamics notwithstanding its interaction with a thermal bath.12 Because of this mixed picture, the possible emergence of an ordered pattern in the dynamics of a biomolecule – in particular in its biologically relevant collective motions – deserves a thorough investigation.
A biomolecule in a solvent is ceaselessly exposed to perturbations; if an ordered pattern underlies its dynamics, this pattern must be resilient against the steady perturbation to which it is exposed. The term coherence usually refers to a dynamical regime in which a set of vibrations exist whose relative phases do not vary in a given time period. In the present work the term coherence is instead used to represent the resilience of a system's dynamical trajectory in the presence of a perturbation; this resilience can be measured. A perturbation moves the point in the phase space representing the system's state to a nearby point. If a system is chaotic, the distance between the trajectories beginning at these nearby points is characterized by a fast exponential growth in time; the growth rate can be estimated by a parameter, the (maximum) Lyapunov exponent: Δ(t) = Δ(0)eλ1t, where Δ(t) is the distance in the phase space at time t, and λ1 is the maximum Lyapunov exponent. A resilient system, as opposed to a chaotic one, needs a long time to develop a chaotic behaviour; it is characterized by a slow divergence of near trajectories, that is, by a low value of λ1.
Let Sr and Sp be the subspaces of positions and momenta in the phase space. Taking the cue from the results found in a butane molecule, where different degrees of freedom (DoFs), both in Sr and in Sp, are characterized by different degrees of coherence,13 a similar analysis has been applied here to a set of biomolecules. All internal DOFs (torsions, bonds and angles) were included in the atomistic models of the biomolecules and in the computation of their dynamics. But the focus of the analysis has been put on the collective variables derived in a principal components (PCs) analysis of the dynamics, as it has been shown in several cases that the PCs endowed with the largest fluctuations are related to conformational shifts relevant to the function of a protein. The simulation was thus aimed at detecting a possible coherence hierarchy among collective DoFs in Sr and Sp.
2 Systems
The set of biomolecules object of this study is the following. (i) The hen egg-white lysozyme protein (Lys). (ii) The Huntingtin interacting protein (Hip), an intrinsically disordered protein (IDP) entailing the same number of residues (129) as the lysozyme.14 (iii) Three disordered pseudo-proteins obtained from Hip by randomly scrambling the order of residues in the primary sequence (P1h, P2h, P3h). (iv) Two short oligopeptides obtained by taking the first 9 (O1p) or the first 4 (O2p) residues of the N-terminus of Hip. The lysozyme protein is a widely studied antimicrobial enzyme; the Huntingtin interacting protein has been chosen because, lacking stable secondary structures, a comparison of its dynamics with that of Lys would highlight possible differences due to such structures. The three pseudo-proteins entail the same hydrophilic residues as Hip, and are therefore similarly disordered; on the other hand, lacking presumably any kind of biochemical function, a possible difference between their dynamics and that of Lys and Hip could be related to this lack. The primary sequence of Hip as well as the primary sequence of the three pseudo-proteins are given in ESI.† The two oligopeptides, both intrinsically disordered, where analyzed and compared to the other disordered systems in order to highlight a possible role of the proteins' size in their dynamical behaviour.The 3D structure of lysozyme was taken from the PDB repertory.15 The 3D structures of Hip and of the three pseudo-proteins were obtained through the University of Michigan's I-TASSER server.16–18 The server constructs molecular structures based on the sole primary sequence, applying an iterative template-based fragment assembly to the sequence. In this procedure it creates various conjectured secondary structures, producing the corresponding pdb file; in each case the molecule with the least secondary structures was chosen to start the simulation (see ESI, Fig. 1–4).†
All systems were simulated in the physiological condition (state A at T = 300 K), and above the denaturation temperature of lysozyme (state B at T = 370 K); the state B was reached by raising the temperature of state A from 300 K to 370 K. Because of the thermal stability of these biomolecules, the structures in state B were not fully denaturated. In order to study the dynamical properties of the denaturated lysozyme and compare them with those of the IDPs, it was necessary to rid as much as possible the proteins of the secondary structures; therefore, Lys, Hip, P1h, P2h, and P3h were subjected to a thermal denaturation at T = 1000 K, followed by an equilibration at T = 370 K to produce fully disordered conformations with no or little secondary structures: state C. The oligopeptides O1p and O2p, lacking secondary structures, were simulated only in states A and B, and were not subjected to the step at high temperature. The final structures produced by this procedure are shown in Fig. 1 and in ESI (Fig. 5–8).† Hereafter, the various systems in the different states will be dubbed accordingly: lysozyme LyA, LyB, LyC; Huntingtin HiA, HiB, HiC; pseudo-proteins P1A, P1B, P1C, P2A, P2B, P2C, P3A, P3B, P3C; oligopeptides O1A, O1B, O2A, O2B. The rationale of studying the dynamics of the same system in states B and C, that are at the same temperature, is to distinguish possible effects of the secondary structures – present in B but almost absent in C – from possible effects of the temperature.
 | ||
| Fig. 1 Lysozyme. Upper structure: LyA, globule. Lower structure: LyC, molten globule. | ||
3 Analytical method
Let r be the position vector of all the atoms of the soluted molecule. The PCs in Sr are defined by the linear transformation of r into q = OTr(r − 〈r〉), where Or is the matrix the columns of which are the orthonormal eigenvectors of the covariance matrix Cr = 〈(r − 〈r〉) (r − 〈r〉)T〉; in this section 〈·〉 is a time average. OTrCrOr is a diagonal matrix, the elements of which are the eigenvalues corresponding to those eigenvectors. The time evolution of vector q displays the essential dynamics of the molecule: it has been shown that the components of q along few eigenvectors, corresponding to the largest eigenvalues of Cr, account for most of the total spatial fluctuation of a protein.19Let p be the momentum vector of all the atoms of the soluted molecule. The PCs in Sp are similarly defined by the linear transformation of p into π = OTp(p − 〈p〉), where Op is the matrix the columns of which are the orthonormal eigenvectors of the covariance matrix Cp = 〈(p − 〈p〉) (p − 〈p〉)T〉. OTpCpOp is a diagonal matrix, the elements of which are the eigenvalues corresponding to those eigenvectors. The two sets of variables q, π span two subspaces, Sq and Sπ; these variables have been analyzed in search of a possible hierarchy in their coherence, measured by the coherence time of each DoF.
Let N be the number of atoms in the protein, and l = 1, 3N the index of the DOFs in each of the subspaces Sr, Sp, Sq, and Sπ. The coherence times τr of Sr and τp of Sp are measured by 1/λ, where λ = (1/t) ln[|Δ(t)|/|Δ(0)|] is a Lyapunov-like quantity characterizing the rate of divergence of trajectories beginning at nearby points; Δ(0) and Δ(t) are the Cartesian distances between the unperturbed and perturbed trajectories at the beginning and at the end of a given time interval t, in the subspaces Sr and Sp, respectively. This coherence time is physically equivalent to the coherence time defined in ref. 13 from the conceptual framework of Lyapunov's theory; it entails the same information about the rate of divergence of trajectories starting from very close points of the phase space, but is simpler to compute. The coherence times τq of Sq and τπ of Sπ were measured likewise: in each of the subspaces Sr and Sp, the initial and final distances Δ(0) and Δ(t) were projected on each l-th eigenvector of the corresponding covariance matrix, q(l) and π(l), yielding Δ(0)(l)q and Δ(t)(l)q in Sq, and Δ(0)(l)π and Δ(t)(l)π in Sπ. The Cartesian sum of these variations yielded Δ(0) and Δ(t) in those two subspaces, that were used to compute τq and τπ analogously to τr and τp. The coherence times of q(l) and π(l), τ(l)q and τ(l)π respectively, were computed in a similar way: the projections on the eigenvectors were used to compute τ(l)q = 1/λ(l)q, where λ(l)q = (1/t) ln[|Δ(t)(l)q|/|Δ(0)(l)q|], and τ(l)π = 1/λ(l)π, where λ(l)π= (1/t) ln[|Δ(t)(l)π|/|Δ(0)(l)π|].
4 Computational method
The simulation has been performed via the GROMACS simulation package,20 and the VMD program for the visualization of the molecule.21 For this simulation the all-atom OPLS-AA force field has been used.22 All simulations started from the corresponding pdb file, either provided by the PDB repository (Lys15), or by the I-TASSER server (Hip, P1h, P2h, P3h); this file was converted into the GROMACS format using the pdb2gmx tool. All systems have been simulated in explicit water solvent, using the SPC/E water model;23 the molecule has been solvated in a suitable triclinic box filled with water molecules, and extending to a distance of 1 nm from the solute. Using the GROMACS genion module, 8 negative Cl counterions were added to neutralize the overall charge on Lys, while for Hip, P1h, P2h, and P3h the charges added to neutralize the system were 9 positive Na counterions. The systems were first relaxed in the solvent by minimizing the total energy; a 1 ns equilibration in a NVT ensemble at T = 300 K was then performed, using V-rescale temperature coupling;24 it was followed by a 1 ns equilibration in a NPT ensemble at T = 300 K and p = 1 bar, using the Parrinello–Rahman barostat.25 The final configuration of this equilibration was the starting one for the actual simulation run of states A. Starting from the same relaxed systems in the solvent, the 1 ns NVT and NPT equilibrations were performed at T = 370 K to produce the configuration used to start the simulation of states B. To produce (almost) fully denaturated structures, overcoming a possible high thermostability – well known of lysozyme – in a manageable computing time, the same relaxed systems were used to start a 1 ns equilibration in a NVT ensemble at T = 1000 K. The denaturated protein was then extracted from the solvent, put and relaxed in new solvent, and equilibrated at 370 K with the usual two 1 ns runs in the NVT and NPT ensembles, taking the systems to state C. More details on the computer simulation can be found in ESI.†Preliminary runs in the globular state LyA were performed to determine the time interval best suited to measure the coherence of the system. After the equilibration the state of the system was perturbed by randomly scrambling the velocities of all 961 explicit H atoms of the protein; in this way the total momentum and the total kinetic energy were not modified, but the projection of the system's representative point in Sp was shifted. This perturbation is small. The initial distance in the momenta subspace is zero, as all atoms involved in the scrambling of velocities have the same mass. After one time step, the initial distance between trajectories in the positions subspace turns out to be of the order of 0.045 nm. This variation of the total position is distributed over the 961 H atoms of the protein, and is thus very small, as these atoms are distributed in a box with an edge of about 7 nm.
Different perturbations at different points of an unperturbed trajectory were applied, and the ensuing divergence between the unperturbed and the perturbed trajectories was computed. A typical result is shown in Fig. 2 and 3; the three curves of the lower bundle represent three different perturbations of a given point of the unperturbed trajectory of LyA, and measure the distance in Sr and in Sp, respectively. The upper bundle in those figures represent three different perturbations applied to LyC, with a similar result. All curves exhibit a clear decrease in the slope after t = 2 ps, indicating the onset of a saturation in the divergence of the trajectories. In a molecule this distance is limited by the intramolecular bonds and by the velocities' distribution at the given temperature; nevertheless, before reaching that limit, the rate of divergence depends on the molecule and on its state, and may be different for different DoFs. This simulation has been performed also on the other systems, and all results look similar; therefore, the coherence times have been measured on the first 2 ps stretch after the perturbation, where the fastest divergence takes place. Extending beyond 2 ps the time interval over which the expansion is measured would yield converging values of the Lyapunov-like quantity λ, tending to zero for all DoFs. In a similar simulation of the perturbed dynamics of a 13-residue protein fragment, 2 ps was found to be the time needed to reach saturation of the distance between perturbed and unperturbed evolution.9
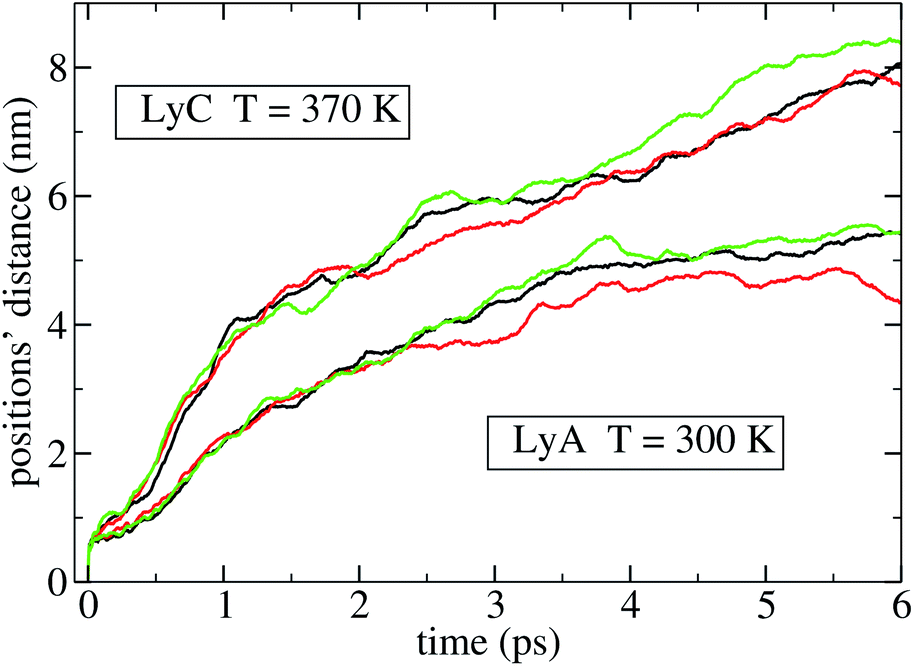 | ||
| Fig. 2 Divergence of three perturbed trajectories from an unperturbed one in Sr. | ||
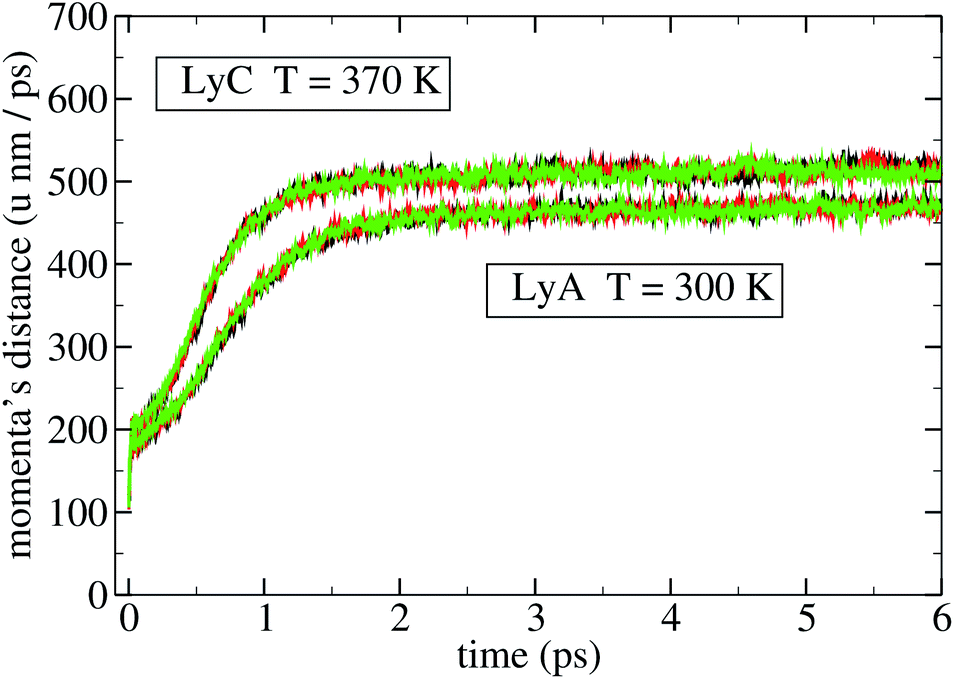 | ||
| Fig. 3 Divergence of three perturbed trajectories from an unperturbed one in Sp. | ||
For each system a 10 ns long unperturbed trajectory was produced in a NVT ensemble, with a time step of 2.0 fs, in each of three states conventionally dubbed globule (A), pre-molten globule (B), and molten globule (C); 10 ns are sufficient to assess a stabilized pattern of PCs.26–28 During each 10 ns trajectory the fluctuation of the total energy was of the order of 1%, without a drift of the mean value. At the beginning, and at every following point of the trajectory corresponding to an integer number of ns, the configuration of the protein was perturbed in five independent ways, giving rise to five perturbed trajectories; these were computed in double precision with a time step of 0.2 fs, and were 2 ps long. Also the unperturbed trajectory was extended with the same precision and the same length from the same point, to allow a precise computation of the distance between this trajectory and the perturbed ones. In this way 55 sets of distances between the unperturbed trajectory and the perturbed ones were obtained; the coherence times in Sr and Sp have been computed on each of these sets, and their average over all 55 sets. The dynamics of the 2 ps stretches was computed in a NVE ensemble; this ensemble was chosen in order to avoid a possible alteration of the dynamics of the system by an external thermal coupling29 or an external pressure coupling. The NVE ensemble simulation of the whole system entails the thermal coupling between the two subsystems protein and solvent, a natural way of representing an actual experimental condition.
The 10 ns unperturbed trajectory was used to compute two covariance matrices, in Sr and in Sp. This was suggested by the analysis of a butane molecule's dynamics that had revealed a different dynamical behaviour of the DoFs belonging to these two subspaces.13 The initial and final positions' and momenta's Cartesian distances in each of the 55 time stretches were projected onto the eigenvectors of the respective covariance matrix; from these projected distances the coherence time τq of subspace Sq and the coherence time τπ of subspace Sπ were computed. The projected distances allowed also the computation of a coherence time for each eigenvector. Ranking the eigenvectors according to the decreasing value of the associated eigenvalue gives the sequence of PCs. The coherence times of the two subspaces Sr and Sp, the coherence times of the two subspaces Sq and Sπ, and the coherence times of each PC, all averaged over the 55 stretches, were thus the relevant quantities computed herein.
5 Results
Some physical and chemical characteristics of the various systems in the different states are reported in Table 1. All data are time averages over the 10 ns trajectories; the errors are the standard deviation of the average. The number of hydrogen bonds has been measured with the GROMACS hbond module.30| Mol | T | Rg | SASA | Volume | H-b |
|---|---|---|---|---|---|
| LyA | 300 | 1.414 ± 0.012 | 70.45 ± 1.33 | 26.21 ± 0.31 | 91 |
| LyB | 370 | 1.395 ± 0.014 | 70.01 ± 1.88 | 26.46 ± 0.34 | 84 |
| LyC | 370 | 1.456 ± 0.018 | 82.40 ± 2.84 | 28.09 ± 0.42 | 72 |
| HiA | 300 | 3.503 ± 0.209 | 126.51 ± 2.29 | 31.93 ± 0.60 | 76 |
| HiB | 370 | 2.373 ± 0.404 | 110.70 ± 7.03 | 30.74 ± 0.73 | 85 |
| HiC | 370 | 2.032 ± 0.083 | 101.47 ± 2.86 | 30.24 ± 0.47 | 94 |
| P1A | 300 | 1.764 ± 0.034 | 102.98 ± 2.12 | 30.33 ± 0.38 | 78 |
| P1B | 370 | 1.674 ± 0.033 | 96.19 ± 3.97 | 29.74 ± 0.56 | 82 |
| P1C | 370 | 2.017 ± 0.117 | 106.23 ± 4.70 | 30.60 ± 0.56 | 76 |
| P2A | 300 | 1.649 ± 0.048 | 98.00 ± 4.37 | 29.78 ± 0.53 | 83 |
| P2B | 370 | 1.636 ± 0.027 | 89.99 ± 2.44 | 29.28 ± 0.39 | 88 |
| P2C | 370 | 1.674 ± 0.075 | 98.53 ± 5.83 | 30.21 ± 0.66 | 74 |
| P3A | 300 | 1.616 ± 0.016 | 97.77 ± 2.12 | 29.86 ± 0.39 | 83 |
| P3B | 370 | 1.584 ± 0.031 | 93.47 ± 4.21 | 29.66 ± 0.51 | 89 |
| P3C | 370 | 1.854 ± 0.134 | 107.29 ± 5.44 | 30.06 ± 0.74 | 74 |
| O1A | 300 | 0.716 ± 0.038 | 15.12 ± 0.66 | 2.98 ± 0.08 | 4 |
| O1B | 370 | 0.594 ± 0.030 | 13.01 ± 0.84 | 2.79 ± 0.10 | 6 |
| O2A | 300 | 0.547 ± 0.028 | 9.90 ± 0.51 | 1.77 ± 0.05 | 0 |
| O2B | 370 | 0.554 ± 0.024 | 9.78 ± 0.51 | 1.75 ± 0.06 | 1 |
The first simulation at 300 K was done for LyA; the structure depicted in Fig. 1 shows 4 α-helices, 4 short 310-helices, and 3 β-strands, plus turns and coil segments. During the 10 ns simulation the average gyration radius in LyA was 1.41 nm, in good agreement with the experimental value of 1.43 nm.31 What happens when the temperature of the system is raised to the point that the structure of the protein is affected? A second simulation was done in a pre-molten globular state of lysozyme at T = 370 K (LyB). As compared with the globular structure LyA, LyB has only 2 α-helices instead of 4, 2 short 310-helices instead of 4, but has kept the 3 β-strands; the solvent-accessible surface area (SASA) and the average gyration radius have not changed within the error range. A third simulation has been done at T = 370 K for the molten globule lysozyme (LyC). Unlike the globular structure LyA at 300 K or the pre-molten globular structure LyB at 370 K, LyC has no helices or β-strands left, as shown in Fig. 1; this is characteristic of a denaturated state. The SASA has increased to 82.40 nm2; on the other hand, the gyration radius oscillates around 1.46 nm, significantly less than the value of 1.80 nm measured for the fully denaturated and unfolded protein.32 Therefore, even if the structure of LyC appears to be more open than LyA and LyB, this state is better labeled as molten globule.
In the following runs the molecules Hip, P1h, P2h, and P3h were simulated in the states A, B, and C. The data for Hip show that taking the system from state A at 300 K to state C at 370 K the molecule undergoes a thermal compaction, visible in the values of Rg (−42%), solvent accessible surface area (−20%), and – to a lesser extent – volume (−5%). This phenomenon, known to exist in denaturated proteins and IDPs,33 does not happen in the pseudo-proteins P1h, P2h, and P3h; to the contrary, in P1h and P3h the SASA increases significantly going from state A to state C.
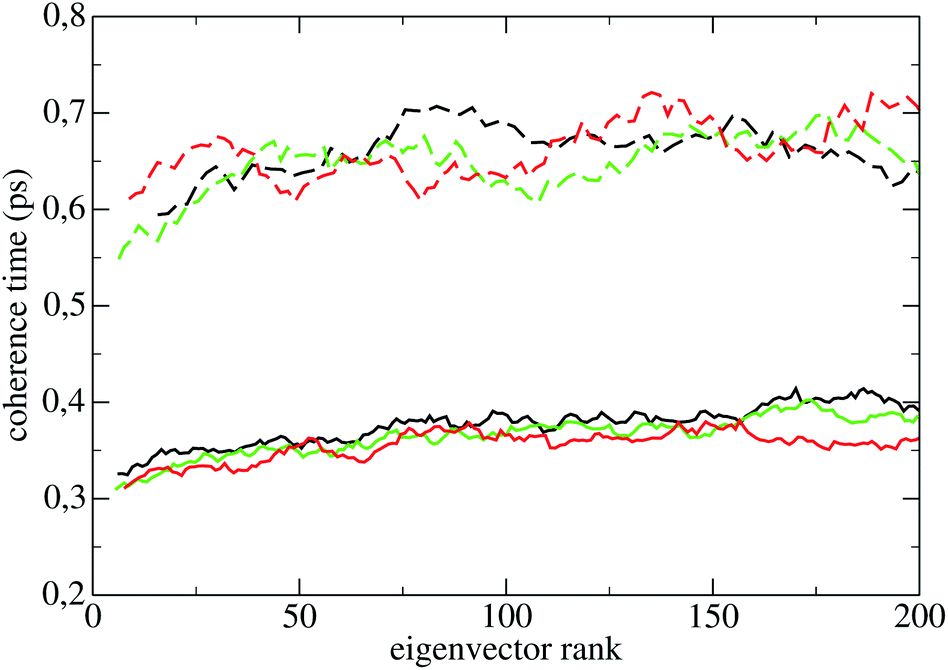
The coherence times of all systems in all states are reported in Table 2; the error assigned to each result in subspaces Sr and Sp is the standard deviation over the 55 perturbed trajectories. The smallness of the standard deviation of these averages show that the latter are significant, i.e., that the coherence time of a subspace depends weakly on the phase space point of the constant energy surface where it is measured. The standard deviations in subspaces Sq and Sπ are of the same order of magnitude, and are not shown in Table 2. The coherence times of the first 200 PCs of Lys are reported in Fig. 4 (LyA: black lines; LyB: green lines; LyC: red lines), and their average 〈·〉 in Table 2. The standard deviation of each individual PC coherence time over the 55 measurements may be quite large, usually between 20% and 40%; for the sake of clarity the points in Fig. 4 do not carry error bars. Here and in the following 〈·〉 will define the average coherence time over the first 200 PCs (130 PCs for the oligopeptides).
| Mol | τr | τp | τq | τπ | 〈τ(l)q〉 | 〈τ(l)π〉 |
|---|---|---|---|---|---|---|
| LyA | 0.46 ± 0.01 | 1.52 ± 0.02 | 0.46 | 1.52 | 0.41 | 0.50 |
| LyB | 0.43 ± 0.04 | 1.36 ± 0.02 | 0.42 | 1.24 | 0.41 | 0.64 |
| LyC | 0.32 ± 0.04 | 1.49 ± 0.02 | 0.32 | 1.50 | 0.31 | 0.66 |
| HiA | 0.43 ± 0.01 | 1.38 ± 0.02 | 0.43 | 1.23 | 0.38 | 0.66 |
| HiB | 0.41 ± 0.06 | 1.37 ± 0.01 | 0.40 | 1.22 | 0.37 | 0.65 |
| HiC | 0.39 ± 0.06 | 1.36 ± 0.01 | 0.39 | 1.21 | 0.36 | 0.66 |
| P1A | 0.38 ± 0.01 | 1.38 ± 0.02 | 0.38 | 1.24 | 0.36 | 0.65 |
| P1B | 0.37 ± 0.01 | 1.37 ± 0.01 | 0.39 | 1.23 | 0.35 | 0.65 |
| P1C | 0.41 ± 0.01 | 1.37 ± 0.01 | 0.41 | 1.23 | 0.36 | 0.67 |
| P2A | 0.38 ± 0.00 | 1.38 ± 0.02 | 0.39 | 1.24 | 0.35 | 0.65 |
| P2B | 0.41 ± 0.01 | 1.37 ± 0.02 | 0.41 | 1.22 | 0.37 | 0.64 |
| P2C | 0.42 ± 0.01 | 1.37 ± 0.02 | 0.42 | 1.23 | 0.37 | 0.65 |
| P3A | 0.37 ± 0.06 | 1.38 ± 0.02 | 0.36 | 1.23 | 0.33 | 0.65 |
| P3B | 0.36 ± 0.01 | 1.37 ± 0.02 | 0.36 | 1.24 | 0.34 | 0.65 |
| P3C | 0.31 ± 0.01 | 1.37 ± 0.02 | 0.31 | 1.23 | 0.31 | 0.66 |
| O1A | 0.32 ± 0.05 | 1.37 ± 0.09 | 0.33 | 1.44 | 0.36 | 0.54 |
| O1B | 0.33 ± 0.05 | 1.37 ± 0.09 | 0.34 | 1.43 | 0.36 | 0.53 |
| O2A | 0.32 ± 0.04 | 1.43 ± 0.09 | 0.33 | 1.52 | 0.38 | 0.51 |
| O2B | 0.34 ± 0.05 | 1.42 ± 0.09 | 0.35 | 1.45 | 0.44 | 0.51 |
 | ||
| Fig. 4 Coherence times of the eigenvectors in LyA (black lines), LyB (green lines), LyC (red lines). Positions: continuous lines; momenta: dashed lines. Every point is the average in a sliding window of 10 contiguous points. | ||
The curves in Fig. 4 show that: (a) in LyA and LyB, approximately the first 30 τ(l)π are lower than those of the rest of eigenvectors oscillating with smaller amplitude; (b) the τ(l)π increase significantly taking the system from LyA to LyB and to LyC. Appearance (a) highlights an anisotropic diffusion in Sp in those states. Comparing with the homologous curves for Hip in Fig. 5, one notices that appearance (a) is now common to the three states HiA, HiB, and HiC, while appearance (b) has completely disappeared. As for the three pseudo-proteins, their curves of the PCs' coherence times are indistinguishable from those of Hip shown in Fig. 5. The curves for P1h are shown in Fig. 9 of ESI.†
 | ||
| Fig. 5 Coherence times of the eigenvectors in HiA (black lines), HiB (green lines), HiC (red lines). Positions: continuous lines; momenta: dashed lines. Every point is the average in a sliding window of 10 contiguous points. | ||
6 Discussion
The systems LyA and Hip are biologically functional; LyB, LyC, P1h, P2h, and P3h presumably do not have a biological function. What can be learned by comparing the coherence times in the two subspaces of the systems inside each group and between the two groups?A first evidence derived from Table 2 is that in all states of all systems τp is larger than τr by a factor 3 to 4, that is, Sp is systematically more coherent than Sr. This is strongly divergent from the result of a similar computation done several years ago on a gas of Lennard-Jones particles with density going up to 15% of the liquid: there the coherence times computed for the positions and momenta subspaces where practically equal.34 And in all states of all systems τq is smaller than τπ, also by a factor 3 to 4; that is, Sq is systematically less coherent than Sπ. Moreover, the τ(l)π are uniformly higher than the equally ranking τ(l)q, as shown in Fig. 4 for Lys and Fig. 5 for Hip.
A second observation is that 〈τ(l)π〉, the average coherence time of the momenta in Sπ, has practically the same value of 0.66 ps for all polypeptides in state C, both of proteins (Lys and Hip) and of pseudo-proteins (P1h, P2h, P3h). In that state Hip, being an IDP, is possibly still biologically functional, while the other polypeptides are not. This property seems thus to be related to the conformation of the denaturated or disordered molecules, not to their biological function; this coherence time may also increase with the size of the molecular structure, as the two oligopeptides diplay a 〈τ(l)π〉 that is clearly smaller than that of the polypeptides.
A third observation is that the average coherence time of the first 200 position eigenvectors, 〈τ(l)q〉, is lower (down to −12% in HiA, P1C, and P2C) than τq in all polypeptides. This pattern is similarly shared by the biological and non-biological systems just mentioned; therefore, it doesn't bear a biological relevance. As for the average coherence time of the momenta, 〈τ(l)π〉 is uniformly lower than τπ, but here the difference is much higher: −67% in LyA, −48% in LyB, −56% in LyC, −46% in HiA, −47% in HiB, −45% in HiC; P1h, P2h, and P3h show values similar to Hip. The differences between these two quantities vary slightly when the temperature is raised from 300 K to 370 K, with one exception, to be discussed below. Thus in both subspaces – but markedly more in Sπ – the overall dynamics is more coherent than that of the single eigenvectors, as if the coherence of a single eigenvector were enhanced by a coordinated dynamics of the other eigenvectors. In other words, it appears that if an eigenvector is characterized by a given stochasticity (that is, his evolution in time is chaotic to a certain degree), the other eigenvectors – each similarly incoherent on its own – evolve in a synchronized pattern, thus increasing the coherence of the subspace. This guess of a hidden dynamical coherence is supported by the comparison of Fig. 2 and 3, where the divergence of the three perturbed trajectories is clearly distinguishable in Sr but not in Sp, as if in the latter the three different perturbations were constrained to evolve on a similar path. This pattern is visible both in LyA (lower bundle of curves) and in LyC (upper bundle): the dramatic change in the structure of lysozyme going from LyA to LyC does not cancel this intriguing different behaviour of the two subspaces. Moreover, the same pattern of hidden dynamical coherence can be found in the other simulated systems: Hip, P1h, P2h, P3h, Op1, Op2.
The fourth and possibly most relevant result is clearly visible in Fig. 4: as noticed before, taking Lys from LyA to LyC the τ(l)q decrease significantly (about −25%), but the τ(l)π unexpectedly increase (about +30%), becoming more than twice the former. The latter increase mostly takes place between LyA and LyB, that is, when the temperature is raised beyond the denaturation point and a significant amount of the secondary structures is lost. An increase of temperature entails an extension of the phase space volume accessible both to positions and momenta, lowering the coherence of these DoFs; also, breaking-up H-bonds and secondary structures removes barriers in the phase space, possibly making these DoFs even more chaotic, as shown by the decrease of the spectrum of the τ(l)q. By contrast, the increase of the τ(l)π is surprising; it appears that the loss of structural coherence due to the disappearance of secondary structures is accompanied by a gain of kinetic coherence. Such a behaviour has not been found in any of the other similar structures studied in the present work (Hip, P1h, P2h, P3h), a hint that it is related to proteins losing their biological function, as the transition from LyA to LyC entails the disruption of all secondary structures and the number of intramolecular H-bonds drops by −21%. By contrast when Hip is taken from HiA to HiC the τ(l)π do not change appreciably and the number of H-bonds even increases, which is consistent with the thermostability of IDPs.
The gain of kinetic coherence during the denaturation process could be a generic feature in the unfolding of a globular protein undergoing denaturation, and could possibly play a role also in the folding process. Since Levinthal proposed his paradox,35 it has been recognized that the folding of a protein cannot be achieved by a random conformational search in the huge dimensional phase space of the molecule; rather, the path goes from the generic unfolded state to less generic intermediate unfolded states, towards the folded native configuration. In Levinthal's words: “a pathway of folding means that there exist a well-defined sequence of events which follow one another so as to carry the protein from the unfolded random coil to a uniquely folded metastable state”.36 As unfolding and refolding processes take place in a very similar time span,37 it is tempting to posit that also the unfolding process takes place by way of a similar sequence of intermediate configurations; if this were the case, the increasing coherence in the momenta subspace during the denaturation process could help the increasingly spatially disordered structure of the protein find its way from one intermediate configuration to the following. In the reverse process, kinetic coherence would become less relevant as the system progressively folds towards the native state configuration. Thus, in both cases, kinetic coherence could be a component of the protein's ability to follow “a pathway” in a directed process, countering perturbing actions by the solvent or other molecules not positively involved in the process.
How do the appearances described so far relate to the size of the molecules? An insight into this issue can be found in the results obtained by the simulation of the two oligopetides O1p and O2p, also reported in Table 2. The coherence times τr of the subspace Sr and τq of the subspace Sq are smaller than those of the polypetides (the only exception being τr = 0.31 ps in P3C). Therefore, one could guess a trend of lower coherence of smaller molecules in the two positions subspaces. At variance with the previous systems, the average coherence time of the first 130 position eigenvectors, 〈τ(l)q〉, is higher (+9% in O1A and +15% in O2A) than τq at T = 300 K; when the temperature is raised from 300 K to 370 K the difference between the two quantities decreases in O1B, but increases in O2B. All things considered, the dependence of this difference on the temperature doesn't seem to be relevant either in the oligopeptides or in the larger polypeptides, with the exception of Lys, as discussed in the previous paragraph.
The coherence times τp of the subspace Sp are practically equal within their standard deviation in all disordered structures Hip, P1h, P2h, P3h, O1p, and O2p; in this subspace, size does not seem to play a role as far as the coherence is concerned. As for the average coherence time of the momenta, 〈τ(l)π〉 is uniformly lower than τπ, the difference being −62% in O1A, −66% in O2A, −63% in O1B, and −65% in O2B. These differences at 300 K and 370 K are very similar to those found for the larger systems, and show that this feature is not related either to the size of the system or to its biological function. It appears therefore that the hidden coherence in the momenta subspace described before could be a generic characteristic of oligo- and polypetides.
In conclusion, this article presents a new analytical method allowing insights into unexpected features of the phase space of poly- and oligopeptides: (i) a higher coherence of the momenta subspace in comparison with the positions subspace. (ii) A hidden dynamical coherence in the momenta subspace. (iii) The transformation of structural coherence into kinetic coherence when a protein is denaturated. These findings could be signposts to direct future investigations of a protein's dynamics.
Addendum. Experiments have shown that in a polypeptide chain collective vibrations exist that span a few amide groups moving in a well-defined phase relation;38 in particular an absorption peak has been found in lysozyme at 1.2 THz, corresponding to a period of 0.83 ps, and has been attributed to a collective vibrational mode.39,40 Another peak has been found in lysozyme at 2.8 THz, corresponding to a period of 0.36 ps, and assigned to an underdamped oscillator involving a dozen of residues.5 The typical time range of those vibrations suggests a connection with the findings presented here. Also, it has been found in a model of α-helix that over a distance of four residues a quantum coherence exists, allowing a coherent vibrational state that lasts up to 0.5–1.0 ps.41 The time range of these findings overlaps with the range of classical coherence times found in this work, which hints at a possible quantumlike short-time behaviour of a classical system, as already found in a crystal at low temperature.42
Conflicts of interest
There are no conflicts of interest to declare.References
- V. N. Uversky and A. K. Dunker, The case for intrinsically disordered proteins (IDPs) playing contributory roles in molecular recognition without a stable 3D structure, F1000 Biol. Rep., 2013, 5, 1–12 CrossRef PubMed.
- R. V. Mannige, Dynamic New World: Refining Our View of Protein Structure, Function and Evolution, Proteomes, 2014, 2, 128–153 CrossRef PubMed.
- I. N. Berezovsky, E. Guarnera, Z. Zheng, B. Eisenhaber and F. Eisenhaber, Protein function machinery: from basic structural units to modulation of activity, Curr. Opin. Struct. Biol., 2017, 42, 67–74 CrossRef CAS PubMed.
- A. Xie, L. van der Meer and R. H. Austin, Excited-State Lifetimes of Far-Infrared Collective Modes in Proteins, J. Biol. Phys., 2002, 28, 147–154 CrossRef CAS PubMed.
- D. A. Turton, H. M. Senn, T. Hardwood, A. J. Lapthorn, E. M. Ellis and K. Wynne, Terahertz underdamped vibrational motion governs protein–ligand binding in solution, Nat. Commun., 2014, 5(6), 3999 CrossRef CAS PubMed.
- S. Dutta, M. Ghosh and J. Chakrabarti, Spatio-temporal coordination among functional residues in protein, Sci. Rep., 2017, 7(7), 40439 CrossRef CAS PubMed.
- I. Nardecchia, M. Lechelon, M. Gori, I. Donato, J. Preto, E. Floriani, S. Jaeger, S. Mailfert, D. Marguet, P. Ferrier and M. Pettini, Detection of long-range electrostatic interactions between charged molecules by means of fluorescence correlation spectroscopy, Phys. Rev. E, 2017, 96(13), 022403 CrossRef PubMed.
- H. Zhou and L. Wang, Chaos in Biomolecular Dynamics, J. Phys. Chem., 1996, 100, 8101–8105 CrossRef CAS.
- M. Braxenthaler, R. Unger, D. Auerbach, J. A. Given and J. Moult, Chaos in Protein Dynamics, Proteins: Struct. Funct. Genet., 1997, 29, 417–425 CrossRef CAS.
- D. J. Nicholson, Is the cell really a machine?, J. Theor. Biol., 2019, 477, 108–126 CrossRef PubMed.
- I. Mezic, On the dynamics of molecular conformation, Proc. Natl. Acad. Sci. U. S. A., 2006, 103, 7542–7547 CrossRef CAS PubMed.
- I. Nardecchia, J. Torres, M. Lechelon, V. Giliberti, M. Ortolani, P. Nouvel, M. Gori, Y. Meriguet, I. Donato, J. Preto, L. Varani, J. Sturgis and M. Pettini, Out-of-Equilibrium Collective Oscillation as Phonon Condensation in a Model Protein, Phys. Rev. X, 2018, 8(23), 031061 CAS.
- A. Battisti, R. G. Lalopa and A. Tenenbaum, Ordered and chaotic dynamics of collective variables in a butane molecule, Phys. Rev. E: Stat., Nonlinear, Soft Matter Phys., 2009, 79(13), 046206 CrossRef PubMed.
- Disprot Data Bank entry DP00546.
- Protein Data Bank entry 1AKI.
- https://zhanglab.dcmb.med.umich.edu/I-TASSER/.
- J. Yang and Y. Zhang, I-TASSER server: new development for protein structure and function predictions, Nucleic Acids Res., 2015, 43, W174–W181 CrossRef CAS PubMed.
- C. Zhang, P. L. Freddolino and Y. Zhang, COFACTOR: improved protein function prediction by combining structure, sequence and protein–protein interaction information, Nucleic Acids Res., 2017, 45, W291–W299 CrossRef CAS PubMed.
- A. Amadei, A. B. M. Linssen and H. J. C. Berendsen, Essential Dynamics of Proteins, Proteins: Struct. Funct. Genet., 1993, 17, 412–425 CrossRef CAS PubMed.
- GROMACS release 2020.2, https://www.gromacs.org/.
- W. Humphrey, A. Dalke and K. Schulten, VMD: visual molecular dynamics, J. Mol. Graphics, 1996, 14, 33–38 CrossRef CAS PubMed.
- W. L. Jorgensen, D. S. Maxwell and J. Tirado-Rives, Development and Testing of the OPLS All-Atom Force Field on Conformational Energetics and Properties of Organic Liquids, J. Am. Chem. Soc., 1996, 118, 11225–11236 CrossRef CAS.
- P. Mark and L. Nilsson, Structure and Dynamics of the TIP3P, SPC, and SPC/E Water Models at 298 K, J. Phys. Chem. A, 2001, 105, 9954–9960 CrossRef CAS.
- G. Bussi, D. Donadio and M. Parrinello, Canonical sampling through velocity rescaling, J. Chem. Phys., 2007, 126(8), 14101 CrossRef PubMed.
- M. Parrinello and A. Rahman, Polymorphic transitions in single crystals: a new molecular dynamics method, J. Appl. Phys., 1981, 52, 7182–7190 CrossRef CAS.
- D. M. F. Van Aalten, B. L. De Groot, J. B. C. Findlay, H. J. C. Berendsen and A. Amadei, A comparison of techniques for calculating essential dynamics, J. Comput. Chem., 1997, 18, 169–181 CrossRef CAS.
- B. Hess, Convergence of sampling in protein simulations, Phys. Rev. E: Stat., Nonlinear, Soft Matter Phys., 2002, 65(10), 031910 CrossRef PubMed.
- O. F. Lange and H. Grubmüller, Can Principal Components Yield a Dimension Reduced Description of Protein Dynamics on Long Time Scales?, J. Phys. Chem. B, 2006, 110, 22842–22852 CrossRef CAS PubMed.
- M. D'Alessandro, A. Tenenbaum and A. Amadei, Dynamical and Statistical Mechanical Characterization of Temperature Coupling Algorithms, J. Phys. Chem. B, 2002, 106, 5050–5057 CrossRef.
- F. Eisenhaber, P. Lijnzaad, P. Argos, C. Sander and M. Scharf, The Double Cube Lattice Method: Efficient Approaches to Numerical Integration of Surface Area and Volume and to Dot Surface Contouring of Molecular Assemblies, J. Comput. Chem., 1995, 16, 273–284 CrossRef CAS.
- W. R. Krigbaum and F. R. Kügler, Molecular conformation of egg-white lysozyme and bovine alpha-lactalbumin in solution, Biochemistry, 1970, 9, 1216–1223 CrossRef CAS PubMed.
- A. E. Mark and W. F. van Gunsteren, Simulation of the Thermal Denaturation of Hen Egg White lysozyme: Trapping the Molten Globule State, Biochemistry, 1992, 31, 7745–7748 CrossRef CAS PubMed.
- A. Battisti, G. Ciasca, A. Grottesi and A. Tenenbaum, Thermal compaction of the intrinsically disordered protein tau: entropic, structural, and hydrophobic factors, Phys. Chem. Chem. Phys., 2017, 19, 8435–8446 RSC.
- S. D. Stoddard and J. Ford, Numerical Experiments on the Stochastic Behavior of a Lennard-Jones Gas System, Phys. Rev. A: At., Mol., Opt. Phys., 1973, 8, 1504–1512 CrossRef CAS.
- C. Levinthal, How to Fold Graciously, Mossbauer Spectroscopy in Biological Systems: Proceedings of a meeting held at Allerton House, ed. J. T. P. DeBrunner and E. Munck, University of Illinois Press, Monticello, Illinois, 1969, pp. 22–24 Search PubMed.
- C. Levinthal, Are there pathways for protein folding?, J. Chim. Phys. Phys.-Chim. Biol., 1968, 65, 44–45 CrossRef.
- G. Zocchi, Proteins unfold in steps, Proc. Natl. Acad. Sci. U. S. A., 1997, 94, 10647–10651 CrossRef CAS PubMed.
- P. Hamm, M. Lim and R. M. Hochstrasser, Structure of the amide I band of peptides measured by femtosecond nonlinear-infrared spectroscopy, J. Phys. Chem. B, 1998, 102, 6123–6138 CrossRef CAS.
- A. Markelz, S. Whitmire, J. Hillebrecht and R. Birge, THz time domain spectroscopy of biomolecular conformational modes, Phys. Med. Biol., 2002, 47, 3797–3805 CrossRef CAS PubMed.
- J. Xu, K. W. Plaxco and S. J. Allen, Collective Dynamics of lysozyme in Water: Terahertz Absorption Spectroscopy and Comparison with Theory, J. Phys. Chem. B, 2006, 110, 24255–24259 CrossRef CAS PubMed.
- A. G. Dijkstra, T. la Cour Jansen and J. Knoester, Modeling the Vibrational Dynamics and Nonlinear Infrared Spectra of Coupled Amide I and II Modes in Peptides, J. Phys. Chem. B, 2011, 115, 5392–5401 CrossRef CAS PubMed.
- G. Marcelli and A. Tenenbaum, Quantumlike short-time behavior of a classical crystal, Phys. Rev. E: Stat., Nonlinear, Soft Matter Phys., 2003, 68(8), 041112 CrossRef PubMed.
Footnote |
| † Electronic supplementary information (ESI) available. See DOI: 10.1039/d1ra06823g |
| This journal is © The Royal Society of Chemistry 2021 |