 Open Access Article
One-pot analysis of enantiomeric excess of free amino acids by electrospray ionization mass spectrometry†
Takashi Nakakojia,
Hirofumi Satob,
Daisuke Onob,
Hiroyuki Miyake*a,
Eiko Miedaa,
Satoshi Shinoda a,
Hiroshi Tsukubea,
Hideya Kawasaki
 c,
Ryuichi Arakawac and
Motohiro Shizuma
 *b
*b
aDepartment of Chemistry, Graduate School of Science, Osaka City University, Sugimoto, Sumiyoshi-ku, Osaka 558-8585, Japan. E-mail: miyake@sci.osaka-cu.ac.jp
bOsaka Research Institute of Industrial Science and Technology, Morinomiya, Joto-ku, Osaka 536-8553, Japan. E-mail: shizuma@omtri.or.jp
cDepartment of Chemistry and Materials Engineering, Faculty of Chemistry, Materials and Bioengineering, Kansai University, Yamate-cho, Suita, Osaka 564-8680, Japan
First published on 10th November 2021
Abstract
An electrospray ionization mass spectrometric method for the simultaneous analysis of the enantiomeric excess of free amino acids, without chromatographic separation, was demonstrated using a quasi-racemic mixture of deuterium-labelled and unlabelled chiral copper(II) complexes. This convenient method enables the simultaneous high-sensitivity determination of the enantiomeric excess of 12 amino acids.
Introduction
Research exploiting recent advances in micro-scale analysis techniques exhibiting high optical separation has established the presence of trace amounts of R-amino acids (AAs) in vivo.1 R-AA residues within peptide back-bones and free R-AAs in tissues and physiological fluids have received considerable attention based on reported correlations between R-AAs and various diseases, and their potential biological roles in living organisms.2 Therefore, establishment of a method for determining the enantiomeric excess (ee) of very small amounts of amino acids is required in various fields such as chemistry, biology, pharmacy and medicine.Several methods have been developed for determining the ee of free AAs. Nuclear magnetic resonance (NMR) spectroscopy3 and circular dichroism (CD) spectroscopy,4 indicator displacement assays,5 fluorescent spectroscopy,6 circularly polarized luminescence spectroscopy7 are typical methods that enable monitoring of separations of AA signals and changes in the spectra of host molecule in response to host-guest interaction. However, these methods are not suitable for simultaneous examination of multiple AAs because the signals often overlap and/or the same spectral changes occur regardless of the type of AA employed. By contrast, the high-performance liquid chromatography (HPLC) with chiral stationary phase including a multi-dimensional HPLC method8 and a chiral liquid chromatography-time-of-flight mass spectrometry (MS) method9 can separate multiple AAs and analyse each ee. However, these chromatographic approaches require long analysis time.
There is a strong demand for enantiomeric analysis using mass spectrometry, which is a highly sensitive and rapid measurement method. Recent advances in mass spectrometers have led to the development of enantiomeric analysis methods based on mass spectrometry only,10 such as the evaluation of the stability of the diastereomeric ion between an analyte and a chiral selector by ion mobility mass spectrometry11 or by photodecomposition at low temperature in ion-trap.12 Nevertheless, fundamental strategies are presented in the following two methods, which were proposed early on.
As a means of determining ee values for AAs using only MS, Tao et al. developed a kinetic resolution method using collision induced dissociation (CID) coupled with ion trap MS.13 However, this method is not suitable for simultaneous analyses. Sawada et al. proposed a method to determine the ee value of the chiral guest using isotopically labelled/unlabelled quasi-racemic mixture of a chiral host compound; the host–guest complex target ion is detected by single stage MS without CID (Fig. 1).14 Such host compounds can be used only for protected AAs, however. New chiral host compounds suitable for simultaneous ee analyses of “free” AAs should thus be developed using the isotope-labelling method.
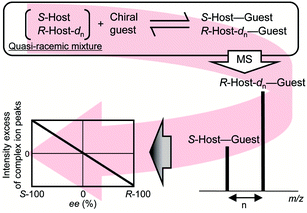 | ||
| Fig. 1 Procedure for ee determination of a chiral guest using the isotope-labelled chiral host method. | ||
Recently, we reported a copper(II) complex with a chiral tetradentate ligand (S,S-L),15 Λ-[CuII(S,S-L)(MeOH)2]2+ (Fig. 2(a)), that accommodates a bidentate AA; the resulting three-component complex ion [CuII/S,S-L/(AA–H)]+ was detected with high sensitivity by electrospray ionization (ESI) MS.16a The CuII/S,S-L complex enantioselectively preferred the R-AA, and the chiral discrimination ability of the complex was evaluated using ESI-MS coupled with isotope-labelled/unlabelled quasi-racemic mixture of the guest AA, S-AA-dn/R-AA,16 indicating that the CuII/S,S-L complex is a promising chiral host for ee analyses of “free” AAs.
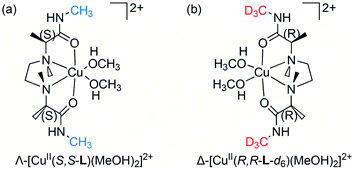 | ||
| Fig. 2 Structures of deuterium-labelled/unlabelled quasi-enantiomers of a chiral metal complex in methanol. (a) Λ-[CuII(S,S-L)(MeOH)2]2+, (b) Δ-[CuII(R,R-L-d6)(MeOH)2]2+. | ||
In this report, we describe simultaneous ee determination of unlabelled free AAs by MS using deuterium-labelled/unlabelled quasi-racemic mixture of chiral copper(II) complex (CuII/S,S-L and CuII/R,R-L-d6, see Fig. 2) as excellent host molecules. Although several different analytical methods have been developed for determining ee values of free AAs, as described above, this new method enables rapid, high-sensitivity determination of ee values for multiple AAs. The new method also enables detection of ion clusters characteristic of copper(II) complexes consisting of three components and has the advantage of being able to distinguish target ions from other impurities, thus making the method more versatile.
Results and discussion
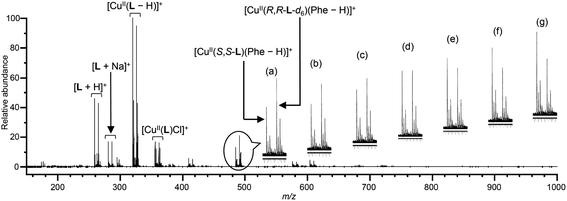
The deuterium-labelled chiral ligand R,R-L-d6 (D content, 98%) was synthesized from R-Ala (see ESI†). CD spectra of a CuCl2/R,R-L-d6 complex in methanol exhibited a Cotton effect opposite that of a CuCl2/S,S-L complex16 (Fig. S1†), indicating the formation of a chiral complex Δ-[CuII(R,R-L-d6)(MeOH)2]2+ (Fig. 2(b)).Fig. 3 shows ESI-MS spectra of solutions containing CuCl2, a quasi-racemic mixture of chiral ligands (S,S-L and R,R-L-d6), and Phe at varying ee values in the presence of K2CO3 ([CuCl2]0/[S,S-L]0/[R,R-L-d6]0/[Phe]0/[K2CO3]0 = 1.0/0.6/0.6/0.1/0.1) in water/methanol (=1/100, v/v). Signals indicating two pairs of copper(II) complex ion clusters, [CuII(S,S-L)(Phe–H)]+ and [CuII(R,R-L-d6)(Phe–H)]+, were detected with high sensitivity, and the relative peak intensity varied depending upon the ee value of Phe (Fig. 3(a–g)). [CuII(S,S-L)(MeOH)2]2+ and [CuII(R,R-L-d6)(MeOH)2]2+ mainly form four kinds of three-component complexes with R-AA and S-AA (Fig. S4†), and the equilibrium constants for AAs differ.16a Δ-[CuII(R,R-L-d6)(S-Phe)]+ was generated mainly with S-Phe (Fig. 3(a)) resulting in the negative maximum intensity excess (Ie) value, calculated according to the formula {Ie = (I[CuII(S,S-L)(AA–H)]+ − I[CuII(R,R-L-d6)(AA–H)]+) × 100/(I[CuII(R,R-L-d6)(AA–H)]+ + I[CuII(S,S-L)(AA–H)]+), where I indicates peak intensity}. In contrast, the Ie value took a positive maximum value with R-Phe (Fig. 3(g)).
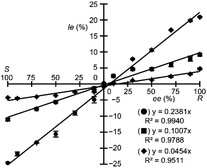
Fig. 4 shows the Ie values plotted against AA (Phe, Val and Met) ee values. A good linear relationship was observed between Ie values and AA ee values, with a correlation coefficient (R2) of 0.994, 0.979, and 0.951 for Phe, Val, and Met, respectively. Although the slope becomes smaller, the Ie value near S 100% ee of Phe also showed a good linear correlation with the ee value of the AA (see ESI, Fig. S5†). The final AA concentration in the solution prepared for MS analysis was 9.9 × 10⁻⁶ M. All ESI-MS spectra shown in this report were acquired for 2 min (240 times), because accumulation over 60 times (single scan time, 0.5 s) confirmed the Ie value stability (see ESI† for details). Thus, based on molecular recognition phenomena regarding the chiral copper(II) complex, AA ee values could be rapidly determined with high sensitivity using only ESI-MS analysis of labelled/unlabelled quasi-racemic mixture of copper(II) complex and target AAs. The method's accuracy (i.e., R2) appears to depend on the slope of the line, which correlates with the chiral discrimination ability of the chiral metal complexes toward the AAs. In the case of Met, the slope was too shallow (4.31% Ie for R 100% ee) to accurately estimate the ee value.
The Ie values of [CuII(S,S-L)(AA–H)]+ and [CuII(R,R-L-d6)(AA–H)]+ obtained for 21 S-AAs (S 100% ee) are summarized in Table 1 (respective mass spectra were showed in Table 1, Fig. S6 and S7†). These Ie values were widely distributed from negative to positive, suggesting that enantioselectivity of the copper(II) complex strongly depends on the side chain of AA. When the absolute Ie value was >10% at ee = 100%, R2 was ≥0.98. Thus, ee values for most of the AAs shown in Table 1 could be determined with high accuracy.
| Amino acid | Ie (%) | Amino acid | Ie (%) | Amino acid | Ie (%) |
|---|---|---|---|---|---|
| a [CuCl2]0 = 9.90 × 10⁻⁵ M, [S,S-L]0 = [R,R-L-d6]0 = 5.94 × 10⁻⁵ M, [S-AA]0 = [K2CO3]0 = 9.90 × 10⁻⁶ M.b [CuCl2]0 = 9.52 × 10⁻⁵ M, [S,S-L]0 = [R,R-L-d6]0 = 5.71 × 10⁻⁵ M, [S-AA]0 = [K2CO3]0 = 4.76 × 10⁻⁵ M. S-Phg = (S)-2-amino-2-phenylacetic acid (phenyl glycine), S-Tle = (S)-2-amino-3,3-dimethylbutyric acid (tert-leucine). | |||||
| S-Alaa | 2.04 | S-Meta | −4.31 | S-Tyra | −22.78 |
| S-Asna | −2.44 | S-Phea | −23.10 | S-Vala | −9.91 |
| S-Glna | 26.58 | S-Phga | 16.96 | S-Argb | 0.00 |
| S-Hisa | 7.53 | S-Proa | −47.37 | S-Aspb | 15.61 |
| S-Hypa | −56.62 | S-Thra | −1.48 | S-Glub | 18.34 |
| S-Ilea | −14.53 | S-Tlea | −19.03 | S-Lysb | −0.99 |
| S-Leua | −0.50 | S-Trpa | −28.32 | S-Serb | −8.62 |
In the case of S-AAs having cyclic backbone (S-Hyp, S-Phe) and AAs having a large side chain (S-Trp, S-Phe, S-Tyr, S-Tle, S-Phg etc.), the Ie values, that is the enantioselectivity, were large, suggesting that the steric effect is one of the important factors in the chiral discrimination by the CuII/S,S-L complex. The DFT calculation of the three-component complex also suggested the importance of steric effect.16 However, for the AAs having polar substituent such as an amino group, a carboxyl group or a hydroxy group, the magnitude of the chiral discriminating ability cannot be explained only by the steric effect. Since these substituents can act as coordination donors, the produced three-component complex may involve some isomers besides those shown in Fig. S4,† which enantioselectivity (R or S) and distribution may have contribute to the Ie value.
Next, mass spectrum of quasi-racemic mixture of copper(II) complex in the presence of 16 free S-AAs—excluding AAs with same and neighbouring molecular weight (S-Leu, S-Ile and S-Tle, S-His and S-Lys)—was acquired with simultaneous determination of Ie values (Fig. 5(a and b)). The optimized concentration ratios for the simultaneous analyses were as follows: [CuCl2]0![[thin space (1/6-em)]](https://www.rsc.org/images/entities/char_2009.gif) :
:![[thin space (1/6-em)]](https://www.rsc.org/images/entities/char_2009.gif) [S,S-L]0
[S,S-L]0![[thin space (1/6-em)]](https://www.rsc.org/images/entities/char_2009.gif) :
:![[thin space (1/6-em)]](https://www.rsc.org/images/entities/char_2009.gif) [R,R-L-d6]0
[R,R-L-d6]0![[thin space (1/6-em)]](https://www.rsc.org/images/entities/char_2009.gif) :
:![[thin space (1/6-em)]](https://www.rsc.org/images/entities/char_2009.gif) [AA (total)]0 = 1.0
[AA (total)]0 = 1.0![[thin space (1/6-em)]](https://www.rsc.org/images/entities/char_2009.gif) :
:![[thin space (1/6-em)]](https://www.rsc.org/images/entities/char_2009.gif) 0.6
0.6![[thin space (1/6-em)]](https://www.rsc.org/images/entities/char_2009.gif) :
:![[thin space (1/6-em)]](https://www.rsc.org/images/entities/char_2009.gif) 0.6
0.6![[thin space (1/6-em)]](https://www.rsc.org/images/entities/char_2009.gif) :
:![[thin space (1/6-em)]](https://www.rsc.org/images/entities/char_2009.gif) 1.5. Twelve pairs of the three-component complex ions were observed, but low peak intensity precluded detection of 4 ion pairs: S-Arg, S-Asp, S-Glu, and S-Gln. The Ie values obtained for [CuII(R,R-L-d6)(AA–H)]+ and [CuII(S,S-L)(AA–H)]+ in the single AA analysis system exhibited relatively good correlations with those obtained using the multiple-AA system under optimized concentration conditions (Fig. 5(c)), indicating that Ie values obtained even under conditions of competitive complexation are stable (see ESI,† Fig. S8 and S9). Due to ion-suppression effects, the peak intensity values of multi-component samples generally do not quantitatively reflect the amount of each component in ESI-MS analyses.17 However, in the multiple-AA system described here, the magnitude of the ion-suppression effect on relative peak intensities was low enough to permit simultaneous high-sensitivity determinations of AA ee values. It is considered that this is because the ion-suppression effect was offset to the same extent for the pseudo-diastereomeric or pseudo-enantiomeric complex ions containing the same AA. Ie value (%) is represented by the following equation: (I[CuII(S,S-L)(AA–H)]+/I[CuII(R,R-L-d6)(AA–H)]+ − 1) × 100/(I[CuII(S,S-L)(AA–H)]+/I[CuII(R,R-L-d6)(AA–H)]+ + 1). Thus, ion-suppression effect is offset because the value is represented by the peak intensity ratio of the complex ions. On the other hand, for the copper complex ions with different AAs, the three-component complex ions could not be sufficiently detected in 4 of the 16 AAs. These AAs have ionic substituents in the side chain such as carboxylate in the presence of K2CO3. Therefore, these AAs may have exhibited different ionization behaviors. In fact, potassium ion added complex ions, K[CuII(S,S-L)(AA–2H)]+ and K[CuII(R,R-L-d6)(AA–2H)]+, for Asp and Glu were generated as shown in Fig. S7(d) and (e).†
1.5. Twelve pairs of the three-component complex ions were observed, but low peak intensity precluded detection of 4 ion pairs: S-Arg, S-Asp, S-Glu, and S-Gln. The Ie values obtained for [CuII(R,R-L-d6)(AA–H)]+ and [CuII(S,S-L)(AA–H)]+ in the single AA analysis system exhibited relatively good correlations with those obtained using the multiple-AA system under optimized concentration conditions (Fig. 5(c)), indicating that Ie values obtained even under conditions of competitive complexation are stable (see ESI,† Fig. S8 and S9). Due to ion-suppression effects, the peak intensity values of multi-component samples generally do not quantitatively reflect the amount of each component in ESI-MS analyses.17 However, in the multiple-AA system described here, the magnitude of the ion-suppression effect on relative peak intensities was low enough to permit simultaneous high-sensitivity determinations of AA ee values. It is considered that this is because the ion-suppression effect was offset to the same extent for the pseudo-diastereomeric or pseudo-enantiomeric complex ions containing the same AA. Ie value (%) is represented by the following equation: (I[CuII(S,S-L)(AA–H)]+/I[CuII(R,R-L-d6)(AA–H)]+ − 1) × 100/(I[CuII(S,S-L)(AA–H)]+/I[CuII(R,R-L-d6)(AA–H)]+ + 1). Thus, ion-suppression effect is offset because the value is represented by the peak intensity ratio of the complex ions. On the other hand, for the copper complex ions with different AAs, the three-component complex ions could not be sufficiently detected in 4 of the 16 AAs. These AAs have ionic substituents in the side chain such as carboxylate in the presence of K2CO3. Therefore, these AAs may have exhibited different ionization behaviors. In fact, potassium ion added complex ions, K[CuII(S,S-L)(AA–2H)]+ and K[CuII(R,R-L-d6)(AA–2H)]+, for Asp and Glu were generated as shown in Fig. S7(d) and (e).†
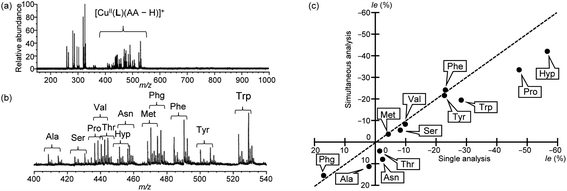 | ||
| Fig. 5 Mass spectra of a mixture of CuII/S,S-L/R,R-L-d6/S-AA in the presence of K2CO3 in water/methanol (3/20, v/v) and comparison between Ie values obtained from mass spectra. [CuCl2]0 = 8.70 × 10⁻⁵ M, [S,S-L]0 = [R,R-L-d6]0 = 5.22 × 10⁻⁵ M, [S-AA (each)]0 = 8.13 × 10⁻⁶ M and [K2CO3]0 = 1.30 × 10⁻⁴ M. [CuCl2]0/[S,S-L]0/[R,R-L-d6]0/[S-AA (total)]0 = 1.0/0.6/0.6/1.5. (a) Overall view, (b) enlarged view (mass range: m/z 400–540) for [CuII(S,S-L)(S-AA–H)]+ and [CuII(R,R-L-d6)(S-AA–H)]+. (c) Comparison between simultaneous analysis and single analysis (Table 1). Here, S-100% ee AAs were employed. The dashed line denotes a correlation coefficient of 1.0. | ||
The mass spectra of quasi-racemic mixture of copper(II) complex in the presence of multiple S-AAs were acquired by changing only the ee value of Phe (Fig. 6(a–c)). Ie values for all [CuII(L)(AA–H)]+ ions detected in the mass spectra were plotted against the ee values of Phe (Fig. 6(d)). The three-component complex ions containing S-Arg, S-Asp, S-Glu, and S-Gln were not also sufficiently detected due to their relatively low intensity. The Phe calibration line (black line for ● in Fig. 6(d)) exhibited excellent linearity (R2 = 0.998). By contrast, very little change was noted in the Ie values for all other [CuII(L)(AA–H)]+ complexes, irrespective of variation in the Phe ee value. Thus, the mass spectrometric isotope-labelling method described here using quasi-enantiomers of CuII/R,R-L-d6 and CuII/S,S-L complexes is useful for simultaneous determination of AA ee values.
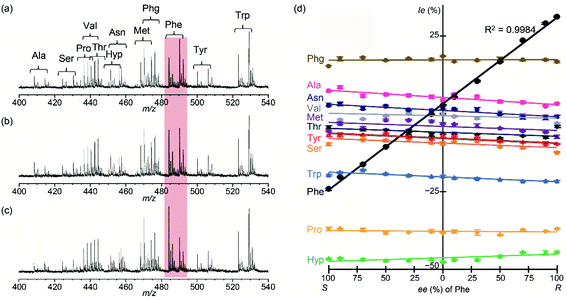 | ||
| Fig. 6 Correlation of Ie values for [CuII(S,S-L)(AA–H)]+ and [CuII(R,R-L-d6)(AA–H)]+ with Phe ee values. The contribution to intensity of the overlapping isotopic peak of the deuterium-labelled three-component ion was corrected based on the isotope's natural abundance.18 CuII/S,S-L/R,R-L-d6/AA. AA is mixture of Phe and S-Ala, S-Arg, S-Asn, S-Asp, S-Glu, S-Gln, S-Hyp, S-Met, S-Phg, S-Pro, S-Ser, S-Thr, S-Trp, S-Tyr, S-Val. [CuCl2]0 = 8.70 × 10⁻⁵ M, [S,S-L]0 = [R,R-L-d6]0 = 5.22 × 10⁻⁵ M, [AA(each)]0 = 8.13 × 10⁻⁶ M and [K2CO3]0 = 1.30 × 10⁻⁴ M. [CuCl2]0/[S,S-L]0/[R,R-L-d6]0/[AA (total)]0 = 1.0/0.6/0.6/1.5. ee of Phe = (a) 100% (S), (b) 0%, (c) 100% (R), (d) Ie (%) of AAs. | ||
We applied this analytical system to the simultaneous examination of four S-AAs (S-Ala, S-Asp, S-Pro, and S-Ser) often used as biomarkers.19 Absolute Ie values of 9.87%, 22.9%, 42.5%, and 3.48% were obtained for S-Ala, S-Asp, S-Pro, and S-Ser, respectively, suggesting that ee values could be determined simultaneously for S-Ala, S-Asp, and S-Pro. This is because these absolute Ie values were >10%, but no for S-Ser (Fig. S10†).
Conclusions
We established and demonstrated a new method for the simultaneous determination of ee values of free AAs using deuterium-labelled and unlabelled quasi-enantiomers of copper(II) complex with a chiral tetradentate ligand, R,R-L-d6 and S,S-L. Determination of ee values of AAs can be achieved rapidly and with high sensitivity, with small ion-suppression effects commonly observed with multi-component systems. In this work, the ee-determination was performed by scan mode measurement using a time-of-flight mass spectrometer, but it is expected that the sensitivity will be further improved by selected ion monitoring (SIM) mode measurement using a quadrupole mass spectrometer. Development of such a simple and highly sensitive method for ee determination should greatly enhance progress in various research efforts, such as elucidating the homochirality of living organisms and discovering new functions of R-AAs in vivo.Author contributions
The study is conceptualized and supervised by H. M. and M. S. Experiments are conducted by T. N., and H. S. with initial support by D. O., E. M., S. S., H. T., H. K., and R. A. The manuscript is written by T. N., H. M., and M. S. and checked by all the co-authors.Conflicts of interest
There are no conflicts to declare.Acknowledgements
This work was partially supported by JSPS KAKENHI Grant Numbers JP18K0595 to M. S. and JP19K05505 to H. M.Notes and references
- (a) Y. Kiriyama and H. Nochi, Scientifica, 2016, 6494621 Search PubMed; (b) R. Kimura, H. Tsujimura, M. Tsuchiya, S. Soga, N. Ota, A. Tanaka and H. Kim, Sci. Rep., 2020, 10, 804 CrossRef CAS PubMed.
- Typical examples: (a) O. Buczek, D. Yoshikami, G. Bulaj, E. C. Jimenez and B. M. Olivera, J. Biol. Chem., 2005, 280, 4247–4253 CrossRef CAS PubMed; (b) N. Fujii, Y. Kaji and N. Fujii, J. Chromatogr. B: Anal. Technol. Biomed. Life Sci., 2011, 879, 3141–3147 CrossRef CAS PubMed; (c) S. Kumashiro, A. Hashimoto and T. Nishikawa, Brain Res., 1995, 681, 117–125 CrossRef CAS PubMed; (d) H. Lam, D.-C. Oh, F. Cava, C. N. Takacs, J. Clardy, M. A. de Pedro and M. K. Waldor, Science, 2009, 325, 1552–1555 CrossRef CAS PubMed; (e) H. Koyama, M. Adachi, M. Seline, M. Katane, T. Furuchi and H. Homma, Arch. Biochem. Biophys., 2006, 446, 131–139 CrossRef CAS PubMed; (f) W. Danysz and A. C. Parsons, Pharmacol. Rev., 1998, 50, 597–664 CAS.
- (a) T. J. Wenzel and C. D. Chisholm, Prog. Nucl. Magn. Reson. Spectrosc., 2011, 59, 1–63 CrossRef CAS PubMed; (b) M. Takemura, K. Yamato, M. Doe, M. Watanabe, H. Miyake, T. Kikunaga, N. Yanagihara and Y. Kojima, Bull. Chem. Soc. Jpn., 2001, 74, 707–715 CrossRef CAS.
- (a) E. Nelson, J. S. S. K. Formen and C. Wolf, Chem. Sci., 2021, 12, 8784–8790 RSC; (b) S. Shinoda, K. Terada and H. Tsukube, Chem.–Asian J., 2012, 7, 400–405 CrossRef CAS PubMed.
- D. Leung, S. O. Kang and E. V. Anslyn, Chem. Soc. Rev., 2012, 41, 448–479 RSC.
- L. Pu, Angew. Chem., Int. Ed., 2020, 59, 21814–21828 CrossRef CAS PubMed.
- (a) K. Okutani, K. Nozaki and M. Iwamura, Inorg. Chem., 2014, 53, 5527–5537 CrossRef CAS PubMed; (b) Q. Jin, F. Wang, S. Chen, L. Zhou, H. Jiang, L. Zhang and M. Liu, Chem.–Asian J., 2020, 15, 319–324 CrossRef CAS PubMed.
- R. Koga, H. Yoshida, H. Nohta and K. Hamase, Chromatogr, 2019, 40, 1–8 CrossRef CAS.
- Y. Konya, T. Bamba and E. Fukusaki, J. Biosci. Bioeng., 2016, 121, 349–353 CrossRef CAS PubMed.
- (a) S. Piovesana, R. Samperi, A. Laganà and M. Bella, Chem. - Eur. J., 2013, 19, 11478–11494 CrossRef CAS PubMed; (b) X. Yu and Z.-P. Yao, Anal. Chim. Acta, 2017, 968, 1–20 CrossRef CAS PubMed.
- P. Dwivedi, C. Wu, L. M. Matz, B. H. Clowers, W. F. Siems and H. H. Hill, Anal. Chem., 2006, 78, 8200–8206 CrossRef CAS PubMed.
- A. Fujihara, N. Maeda, T. N. Doan and S. Hayakawa, J. Am. Soc. Mass Spectrom., 2017, 28, 224–228 CrossRef CAS PubMed.
- W. A. Tao, D. Zhang, F. Wang, P. D. Thomas and R. G. Cooks, Anal. Chem., 1999, 71, 4427–4429 CrossRef CAS PubMed.
- (a) M. Sawada, Y. Takai, H. Yamada, S. Hirayama, T. Kaneda, T. Tanaka, K. Kamada, T. Mizooku, S. Takeuchi, K. Ueno, K. Hirose, Y. Tobe and K. Naemura, J. Am. Chem. Soc., 1995, 117, 7726–7736 CrossRef CAS; (b) M. Sawada, Mass Spectrom. Rev., 1997, 16, 73–90 CrossRef CAS PubMed; (c) M. Shizuma, Chiral Recognition in Mass Spectrometry, Focusing on FAB Mass Spectrometry, in Chiral Recognition in Gas Phase, ed. A. Zehnacker, CRC Press, Boca Raton, 2010, ch 5, pp. 61–86 Search PubMed.
- (a) H. Miyake, K. Yoshida, H. Sugimoto and H. Tsukube, J. Am. Chem. Soc., 2004, 126, 6524–6525 CrossRef CAS PubMed; (b) H. Miyake, H. Sugimoto, H. Tamaki and H. Tsukube, Chem. Commun., 2005, 4291–4293 RSC.
- (a) T. Nakakoji, H. Sato, D. Ono, H. Miyake, S. Shinoda, H. Tsukube, H. Kawasaki, R. Arakawa and M. Shizuma, Chem. Commun., 2020, 56, 54–57 RSC; (b) T. Nakakoji, K. Yoshino, K. Izutsu, H. Sato, D. Ono, H. Miyake, E. Mieda, S. Shinoda, H. Tsukube, H. Kawasaki, R. Arakawa and M. Shizuma, Front. Chem., 2020, 8, 598598 CrossRef CAS PubMed.
- (a) C. R. Mallet, Z. Lu and J. R. Mazzeo, Rapid Commun. Mass Spectrom., 2004, 18, 49–58 CrossRef CAS PubMed; (b) M. Villagrasa, M. Guillamón, E. El-jarrat and D. Barceló, J. Chromatogr. A, 2007, 1157, 108–114 CrossRef CAS PubMed.
- M. Berglund and M. E. Wieser, Pure Appl. Chem., 2011, 83, 397–410 CAS.
- (a) C. Ishii, T. Miyamoto, S. Ishigo, Y. Miyoshi, M. Mita, H. Homma, T. Ueda and K. Hamase, Chromatogr, 2017, 38, 65–72 CrossRef CAS; (b) A. Furusho, R. Koga, T. Akita, M. Mita, T. Kimura and K. Hamase, Anal. Chem., 2019, 91, 11569–11575 CrossRef CAS PubMed.
Footnote |
| † Electronic supplementary information (ESI) available: Details of experimental procedures including synthesis, the spectroscopic data, and mass spectra. See DOI: 10.1039/d1ra06542d |
| This journal is © The Royal Society of Chemistry 2021 |

