 Open Access Article
Construction of stable bio-Pd catalysts for environmental pollutant remediation†
Huimei Chen *,
Ziniu Zhou,
Wei Chen,
Ziwei Xiang,
Haiyan Nie and
Weiguo Yu*
Zhejiang Pharmaceutical College, Ningbo 315503, PR China. E-mail: chengyi_chm@163.com; 183010318@qq.com
First published on 10th November 2021
Abstract
It has been reported that Pd nanoparticles were a little weak to bind to the dried microbial (yeast) surface, leading to the poor stability of the bio-supported catalysts. The objectives of the study are to construct stable Pd nanocatalysts supported on the dried yeast surface with the help of a tiny amount (<0.1 wt%) of reduced graphene oxide (Pd/yeast/rGO) and apply the catalysts in environmental pollutant remediation. The characterizations of the as-obtained Pd/yeast/rGO catalysts showed that reduced GO could cover Pd/yeast materials and prepare 15–21 nm Pd nanoparticles under acid and base media. The catalytic performance of the Pd/yeast/rGO catalyst was compared with that of control Pd/yeast catalysts without GO. The results revealed the kinetic constant Kapp in the reduction of 4-nitrophenol of Pd/yeast/rGO catalysts could reach 3.6 × 10⁻² s−1 without stirring during the reaction, which was 2.4 times higher than that of Pd/yeast catalysts, and the Pd/yeast/rGO catalysts kept a good stability even after being reused in seven cycles. Furthermore, the catalysts also showed quite good catalytic activities on CO oxidation and decolorization of dye methylene blue (MB). Thus, Pd/yeast/rGO catalysts were proven to be highly active and stable for environmental remediation and have the advantage that they can prevent the loss of noble metals and be prepared conveniently from discarded microorganisms.
Introduction
Microorganisms are abundant resources in the world and have diverse morphology and rich organic groups on the surface of the cell. They play different roles in different areas. In the preparation of nanomaterials, they possess unique properties as templates or supports to prepare single or multicomponent metal nanomaterials, such as Pd,1 AuPd,2 PdAg,3,4 PdRu5,6 et al. noble nanoparticles (NPs) or supported nanocatalysts. And the obtained materials showed good performances in environmental catalysis, oxidation–reduction reaction, analysis7 and recycling.8 Therefore, the preparation of nanomaterials based on the microbial method is a significant part in the field of nanomaterials.As early as 1998, L. E. Macaskie et al. have used sulfate-reducing bacteria Desulfovibrio desulfuricans to reduce Pd2+ to cell-bound Pd0 supported by pyruvate, formate, or H2 as the electron donor.9 In the following decades, some researchers focused on the methods to improve the catalytic activity, stability, and selectivity of the bio-supported noble metal nanomaterials (metal/microorganism). One of the methods was the combination of GO or rGO with metal/microorganism to enhance the catalytic activity. Graphene is a two-dimensional material with large specific surface area and possesses many binding sites on the surface, which is beneficial to fix homodispersed nanoparticles10 and enhance the adsorption of pollutants to shorten the induction period of the reaction, such as 4-NP,11,12 dyes,13,14 etc. Therefore, the addition of GO could improve the catalytic activity and stabilize metal NPs on the metal/microorganism catalysts. Nevertheless, worth mentioning that much research focused on the study of the combination of living microorganisms with metal and GO.3,15,16 The reduction process needed to maintain the normal metabolic ability of the living microorganisms. These led prepared processes to be more complicated since the activity of the microorganism was easily affected by the environment. And the living microorganisms were not convenient to preserve for a long time. In comparison, the application of dead microorganism or dry microorganism without metabolic capacity can lessen the complexity of operation and be more efficient. Furthermore, non-metabolic organisms could be effectively recycled from useless or discarded microorganisms in industry and scientific research experiment. This facilitated the reuse of the resources. Li's group have researched nanomaterials and nanocatalysts based on dry microbe, and much work about Pd/microbe, Au/microbe, AuPd/microbe supported nanocatalysts, nanoflower Au, AuPd and nanowire AuAg materials et al. have been reported.17 Worth mention that some nanoflower morphology among them were hardly prepared by other reagents or chemical methods until now. Their work illustrated that, compared with active microbe or inorganic supports, dead/dry microbe played an irreplaceable role in preparing nanomaterials.
In this study, we chose high culture yield of eukaryotic microorganisms, dry dead yeast Pichia pastoris GS115, as the research object. On the base of our previous work on preparing Pd/yeast nanocatalysts by non-enzymatic reduction,18 we aimed to further improve the catalytic activity and stability of Pd/yeast nanocatalysts. Thus, we explored by the addition of trace rGO to cover and stabilize Pd2+/yeast materials by electrostatic attraction, and further reduced by reductant ascorbic acid to obtain Pd/yeast/rGO nanocatalysts. The structure properties of the catalysts were characterized by a variety of techniques, including transmission electron microscopy (TEM), scanning electron microscope (SEM), energy dispersive X-ray (EDX) analysis, X-ray diffraction (XRD), Fourier transform infrared (FTIR), X-ray photoelectron spectroscopy (XPS), atomic absorption spectroscopy (AAS), Raman spectra, zeta potential and BET specific surface area. Furthermore, the catalytic activities of the catalysts were estimated in the control of pollutants.
Experimental
Materials and reagents
Pichia pastoris GS115 was purchased from Invitrogen Corporation in the United States. Yeast extract powder was purchased from Oxoid Ltd, England. Other reagents were purchased from Sinopharm Chemical Reagent Co., Ltd, China. Deionized water was used in the experiment.Preparation of the dried powder of Pichia pastoris GS115
The method of preparation of the dried powder of yeast was similar with our previous study.18 In brief, the yeasts were grown in the solution contained yeast 10 g L−1, soybean peptone 20 g L−1 and glucose 20 g L−1 at 30 °C, 200 rpm for 48 h. Then the yeasts were harvested by centrifugation (5000 rpm, 10 min) at room temperature, washed thrice with deionized water and dried in the oven at 60 °C for 12 h. After that, the dried yeasts were ground into fine powder and screened with a 100-mesh sieve. The prepared yeasts were stored in the desiccator.Preparation of Pd/yeast/rGO catalysts
GO was prepared from natural graphite powders by a modified Hummers method19 and 1 mg mL−1 GO reserve solution were kept in the refrigerator (4 °C) for later use. Palladium chloride reserve solution was prepared by dissolved solid PdCl2 of 1.0 g in 50 mL aqueous HCl of 1 M and then preserved in a brown reagent bottle in the refrigerator (Pd ion concentration, 112.79 mmol L−1). In a typical preparation of Pd/yeast/rGO catalyst experiment, some weighted dried yeast powders were dispersed into deionized water in an Erlenmeyer flask (the final yeast concentration, 1 g L−1). Then PdCl2 reserve solution of 89 μL was added. At present, the pH value of the solution was about 2.7. Then the solution was stirred in an oil bath at 150 rpm, 30 °C for 1 h. In this period, Pd ions were adsorbed onto the surface of the yeast. Right now, the surface of the yeast was partially positive charged. Then 1 mg mL−1 GO of 1 mL solution (firstly sonicated for 20 min) and reductant ascorbic acid (10 mmol L−1) solution of 5 mL were added into the solution in turn at the same temperature, then stirred still for 5 h. Pd ions and GO would be reduced. Finally, the Pd/yeast/rGO samples were obtained by centrifugation (10![[thin space (1/6-em)]](https://www.rsc.org/images/entities/char_2009.gif) 000 rpm, 10 min), washed thrice with deionized water and dried in vacuum at 60 °C. The preparation of the control Pd/yeast catalysts were also conducted in the same condition without adding GO solution.
000 rpm, 10 min), washed thrice with deionized water and dried in vacuum at 60 °C. The preparation of the control Pd/yeast catalysts were also conducted in the same condition without adding GO solution.
To study the different sizes of Pd NPs, the Pd/yeast/rGO catalysts prepared under the same conditions except the pH values of the solution were adjusted to 4.0 and 9.6 by the addition of NaOH solution (0.01 mol L−1).
Characterizations of Pd catalysts
TEM images and high resolution TEM (HRTEM) were obtained on an electron microscope (Tecnai F30, the Netherlands) at 300 keV. SEM images and EDX analysis were carried out on environmental scanning electron microscopy (FEI QUANTA FEG 650). X-ray diffraction (XRD) was conducted on an AXS D8 Advance diffractometer with Cu-Kα radiation (λ = 1.5418 Å). X-ray photoelectron spectroscopy (XPS) was performed on an AXIS ULTARDLD spectroscope. The binding energy was calibrated by C 1s as reference energy (C 1s = 284.6 eV). Fourier transform infrared spectroscopy (FTIR, FTIR6500; Tianjin Gangdong Sci. & Tech. Co., Ltd) was used to analyze component changes before and after preparation. The Pd(II) concentration in the solution were analyzed by the atomic absorption spectrophotometer (AAS, TAS-990AFG, PERSEE, China). Raman spectra was measured with an Invia-reflex Raman system (RENISHAW PLC, UK). Thermogravimetric (TG) analysis was carried out on a Netzsch TG209F1 thermobalance under flowing N2 atmosphere at a heating rate of 10 K min−1 from 300 to 1073 K. Zeta potential was performed on Malvern Zetasizer Nano. BET analysis was conducted on Micromeritics ASAP 2460 3.01 using N2 as analysis adsorptive.Environmental pollutant remediation
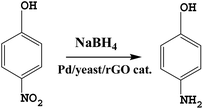 | (1) |
![[thin space (1/6-em)]](https://www.rsc.org/images/entities/char_2009.gif) 000 mL h−1 (g cat)−1 using 0.2 g catalyst. The analysis of the outlet gas was proceeded online via a gas chromatograph equipped with a thermal conductivity detector (TCD) with a MS 5A molecular sieve column.
000 mL h−1 (g cat)−1 using 0.2 g catalyst. The analysis of the outlet gas was proceeded online via a gas chromatograph equipped with a thermal conductivity detector (TCD) with a MS 5A molecular sieve column.| Decolorization efficiency (%) = 100 × (A0 − At)/A0 |
Results and discussion
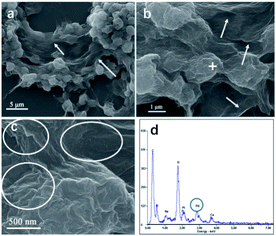
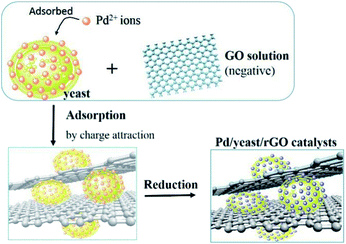
In this study, we chose the dried yeast of non-biological metabolism as research subjects. At room temperature, Pd2+ ions were firstly adsorbed on the surface of the yeast by the abundant functional groups.17 These led the surface of the yeast to be positive charged. With the help of positive and negative charge attraction, a small amount of negative charge GO (zeta potential: ca. −39 mV, weight loading: less than 0.1 wt%) with the high theoretical surface area could cover most parts of the surface of the Pd2+/yeast materials. Then GO and Pd2+ ions on the materials were further reduced by the addition of reductant ascorbic acid to obtain the Pd/yeast/rGO composite materials. In order to verify the conceiving of the formation, some characterizations were conducted. The Raman spectrum shows the characteristic D and G peaks of graphene which located at 1331 cm−1 and 1595 cm−1 (Fig. S1, ESI†). This indicates GO was reduced to rGO. According to the SEM images and EDX spectrogram for Pd/yeast/rGO sample, this vividly confirms our structure assumption. rGO covered the Pd/yeast catalyst and the Pd/yeast/rGO composite were prepared (arrows in Fig. 1a and b). Most Pd nanoparticles are supported on the yeast surface (cycles on Fig. 1c). According to the AAS results, no residual Pd element was existed in the solution (data not show). This was better than Pd nanoparticles only adsorbed by the dried yeast, according to our previous report.18 The reason of the enhanced adsorption rate might be to some extent due to the role of rGO, which could also effectively adsorb and load Pd ions. Taking EDX analysis on “+” position in Fig. 1b, it indeed exited Pd element on the catalysts, as shows in Fig. 1d.To further observe the morphology of Pd nanoparticles, TEM images of the obtained Pd/yeast/rGO catalysts are displayed in Fig. 2a and b. Like-nanocluster Pd NPs are well dispersed on the surface of the yeast and some NPs were supported on the rGO surface. HRTEM images in Fig. 2c shows d-spacing of 0.223 nm corresponding to (111) facet of palladium. The particle mean size is about 15.1 nm based on the statistics of particle sizes of no less than 300 nanoparticles (Fig. 2d). If Pd ions were just adsorbed and supported on the yeast, spherical and less than 10 nm Pd NPs were prepared. Whereas if the system had some reductants or surfactants, NP morphology may changed. As is well known, reduction condition significantly affected the shape-control synthesis of nanoparticles. Ascorbic acid was a mild reductant. This led to Pd ions remain a high concentration and growth stages became kinetically controlled under weakly reducing conditions, thus directional growth of non-spherical shapes such as nanocluster structure in this work were preferring to yield.25–27 When pH of the solution was adjusted to 4.0 and 9.6, the sizes of Pd NPs changed to 16.7 nm and 21.0 nm, respectively (Fig. S2†). The acid–base conditions of the solution affected the structures of the functional groups on the surface of the yeast,18 the surface properties of the GO and the structures of ascorbic acid.28 This affected the formation of Pd NPs, but residual Pd element was still no existed in the solution according to the results of AAS measurement.
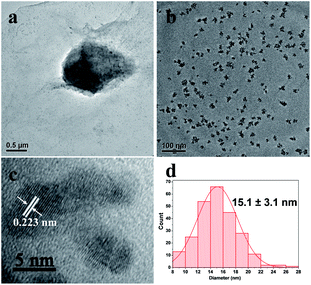 | ||
| Fig. 2 (a) and (b) TEM images, (c) HRTEM image of Pd/yeast/rGO catalysts and (d) the corresponding statistics of particle sizes. | ||
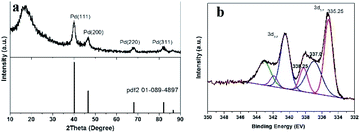
The Pd nanocrystalline phase of the prepared Pd/yeast/rGO catalysts were characterized by XRD. According to the standard XRD patterns of face-centered cubic (fcc) Pd (PDF-2 card No. 01-089-4897), prominent Bragg reflections at 2θ of 40.1°, 46.7°, 68.1°, 82.1° and 86.6° were observed, which corresponds to the Bragg reflections of (111), (200), (220), (311), and (222). The results are manifested in Fig. 3a. However, the Bragg reflection of rGO (002) was not observed at 2θ of 23°–26°. Since the weight loading of rGO in the Pd/yeast/rGO composites was only less than 0.1 wt%, which was hard to detect by XRD analysis. Even so, rGO were still detected by TEM, SEM, FTIR and Raman techniques. XPS diagram of the Pd 3d peaks on the surface of the Pd/yeast/rGO catalyst is demonstrates in Fig. 3b. 335.25 eV and 340.5 eV correspond to the binding energies of Pd(0) 3d5/2 and 3d3/2 orbital peaks, respectively.29,30 The binding energy between them is the interval of 5.25 eV. There also show other two peaks in the Pd 3d5/2 peaks, which are 337.0 and 338.25 eV. The two binding energies could be Pd(II) combined with other function groups on the yeast surface and rGO. For the compared Pd/yeast catalysts, there also show two valence states of Pd(0) and Pd(II) in Fig. S3.†
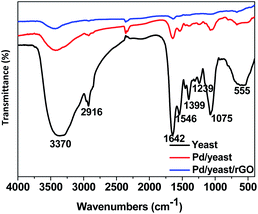
Effective functional groups on the surface of the yeast play an important role in the adsorption and reduction of palladium ions. FTIR characterization technique are carried out to analyse the change of functional groups on the cell surface before and after the adsorption and reduction of Pd ions, and speculate on the plausible mechanism of the formation of Pd NPs. Fig. 4 exhibits FITR spectra of yeast (black line), Pd/yeast (red line) and Pd/yeast/rGO (blue line). The black line in the diagram appeared several significant absorption peaks. A strong broad absorption peak center at 3370 cm−1 are the overlapped stretching vibrations of NH2 and OH groups.31,32 The absorption band at 2916 cm−1 is ascribed to as C–H stretching vibrations of carbohydrates. The peaks at 1399, 1239, 1075 cm−1 are identified as the alcohol hydroxyl structure C–OH. Two absorption bands center at 1642 and 1546 cm−1 are assigned to the amide I and amide II of proteins due to –C![[double bond, length as m-dash]](https://www.rsc.org/images/entities/char_e001.gif) O and ±N–H stretching vibrations in their amide linkages, respectively.31,33 The intensity of these absorption peaks is evidently weakened when dried yeast was loaded with Pd NPs and combined with rGO. Therefore, the functional groups on the cell and rGO surface took part in the adsorption and reduction of palladium ions and played a very important role. Besides, the weakened absorption peaks also verified the reduction of GO on the other hand since there exist some characteristic absorption peaks in FTIR spectra of GO (seen in Fig. S4†).
O and ±N–H stretching vibrations in their amide linkages, respectively.31,33 The intensity of these absorption peaks is evidently weakened when dried yeast was loaded with Pd NPs and combined with rGO. Therefore, the functional groups on the cell and rGO surface took part in the adsorption and reduction of palladium ions and played a very important role. Besides, the weakened absorption peaks also verified the reduction of GO on the other hand since there exist some characteristic absorption peaks in FTIR spectra of GO (seen in Fig. S4†).
Based on SEM images and the structure analyses, the schematic diagram of the formation of Pd/yeast/rGO nanocatalysts is illustrated in Fig. 5. In order to explore the stability of the catalysts in waster solution, zeta potentials of the Pd/yeast/rGO catalysts at different pH solution are showed in Fig. S5.† The results represent that the catalysts have surface negative charge in the wide pH range. The existed electrical repulsion of the catalysts surface made them maintain a higher stability in the solution, which is conducive to catalytic reaction in water solution.24
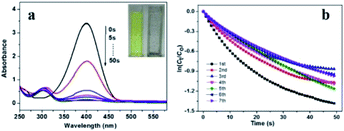
Then we measure the catalytic activity of Pd/yeast/rGO catalyst. The reduction of 4-NP to 4-AP was chosen as a model reaction. 4-NP as a priority control pollutant is harmful to human health and ecological environment,34,35 while the reduction product 4-AP has low toxicity, easy to degrade, and is also a key intermediate for the synthesis of antipyretic analgesics.36 Therefore, the conversion of 4-NP to 4-AP not only realizes the degradation of 4-NP, but also effectively synthesizes 4-AP. The catalytic activity of the catalyst was determined by kinetic constant according to UV-vis spectrophotometry. When NaBH4 as the reducing agent to supply proton H was added into 4-NP solution, the adsorption peak at 400 nm appeared. Whereas the absorbance of the absorption peak at 400 nm would decrease when an active catalyst was added into the solution. And a new absorption peak appearing at 308 nm indicated the formation of 4-AP. The result is shown in Fig. 6a. When 4-NP was completely converted to 4-AP, the absorption peak at 400 nm would disappear. At this moment, the colour of the solution changed from yellow to colourless (insert picture in Fig. 6a). The kinetic constants of this reaction can be calculated by the following pseudo-first-order reaction kinetic eqn (2) and (3):
| −dCt/dt = KappCt | (2) |
| ln(Ct/C0) = −Kappt + m = ln(At/A0) | (3) |
When the Pd particle mean size of Pd/yeast/rGO catalysts changed to 16.7 nm and 21.0 nm, their kinetic constant dropped to 2.6 × 10⁻² and 9.7 × 10⁻³ s−1 (Fig. S6†), respectively. One reason of the fall in kinetic constant might be related to the Pd particle size effect, the other might be due to the change of the functional groups on the yeast surface. In the previous study, the yeast treated with HCl, NaOH, formic acid, acetic anhydride and so on would change the surface functional groups and affect the adsorption ability of metal ions.18,33 The catalytic activity is influenced by active component (size, morphology, interaction with the support), support (structure) etc. In acid or base solution, the prepared condition affected the formation of the catalysts, thus leading to different catalytic activities.
In order to evaluate the stability of Pd/yeast/rGO catalyst (15.1 nm), the catalyst was reused 7 times. The results are revealed in Fig. 6b. After seven cycles, the kinetic constant of the catalyst was not considerable decrease, from 3.6 × 10⁻² s−1 to 2.3 × 10⁻² s−1 (detail information in Table S1†). The result were better than our previous study of Pd/yeast since the kinetic constant dropped below 50% after 5 cycles.18 After 7 cycles, the reactants 4-NP were completely converted to the product 4-AP eventually since the color of the solution was colourless. And the activity and stability of Pd/yeast/rGO catalysts was superior to our previous report about Pd/yeast catalysts. After 7 cycles, like-nanocluster PdNPs on Pd/yeast/rGO catalysts developed into small spherical approximately 3.5 nm PdNPs according to the result of the TEM image (Fig. S7†). The change of Pd nanostructure was quite interesting. This may be due to spherical particles possessed lower surface energy and tended to be more stable on the view of crystal theory. The previous reports elucidated that graphene can accelerate the adsorption of 4-NP to the surface of the catalyst, reduce the induction and improve the rate of the reaction.11,12 UV-vis spectroscopy can intuitively observe its interaction,37 so we took scanning of GO, 4-NP and rGO + 4-NP solutions, the results were shown in Fig. S8.† 4-NP has an absorption band centered at 316 nm, while GO has a typical absorption maximum at 228 nm. After reduction, the absorption bands of 4-NP change to one broad peak with a maximum at 321 nm in rGO + 4-NP, implying that the 4-NP interact with rGO. From the above results, we verified the previous reports. rGO can interact and accelerate the adsorption of 4-NP to the surface of the catalyst. Then, active component Pd–H intermediates via the dissociation of B–H bond would reduce 4-NP to 4-AP.38
The catalytic activity and stability of the Pd/yeast/rGO catalysts were also comparable or superior to other some reports.3,32,36,39 For example, Kapp of this work at the first time could reach 2.16 min−1 (3.6 × 10⁻² s−1) which were higher than Kapp of Pd-azo-POPs-80 catalyst (0.344 min−1) in Yus' the work,39 whereas Kapp of this work was not better than that of He's work (84 × 10−3 s−1).36 More comparison with some current researches was listed in Table S2.† We can conclude that Pd/yeast/rGO catalyst with a trace amount of GO could at utmost extent improve the activity and stability of the Pd/yeast catalyst applied in the reduction of 4-NP.
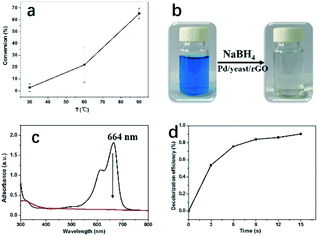
To excavate the potential applications of the catalysts for the environmental pollutant remediation, this work also attempted to test the treatment of other contaminants, namely, CO oxidation and decolorization of MB, the results are shown in Fig. 7. CO reaction was carried out at not high temperature since the bacteria in Pd/yeast/rGO catalysts are easy to decompose at high temperature according to the result of TG (Fig. S9†). When the reaction temperature was 90 °C, the conversion of CO oxidation could reach 65% (Fig. 7a). This indicates the potential value of the catalyst for the reaction. And Pd/yeast/rGO catalysts also showed quite good performance with efficiency of 100% for MB decolorization (Fig. 7b–d). Decolorization of MB was tested in the presence of NaBH4. The color of the solution changed from blue to colorless as soon as the addition of Pd/yeast/rGO catalyst, which was ascribed to the destruction of the conjugated chromophore structure of MB (i.e., C![[double bond, length as m-dash]](https://www.rsc.org/images/entities/char_e001.gif) N and C
N and C![[double bond, length as m-dash]](https://www.rsc.org/images/entities/char_e001.gif) S+–C).23,24 The catalytic reaction happened very quickly. The method to calculate reaction rate constants is the same with Kapp in the reduction of 4-nitrophenol. The reaction pseudo-first-order reaction constant of decolorization of MB is calculated to be 16.3 min−1 (Fig. S10†). The turnover frequency (TOF, defined as the number of MB molecules per metallic Pd per minute; the unit is mol mol−1 min−1) of the Pd/yeast/rGO catalyst is calculated to be 0.72 mol mol−1 min−1, indicating the Pd/yeast/rGO catalyst possessed well catalytic activity for decolourization of MB.
S+–C).23,24 The catalytic reaction happened very quickly. The method to calculate reaction rate constants is the same with Kapp in the reduction of 4-nitrophenol. The reaction pseudo-first-order reaction constant of decolorization of MB is calculated to be 16.3 min−1 (Fig. S10†). The turnover frequency (TOF, defined as the number of MB molecules per metallic Pd per minute; the unit is mol mol−1 min−1) of the Pd/yeast/rGO catalyst is calculated to be 0.72 mol mol−1 min−1, indicating the Pd/yeast/rGO catalyst possessed well catalytic activity for decolourization of MB.
Conclusions
In summary, we reported a method to prepare the stable Pd/yeast/rGO catalyst by combining GO with non-enzymatic reduction Pd2+/yeast catalyst by positive and negative charge attraction. Different sizes of Pd NPs were prepared under acid–base solutions. The Pd particle mean size of the Pd/yeast/rGO catalyst was about 15–21 nm. The pseudo-first-order kinetic constant of reduction of 4-NP could reach as high as 3.6 × 10⁻² s−1, which was 2.4 time higher than that of the compared Pd/yeast catalyst. The catalytic stability of Pd/yeast/rGO catalyst was not significantly declined after even recycling for 7 times, which was still better than the Pd/yeast catalyst. Therefore, the structure of Pd/yeast/rGO catalyst could enhance the catalytic activity and stability to prevent the loss of precious metals. Furthermore, the Pd/yeast/rGO catalysts also showed quite well catalytic activities on CO oxidation and decolorization of MB. And believe that the prepared method of bio-Pd catalysts will have good advancement in environmental pollutant remediation in the future.Conflicts of interest
There are no conflicts to declare.Acknowledgements
The authors are grateful for financial supports from Zhejiang Provincial Natural Science Foundation of China (Grant No. LQ21E080022, LGG21H300001), Ningbo Natural Science Foundation (202003N4333) and Scientific Research Fund of Zhejiang Provincial Education Department (No. Y201840545).References
- J. Zhu, J. Wood, K. Deplanche, I. Mikheeriko and L. E. Macaskie, Appl. Catal., B, 2016, 199, 108–122 CrossRef CAS.
- H. Chen, J. Huang, D. Huang, D. Sun, M. Shao and Q. Li, J. Mater. Chem. A, 2015, 3, 4846–4854 RSC.
- R. S. Han, X. Song, Q. H. Wang, Y. S. Qi, G. Z. Deng, A. Y. Zhang, Q. N. Wang, F. Y. Chang, C. Wu and Y. Y. Cheng, J. Chem. Technol. Biotechnol., 2019, 94, 3375–3383 CrossRef CAS.
- R. L. Kimber, F. Parmeggiani, T. S. Neill, M. L. Merroun, G. Goodlet, N. A. Powell, N. J. Turner and J. R. Lloyd, Microb. Biotechnol., 2021, 1–13 Search PubMed.
- J. Gomez-Bolivar, I. P. Mikheenko, R. L. Orozco, S. Sharma, D. Banerjee, M. Walker, R. A. Hand, M. L. Merroun and L. E. Macaskie, Front. Microbiol., 2019, 10, 1276 CrossRef PubMed.
- J. B. Omajali, J. Gomez-Bolivar, I. P. Mikheenko, S. Sharma, B. Kayode, B. Al-Duri, D. Banerjee, M. Walker, M. L. Merroun and L. E. Macaskie, Sci. Rep., 2019, 9, 4715 CrossRef PubMed.
- J. Liu, Z. Hong, W. Yang, C. Liu, Z. Lu, L. Wu, M. F. Foda, Z. Yang, H. Han and Y. Zhao, ACS Appl. Bio Mater., 2021, 4, 2009–2019 CrossRef CAS.
- A. J. Murray, I. P. Mikheenko, K. Deplanche, J. B. Omajali, J. Gomez-Bolivar, M. L. Merroun and L. E. Macaskie, in Resource recovery from wastes: towards a circular economy, The Royal Society of Chemistry, 2020, pp. 213–243, DOI: 10.1039/9781788016353-00213.
- J. R. Lloyd, P. Yong and L. E. Macaskie, Appl. Environ. Microbiol., 1998, 64, 4607–4609 CrossRef CAS PubMed.
- H. L. Shuai, X. Wu, K. J. Huang and Z. B. Zhai, Biosens. Bioelectron., 2017, 94, 616–625 CrossRef CAS PubMed.
- Z. Zhang, F. Xiao, J. Xi, T. Sun, S. Xiao, H. Wang, S. Wang and Y. Liu, Sci. Rep., 2014, 4, 4053 CrossRef PubMed.
- H. Deng, J. Yin, J. Ma, J. Zhou, L. Zhang, L. Gao and T. Jiao, Appl. Surf. Sci., 2021, 543, 148821 CrossRef CAS.
- F. Liu, S. Chung, G. Oh and T. S. Seo, ACS Appl. Mater. Interfaces, 2012, 4, 922–927 CrossRef CAS PubMed.
- Q. Fang and B. Chen, J. Mater. Chem. A, 2014, 2, 8941–8951 RSC.
- J. W. Liu, Y. Zheng, Z. L. Hong, K. Cai, F. Zhao and H. Y. Han, Sci. Adv., 2016, 2, e1600858 CrossRef PubMed.
- Y. N. Hou, S. Y. Sun, Z. N. Yang, H. Yun, T. T. Zhu, J. F. Ma, J. L. Han, A. J. Wang and H. Y. Cheng, Environ. Res., 2020, 184, 109317 CrossRef CAS PubMed.
- J. Huang, L. Lin, D. Sun, H. Chen, D. Yang and Q. Li, Chem. Soc. Rev., 2015, 44, 6330–6374 RSC.
- H. Chen, D. Huang, L. Lin, T. Odoom-Wubah, J. Huang, D. Sun and Q. Li, J. Colloid Interface Sci., 2014, 433, 204–210 CrossRef CAS PubMed.
- X. Zhou and Z. Liu, Chem. Commun., 2010, 46, 2611–2613 RSC.
- M. Du, J. Huang, D. Sun, D. Wang and Q. Li, Ind. Eng. Chem. Res., 2018, 57, 14910–14914 CrossRef CAS.
- F. Yang, J. Huang, T. Odoom-Wubah, Y. Hong, M. Du, D. Sun, L. Jia and Q. Li, Chem. Eng. J., 2015, 269, 105–112 CrossRef CAS.
- T. Odoom-Wubah, M. Du, W. B. Osei, D. Sun, J. Huang and Q. Li, Chin. J. Chem. Eng., 2015, 23, 1907–1915 CrossRef CAS.
- F. Chen, A. S. Gong, M. Zhu, G. Chen, S. D. Lacey, F. Jiang, Y. Li, Y. Wang, J. Dai, Y. Yao, J. Song, B. Liu, K. Fu, S. Das and L. Hu, ACS Nano, 2017, 11, 4275–4282 CrossRef CAS PubMed.
- G. Fu, L. Tao, M. Zhang, Y. Chen, Y. Tang, J. Lin and T. Lu, Nanoscale, 2013, 5, 8007–8014 RSC.
- B. Lim, M. Jiang, J. Tao, P. H. C. Camargo, Y. Zhu and Y. Xia, Adv. Funct. Mater., 2009, 19, 189–200 CrossRef CAS.
- Y. Xia, Y. J. Xiong, B. Lim and S. E. Skrabalak, Angew. Chem., Int. Ed., 2009, 48, 60–103 CrossRef CAS PubMed.
- S. S. Cheong, J. D. Watt and R. D. Tilley, Nanoscale, 2010, 2, 2045–2053 RSC.
- M. Wang, O.-W. Tareque, H. Chen, X. Jing, T. Kong, D. Sun, J. Huang and Q. Li, Nanoscale, 2013, 5, 6599–6606 RSC.
- H. Karimi-Maleh, K. Cellat, K. Arıkan, A. Savk, F. Karimi and F. Şen, Mater. Chem. Phys., 2020, 250, 123042 CrossRef CAS.
- M. R. Kosinski, A. J. Vizcaíno, L. M. Gómez-Sainero, A. Carrero and R. T. Baker, Appl. Catal., B, 2021, 286, 119935 CrossRef CAS.
- L. Y. Tao, J. S. Gong, C. Su, M. Jiang, H. Li, H. Li, Z. M. Lu, Z. H. Xu and J. S. Shi, ACS Biomater. Sci. Eng., 2018, 4, 1307–1315 CrossRef CAS PubMed.
- H. Veisi, Z. Joshani, B. Karmakar, T. Tamoradi, M. M. Heravi and J. Gholami, Int. J. Biol. Macromol., 2021, 172, 104–113 CrossRef CAS PubMed.
- L. Lin, W. Wu, J. Huang, D. Sun, N. u. M. Waithera, Y. Zhou, H. Wang and Q. Li, Chem. Eng. J., 2013, 225, 857–864 CrossRef CAS.
- M. Nasrollahzadeh, M. Sajjadi, M. Maham, S. M. Sajadi and A. A. Barzinjy, Mater. Res. Bull., 2018, 102, 24–35 CrossRef CAS.
- T. A. Revathy, K. Dhanapal, S. Dhanavel, V. Narayanan and A. Stephen, J. Alloys Compd., 2018, 735, 1703–1711 CrossRef CAS.
- Z. He, R. Liu, C. Xu, Y. Lai, W. Shan and J. Liu, Appl. Catal., B, 2021, 285, 119775 CrossRef CAS.
- X. Qi, K. Y. Pu, X. Zhou, L. Hai, B. Liu, F. Boey, H. Wei and H. Zhang, Small, 2010, 6, 663–669 CrossRef CAS PubMed.
- T. Liu, Y. Sun, B. Jiang, W. Guo, W. Qin, Y. Xie, B. Zhao, L. Zhao, Z. Liang and L. Jiang, ACS Appl. Mater. Interfaces, 2020, 12, 28100–28109 CrossRef CAS PubMed.
- Y. Yu, Y. Gong, B. Cao, H. Liu, X. Zhang, X. Han, S. Lu, X. Cao and H. Gu, Chem.–Asian J., 2021, 16, 837–844 CrossRef CAS PubMed.
Footnote |
| † Electronic supplementary information (ESI) available. See DOI: 10.1039/d1ra06465g |
| This journal is © The Royal Society of Chemistry 2021 |

