
 Open Access Article
 This Open Access Article is licensed under a Creative Commons Attribution-Non Commercial 3.0 Unported Licence
Overlayer deposition-induced control of oxide ion concentration in SrFe0.5Co0.5O2.5 oxygen sponges†
Joonhyuk Lee a,
Younghak Kimb,
Jinhyung Choc,
Hiromichi Ohta*d and
Hyoungjeen Jeen*ae
a,
Younghak Kimb,
Jinhyung Choc,
Hiromichi Ohta*d and
Hyoungjeen Jeen*ae
aDepartment of Physics, Pusan National University, Busan 46241, Korea. E-mail: hjeen@pusan.ac.kr
bPohang Accelerator Laboratory, Pohang University of Science and Technology, Pohang 37673, Korea
cDepartment of Physics Education, Pusan National University, Busan 46241, Korea
dResearch Institute for Electronic Science, Hokkaido University, Sapporo 001-0020, Japan. E-mail: hiromichi.ohta@es.hokudai.ac.jp
eResearch Center for Dielectric and Advanced Matter Physics, Pusan National University, Busan 46241, Korea
First published on 29th September 2021
Abstract
Controlling the oxide ion (O2−) concentration in oxides is essential to develop advanced ionic devices, i.e. solid oxide fuel cells, smart windows, memory devices, energy storage devices, and so on. Among many oxides several transition metal (TM)-based perovskite oxides show high oxide ion conductivity, and their physical properties show high sensitivity to the change of the oxide ion concentration. Here, the change in the oxide ion concentration is shown through the overlayer deposition on the SrFe0.5Co0.5O2.5 (SFCO) oxygen sponge film. We grew SFCO films followed by the deposition of two kinds of complex oxide films under exactly the same growth conditions, and observed the changes in the crystal structure, valence states, and magnetic ground states. As the NSMO overlayer grows, strong evidence of oxidation at the O K edge is shown. In addition, the Fe4+ feature is revealed, and the electron valence state of Co increased from 3 to 3.25. The oxide ion concentration of SFCO changes during layer growth due to oxidation or reduction due to differences in chemical potential. The present results might be useful to develop advanced ionic devices using TM-based perovskite oxides.
1. Introduction
The functional properties of complex metal oxides are influenced by lattice, spin, orbital, charge degrees of freedom, and their interplay.1–7 The functionality is often realized by substrate induced strain, cation doping, and charge doping through interfacial engineering. Another promising method for controlling such functionality in complex metal oxides is to manipulate oxide ion concentration in the oxides.8–13 Due to the known high oxide ion conductivity and excellent catalytic activity without triple phase boundaries, perovskite and perovskite-like structures are suitable choices for ion-driven technology.13,14 The oxide ion-driven technology is important for ion conduction, the center of many energy storages such as magnetic memory devices,15,16 fuel cells,13,17 smart windows,18 and sensor technology.19Typically, functional devices, i.e. neuromorphic devices, solid oxide fuel cells, and etc., are designed as a stack of several layers. It is often found that functional properties of each layer in the stack are deviated from those of its bulk-form.20,21 For example, due to modulation of interfacial chemistry, when certain oxides form heterostructures, reduced spin transport in La1−xSrxMnO3-based tunneling devices and unconventional transport behavior in LaNiO3 due to unidirectional oxygen diode effect are observed.22,23 In addition, heterointerface design is crucial for performance and longevity of electrochemical devices from the example of an oxide getter for detoxicating contaminated air and enhanced oxygen surface exchange kinetics in fuel cell applications.24,25 Therefore, it is indispensible to understand chemistry at the interface between the two oxides and track the changes in oxide ion concentration along depth direction.
In this report, we studied modulation of interfacial chemistry of oxygen sponge SrFe0.5Co0.5O2.5 (SFCO), which is a solid solution of SrFeO2.5±δ and SrCoO2.5+δ. The crystal structure of the oxygen sponges can be reversibly converted between brownmillerite/perovskite upon redox reactions with various ways.26–30 Brownmillerite structure is ABO2.5, where A and B are cations and O is oxygen in chemical formula. It consists of alternate stacks of an octahedral layer and an oxygen deficient tetrahedral layer. A simple deposition of an overlayer on an SFCO oxygen sponge film changes the oxide ion concentration (Fig. 1). We fabricated SFCO films followed by the deposition of two different complex oxides, i.e. SrTiO3 and Nd0.5Sr0.5MnO3 films under exactly the same growth condition. We tracked the changes in the crystal structure, valence state, and magnetic ground state. As a result of these observations, the oxide ion concentration of SFCO readily changed during layer growth due to oxidation or reduction due to differences in chemical potentials. The results of this study on the interface of complex oxides can provide opportunities to improve the design and performance of new devices.
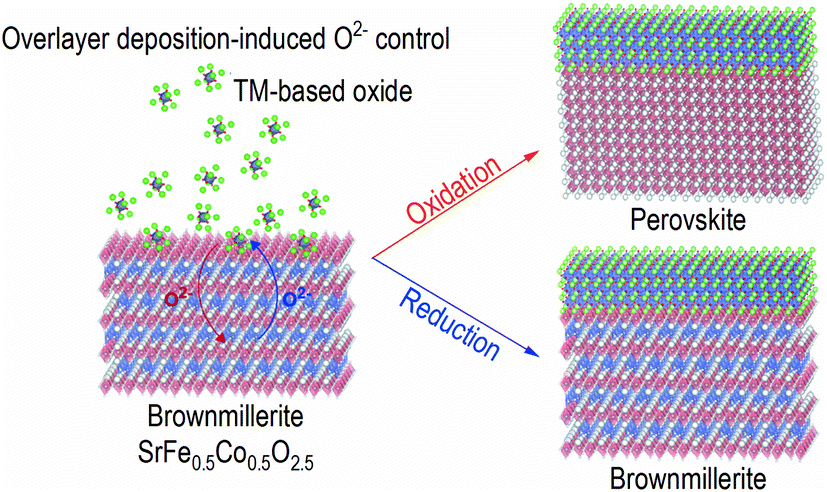 | ||
| Fig. 1 Schematic illustration of overlayer deposition-induced oxide ion concentration control in SFCO film. When STO is deposited on BM-SFCO film, reduction occurs. On the other hand, when NSMO is deposited on BM-SFCO, oxidation occurs and the crystal structure changes to perovskite. | ||
2. Experimental
2.1 Sample preparation
Brownmillerite SFCO (space group icmm, a = 5.6243 Å, b = 15.6515 Å, c = 5.5017 Å (ref. 31)) thin films (three samples) were grown on (001) (LaAlO3)0.3-(SrAl0.5Ta0.5O3)0.7 (LSAT) substrates by pulsed laser deposition (PLD). A Q-switched 3ω-Nd:YAG (λ = 355 nm) laser was used to ablate the ceramic targets. The laser fluence and repetition rate were kept as 0.75 J cm−2 and 4 Hz, respectively. Optimal growth conditions were selected by controlling the substrate temperature and oxygen partial pressure (PO2), and as-grown SFCO (SFCO) shows the best crystallinity at T = 600 °C and PO2 = 100 mTorr with brownmillerite structure. One sample was cooled below 50 °C under the same PO2 after the film growth. An overlayer of either SrTiO3 (STO) or Nd0.5Sr0.5MnO3 (NSMO) was deposited on each SFCO sample under the same PLD condition without breaking vacuum. Then, these two samples, i.e. NSMO/SFCO and STO/SFCO, were cooled below 50 °C under the same PO2 after the film growth.In order to exclude other influences during the deposition of the overlayer, the target was rotated and replaced while maintaining the same deposition state after the growth of the SFCO. Only the overlayer deposition induced a phase transition from brownmillerite to perovskite structure. A detailed discussion of phase transitions will be provided later. The deposition time was adjusted to control the thickness of each layer. After depositing individual SFCO, STO, and NSMO thin films, the thickness and deposition rate were determined by the X-ray reflectivity followed by the simulation/fitting analysis. Through the deposition rate obtained through analysis, SFCO was controlled to be eight unit cells in brownmillerite notation, while STO and NSMO were controlled to be four unit cells.
2.2 Characterization
3. Results and discussion
3.1 Crystallographic analyses
To identify the crystal structure, we measured out-of-plane XRD patterns of the samples (Fig. 2a and S2†). In the XRD pattern of as-grown SFCO (navy), diffraction peaks of 00l brownmillerite (BM) are observed with 00l LSAT substrate, indicating strong c-axis orientation of the film. The XRD pattern of STO overlayered SFCO (STO/SFCO, olive) looks similar to that of the as-grown SFCO. The 008BM peak is slightly shifted to a lower angle side. However, in the XRD pattern of NSMO overlayered SFCO (NSMO/SFCO, magenta), 002BM, 006BM and 00![[1 with combining low line]](https://www.rsc.org/images/entities/char_0031_0332.gif)
![[0 with combining low line]](https://www.rsc.org/images/entities/char_0030_0332.gif) BM peaks disappeared, indicating structural transition from brownmillerite to perovskite occurred.
BM peaks disappeared, indicating structural transition from brownmillerite to perovskite occurred.
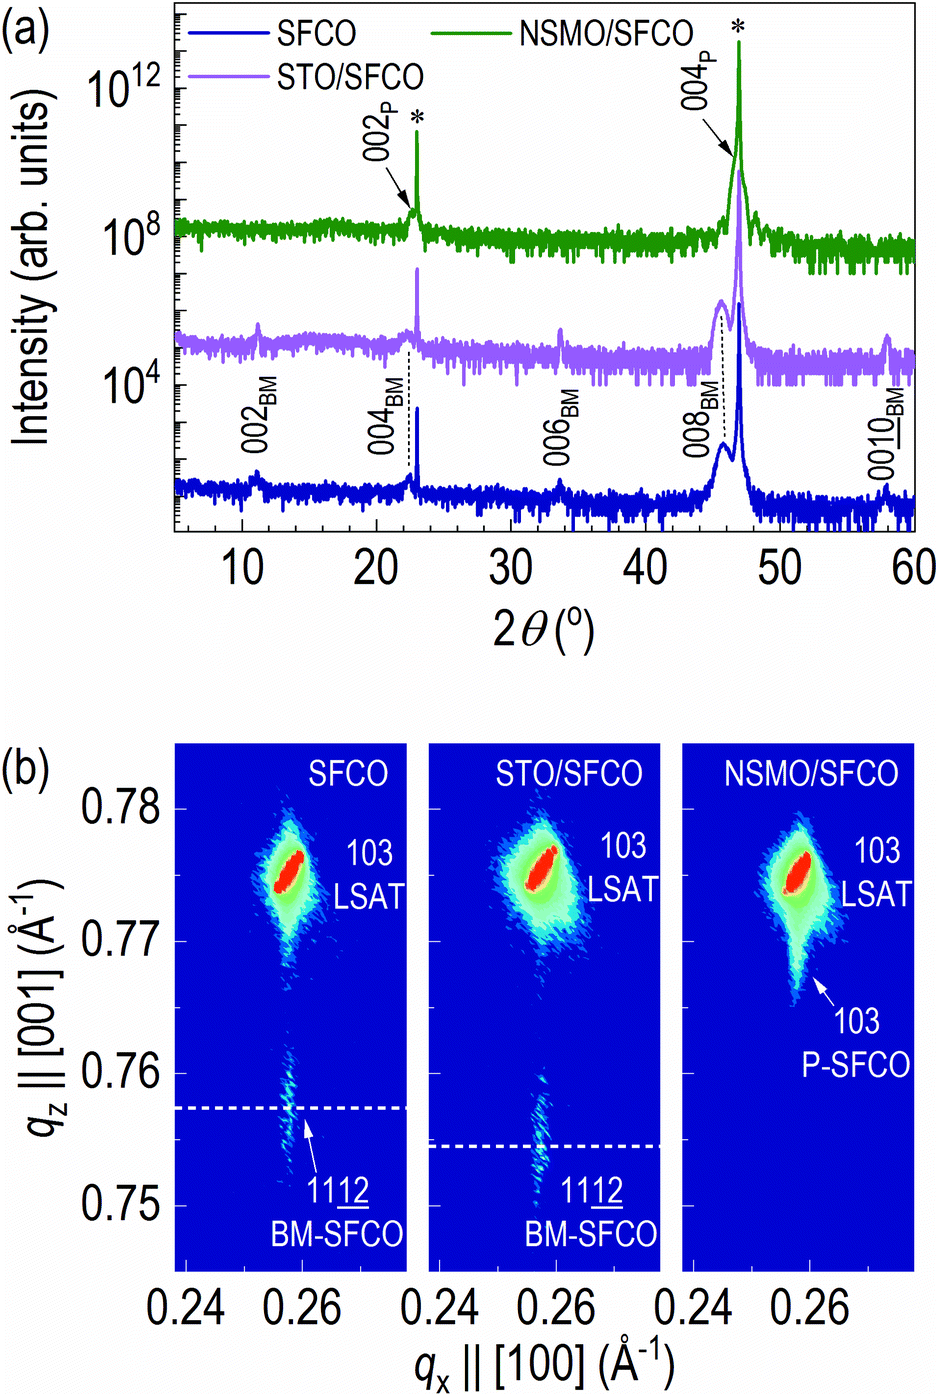 | ||
| Fig. 2 (a) X-ray diffraction patterns of as-grown SFCO, STO/SFCO and NSMO/SFCO. In SFCO and STO/SFCO, the structure of SFCO shows a brownmillerite structure. The NSMO/SFCO showed a perovskite structure when the NSMO was deposited on the SFCO. (b) RSM around the diffraction spot of 103 LSAT. Each sample was grown under strain of LSAT and showed a difference in lattice constant according to the overlayers. | ||
In order to further clarify the structural transition from brownmillerite to perovskite in NSMO/SFCO, reciprocal space mappings (RSMs) of all samples were measured (Fig. 2b). The RSM measurements were performed around the diffraction of 103 LSAT.32 The diffraction spot of SFCO is located at the same qx position (0.258 Å−1), indicating coherent epitaxial growth occurred in all cases. Thus, the in-plane lattice constant is the same as that of LSAT (3.868 Å). The c-axis lattice constant of as-grown SFCO is 3.96 Å while that of the STO overlayered SFCO is 3.97 Å, indicating slight (0.25%) lattice expansion occurred by depositing STO overlayer. On the contrary, the c-axis lattice constant of the NSMO overlayered SFCO decreased to 3.90 Å. Structural analysis via XRD clearly indicates that SFCO is reduced by depositing an STO overlayer, whereas SFCO is oxidized by depositing an NSMO overlayer.
3.2 Valence state
Changes in oxide ion concentration through the overlayer enable not only structural changes but also electronic structural changes in the SFCO. Due to oxide ion movement, XAS was performed to determine the valence state of the transition metals and qualitative oxide ion concentration. Fig. 3 shows the O K edge spectra of SFCO, STO/SFCO and NSMO/SFCO. Additionally, we measured XAS spectra of single layered STO and NSMO thin films to identify the origin of peaks in O K edge spectra from SFCO, STO/SFCO, and NSMO/SFCO. Fig. 3a shows an O K edge spectrum of as-grown SFCO thin film in brownmillerite. As the overlayer changes, the shapes of signals show a clear change. Fig. 3b shows an O K edge spectrum of STO/SFCO. We added XAS spectra from individual SFCO and STO thin films. There is no drastic change in the O K edge spectrum of STO/SFCO. However, peaks that were not present in that of SFCO are clearly seen at 531 and 533 eV in STO/SFCO. From the comparison with that of an STO film, they are mainly contributed from STO. Lastly, in Fig. 3c, a large peak at the pre-edge region of O K edge (vertical black dotted line at about 528 eV) from the spectrum of NSMO/SFCO was observed. The pre-edge peak from O K edge spectra is related to O 2p–TM 3d hybridization, and the intensity is related to the strength of hybridization.33 The peak cannot be explained by the contribution from the O K edge spectrum of Mn–O hybridization, which is indicated by green-colored dotted line. In the XAS of SFCO, the peak at 528 eV is very weak. This means smaller O 2p–TM 3d hybridization in the brownmillerite due to the smaller number of available oxygen atoms around transition metals. On the other hand, in the spectrum of NSMO/SFCO, a large signal is found at around 528 eV, which shows an increase in oxygen content.33,34 A decrease in peak intensity in the O K edge spectrum of STO/SFCO indicates the removal of oxide ions in SFCO. Changes in oxygen ion concentration are shown by comparing the O K edges of each sample. When two complex metal oxides form an interface through overlayer deposition, the oxygen ion concentration changes rather than simply having two layers.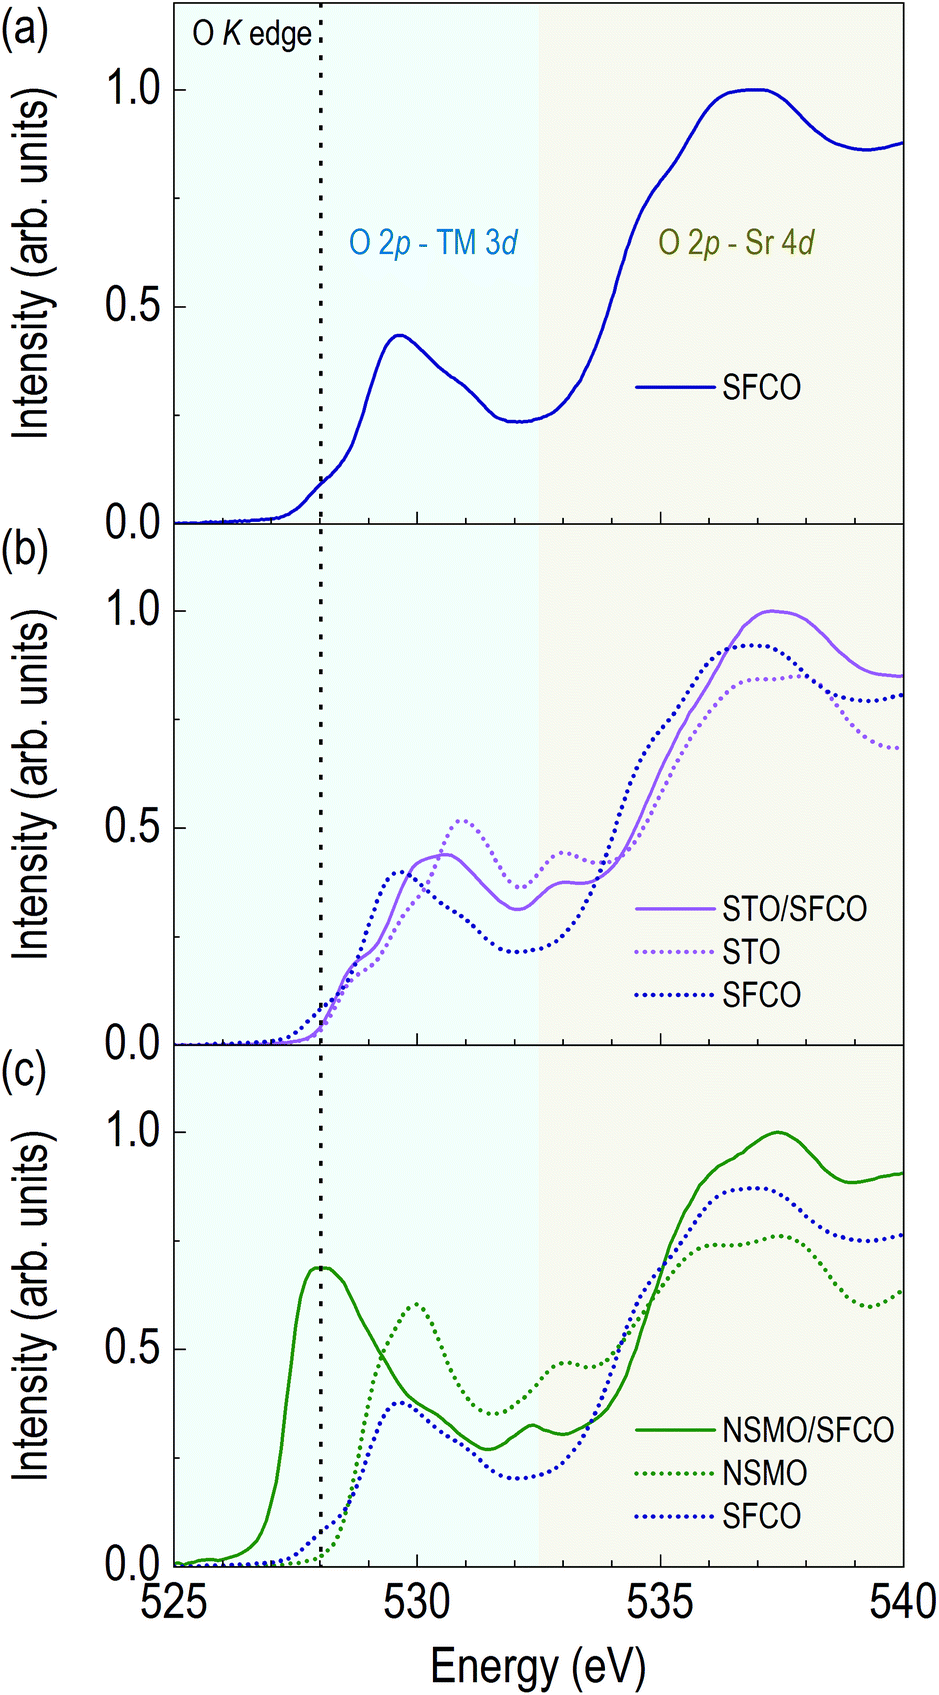 | ||
| Fig. 3 XAS data of the O K edges of (a) as-grown SFCO (navy solid line), (b) STO/SFCO (magenta solid line) and (c) NSMO/SFCO (olive solid line) were performed to track the change in oxide ion according to the overlayer. In order to clarify the change of the O K edge spectrum due to of the overlayer, the O K edge spectra of the SFCO, STO and NSMO are indicated by dotted lines. In NSMO/SFCO, the hybridization of TM 3d–O 2p was increased. | ||
Fig. 4a shows XAS spectra around Fe L edge. The peak position of Fe L3 edge of the SFCO is located at 709.15 eV. The peak of the STO/SFCO is located at 709.20 eV, close to that of the SFCO. However, the peak of the NSMO/SFCO is located at 709.30 eV, where 0.15 eV higher than that of the SFCO. The 0.15 eV difference seen in the NSMO/SFCO suggests an increase in Fe valence state.35–37 It also shows the broadening of the peak in the high energy side of the Fe L2 edge, which means an increase in the Fe4+ state in the Fe valence state.37 In addition, changes in the relative intensities in two peaks at Fe L2 edge can be considered as the increase of Fe valency in the NSMO/SFCO. The shape of the Fe L2 edge is similar to the previously reported SrFeO3.33,35,37 The increase in the peak position through Fe L3 edge and broadening of the peak in the high energy side of the Fe L2 edge show that the NSMO overlayer increases the valence state of Fe.
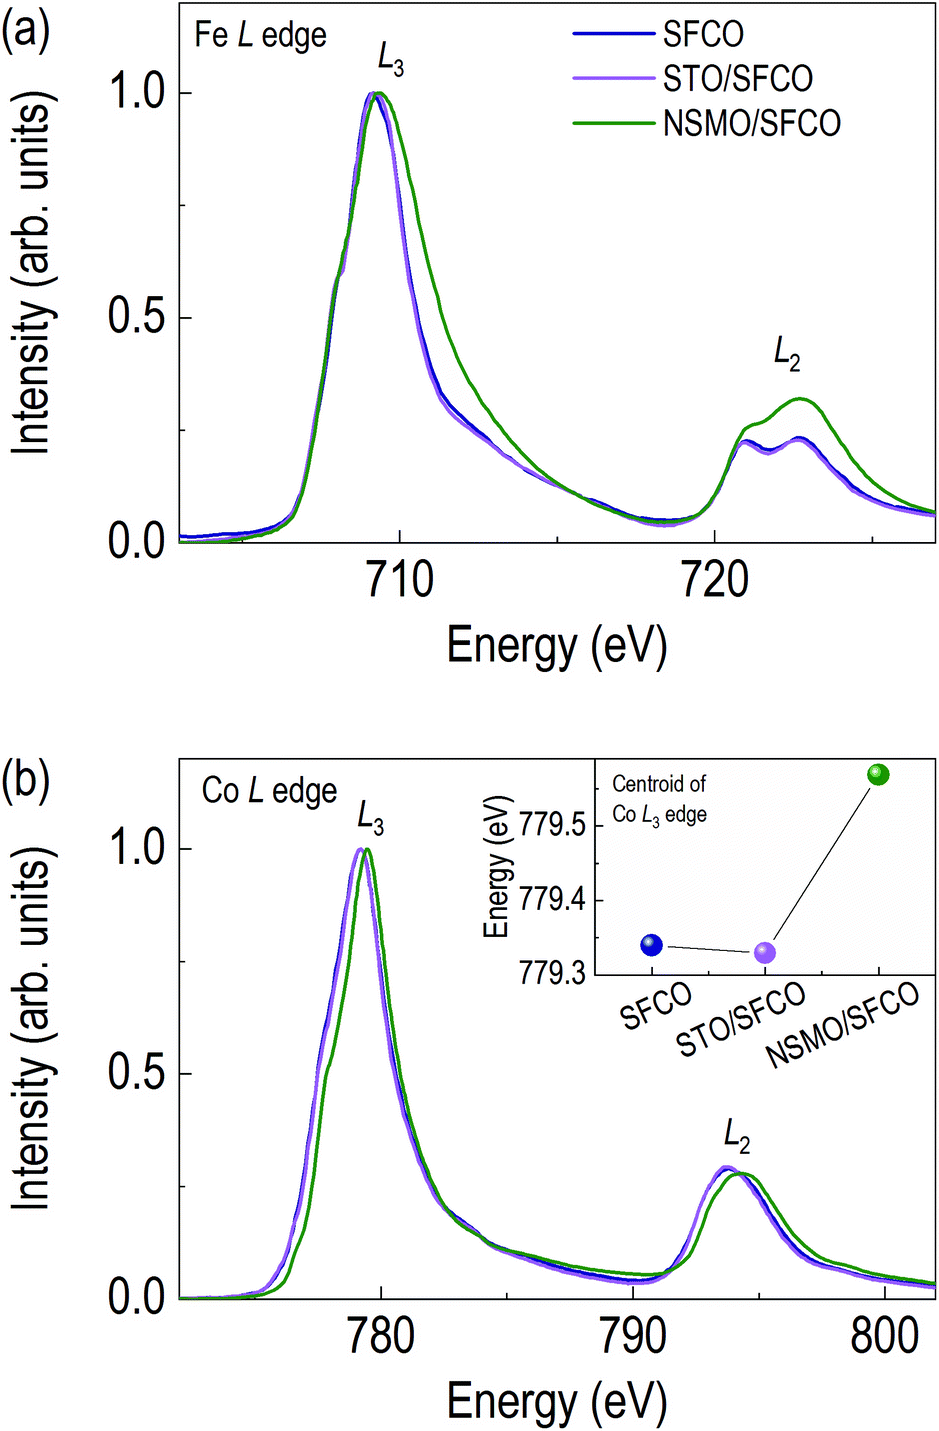 | ||
| Fig. 4 (a) XAS of Fe L edge and (b) Co L edge in SFCO, STO/SFCO and NSMO/SFCO. Fe L edge spectra shows an increase in Fe3+ in NSMO/SFCO. The spectral centroid for comparing the Co L edge are included in the inset of (b). The valence of TM is lowered through the STO overlayer and increased through the NSMO overlayer. | ||
Fig. 4b shows XAS spectra around Co L edge. Oxide ion concentration can be inferred from valence states of TMs. The Co L3 edge of SFCO is located at 779.20 eV. Although there is no difference between the SFCO and STO/SFCO, the Co L3 edge of the NSMO/SFCO locates a higher energy side (779.45 eV), clearly indicating that NSMO overlayer oxidized SFCO. Next, in order to clearly see the differences in the Co L3 edge peak position of SFCO and STO/SFCO in detail, we compared the spectral centroid value of the Co L3 edge (inset of Fig. 4b). The spectral centroid of Co L3 edge of STO/SFCO shows 0.01 eV reduction compared to SFCO, indicating an oxygen reduction of SFCO occurred by depositing STO overlayer, most likely due to STO extracts oxide ion from SFCO.38 From the Co L edge spectra, it can be seen that the STO overlayer reduces SFCO while the NSMO overlayer oxidizes SFCO.
3.3 Magnetism
SFCO system shows change in the magnetic properties from antiferromagnetic to ferromagnetic upon structural transition from brownmillerite to perovskite.13,39–41 We measured the magnetic properties at low temperatures (Fig. 5). The M–T curve of the NSMO/SFCO shows a clear upturn around 160 K (Fig. 5a), indicating ferromagnetic properties, though the SFCO and the STO/SFCO do not show any phase transition in the range of temperature we measured.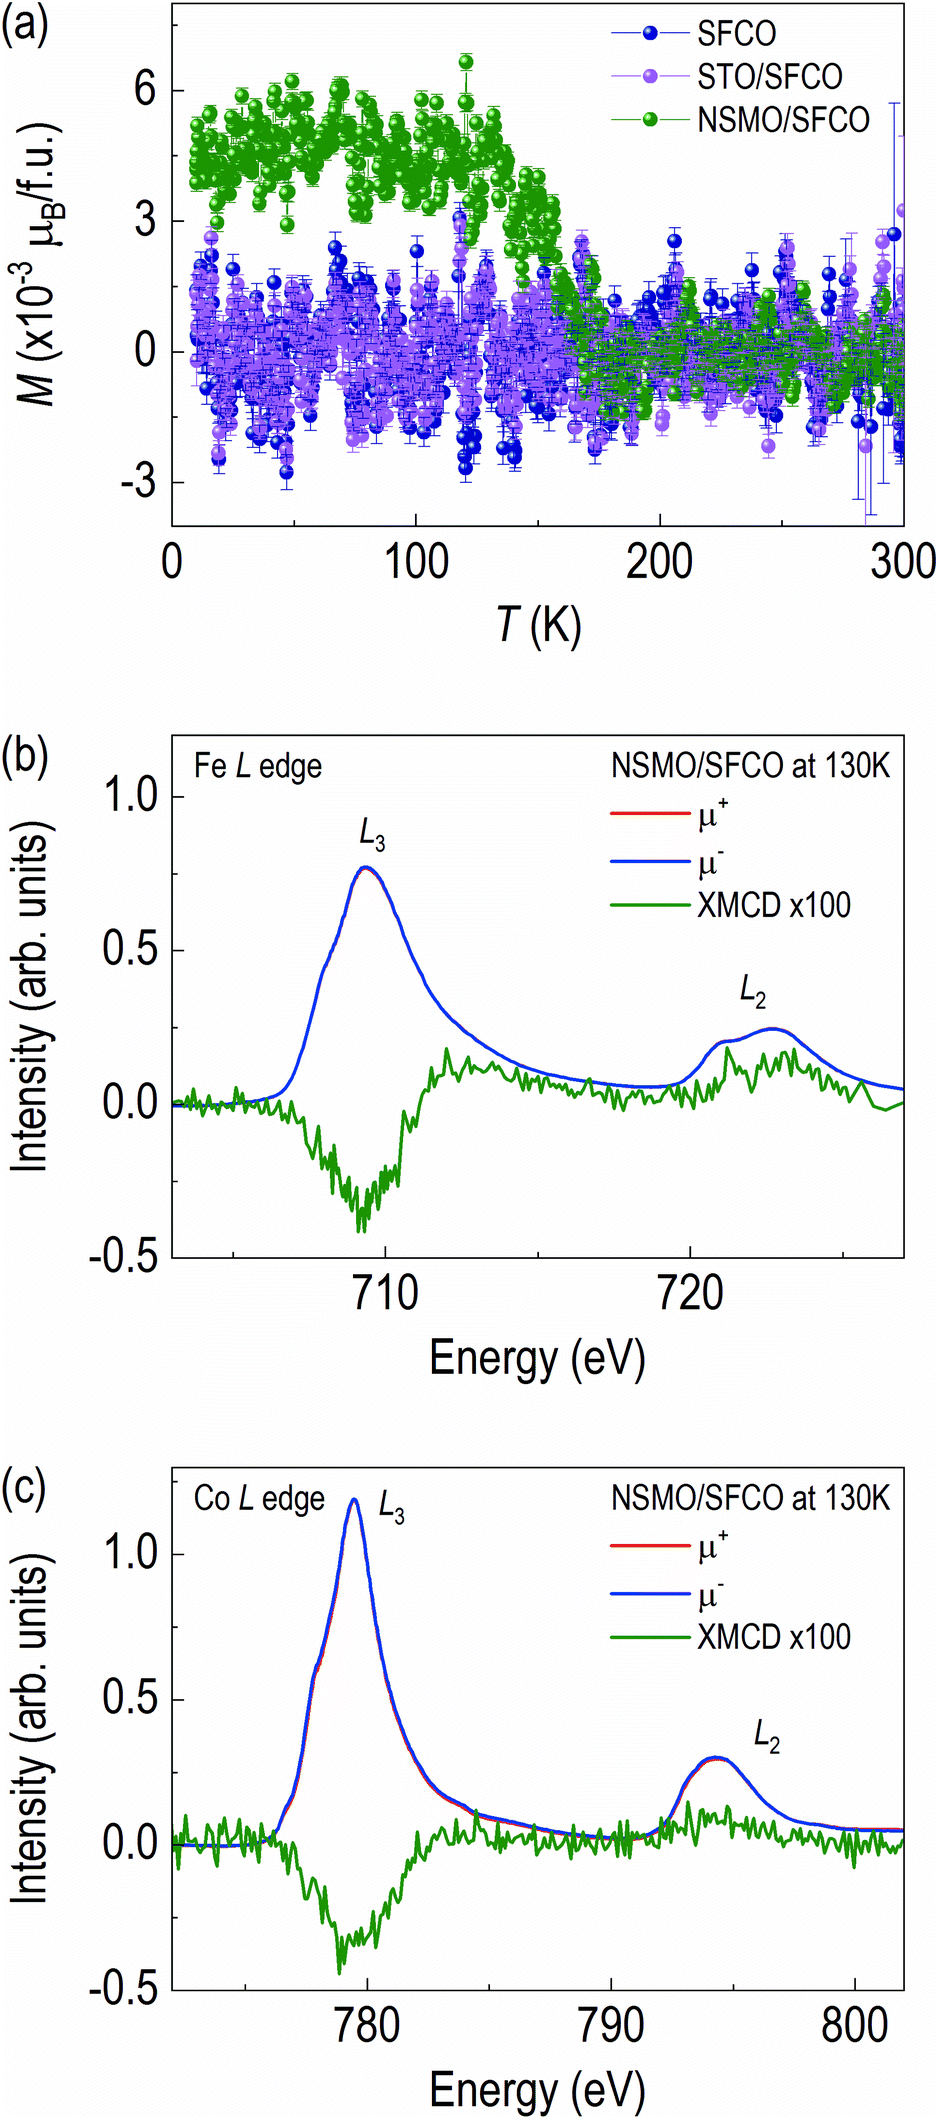 | ||
| Fig. 5 (a) Magnetization vs. temperature graph of SFCO, STO/SFCO, and NSMO/SFCO. NSMO/SFCO shows ferromagnetism below 160 K. To find the origin of the ferromagnetism of NSMO/SFCO, element-specific XMCD of (b) Fe and (c) Co L edges was measured. | ||
Since the noise level of the M–T curves is quite large, we further measured grazing angle XMCD spectra at 130 K with 0.5 T (Fig. 5b and c) to confirm the ferromagnetism of the NSMO/SFCO. Ferromagnetic XMCD signals from Fe L edge and Co L edge are clearly seen. Note we also measured XMCD of Mn L edge and O K edge, however no XMCD signals were detected (Fig. S3†). The XMCD features of Fe L edge and Co L edge are similar in shape, meaning spin polarization direction are parallel. The signals from Fe L edge and Co L edge clearly demonstrate that the NSMO/SFCO shows weak ferromagnetism.
3.4 Discussion
Here we would like to discuss the mechanism of the reduction/oxidation of SFCOs by the overlayer deposition. We focused on the oxygen vacancy formation energy (EOV) because EOV represents the energy required to form oxygen vacancy. EOV of NSMO is 1.78 eV (ref. 42) while that of STO is 5.54 eV (ref. 43 and 44). STO is known as an oxide ion getter material that extracts oxide ions from SFCO.38 Although there is no data of EOV for SFCO, we assumed the EOV of SFCO is 2.95 eV because the EOV of SrCoO2.5 is 2.90 eV (ref. 45) and that of SrFeO2.5 is 3.00 eV (ref. 46). EOV(SFCO) − EOV(NSMO) is ∼+1.17 eV and EOV(SFCO) − EOV(STO) is ∼−2.59 eV. Thus, oxide ions in NSMO are removed by SFCO while STO removes oxide ions from SFCO. Therefore, the oxide ion concentration in SFCO is changed during the overlayer growth due to oxidation or reduction originated from the difference in the chemical potential. By growing an overlayer on the interface of a complex oxide material, new possibilities for catalytic activity or ion-driven technology can be presented.47,484. Conclusions
In conclusion, selective deposition of an overlayer on the SFCO oxygen sponge can control the oxide ion concentration. We fabricated SFCOs followed by the deposition of two kinds of complex oxides (STO, NSMO) under exactly the same growth condition. Oxide ion movement through the heterointerface between overlayer/SFCO was tracked by the observation of the changes in the crystal structure, valence state, and magnetic ground state. The crystal structure of SFCO changed from brownmillerite to perovskite when NSMO was deposited as the overlayer while brownmillerite structure was kept when STO was deposited. We showed spectroscopic evidence of redox activity through bilayer interfaces, which supported by the energy difference. Due to the difference in EOVs, oxygen vacancies in SFCO are easily generated in STO/SFCO (ΔEOV ∼ −2.59 eV), while oxygen absorption from NSMO occurs in NSMO/SFCO (ΔEOV ∼ 1.17 eV). Further, the NSMO/SFCO showed weak ferromagnetism. From these observations, the oxide ion concentration in SFCO is changed during the overlayer growth due to oxidation or reduction originated from the difference in the chemical potential. The present results might be useful to design advanced ionic devices using TM-based perovskite oxides.Conflicts of interest
There are no conflicts to declare.Acknowledgements
This research was supported by global research exchange project, PNU-RENovation (2020–2021).References
- D. I. Khomskii and G. A. Sawatzky, Catal. Lett., 1997, 102, 87 CAS.
- E. Dagotto, Science, 2005, 309, 257 CrossRef CAS PubMed.
- J. B. Torrance, P. Lacorre, A. I. Nazzal, E. J. Ansaldo and C. Niedermayer, Phys. Rev. B: Condens. Matter Mater. Phys., 1992, 45, 8209 CrossRef CAS PubMed.
- H. Y. Hwang, S. W. Cheong, P. G. Radaelli, M. Marezio and B. Batlogg, Phys. Rev. Lett., 1995, 75, 914 CrossRef CAS PubMed.
- Y. Moritomo, Y. Tomioka, A. Asamitsu, Y. Tokura and Y. Matsui, Phys. Rev. B: Condens. Matter Mater. Phys., 1995, 51, 3297 CrossRef CAS PubMed.
- C. Leighton, Nat. Mater., 2019, 18, 13 CrossRef CAS PubMed.
- D. G. Schlom, L. Q. Chen, C. B. Eom, K. M. Rabe, S. K. Streiffer and J. M. Triscone, Annu. Rev. Mater. Res., 2007, 37, 589 CrossRef CAS.
- J. J. Yang, M. D. Pickett, X. M. Li, D. A. A. Ohlberg, D. R. Stewart and R. S. Williams, Nat. Nanotechnol., 2008, 3, 429 CrossRef CAS PubMed.
- R. Waser, R. Dittmann, G. Staikov and K. Szot, Adv. Mater., 2009, 21, 2632 CrossRef CAS.
- U. Bauer, L. Yao, A. J. Tan, P. Agrawal, S. Emori, H. L. Tuller, S. van Dijken and G. S. D. Beach, Nat. Mater., 2015, 14, 174 CrossRef CAS PubMed.
- D. A. Gilbert, J. Olamit, R. K. Dumas, B. J. Kirby, A. J. Grutter, B. B. Maranville, E. Arenholz, J. A. Borchers and K. Liu, Nat. Commun., 2016, 7, 11050 CrossRef CAS PubMed.
- Q. Y. Lu and B. Yildiz, Nano Lett., 2016, 16, 1186 CrossRef CAS PubMed.
- H. Jeen, W. S. Choi, M. D. Biegalski, C. M. Folkman, I. C. Tung, D. D. Fong, J. W. Freeland, D. Shin, H. Ohta, M. F. Chisholm and H. N. Lee, Nat. Mater., 2013, 12, 1057 CrossRef CAS PubMed.
- J. Gazquez, S. Bose, M. Sharma, M. A. Torija, S. J. Pennycook, C. Leighton and M. Varela, APL Mater., 2013, 1, 012105 CrossRef.
- A. P. Ramirez, J. Phys.: Condens. Matter, 1997, 9, 8171 CrossRef CAS.
- J. H. Park, E. Vescovo, H. J. Kim, C. Kwon, R. Ramesh and T. Venkatesan, Nature, 1998, 392, 794 CrossRef CAS.
- Y. M. Kim, J. He, M. D. Biegalski, H. Ambaye, V. Lauter, H. M. Christen, S. T. Pantelides, S. J. Pennycook, S. V. Kalinin and A. Y. Borisevich, Nat. Mater., 2012, 11, 888 CrossRef CAS PubMed.
- G. A. Niklasson and C. G. Granqvist, J. Mater. Chem., 2007, 17, 127 RSC.
- U. Guth, W. Vonau and J. Zosel, Meas. Sci. Technol., 2009, 20, 042002 CrossRef.
- P. Calka, M. Sowinska, T. Bertaud, D. Walczyk, J. Dabrowski, P. Zaumseil, C. Walczyk, A. Gloskovskii, X. Cartoixa, J. Sune and T. Schroeder, ACS Appl. Mater. Interfaces, 2014, 6, 5056 CrossRef CAS PubMed.
- X. L. Xu, H. Zhang, Z. C. Zhong, R. R. Zhang, L. H. Yin, Y. P. Sun, H. L. Huang, Y. L. Lu, Y. Lu, C. Zhou, Z. W. Ma, L. Shen, J. S. Wang, J. D. Guo, J. R. Sun and Z. G. Sheng, ACS Appl. Mater. Interfaces, 2020, 12, 31645 CrossRef CAS PubMed.
- M. Nord, P. E. Vullum, M. Moreau, J. E. Boschker, S. M. Selbach, R. Holmestad and T. Tybell, Appl. Phys. Lett., 2015, 106, 041604 CrossRef.
- E. J. Guo, Y. H. Liu, C. Sohn, R. D. Desautels, A. Herklotz, Z. L. Liao, J. Nichols, J. W. Freeland, M. R. Fitzsimmons and H. N. Lee, Adv. Mater., 2018, 30, 1705904 CrossRef PubMed.
- J. S. Hong, A. N. Aphale, S. J. Heo, B. X. Hu, M. Reisert, S. Belko and P. Singh, ACS Appl. Mater. Interfaces, 2019, 11, 34878 CrossRef CAS PubMed.
- D. Lee, Y. L. Lee, A. Grimaud, W. T. Hong, M. D. Biegalski, D. Morgan and Y. Shao-Horn, J. Phys. Chem. C, 2014, 118, 14326 CrossRef CAS.
- W. S. Choi, H. Jeen, J. H. Lee, S. S. A. Seo, V. R. Cooper, K. M. Rabe and H. N. Lee, Phys. Rev. Lett., 2013, 111, 097401 CrossRef PubMed.
- Q. Yang, H. J. Cho, H. Jeen and H. Ohta, J. Appl. Phys., 2021, 129, 215303 CrossRef CAS.
- Q. Yang, H. J. Cho, H. Jeen and H. Ohta, Adv. Mater. Interfaces, 2019, 6, 1901260 CrossRef CAS.
- N. P. Lu, P. F. Zhang, Q. H. Zhang, R. M. Qiao, Q. He, H. B. Li, Y. J. Wang, J. W. Guo, D. Zhang, Z. Duan, Z. L. Li, M. Wang, S. Z. Yang, M. Z. Yan, E. Arenholz, S. Y. Zhou, W. L. Yang, L. Gu, C. W. Nan, J. Wu, Y. Tokura and P. Yu, Nature, 2017, 546, 124 CrossRef CAS PubMed.
- J. Lee, E. Ahn, Y. S. Seo, Y. Kim, T. Y. Jeon, J. Cho, I. Lee and H. Jeen, Phys. Rev. Appl., 2018, 10, 054035 CrossRef CAS.
- P. D. Battle, T. C. Gibb and P. Lightfoot, J. Solid State Chem., 1988, 76, 334 CrossRef CAS.
- A. Khare, J. Lee, J. Park, G. Y. Kim, S. Y. Choi, T. Katase, S. Roh, T. S. Yoo, J. Hwang, H. Ohta, J. Son and W. S. Choi, ACS Appl. Mater. Interfaces, 2018, 10, 4831 CrossRef CAS PubMed.
- V. R. Galakhov, E. Z. Kurmaev, K. Kuepper, M. Neumann, J. A. McLeod, A. Moewes, I. A. Leonidov and V. L. Kozhevnikov, J. Phys. Chem. C, 2010, 114, 5154 CrossRef CAS.
- L. Karvonen, M. Valkeapaa, R. S. Liu, J. M. Chen, H. Yamauchi and M. Karppinen, Chem. Mater., 2010, 22, 70 CrossRef CAS.
- M. Abbate, G. Zampieri, J. Okamoto, A. Fujimori, S. Kawasaki and M. Takano, Phys. Rev. B: Condens. Matter Mater. Phys., 2002, 65, 165120 CrossRef.
- A. Koehl, D. Kajewski, J. Kubacki, C. Lenser, R. Dittmann, P. Meuffels, K. Szot, R. Waser and J. Szade, Phys. Chem. Chem. Phys., 2013, 15, 8311 RSC.
- M. Abbate, F. M. F. de Groot, J. C. Fuggle, A. Fujimori, O. Strebel, F. Lopez, M. Domke, G. Kaindl, G. A. Sawatzky, M. Takano, Y. Takeda, H. Eisaki and S. Uchida, Phys. Rev. B: Condens. Matter Mater. Phys., 1992, 46, 4511 CrossRef CAS PubMed.
- J. D. Ferguson, Y. Kim, L. F. Kourkoutis, A. Vodnick, A. R. Woll, D. A. Muller and J. D. Brock, Adv. Mater., 2011, 23, 1226 CrossRef CAS PubMed.
- Y. Tsujimoto, C. Tassel, N. Hayashi, T. Watanabe, H. Kageyama, K. Yoshimura, M. Takano, M. Ceretti, C. Ritter and W. Paulus, Nature, 2007, 450, 1062 CrossRef CAS PubMed.
- S. Srinath, M. M. Kumar, K. Sahner, M. L. Post, M. Wickles, R. Moos and H. Srikanth, J. Appl. Phys., 2006, 99, 08S904 CrossRef.
- A. Munoz, C. de la Calle, J. A. Alonso, P. M. Botta, V. Pardo, D. Baldomir and J. Rivas, Phys. Rev. B: Condens. Matter Mater. Phys., 2008, 78, 054404 CrossRef.
- Y. Zhou, Z. Lu, S. Xu, D. Xu and Z. Yang, Fuel Cells, 2015, 15, 839 CrossRef CAS.
- L. P. Zhang, B. Liu, H. L. Zhuang, P. R. C. Kent, V. R. Cooper, P. Ganesh and H. X. Xu, Comput. Mater. Sci., 2016, 118, 309 CrossRef CAS.
- R. Astala and P. D. Bristowe, Modell. Simul. Mater. Sci. Eng., 2001, 9, 415 CrossRef CAS.
- Y. U. Shi, R. J. Xie, X. T. Liu, N. A. Zhang, C. Aruta and N. Yang, Phys. Chem. Chem. Phys., 2019, 21, 16230 RSC.
- T. Das, J. D. Nicholas and Y. Qi, J. Mater. Chem. A, 2017, 5, 4493 RSC.
- M. Minakshi, N. Sharma, D. Ralph, D. Appadoo and K. Nallathamby, Electrochem. Solid-State Lett., 2011, 14, A86 CrossRef CAS.
- M. M. Sundaram, T. Watcharatharapong, S. Chakraborty, R. Ahuja, S. Duraisamy, P. T. Rao and N. Munichandraiah, Dalton Trans., 2015, 44, 20108 RSC.
Footnote |
| † Electronic supplementary information (ESI) available. See DOI: 10.1039/d1ra06378b |
| This journal is © The Royal Society of Chemistry 2021 |