 Open Access Article
Sensitive and effective imaging of carbon monoxide in living systems with a near-infrared fluorescent probe†
Zhencai Xu *a,
Aibo Songa,
Fangwu Wangc and
Hongwei Chen*b
aGuanyun People's Hospital, Lianyungang, 222000, China. E-mail: XU2454287273@163.com; 2540353599@qq.com
bModern Education Technology Center, Hainan Medical University, Haikou 571199, China. E-mail: chenhongwei@hainmc.edu.cn
cDepartment of Otolaryngology, Head and Neck Surgery, The First Affiliated Hospital of Hainan Medical University, Haikou 570102, China. E-mail: 183544434@qq.com
First published on 30th September 2021
Abstract
CO, a gas molecule that is harmful to living organisms, has a high affinity with hemoglobin, which will cause severe hypoxia. However, in recent years, researchers have discovered that endogenous CO, similar to NO, is one of the messenger molecules, which has a certain regulatory effect in many physiological and pathological processes in the respiratory system, cardiovascular system, and nervous system. Therefore, it is urgent to explore an effective method to monitor the role of CO under physiological and pathological conditions. Herein, we designed and synthesized a near-infrared small-molecule fluorescent probe for the detection of CO in living cells. In this design, a two-site BODIPY dye was introduced as the fluorophore, and the allyl chloroformate part as the CO reactive group. The probe displays excellent sensitivity, selectivity, and a good linear relationship to CO. Furthermore, it shows good biocompatibility and low cytotoxicity. This probe has been successfully applied to the detection of CO in a variety of cells. The developed fluorescent probe can serve as a potential molecular imaging tool for in vivo imaging and detection of CO.
1. Introduction
Nitric oxide (NO), carbon monoxide (CO) and hydrogen sulfide (H2S) are generally considered to be the most important gas signal molecules in living systems. CO, a steady-state molecule, can exert significant cytoprotection, signal transduction and inflammation reduction functions in organisms.1–3 The endogenous CO is produced by heme oxygenase (HO-1) catalyzed heme catabolism.4 The level of CO in mammals is essential for certain serious diseases, such as cardiovascular disease, lung disease, sepsis and cancer.5–8 Thus, it is necessary to develop an effective method for the detection of CO in biological systems in order to understand its role in the physiological or pathological processes.As a transient gas molecule, CO is generally difficult to capture. In recent decades, several analytical methods of quantitative analysis of CO have been established, including colorimetric measurement, electrochemical analysis, chromatography, etc.9–11 Although these methods are proposed, these technologies are time-consuming or expensive, and cannot monitor the analytes in real time. Fluorescence imaging technology has become a reliable method for real-time monitoring molecular events in vivo due to its non-destructive feature and high temporal and spatial resolution.12–16 However, development of fluorescent probes for monitoring CO at the cellular level still remains challenging.17–19 The He group and Chang group developed fluorescent probes for the detection of CO,20 which has deepened researchers' understanding of the mechanism of CO in biological events. Soon thereafter, a large number of small molecule fluorescent probes for CO detection continued to emerge.21–24 For example, Feng's group is committed to developing a series of small molecule fluorescent probes for CO detection, which can be used to detect CO in living cells and animals.25,26 However, these probes have more or less certain disadvantages, such as poor sensitivity to CO,27,28 or the need to use high concentrations of organic solvents,29 or a shorter emission wavelength.30,31 Therefore, development of new fluorescent probes with improved properties and capable of tracking CO in living cells is highly desired.
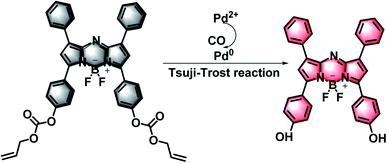
In this study, with the purpose of verifying the dynamic changes of CO under oxidative stress, a NIR fluorescent probe was designed and synthesized, which was capable of imaging the CO content in cells. The probe was composed of a BODIPY-based fluorophore and an allyl chloroformate unit (Fig. S1†). We chose BODIPY, a representative type of near-infrared (NIR) fluorescent dye, as the fluorescence signal unit. Compare with traditional fluorescent dyes such as fluorescein, rhodamine, cyanides and rare earth complexes, BODIPY has a high fluorescence quantum yield, high molar extinction coefficient and good light stability.32,33 Furthermore, it could keep stable under complex conditions. The strategy of probe design relies on that CO can easily reduce Pd2+ to Pd0 in situ, and then easily remove allyl chloroformate through the Tsuji–Trost reaction mediated by Pd0, thereby producing a clear fluorescence signal at 745 nm (Scheme 1).24,29 Importantly, our studies showed that this probe system had the following merits: (1) the probe has a longer emission wavelength, which enables the weakest background fluorescence signal and enables us to obtain clear fluorescence images; (2) due to the excellent optical properties of BODIPY, the probe possesses fabulous pH stability; (3) in complex biological systems, it meets the requirements for the sensitivity and selectivity of CO detection; (4) the probe can quickly detect the changes of exogenous CO in the cell and monitor the CO under oxidative stress conditions. Therefore, we forecast that the probe may have great potential in clinical applications.
2. Experimental section
2.1 General comments
Benzaldehyde, p-hydroxyacetophenone, diethylamine, nitromethane, ammonium acetate diisopropylethylamine, boron trifluoride-diethyl ether, allyl chloroformate, NaOH, Tween-80, PdCl2 and CORM-3 were purchased from Aladdin. Commercial dyes and CCK-8 are from Thermo Fisher Scientific. Unless otherwise stated, all other chemicals are from commercial sources and are analytical reagent grade. All experiments always use ultrapure water.Performed on silica gel plate TLC. Hitachi U-2910 for UV absorption spectroscopy experiments. Fluorescence spectroscopy experiments were performed on Hitachi F4600 fluorescence spectrophotometer. 1H NMR and 13C NMR were obtained from BrukerAM 400 MHz and 100 MHz spectrometers, respectively. HR-MS data is obtained by Agilent 1290 infinity 6540 UHD accurate quality Q-TOF MS (Agilent, USA). The laser scanning confocal microscope (Olympus FV1000) uses a 60-fold objective lens to obtain cell fluorescence images. The images are collected and used Olympus FV10-ASW Ver.2.1 b software for processing. FBS, DMEM and PBS were purchased from Gibco, USA. All kinds of cell line were purchased from the Typical Culture Collection Committee of the Chinese Academy of Sciences (Shanghai, China). The probe (10 mg) was dissolved in deuterated chloroform (0.5 mL) and used for 1H NMR, 13C NMR, HR-MS to characterize its structure.
2.2 The cytotoxicity test of the probe
FaDu cells were placed in MEM with 10% FBS, HeLa, PC12, RAW 264.7 and A549 cells were placed in DMEM with 10% FBS, cultured at 37 °C in 5% CO2 and 95% air. Five kinds of cells (8000 cells per well) were respectively seeded into 96-well plates, and adherent culture for 24 h. Subsequently, the cells were incubated with 0.001, 10, 20, 30, 40, 50, 60, 70, 80 and 100 μM (final concentration) probes (dissolved in DMSO) at 37 °C in 5% CO2 and 95% air at 24 h, under the same conditions as the control, untreated DMEM was also tested. Add CCK-8 solution (5.0 mg mL−1, 10 μL) to each well. Then the plate was incubated in 5% CO2 and 95% air for 1 h, and then the absorbance was measured at 750 nm using TECAN infinite M200pro.2.3 Cell imaging experiment
Fluorescence images were collected on the Olympus FV1000 confocal laser scanning microscope. The cells were plated in a confocal Petri dish and cultured adherently for 24 h. Before imaging, rinse the confocal Petri dish three times with 1 mL PBS, and then the probe (10 μL, 1.0 mM) was added. After different treatments, the cells were washed three times with PBS, and then the cells were imaged.2.4 Preparation of cell hypoxia model
Inoculate RAW 264.7 cells at a density of 105 mL−1 in 96-well plates (100 μL per well), and according to hypoxia time 10 min, 30 min, 1 h, 3 h, 6 h, 12 h, 24 h, 36 h, 48 h and 72 h were randomly divided into 11 groups. After the cells are fully attached, the hypoxic group cells are placed in a transparent glass box, and then the glass box is placed in a 37 °C incubator for culture, and then pass 5% CO2, 1% O2 and 94% N2 gas cylinders into the glass box, set the gas outlet, and continue to mix the gas. The hypoxia treatment was 10 min, 30 min, 1 h, 3 h, 6 h, 12 h, 24 h, 36 h, 48 h and 72 h. The normal experimental group was continuously cultured in an ordinary incubator containing 5% CO2 at 37 °C.3. Results and discussion
3.1 Design and synthesis of the probe
The synthetic steps of compound 1–4 are detailed in the ESI (Fig. S1†). Under an Ar atmosphere, compound 4 (99.7 mg, 0.1 mmol) and triethylamine (30 μL, 0.21 mmol) were added to a round bottom flask containing 50 mL of dichloromethane. The allyl chloroformate was slowly added (16.3 μL, 0.2 mmol) into the mixed solution at 0 °C, and then further stirred at 25 °C for 6 h. After the solvent was removed under reduced pressure, the obtained product was purified by silica gel chromatography (200–300 mesh) with gradient eluents CH2Cl2 and CH3OH (100![[thin space (1/6-em)]](https://www.rsc.org/images/entities/char_2009.gif) :
:![[thin space (1/6-em)]](https://www.rsc.org/images/entities/char_2009.gif) 1 to 5
1 to 5![[thin space (1/6-em)]](https://www.rsc.org/images/entities/char_2009.gif) :
:![[thin space (1/6-em)]](https://www.rsc.org/images/entities/char_2009.gif) 1, v/v). The target compound 5 (39.91 mg, yield: 38%) was obtained. 1H NMR (400 MHz, CDCl3) δ (ppm): 8.09–8.02 (m, 7H), 7.46–7.41 (m, 6H), 7.34–7.31 (d, 4H), 7.00 (s, 2H), 6.06–5.95 (m, 2H), 5.47–5.43 (dd, 2H), 5.36–5.34 (dd, 2H), 4.77–4.76 (d, 4H). 13C NMR (100 MHz, CDCl3) δ (ppm): 158.35, 152.99, 152.92, 145.66, 144.34, 132.16, 131.16, 131.01, 129.66, 129.42, 129.25, 128.67, 121.29, 119.81, 119.09, 69.41. HR-MS: m/z C40H30BF2N3O6, calcd, 697.2196; found [M + Na]+, 720.2160.
1, v/v). The target compound 5 (39.91 mg, yield: 38%) was obtained. 1H NMR (400 MHz, CDCl3) δ (ppm): 8.09–8.02 (m, 7H), 7.46–7.41 (m, 6H), 7.34–7.31 (d, 4H), 7.00 (s, 2H), 6.06–5.95 (m, 2H), 5.47–5.43 (dd, 2H), 5.36–5.34 (dd, 2H), 4.77–4.76 (d, 4H). 13C NMR (100 MHz, CDCl3) δ (ppm): 158.35, 152.99, 152.92, 145.66, 144.34, 132.16, 131.16, 131.01, 129.66, 129.42, 129.25, 128.67, 121.29, 119.81, 119.09, 69.41. HR-MS: m/z C40H30BF2N3O6, calcd, 697.2196; found [M + Na]+, 720.2160.
3.2 The influence of Tween-80 on the fluorescence intensity of the probe
Due to the relatively complex environment in living systems, it is easy to quench the fluorescence of BODIPY dyes. Polyoxyethylene sorbitan monooleate (Tween-80) is a common nonionic surfactant, which can effectively avoid the quenching of fluorescent dyes after forming surfactant micelles. Therefore, Tween-80 was used to simulate physiological conditions during the experiment. Firstly, the effect of Tween-80 concentration (0%, 0.1%, 0.2%, 0.3%, 0.4%, 0.5%, 0.6%, 0.8% and 1.0%) on the fluorescence intensity of the probe (10 μM, 0.5% DMSO, 0.5% Tween-80) was tested. As shown in Fig. S3,† the fluorescence intensity increased slowly with the concentration of Tween-80 ranging from 0.0% and 0.4%. While the concentration was ranging from 0.5% and 1.0%, the fluorescence intensity reached a platform and remained stable. Therefore, 0.5% Tween-80 was selected as the experimental condition in the following experiment.3.3 Spectral properties of the probe
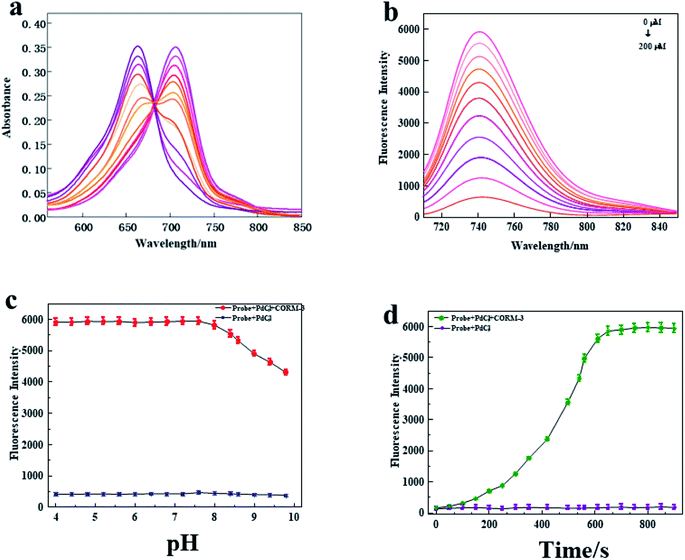
Subsequently, we explored the spectral characteristics of the probe. The absorption and fluorescence emission spectra were respectively evaluated under the simulated physiological conditions of HEPES (pH 7.4, 10 mM, 0.5% Tween-80) at 37 °C. As shown in Fig. 1a, the probe (10 μM + 10 μM PdCl2) displayed a strong absorption peak at 655 nm. However, a new absorption peak appeared at 710 nm with the addition of CORM-3, which indicated that a new substance was formed by the reaction to CO. Furthermore, as the concentration of CORM-3 increased, the absorption at 655 nm gradually decreased, and the absorption at 710 nm gradually increased. Next, we studied the fluorescence spectrum of the probe. As shown in Fig. 1b, the probe (10 μM + 10 μM PdCl2) displayed a weaker fluorescence intensity, while the fluorescence intensity of the probe increased at 745 nm as the concentration of CORM-3 increased. In addition, it was found that there was a satisfactory linear response relationship between the fluorescence intensity of the probe (10 μM + 10 μM PdCl2) and CORM-3 (200 μM) (Fig. S4†). The linear fitting equation is F745 nm = 31.021 [CO] + 399.18, and the correlation coefficient (R2) is 0.9956. Based on the standard method of 3σ/k, the detection limit of CO was calculated to be 45 nM. Because CO has the disadvantages of poor stability and rapid metabolism in biological systems, the reaction kinetics of the probe system (10 μM + 10 μM PdCl2) to CO was evaluated in HEPES buffer solution (pH 7.4, 0.5% DMSO, 0.5% Tween-80). As shown in Fig. 1d, after the addition of CORM-3 (200 μM), the fluorescence intensity of the probe reached its peak at 600 s and remained relatively stable, which indicated that the proposed probe could be responded to CO. Later, we studied whether pH affects the change of probe fluorescence intensity. As shown in Fig. 1c, in the studied pH range (4.0–10.0), the probe displayed a weak fluorescence signal. After adding a certain amount of CORM-3, the probe displayed obvious fluorescence intensity under weak acid and neutral conditions. However, with the increase of alkalinity, the fluorescence intensity gradually weakened. These results indicated that the probe could be suitable for detecting CO content under physiological conditions.3.4 The selectivity of the probe to biologically relevant interferences
Whether it has high selectivity is also one of the criteria for evaluating an excellent probe. Subsequently, we studied whether the probe can specifically detect CO. Organisms are rich in biological mercaptans, such as GSH, with concentrations as high as millimolar. We first tested some representative species such as amino acids, anions, and cations. As expected, after adding these candidates, the fluorescence intensity of the probe showed negligible change, indicating that the probe was negative for these substances. ROS and RNS in cells can explode when inflammations or cancers occur. These substances generally have strong oxidizing properties. We tested several common active substances and gases in the following experiments. We found that only CO could cause a significant change in the fluorescence intensity, and the addition of other substances basically kept the fluorescence intensity of the probe unchanged (Fig. S5†). All the above selective experimental results clearly prove that the probe has a certain feasibility for rapid detection of CO with high-sensitivity and selectivity under physiological conditions.3.5 Cytotoxicity test of the probe
Next, through CCK-8 cell proliferation experiments, this study tested the effects of different probe concentrations on cell viability. The kit was utilized to test the cytotoxicity of probes with increasing concentrations (0.001, 10, 20, 30, 40, 50, 60, 70, 80, 90, 100 μM).Encouraged by the above experimental results, we tried to apply it to living cells for the detection of CO levels. First, we used the CCK-8 kit to perform toxicity tests on five different cells human pharyngeal squamous cell line (FaDu), human cervical cancer cell line (HeLa), and human adrenal chromaffin cell tumor cell line (PC12), mouse peritoneal macrophage cell line (RAW 264.7) and human non-small cell lung cancer cell line (A549). As shown in Fig. S6,† even when the concentration of the probe was as high as 100 μM, the survival rate of these types of cells was still above 80%, further indicating that the probe has low toxicity and good biocompatibility, which could be well used in biological systems. This experiment confirmed that our probe had good biocompatibility and laid a solid foundation for the following biological applications.
3.6 Imaging of CO in living cells
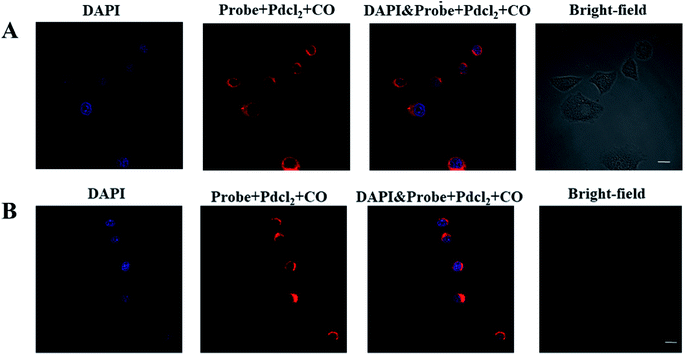
Since the probe had excellent biochemical properties such as high sensitivity and selectivity for CO detection, high quantum yield and good biocompatibility, we applied it to detect CO in living cells. In order to determine the distribution of CO in the cell, we first analyzed the location of the probe in the cell, and selected HeLa and RAW 264.7 cell lines as the test cell model. HeLa cells and RAW 264.7 cells were simultaneously incubated with the nuclear dye 4′,6-diamidino-2-phenylindole (DAPI) and this probe. As shown in Fig. 2, the fluorescence images of HeLa and RAW 264.7 cells showed that the probe was located in the cytoplasm and did not enter the nucleus. These results indicated that the probe could detect CO in the cytoplasm.Next, we further discussed the potential application for whether the probe (10 μM + 10 μM PdCl2) can image exogenous CO levels in cells, the A549, PC12, FaDu and LO2 cells were incubated with the probe (10 μM + 10 μM PdCl2) for 30 min before confocal imaging. As shown in Fig. 3, compared with the control group, the fluorescence intensity in each tumor cell line was significantly increased after the addition of CO donor CORM-3 (200 μM). The above experiments confirmed that the probe can sensitively image exogenous CO levels in cells.
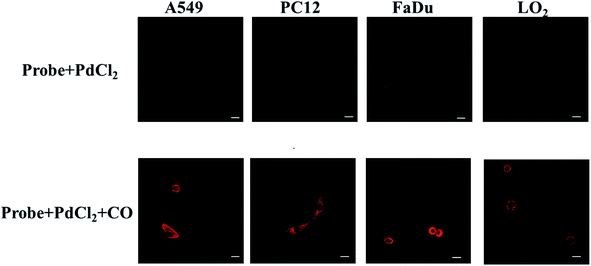 | ||
| Fig. 3 Confocal fluorescence cell imaging of the probe (10 μM + 10 μM PdCl2) in A549, PC12, FaDu and LO2 cells lines (λex = 690 nm, λem = 710–850 nm. Scale bar = 30 μm). | ||
3.7 Cell imaging of endogenous CO under hypoxia condition
As we all know, activated macrophages can directly or indirectly participate in the immune response of the immune system, clear antigens, foreign bodies, senescent cells and cell debris through phagocytosis, and then secrete various ROS, RNS and pro-inflammatory factors.34–36 Macrophages are immune cells and have multiple functions. They are important objects of studying cell phagocytosis, cellular immunity and molecular immunology. The mouse macrophage-like cell line RAW 264.7 is the most commonly used mouse macrophage cell line in biomedical research. So, we used RAW 264.7 cells as the tested cell model to further verify whether the probes can monitor CO levels in cells in real time. Endogenous CO is generated by HO-1 catalysis in the body using heme as a substrate,37 and long-term hypoxia will increase the transcription of HO-1 gene and HO-1 activation, leading to the production of endogenous CO.38,39 As shown in Fig. 4, RAW 264.7 cells were randomly divided into 11 groups according to the hypoxia time of 0 min, 10 min, 30 min, 1 h, 3 h, 6 h, 12 h, 24 h, 36 h, 48 h and 72 h. With the prolongation of hypoxia, the fluorescence intensity of RAW 264.7 cells gradually increased, and reached the peak at 24 h. Then it continued to weaken, and there still had weak fluorescence at 72 h. It showed that the cells still expressed a small amount of CO when hypoxia for 72 h. In summary, the above experiments confirmed that the designed probe can sensitively detect the changes of exogenous and endogenous CO.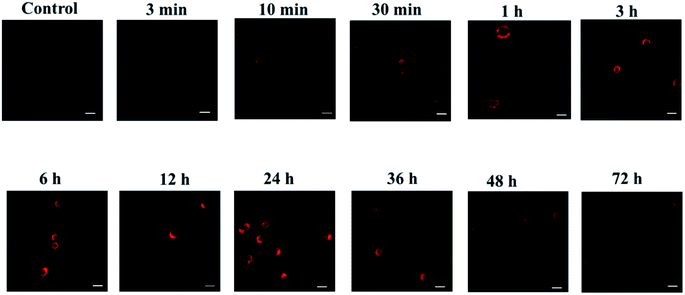 | ||
| Fig. 4 Fluorescence imaging experiments of probes on cells at different hypoxia time points (λex = 690 nm, λem = 710–850 nm. Scale bar = 30 μm). | ||
3.8 Imaging of endogenous CO in cells by probes under oxidative stress
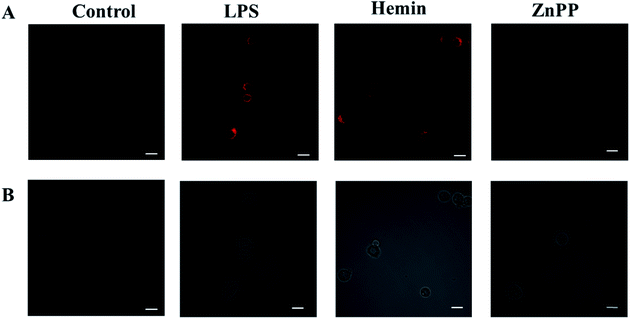
Next, we investigate whether the probe can detect the production of endogenous CO in cells under oxidative stress. It is well known that LPS or hemin can induce the expression of HO-1, thereby promoting the production of CO.40 But ZnPP may inhibit the expression of HO-1 and thereby inhibit the production of CO.41 First we pretreated the cells with LPS, hemin or ZnPP for 12 hours, respectively, then incubated with the probe for 30 minutes, and finally performed imaging. As shown in Fig. 5, the cells in the PBS experimental group had almost no fluorescence. However, the fluorescence signal produced by cells stimulated by LPS or hemin was significantly stronger than that produced by ZnPP, which confirms that LPS and hemin can stimulate the production of CO, while ZnPP can effectively inhibit the production of CO. This proves that the probe can sensitively detect the dynamic changes of endogenous CO in cells under oxidative stress.4. Conclusion
In summary, we design and develop a BODIPY-based NIR fluorescent probe that can be applied to detect and image the dynamic changes of CO levels in living cells. The probe displays high selectivity and sensitivity, low LOD and excellent biocompatibility. In addition, the probe can also effectively monitor the fluctuation of CO in cells under hypoxia conditions. Besides, the probe can also sensitively detect and image CO fluctuations in inflammatory cells under oxidative stress. The above experiments confirm that the probe can be employed as an excellent optical imaging tool, and we believe that it may have great potential and prospects in clinical applications.Conflicts of interest
The authors have declared no conflict of interest.Acknowledgements
This work was supported by the National Nature Science Foundation of China (No. 22164009), and the Talent Program of Hainan Medical University (HYPY2020017).References
- S. W. Ryter and A. M. Choi, Am. J. Respir. Cell Mol. Biol., 2009, 41, 251–260 CrossRef CAS PubMed.
- E. O. Owens, Clin. Biochem., 2010, 43, 1183–1188 CrossRef PubMed.
- G. D'Amico, F. Lam, T. Hagen and S. Moncada, J. Cell Sci., 2006, 119, 2291–2298 CrossRef PubMed.
- C. Y. Cheng, T. T. T. Vo, W. N. Lin, H. W. Huang, C. C. Chuang, P. M. Chu and I. T. Lee, Cytokine, 2020, 133, 155185 CrossRef CAS PubMed.
- P. Vieregge, W. Klostermann, R. G. Blumm and K. J. Borgis, J. Neurol., 1989, 236, 478–481 CrossRef CAS PubMed.
- G. Qiu, K. Yu, C. Yu, W. Li, J. Lv, Y. Guo, Z. Bian, L. Yang, Y. Chen, Z. Chen, F. B. Hu, L. Li and T. Wu, Sci. Rep., 2020, 10, 19507 CrossRef CAS PubMed.
- M. Heliovaara, M. J. Karvonen, R. Vilhunen and S. Punsar, Br. Med. J., 1978, 1, 268–270 CrossRef CAS PubMed.
- E. N. Allred, E. R. Bleecker, B. R. Chaitman, T. E. Dahms, S. O. Gottlieb, J. D. Hackney, M. Pagano, R. H. Selvester, S. M. Walden and J. Warren, N. Engl. J. Med., 1989, 321, 1426–1432 CrossRef CAS PubMed.
- Y. Ha, J. Sim, Y. Lee and M. Suh, Anal. Chem., 2016, 88, 2563–2569 CrossRef CAS PubMed.
- R. F. Coburn, J. Appl. Physiol., 2012, 112, 1949–1955 CrossRef CAS PubMed.
- H. Kitagishi, S. Minegishi, A. Yumura, S. Negi, S. Taketani, Y. Amagase, Y. Mizukawa, T. Urushidani, Y. Sugiura and K. Kano, J. Am. Chem. Soc., 2016, 138, 5417–5425 CrossRef CAS PubMed.
- L. Wang, M. S. Frei, A. Salim and K. Johnsson, J. Am. Chem. Soc., 2019, 141, 2770–2781 CrossRef CAS PubMed.
- C. Liu, Z. Li, C. Yu, Y. Chen, D. Liu, Z. Zhuang, P. Jia, H. Zhu, X. Zhang, Y. Yu, B. Zhu and W. Sheng, ACS Sens., 2019, 4, 2156–2163 CrossRef CAS PubMed.
- Z. Liu, G. P. Li, Y. N. Wang, J. L. Li, Y. Mi, L. N. Guo, W. J. Xu, D. P. Zou, T. S. Li and Y. J. Wu, RSC Adv., 2018, 8, 9519–9523 RSC.
- P. Jia, Z. Zhuang, C. Liu, Z. Wang, Q. Duan, Z. Li, H. Zhu, B. Du, B. Zhu, W. Sheng and B. Kang, Anal. Chim. Acta, 2019, 1052, 131–136 CrossRef CAS PubMed.
- S. Ye, N. Hananya, O. Green, H. Chen, A. Q. Zhao, J. Shen, D. Shabat and D. Yang, Angew. Chem., Int. Ed., 2020, 59, 14326–14330 CrossRef CAS PubMed.
- C. W. Rogers and M. O. Wolf, Angew. Chem., Int. Ed., 2002, 41, 1898–1900 CrossRef CAS PubMed.
- T. Yan, J. Chen, S. Wu, Z. Mao and Z. Liu, Org. Lett., 2014, 16, 3296–3299 CrossRef CAS PubMed.
- M. E. Moragues, A. Toscani, F. Sancenon, R. Martinez-Manez, A. J. White and J. D. Wilton-Ely, J. Am. Chem. Soc., 2014, 136, 11930–11933 CrossRef CAS PubMed.
- B. W. Michel, A. R. Lippert and C. J. Chang, J. Am. Chem. Soc., 2012, 134, 15668–15671 CrossRef CAS PubMed.
- Z. Wang, Z. Zhao, C. Liu, Z. Geng, Q. Duan, P. Jia, Z. Li, H. Zhu, B. Zhu and W. Sheng, Photochem. Photobiol. Sci., 2019, 18, 1851–1857 CrossRef CAS PubMed.
- W. Feng, S. Feng and G. Feng, Anal. Chem., 2019, 91, 8602–8606 CrossRef CAS PubMed.
- E. Zhou, S. Gong, Q. Xia and G. Feng, ACS Sens., 2021, 6, 1312–1320 CrossRef CAS PubMed.
- S. Gong, J. Hong, E. Zhou and G. Feng, Talanta, 2019, 201, 40–45 CrossRef CAS PubMed.
- W. Feng, S. Feng and G. Feng, Chem. Commun., 2019, 55, 8987–8990 RSC.
- S. Feng, D. Liu, W. Feng and G. Feng, Anal. Chem., 2017, 89, 3754–3760 CrossRef CAS PubMed.
- K. Liu, X. Kong, Y. Ma and W. Lin, Angew. Chem., Int. Ed., 2017, 56, 13489–13492 CrossRef CAS PubMed.
- M. Sun, H. Yu, K. Zhang, S. Wang, T. Hayat, A. Alsaedi and D. Huang, ACS Sens., 2018, 3, 285–289 CrossRef CAS PubMed.
- W. Feng, D. Liu, S. Feng and G. Feng, Anal. Chem., 2016, 88, 10648–10653 CrossRef CAS PubMed.
- S. Zhang, X. Mu, J. Zhu and L. Yan, Analyst, 2021, 146, 1289–1294 RSC.
- Z. Li, X. Jia, P. Zhang, Z. Guo, H. Zhao, X. Li and C. Wei, Sens. Actuators, B, 2021, 344, 130177 CrossRef CAS.
- L. J. Patalag, J. A. Ulrichs, P. G. Jones and D. B. Werz, Org. Lett., 2017, 19, 2090–2093 CrossRef CAS PubMed.
- D. Gong, X. Zhu, Y. Tian, S. C. Han, M. Deng, A. Iqbal, W. Liu, W. Qin and H. Guo, Anal. Chem., 2017, 89, 1801–1807 CrossRef CAS PubMed.
- F. Geissmann, M. G. Manz, S. Jung, M. H. Sieweke, M. Merad and K. Ley, Science, 2010, 327, 656–661 CrossRef CAS PubMed.
- M. T. Quinn, S. Parthasarathy, L. G. Fong and D. Steinberg, Proc. Natl. Acad. Sci. U. S. A., 1987, 84, 2995–2998 CrossRef CAS PubMed.
- J. S. Duffield, S. J. Forbes, C. M. Constandinou, S. Clay, M. Partolina, S. Vuthoori, S. Wu, R. Lang and J. P. Iredale, J. Clin. Invest., 2005, 115, 56–65 CrossRef CAS.
- A. Loboda, A. Jozkowicz and J. Dulak, Vasc. Pharmacol., 2015, 74, 11–22 CrossRef CAS PubMed.
- K. Chen, R. B. Cole and B. B. Rees, J. Proteomics, 2013, 78, 477–485 CrossRef CAS PubMed.
- P. A. Padilla and M. B. Roth, Proc. Natl. Acad. Sci. U. S. A., 2001, 98, 7331–7335 CrossRef CAS PubMed.
- K. Liu, X. Kong, Y. Ma and W. Lin, Angew. Chem., Int. Ed., 2017, 56, 13489–13492 CrossRef CAS PubMed.
- S. W. Ryter and A. M. Choi, Transl. Res., 2016, 167, 7–34 CrossRef CAS PubMed.
Footnote |
| † Electronic supplementary information (ESI) available. See DOI: 10.1039/d1ra06052j |
| This journal is © The Royal Society of Chemistry 2021 |

