
 Open Access Article
 This Open Access Article is licensed under a Creative Commons Attribution-Non Commercial 3.0 Unported Licence
Iron(III) chelated paramagnetic polymeric nanoparticle formulation as a next-generation T1-weighted MRI contrast agent†
Ramesh Marasini ab,
Sagar Rayamajhiab,
Anthony Moreno-Sanchezab and
Santosh Aryal*c
ab,
Sagar Rayamajhiab,
Anthony Moreno-Sanchezab and
Santosh Aryal*c
aDepartment of Chemistry, College of Arts and Sciences, Kansas State University, Manhattan, KS 66506, USA
bNanotechnology Innovation Center of Kansas State (NICKS), Department of Anatomy and Physiology, College of Veterinary Medicine, Kansas State University, Manhattan, KS 66506, USA
cDepartment of Pharmaceutical Sciences and Health Outcomes, The Ben and Maytee Fisch College of Pharmacy, The University of Texas, Tyler, TX 75799, USA. E-mail: santosharyal@uttyler.edu
First published on 29th September 2021
Abstract
Magnetic resonance imaging (MRI) is a routinely used imaging technique in medical diagnostics. To enhance the quality of MR images, contrast agents (CAs) are used, which account for nearly 40% of MRI exams in the clinic globally. The most used CAs are gadolinium-based CAs (GBCAs) but the use of GBCAs has been linked with metal-deposition in vital organs. Gadolinium deposition has been shown to be correlated with nephrogenic systemic fibrosis, a fibrosis of the skin and internal organs. Therefore, there is an unmet need for a new CA alternative to GBCAs for T1-weighted Ce-MRI. Herein, we designed paramagnetic ferric iron(III) ion-chelated poly(lactic-co-glycolic)acid nanoparticle formulation and routinely examined their application in Ce-MRI using clinical and ultra-high-field MRI scanners. Nanoparticles were monodispersed and highly stable at physiological pH over time with the hydrodynamic size of 130 ± 12 nm and polydispersity index of 0.231 ± 0.026. The T1-contrast efficacy of the nanoparticles was compared with commercial agent gadopentetate dimeglumine, called Magnevist®, in aqueous phantoms in vitro and then validated in vivo by visualizing an angiographic map in a clinical MRI scanner. Relaxivities of the nanoparticles in an aqueous environment were r1 = 10.59 ± 0.32 mmol−1 s−1 and r1 = 3.02 ± 0.14 mmol−1 s−1 at 3.0 T and 14.1 T measured at room temperature and pH 7.4, respectively. The clinically relevant magnetic field relaxivity is three times higher compared to the Magnevist®, a clinical GBCA, signifying its potential applicability in clinical settings. Moreover, iron is an endogenous metal with known metabolic safety, and the polymer and phospholipids used in the nanoconstruct are biodegradable and biocompatible components. These properties further put the proposed T1 agent in a promising position in contrast-enhanced MRI of patients with any disease conditions.
Introduction
Magnetic resonance imaging (MRI) is one of the prominent noninvasive imaging modalities to provide images with unprecedented anatomical details based on soft-tissue contrast and functional information in real-time.1–3 The quality of the MR image is enriched using contrast agents (CAs), by the perturbation of nearby water protons' longitudinal (T1) or transverse (T2) relaxation time in the body. Most clinically used MRI CAs include gadolinium(Gd)-based contrast agents (GBCAs), which account for about 40% of nearly 1 billion global MRI exams benefiting millions of patients globally.4,5 CAs help physicians diagnose and treat a variety of pathophysiological procedures by improving the visualization of specific organs, tissues, and blood vessels. CAs improve the effectiveness of MRI by altering the molecular motions and tissue water compositions concerning the characteristics of the surrounding tissues in question in a living subject thereby altering the surrounding contrast. Based on the underlying physical relaxation mechanisms, two types of MRI contrast agents, positive (T1-weighted) and negative (T2-weighted), are used.6,7 In general, paramagnetic Gd(III) complexes are most predominant among T1 agents while superparamagnetic iron oxide nanoparticles (SPIONs), for example Feridex® and Revosit®, are typical T2-agents, used in Ce-MRI.8–12 However, recent reports have shown that the widespread application of GBCAs led to Gd deposition in the organs including the brain, bones, and skin raising serious safety concerns.13–15 The long-term health consequences of Gd retention in tissue are, however, unknown, but it raises additional concerns about the long-term safety profile of GBCAs, particularly patients that require frequent Ce-MRI exams for disease surveillance.16 According to the National Institute of Diabetes and Digestive and Kidney Diseases (NIDDKD) more than 661![[thin space (1/6-em)]](https://www.rsc.org/images/entities/char_2009.gif) 000 Americans have kidney failure. Of these, 468000 individuals are on dialysis, and about 193000 live with a functioning kidney transplant.17 Moreover, the overall prevalence of chronic kidney disease in the general population is approximately 14 percent.17 The use of GBCA in these populations is fatal. These results prompted the European Medical Agency to suspend some of the clinically approved GBCAs and the Food and Drug Administration (FDA) of the United States has added warning labels on these agents.18,19
000 Americans have kidney failure. Of these, 468000 individuals are on dialysis, and about 193000 live with a functioning kidney transplant.17 Moreover, the overall prevalence of chronic kidney disease in the general population is approximately 14 percent.17 The use of GBCA in these populations is fatal. These results prompted the European Medical Agency to suspend some of the clinically approved GBCAs and the Food and Drug Administration (FDA) of the United States has added warning labels on these agents.18,19
Increasing awareness of the potential risks associated with Gd metal ions has revealed an unmet need for the development of alternative, Gd-free, CAs for T1-weighted MR imaging. In pursuit of safer alternatives to Gd, the bulk of research has focused on the SPIONs based CAs which can also be categorized as the first generation of iron-based CAs.8,12,20–24 However, several clinical SPIONs have already been discontinued due to toxicity and a lack of clinical benefit in imaging.25 On the other hand, less attention has been given to the potential application of ferric iron (Fe3+) as the next generation of T1-based CAs. The paramagnetic metal ion, Fe3+ with five unpaired electrons has high longitudinal relaxivity and unlike Gd, iron is an essential element that is naturally found in the body and has clear metabolic pathways, for example, endosomal degradation and hepatobiliary excretion.11,26,27 However, one remaining concern is the possible toxicity associated with the aqua ions of paramagnetic metals, therefore, a variety of ligands have been employed to chelate free metals ions. For example, catechol ligands have a high affinity and binding capacity to coordinate Fe3+cations, which have been widely applied in biomaterials.28,29 Although the standard tris-catecholate–Fe3+complexation is simple for Fe3+ encapsulation, only a handful of reports have been published as T1-weighted MRI CAs.21,30–34 In the past, small molecular Fe3+ chelates of ethylenediaminetetraacetic acid, pentetic acid, and trans-cyclohexane diamine tetraacetic acid as low-molecular-weight T1 CAs have been reported.35,36 These small molecular Fe-chelates did not show any better contrast efficacy compared to GBCAs limiting further translation to the clinic. Alternatively, there are some Fe-based nanoparticulate systems designed and tested in the preclinical model to improve the relaxivities. For example, Fan et al. designed multifunctional Fe3+-chelated melanin-like nanoparticles (NPs) with r1 = 1.2 mM−1 s−1 and found an increase in signal intensity in the tumor region when used with RGD-peptide linked NPs at 4 h post-injection (1.0 T, 25 °C).37 Similarly, Miao et al. reported the r1 = 5.6 mM−1 s−1 from Fe3+-chelated poly-3,4-dihydroxy-L-phenylalanine-b-polysarcosine nanoparticles using 3.0 T magnetic field at 20 °C.32 However, these approaches were mainly limited due to the restricted control over the synthetic colloidal chemistry hindering size and shape control and inherently lower relaxivity value.29 In contrast, poly-lactic glycolic acid (PLGA) is widely applied in biomedical fields, such as controlled drug release, gene delivery, stimuli-responsive biomaterials, and nanoscale self-assembly systems due to its excellent biocompatibility and biodegradability.38–45 Carboxylate terminated PLGA NPs could offer complexation with Fe3+ ions and help make overall NPs charge distribution effective for cellular uptake. Herein, we test our hypothesis that Fe3+ encapsulated PLGA nanoparticles will give comparable relaxivity with equivalent to the GBCAs. We studied the relaxivity of Fe–PLGA NPs at low field (3.0 T) and ultra-high-field (14.1 T) in aqueous solutions and compared it with Magnevist®, a clinical GBCA. We demonstrate a three-fold enhancement of the relaxivity of Fe3+–PLGA NPs at the clinically relevant field and offer a Gd free alternative platform for next-generation of iron-based T1-weighted nanoscale CA for Ce-MRI.
Materials and methods
Material and chemical
Carboxylic end group terminated PLGA (lactide:glycolide = 50:50 dL g−1) was purchased from DURECT Corporation (USA) and used after purification by repeated precipitation in diethyl ether. 1,2-Distearoylphosphatidylethanolamine polyethylene glycol succinyl (DSPE–PEG–COOH) and phospholipid conjugated L-α-phosphatidylethanolamine-N-lissamine rhodamine-B sulfonyl (ammonium salt) (RhB) was purchased from Avanti Polar Lipid Inc (Alabaster, AL, USA). DAPI (4′,6-diamidino-2-phenylindole) dihydrochloride, acetonitrile, and dimethyl sulfoxide (DMSO) were purchased from Sigma-Aldrich (Saint Louis, MO, USA). 3-(4,5-Dimethylthiazol-2-yl)-2,5-diphenyl tetrazolium bromide (MTT) was purchased from Thermo Fisher Scientific, USA. All other analytical grade reagents and solvents were used without further purification.
Cell line and animal model
Breast cancer (MCF-7) cells from American Type Culture Collection (ATCC) were maintained in Dulbecco's Modified Eagle's Medium (DMEM) with 10% (v/v) fetal bovine serum (FBS) and penicillin/streptomycin (100 μg mL−1) and maintained at 37 °C in 5% CO2 environment.Six week-old female NU/NU nude mice were procured from Charles River Laboratories International, Inc. and used for the study after ten days of acclimatization. All animal experiments and protocols were approved by the Institutional Animal Care and Use Committee (IACUC, IACUC #4264) and Institutional Biosafety Committee (IBC), Kansas State University, Manhattan, Kansas.
Preparation of paramagnetic polymeric nanoparticles
Paramagnetic polymeric NPs were prepared by the nanoprecipitation technique following established protocol from the literature.38,40,46,47 In brief, the paramagnetic PLGA cores were prepared by adding dropwise 100 μL of PLGA (10 mg mL−1, acetonitrile) containing various amounts of iron(III) chloride hexahydrate (10, 20, 50, 100, 150, 200, and 400 μL of 0.1 M FeCl3 in acetonitrile) was added dropwise into 3 mL Milli-Q water containing 200 μg mL−1 lipid suspension under magnetic stirring at 60 °C. Control PLGA NPs were fabricated similarly without encapsulating Fe3+. The mixture was stirred continuously overnight at room temperature to evaporate off the organic solvent. The sample was further purified using Amicon Ultra-4 centrifugal filter (Millipore, MA) with a molecular weight cut-off of 10 kDa and stored at 4 °C for further use. Rhodamine lipid dye-labeled Fe–PLGA or PLGA NPs were prepared by mixing 20 μg of L-α-phosphatidylethanolamine-N-(lissamine rhodamine B sulfonyl) (ammonium salt) with lipid suspension before the fabrication of paramagnetic polymeric core.Characterization of Fe–PLGA NPs
The hydrodynamic size and zeta potential of the Fe–PLGA NPs were characterized using dynamic light scattering analysis (Malvern, Nano ZSP). The morphology of Fe–PLGA NPs was further confirmed using a transmission electron microscope (FEI Tecnai G2 Spirit BioTWIN). TEM samples were prepared by incubating 20 μL of Fe–PLGA (1 mg mL−1) with 20 μL of 0.1% uranyl acetate for 5 min at room temperature. The sample was then placed on a formvar coated copper grid (400 mesh) and let stand for an additional 10 min. The excess amount of sample was removed before TEM acquisition. TEM images were acquired at 120 kV and analyzed by GATAN digital imaging system (GATAN, Inc.). The amount of iron in NPs was determined using inductively coupled plasma mass spectrometry (ICP-MS, PerkinElmer, NexION® 350X). For ICP-MS, the Fe–PLGA NPs samples were digested with 2.0 mL of concentrated HNO3 for 3 h at 90 °C in a hot block digestor (Environmental Express, USA). After digestion, 100 μL of the sample was diluted with 10 mL of 2% HNO3 and analyzed using ICP-MS. ICP-MS standard of iron with 1, 2, 4, 8, 16, 32, 64, 128 ppb was used for the standard calibration curve and rhodium was used as internal standard.The stability at physiological conditions was investigated by dispersing nanoparticles in phosphate buffer saline (PBS, pH 7.4) at the particle concentration of 1 mg mL−1. The nanoparticles were incubated at 37 °C for 4 weeks. The changes in hydrodynamic size and polydispersity index (PDI) were tracked each week using dynamic light scattering analysis. The serum stability of the prepared PLGA and Fe–PLGA NPs was carried out as reported in the literature.48–50 Briefly, 150 μL of 1 mg mL−1 nanoparticles were incubated with 50 μL of fetal bovine serum (90%) at 37 °C. The change in absorbance at 560 nm was measured kinetically every 6 s for 1 h with a double-orbital shaking at slow speed before each measurement using a microplate reader (BioTek, Synergy H1 hybrid reader).
Simulated body fluid (SBF) was prepared to mimic the biological environment by dissolving appropriate quantities of the chemical reagent in ultra-pure MilliQ water following the procedure reported by Cüneyt Tas and Aryal et al.51,52 The chemical reagents were added one after another as shown in Table 1 of ESI† where each reagent was completely dissolved in 700 mL MilliQ water. The pH of the resulting SBF was adjusted by titrating with 1 M HCl to 7.4 at 37 °C, and the final volume was adjusted to 1 liter by adding the required amount of MilliQ water.
For the ascorbic acid oxidation assay, first, the UV-Vis spectrum of an ascorbic acid solution (67 μM and 12 μg mL−1) in PBS was recorded in SpectraMax i3X (Molecular Devices).53 The absorbance intensity at λmax = 265 nm was observed. An aliquot (30 μL) of the iron chelate of ethylenediaminetetraacetic acid (Fe–EDTA) in PBS (2 mM, 0.7 mg mL−1) was added to afford a catalytic quantity of Fe–EDTA (20 μM, 30 mol%) for ascorbic acid. The absorbance intensity (λmax = 265 nm) was recorded at intervals of 1 minute for 60 minutes and the data were normalized with blank. The experiment was then repeated identically using a solution of the Fe–PLGA NPs under investigation (20 μM), and the results were plotted as a function of the percent initial ascorbic acid signal versus elapsed time (min).
MRI phantom study
The T1-weighted MRI images of Fe–PLGA NPs were investigated under low field (3.0 T, Canon, USA) and ultrahigh field (14.1 T, Bruker, MA) MRI system at 20 °C. Samples of Fe–PLGA NPs were diluted in Milli-Q water with a series of concentrations of 0.02, 0.03, 0.07, 0.13, 0.27, and 0.54 mM of Fe3+. The Fe–PLGA NPs phantoms were obtained using a fast spin-echo (FSE) sequence for 3 T and rapid acquisition with relaxation enhancement (RARE) pulse for 14.1 T with variable repetition time. A knee coil for 3 T with a local tube rack and a QTR 30 mm coil with a home-designed falcon tube for holding 6 samples at a time in NMR tubes were used, respectively. Scans were performed with the following imaging parameters (3 T): repetition time (TR) = 3000, 2500, 1500, 800, 500, and 200 ms, echo time (TE) = 7.5 ms, slice thickness = 2 mm, flip angle (FA) = 90°, image size 256 × 256, FOV = 25.6 × 25.6, total acquisition time of nearly 15 min and for 14 T: repetition time (TR) = 10000, 8000, 6000, 4000, 2500, 1500, 1000, 600, 400, 200, 100, 50 ms, echo time (TE) = 7.5 ms, slice thickness = 1 mm, flip angle (FA) = 80°, image size 256 × 256, FOV = 30 × 30, total acquisition time of 55 min 43 s. The representative T1 weighted magnetic resonance phantom images of Fe–PLGA were taken at TR = 1500 ms, TE = 7.5 ms, and slice thickness = 2 mm. Paravision 6.0 software was used to obtain the signal intensity of each sample by drawing the same region of interest (ROI) and thus obtained signal intensity is plotted against the repetition time (TR) or echo time (TE). The longitudinal coefficient relaxivity value r1 or r2 was determined from the slope of the plot of 1/T1 or 1/T2 versus the sample concentration, respectively. Magnevist® was used as a control under the identical condition for comparison.
In vitro biocompatibility study
In this study, the standard MTT assay was used to evaluate the cytotoxicity of Fe–PLGA NPs. For the MTT assay, MCF-7 cells were seeded with cell density 10000 cells per well in 96-well plates and incubated overnight. After that, the cells were treated with different concentrations of pure PLGA NPs and Fe–PLGA NPs for 24 h. After washing, the cells were incubated with a syringe filtered (0.22 μM) 100 μL of 5 mg mL−1 MTT in a 1× PBS solution. After 4 h of incubation, the supernatant was carefully aspirated and the intracellular formazan crystals were dissolved in DMSO. The absorbance of the formazan solution was measured by spectroscopy at 570 nm using DMSO as the blank. The cell viability (%) was expressed as the percentage relative to the control cells (untreated cells).
In vitro cellular uptake study
Cells were plated 20000 cells per well on an 8-well chamber slide (BD Biosciences). After 24 h, cells were treated with RhB labeled PLGA and Fe–PLGA NPs with a final NP concentration of 50 μg mL−1 and incubated over varying periods (0, 0.5, 1.5, and 3 h). After incubation, the treated cells were washed twice with 1× PBS (pH 7.4), fixed with 4% paraformaldehyde for 15 min at room temperature, stained with DAPI for an additional 10 min, mounted with Fluoromount aqueous medium (Sigma-Aldrich), and imaged using CLSM (Carl Zeiss, LSM-700). The cellular uptake was assessed by measuring RhB fluorescence intensity using Image-J software (National Institute of Health). The data were analyzed using one-way ANOVA with Turkey's multiple comparison post-test.
In vivo MRI study
In vivo MRI study was performed using NU/NU mice on a 3 T MRI clinical scanner. In brief, the mice have intravenously injected 100 μL of Fe–PLGA NPs (equivalent Fe concentration of 0.02 mmol kg−1) with formulation reconstituted in saline via the lateral tail vein. During imaging, mice were continuously anesthetized with 2 to 4% isoflurane in oxygen delivered using a nose cone mounted on the mouse holder. Whole-body coronal slices images were acquired immediately pre-injection, at injection (bolus injection), and post-injections at 10 min, 1 h, 2 h, and 3 h. The T1-weighted MR images were recorded using FSE sequences discussed above. The recorded images with different slices were processed for maximum intensity projection using Medical Image Processing, Analysis, and Visualization (MIPAV) software. The animal experiment and protocols were approved by the Institutional Animal Care and Use Committee and Institutional Biosafety Committee, Kansas State University, Manhattan.Result and discussion
Morphology, size, and charge distribution of Fe–PLGA NPs
The chelation of Fe3+ cations with PLGA NPs was performed by nanoprecipitation as discussed in the Material and method section. The physical morphology of the Fe–PLGA nanoparticles was measured using TEM that showed highly monodispersed and uniform spherical-shaped particles with an average diameter of 93 ± 7 nm (Fig. 1A). The presence of Fe3+ ions localized inside the spherical nanoparticles was confirmed with energy-dispersive X-ray spectroscopy (EDS). Specifically, the EDS profiles suggested that the content of iron in the testing areas of Fe–PLGA was significantly higher than those on the grid surface background, which are in good agreement with the elemental mapping analysis results (Fig. 1B). Furthermore, the average hydrodynamic size of the Fe–PLGA NP was 130 ± 12 nm with a PDI of 0.231 ± 0.026 (Fig. 1C). The Fe–PLGA NPs when dispersed into 1× PBS showed a zeta potential of −6 ± 2 mV as compared to the control PLGA NPs (before chelation) of −39 ± 6 mV (Fig. 1D). The negative zeta potential is likely due to the surface carboxylate groups at the end moiety of the PEG corona and the presence of soluble anions in the PBS solution. The large decrease of negative surface charge of Fe–PLGA NPs from −39 ± 6 mV to −6 ± 2 mV can also be corroborated with the chelation with Fe3+ cations thereby decreasing the overall surface charge of the nanoparticles compared to the bare PLGA NPs. The difference between TEM and hydrodynamic sizes indicates that the DSPE–PEG provided a hydrating layer over the surface of the nanoparticle. Thus, formed hydrating layers could enhance nanoparticle stability helping to minimize protein corona formation in the bloodstream, and prevent the nanoconstruct from immune invasion. We did not observe agglomeration with no significant changes in size and PDI of nanoparticles (Fig. 2A) incubated over the four weeks in the physiological condition of PBS at pH = 7.4. Furthermore, we evaluated the serum stability of pure PLGA NPs and Fe–PLGA NPs using 90% FBS where we observed immediate aggregation of PLGA NPs as indicated by the increase in absorbance at 560 nm while Fe–PLGA NPs were stable under serum condition (Fig. 2B). This in vitro study verified long-term stability in PBS and serum showing the applicability of the nanoparticles for the biological environment.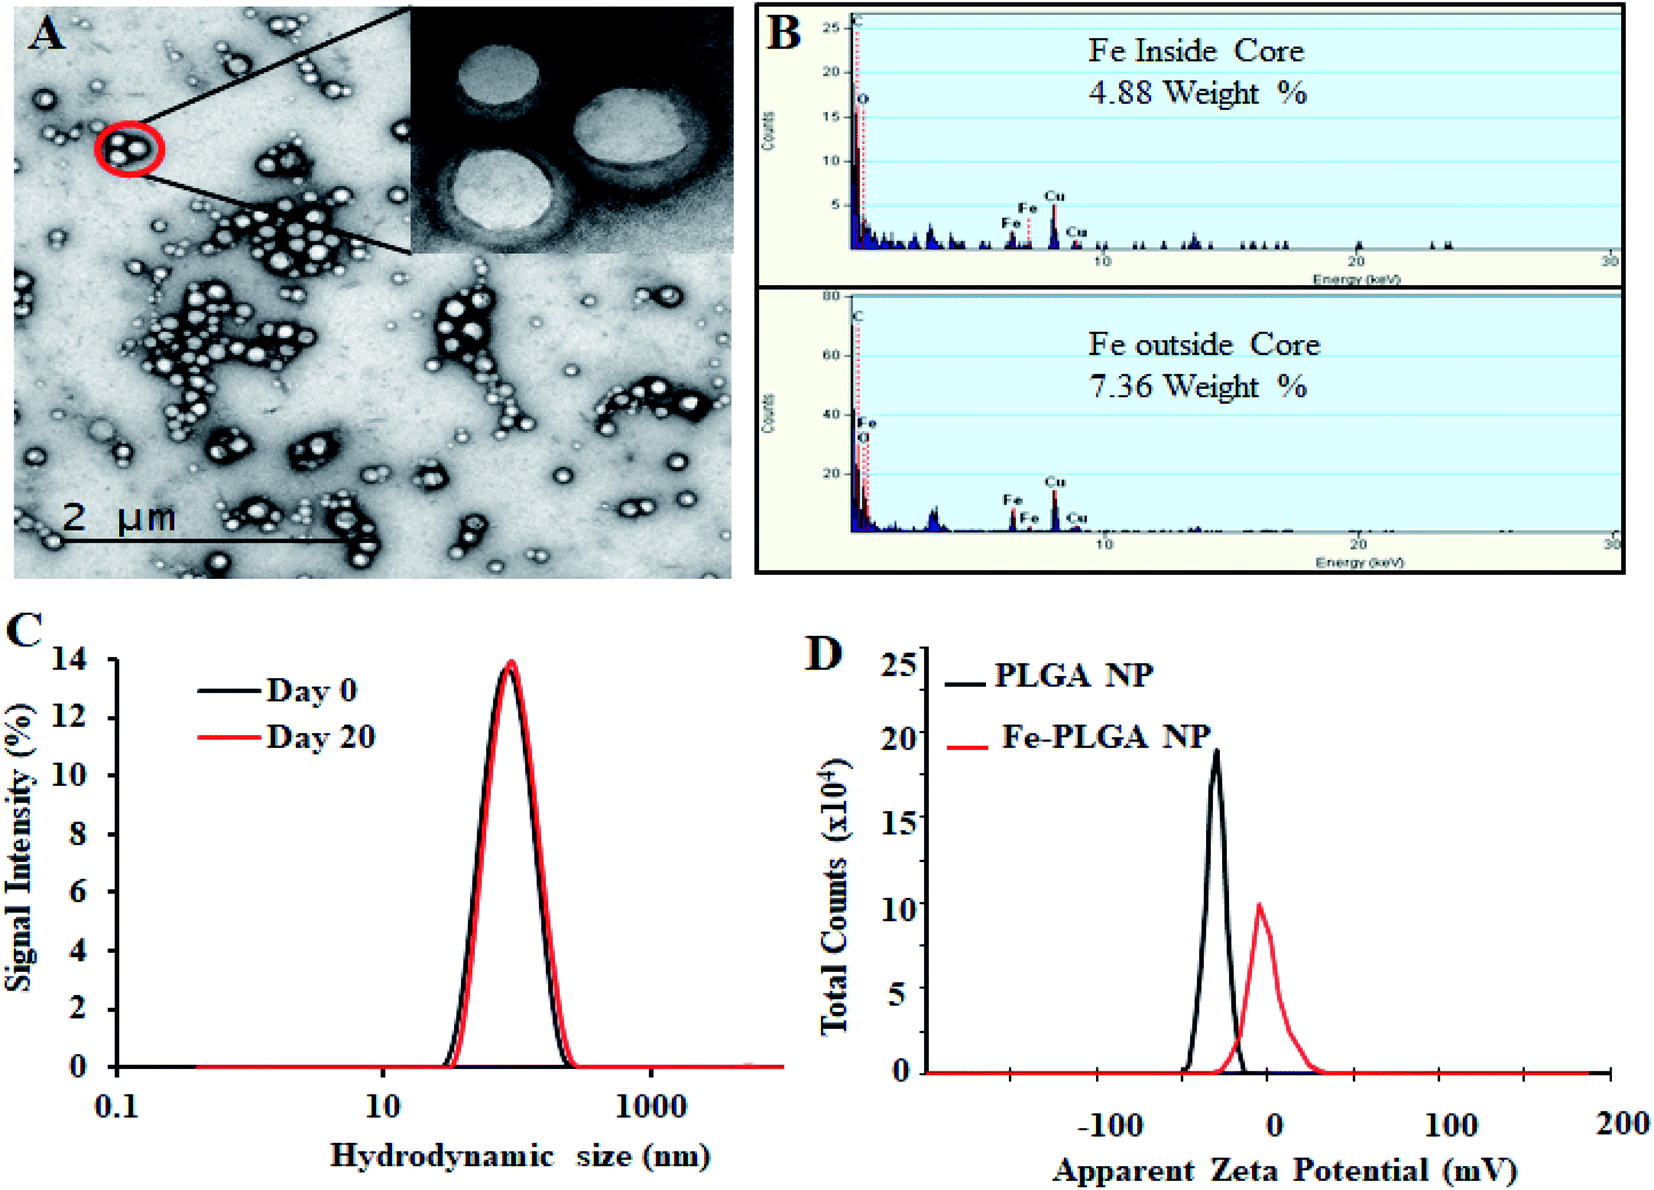 | ||
| Fig. 1 Physiochemical characterization of iron(III) chelated polymeric NPs. (A) Transmission Emission Micrograph (TEM) of NPs, (B) EDS spectroscopy showing the Fe content in the NPs, (C) hydrodynamic size of NPs as prepared and after 20 day incubation, and (D) zeta potential of PLGA NPs and Fe–PLGA NPs dispersed in PBS. | ||
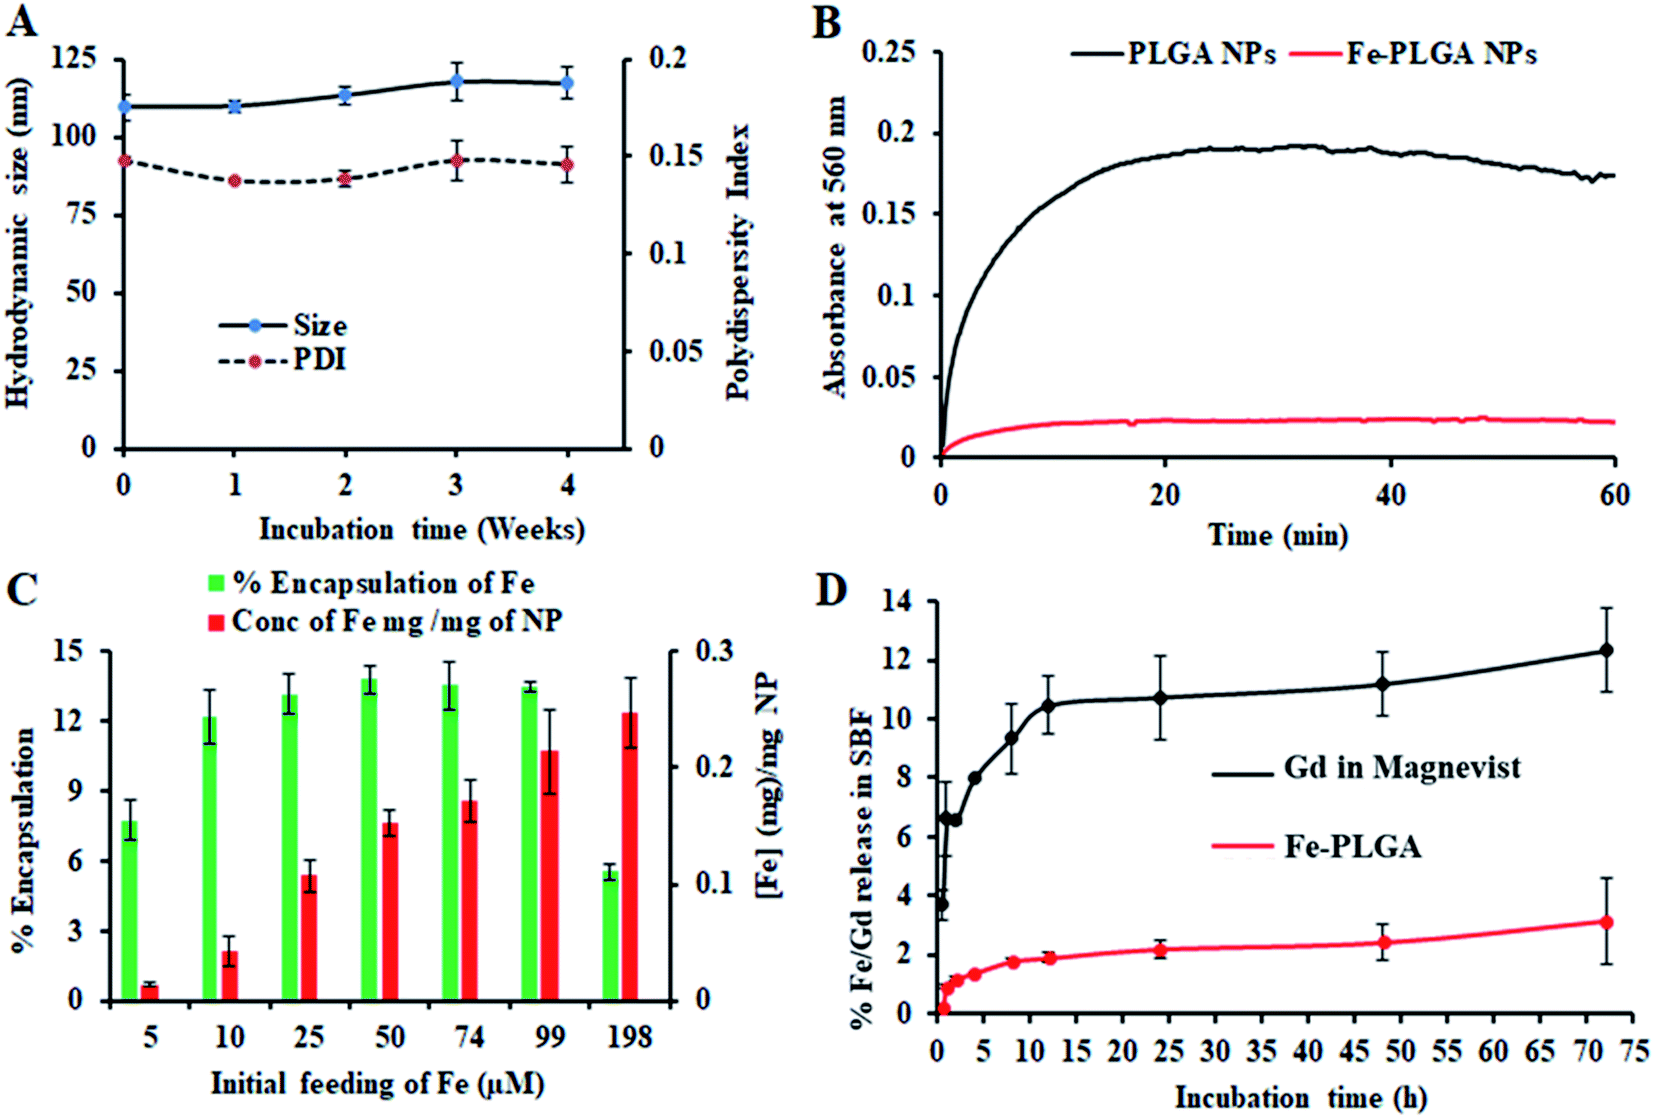 | ||
| Fig. 2 Stability and loading/release study of iron(III) chelated polymeric NPs. (A) Stability of NPs over 4 weeks period when stored at 4 °C showing the change of size and polydispersity index, (B) serum stability test to measure dynamic aggregation of PLGA NPs and Fe–PLGA NPs using 90% fetal bovine serum environment to find the rapid increase in optical density of 560 nm due to NPs aggregation by forming protein corona, (C) iron loading efficiency with the different initial feeding concentration of Fe3+ per mg PLGA, and (D) a comparative Fe and Gd release study from Fe–PLGA NPs and Magnevist® in simulated body fluid (SBF), respectively. Data represents mean ± S.D, n = 3. | ||
Ferric chloride loading and release study
The Fe3+ encapsulation efficiency of the NPs was evaluated by altering the initial iron input concentration from 5 to 198 μM per mg of the PLGA. The results showed that the initial Fe3+ loading can be precisely tuned by varying the iron input (5, 10, 25, 50, 74, 99, and 198 μM mg−1 of PLGA weight) during the NP preparation process (Fig. 2C). Among the different initial Fe3+ feeding concentrations, the maximum encapsulation efficiency was found to be about 14% (w/w) iron per 1 mg polymer in which a plateau was observed with 50 μM. When the initial input amount of iron increases up to 200 μM per 1 mg PLGA, the nanoparticle started to aggregate due to the destabilization affecting the physiological stability of the particles as indicated by rapid aggregation and precipitation due to the excess amount of iron in the suspension. Therefore, after investigating various loading of iron input, we found 200 μL (0.1 M FeCl3) input formulation corresponding to 99 μM iron per 1 mg PLGA is an ideal composition for further investigations. No significant changes in the size and PDI of this formulation were observed when stored at 4 °C in PBS (pH = 7.4) over 4 weeks, confirming the excellent physicochemical properties (Fig. 2A). When Fe–PLGA-200 is 1.0 mg mL−1, the concentration of iron is found to be 214 μg mL−1 according to ICP-MS quantifications.The retention of Fe3+ ions in the nanoparticle formulation is paramount for the development of a safer contrast agent. To evaluate the chelation stability of iron in the Fe–PLGA NPs formulation, the competitive iron release assay was carried out in simulated body fluid with different ion media prepared according to the literature.51,52 Magnevist®, a widely used commercial Gd-based contrast agent, was used as a control. As we expected that the Fe–PLGA NPs could serve as a T1-weighted next-generation CA, phenomenon such as transmetalation with endogenous scavenger cations while traveling in the bloodstream could be minimized to achieve a better safety profile. Therefore, the Fe–PLGA NPs were challenged with different ion media in simulated body fluid, exactly mimicking the blood serum condition. The iron release characteristics of Fe–PLGA NPs were mapped in terms of cumulative iron release from a 500 Da dialysis bag and compared with the Magnevist®. This selected molecular weight cutoff gives free passage of all ion presence in the media. As a result, in simulated body fluid (pH 7.4), Fe–PLGA NPs appeared to be highly stable with about 2% release up to 24 h, 2.4% at 48 h, and 3.1% of iron release over 72 h of incubation (Fig. 2D). This minimal release could be attributed to the strong chelation of Fe3+ ions with the carboxylate end of PLGA and lipid–PEG. On the other hand, the amount of Gd ions released from Magnevist® (a clinical contrast agent) under the identical condition increases significantly as the incubation time increase leading to the cumulative release of 12.3% at 72 h. Additionally, Gd3+ is a toxic heavy metal with safety concerns regarding the use of GBCAs for Ce-MRI. When dechelated, the free Gd3+ ions due to similar ionic sizes can compete with Ca2+ ions affecting voltage-gated calcium channels and disrupting crucial calcium homeostasis causing adverse biological effects.4 With respect to these concerns, when challenged with simulated body fluid, the designed iron-based T1-weighted next-generation of nanoscale CAs provided more than 96% retention of iron within the nanoconstruct as compared to the 85% retention of Gd from Magnevist®. These preliminary results demonstrate the potential alternative, Gd-free, T1-weighted MR contrast agent.
While the Fe–PLGA NPs are well stable in aqueous media, one concern related to iron-mediated oxidative Fenton chemistry to produce hydroxyl radicals, which are deleterious to biomolecules. However, when the iron is strongly stabilized by chelates, herein carboxylate in polymeric NPs and polymer matrix created diffusion barrier, are known that do not appreciably catalyze Fenton chemistry and, therefore, minimize an important route by which iron can be toxic.54,55 Therefore, this possibility was studied using ascorbic acid, as a model biomolecule, oxidation catalyzed by Fe3+. As shown in Fig. 3, over the period of incubation, FeCl3 catalyzed the reaction (decrease in absorbance at 265 nm) but Fe–PLGA NPs did not catalyze the oxidation of ascorbic acid supporting the stability of Fe3+ ion, NPs colloidal stability, and biocompatibility with no noticeable generation of radical ions.
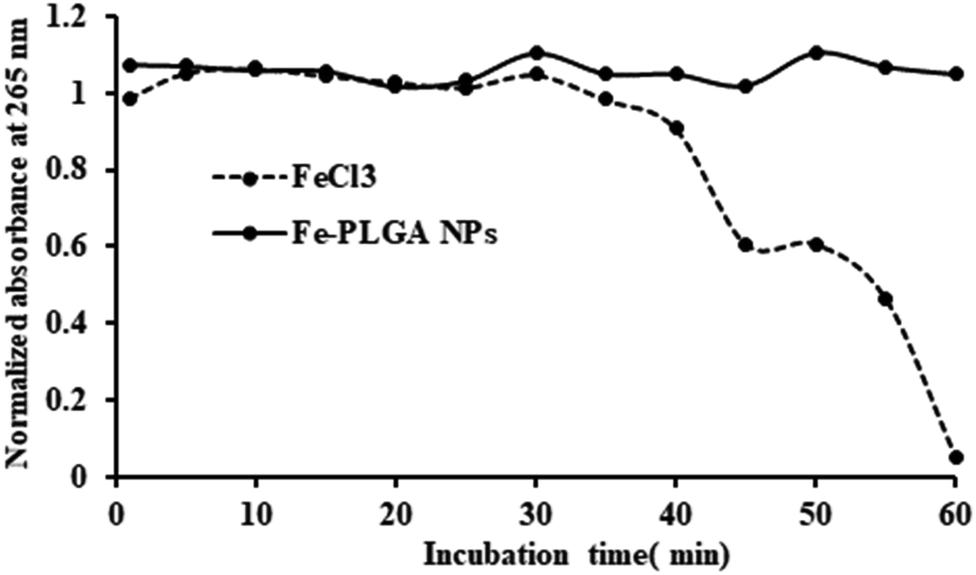 | ||
| Fig. 3 Oxidation of ascorbic acid catalyzed by Fe3+ ions. FeCl3 catalyzed the oxidation reaction of ascorbic acid as shown by the decrease in absorbance at 265 nm whereas, Fe–PLGA NPs did not catalyze the reaction. | ||
In vitro cellular interaction study
Next, the biocompatibility of Fe–PLGA NPs was evaluated in MCF-7 cells using the standard MTT assay. Similar to Fe3+-chelated melanin colloidal nanoparticles and many other kinds of polycatechol-based biomaterials,26–28,37,56–58 Fe–PLGA NPs also showed higher biocompatibility and promisingly low toxicity in cells. Fig. 4A illustrates the biocompatibility in MCF-7 cells cultivated for 24 h with various concentrations of Fe–PLGA NPs from 5 to 200 μg mL−1 with the data as an average of three repeating tests. The higher cell viability over 85% against the highest concentration of nanoparticles used (200 μg mL−1) indicates excellent biocompatibility and low toxicity. After confirming the biocompatibility of nanoparticles, we assessed the time-dependent cellular uptake of rhodamine-lipid labeled Fe–PLGA NPs (50 μg mL−1) for 0.5, 1.5, and 3 h, respectively in cells using confocal microscopy. Fig. 4B shows the representative confocal images of the cells showing the internalization of NPs and their corresponding quantification of rhodamine intensity of internalized NPs using ImageJ. Untreated cells were used as control. Fig. 4C shows the fluorescence intensity of the Fe–PLGA was significantly higher at 3 h when compared with 0.5 h incubation (p-value < 0.0001, one-way ANOVA with Mann–Whitney test). It is expected that with the increase of treatment time, the NPs uptake also increased for initial time points, as in the case of 0.5 h versus 1.5 h also showed a significant increase (p-value < 0.02). This observation clearly demonstrates that Fe–PLGA NPs were taken up by cells. These results corroborate the previous findings of metal encapsulated polymeric nanoparticles.43,59–61 The observed high cellular viability and excellent retention of Fe3+ in Fe–PLGA NPs, taken together, confirm the stability of Fe3+ in the nanoconstruct showing excellent compatibility of the formulated Fe–PLGA NPs as a safe contrast agent.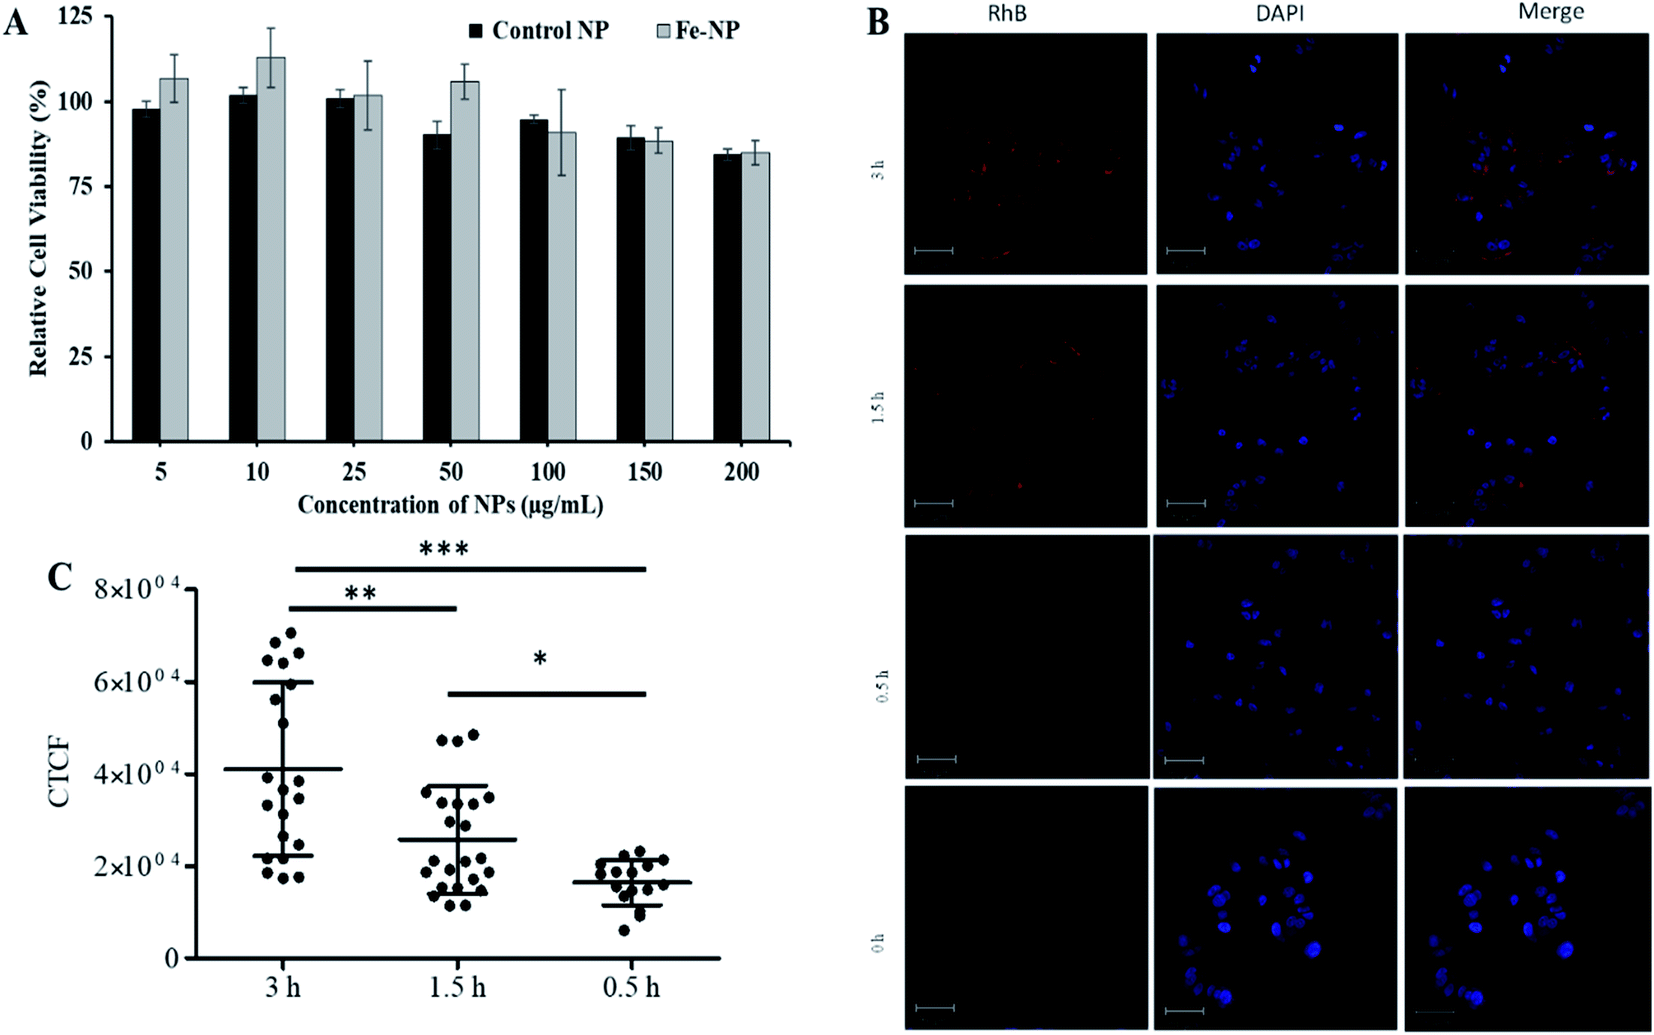 | ||
| Fig. 4 In vitro biocompatibility and cellular uptake study. (A) Concentration-dependent cytotoxicity of NPs in MCF-7 cells with 48 h incubation, (B) representative confocal images showing comparative cellular uptake of NPs after 0.5, 1.5, and 3 h incubations, and (C) fluorescent quantification of cellular uptake by measuring corrected total cell fluorescent intensity of the cell population for each treatment and group. The data were statistically analyzes using one-way ANOVA with the Mann–Whitney test. (n = ∼50 cells, mean ± sd). ns = not significant, *p-value < 0.02, **p-value < 0.0045, ***p-value < 0.0001. | ||
Assessment of magnetic properties in vitro
With the assurance of stability and safety of Fe–PLGA NPs, the MRI contrast efficiency of the nanoconstruct was evaluated by looking into the effect of paramagnetic Fe3+ ions on the magnetic relaxivity for possible applications in MRI. Fe–PLGA NPs were characterized for magnetic properties by measuring T1 and T2 as a function of Fe3+ concentrations in aqueous suspension. The T1-weighted image of Fe–PLGA NPs at different millimolar concentrations was obtained using clinical (3 T) and ultra-high-field (14.1 T) MRI, as shown in Fig. 5, while the T2-weighted images at high field are shown in Fig. S1 (ESI).† Both T1- and T2-weighted images showed a concentration-dependent higher signal intensity at higher concentrations supported by the T1 and T2 recovery curves at a particular concentration of iron as a function of recovery time (Fig. 5A, B, ESI S1A and B†). With the increase of iron concentration, the MR signal was significantly enhanced as shown in the aqueous phantom images (Fig. 5C and ESI S1A†), suggesting Fe–PLGA NPs generate a high magnetic field gradient on their surface. These nanoparticles showed a higher % signal intensity for T1-weighted images at 3 T compared to 14.1 T at all recovery time points signifying enhanced contrast properties in a lower magnetic field. A possible explanation could be the benefit of the higher field for T2 relaxivity where the ion confinement effect might influence a higher field strength that decreases the T1 relaxivity and, however, further detailed studies are required to assure this effect by changing various field strength, applied frequency, NPs size, and NPs concentration. A decrease in r1 relaxivity was also observed by Caravan et al., where authors found per ion relaxivities of Gd3+ and Mn2+ decreases respectively at 1.5, 3, and 9.4 T field strength.62 The longitudinal relaxivity (r1) or transverse relaxivity (r2) as calculated from the slope of the linear fit of the inverse of recovery time (s−1) with respect to different iron concentrations (mM) show a significant higher r1, the slope of the fitted curve in Fig. 5D, is measured to be 10.59 ± 0.32 mM−1 s−1 and 3.02 ± 0.14 mM−1 s−1 in 3.0 T and 14.1 T magnetic fields, respectively while the r2 relaxivity at 14.1 T is found to be 62.6 ± 3.2 mM−1 s−1 (ESI, Fig. S1C†). It is also worth noting here that the relaxometer used herein is a clinical (3 T) and a micro-imaging probe with 33 mm size (14 T) respectively at 25 °C and pH 7.4. It is worth mentioning that such a r1 value reaches obvious higher enhancement than the commercial agents Dotarem® (3.8 mM−1 s−1) and Magnevist® (3.1 mM−1 s−1), macrocyclic and linear clinical GBCAs, respectively in 3 T.63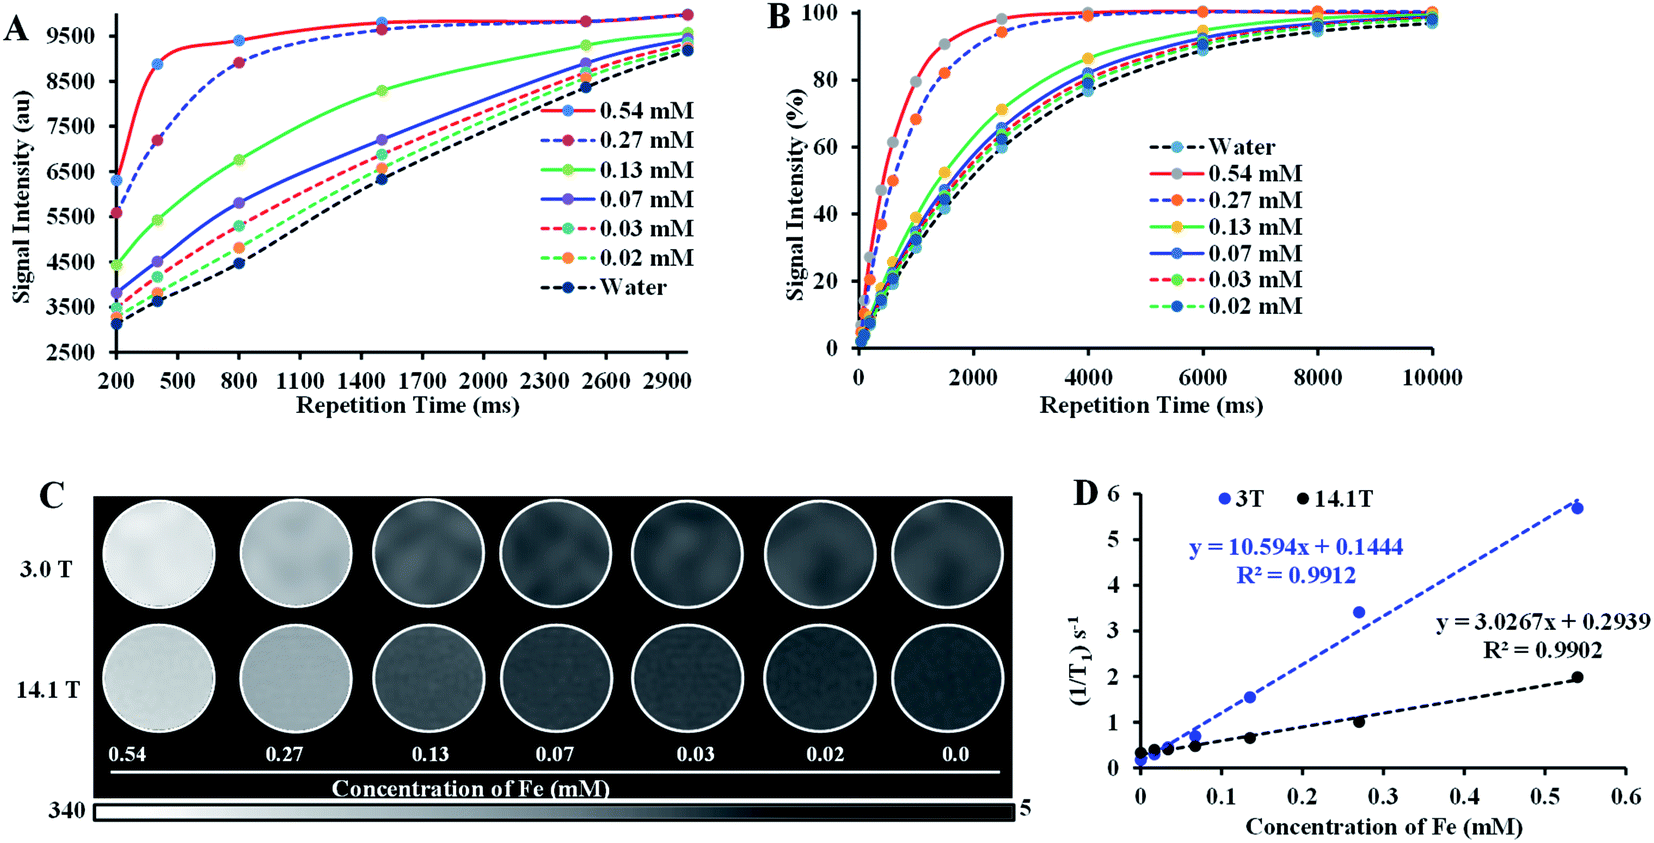 | ||
| Fig. 5 Relaxivity study of iron(III) chelated polymeric NPs in the low and ultra-high magnetic fields. (A and B) T1 recovery curve of NPs at low field (3 T) and ultra-high-field (14.1 T) as a function of iron concentration, (C) T1-weighted MR phantom images of iron(III) chelated PLGA NPs aqueous suspensions with different concentrations corresponding to recovery curves (A) and (B), and (D) T1 longitudinal relaxation rate against Fe3+ concentration measured at 3 T and 14.1 T MRI system at room temperature. Data represents mean ± S.D, n = 3. | ||
The observed significant contrast enhancement in the case of Fe–PLGA NPs formulation can be attributed to the reduction of the tumbling rate of paramagnetic metal complexes due to incorporation in a stable nanoparticulate formulation, thereby promoting effective interaction between a water molecule and paramagnetic metal complex. The field-dependent relaxivity of CAs, especially GBCAs, has been widely recognized. However, to the best of our knowledge, no such studies are being carried out for iron-based T1 CAs. As such, the low r1 relaxivity of Fe–PLGA NPs at the ultra-high-field is suggestive of the magnetic field effect affecting the rotational correlation time.62,63 This effect is well illustrated in the case of MS-325 (Gadofosveset®) where the r1 = 8.30 mM−1 s−1 and r1 = 5.14 mM−1 s−1 at 1.4 and 9.4 T, respectively.63 A similar increment in longitudinal relaxivity was reported by Liang et al., where Dotarem® showed r1 relaxivity of 4.2 mM−1 s−1 compared to 10.61 mM−1 s−1 at 3 T when incorporated into a polymeric nanoparticle system.64 Likewise, Aryal et al. also reported an increment of r1 relaxivity of Dotarem® to 19 mM−1 s−1 at 3 T after insertion in the lipid bilayer of the red blood cell membrane fused liposomal system.65
In vivo vascular imaging
With the validation of contrast enhancement and safety in vitro, the potential of Fe–PLGA NPs as Gd-free T1-weighted CAs for in vivo Ce-MRI was evaluated in the murine model. A dose of 0.02 mmol kg−1 equivalent Fe concentration of Fe–PLGA NPs in 100 μL with formulation reconstituted in saline was intravenously injected via the lateral tail vein. Dynamic MR images were acquired pre-contrast and at-injection, 10 min, 1 h, 2 h, and 3 h post-injection under a 3 T clinical scanner. Fig. 6 shows the 3D reconstruction of images acquired at injection showing maximum intensity projection with the clear enhancement of contrast at vascular lumen, especially in the abdominal aorta, when compared with the pre-contrast reconstructed image as presented in Fig. 6 and S2.† After post-injection, the MR signal at the blood vessel and surrounding tissue with the longer contrast enhancement was observed at the abdominal region but we did not observe any noticeable changes in the bladder even after 3 h post-injection. In our recent study using Gd chelated exosome (biological lipid bilayered nanoparticles) fused liposome nanoparticles, we found that Magnevist® quickly extravasate into the surrounding tissue and showed enhanced MR signal at the kidney but the exosome camouflaged nanoparticles exhibited the significantly higher contrast in heart and blood vessels with half the dose of Gd used than that of Magnevist®.49 The shorter plasma retention time of Magnevist® is well described and documented in the literature.5,20,38,40,56,60,66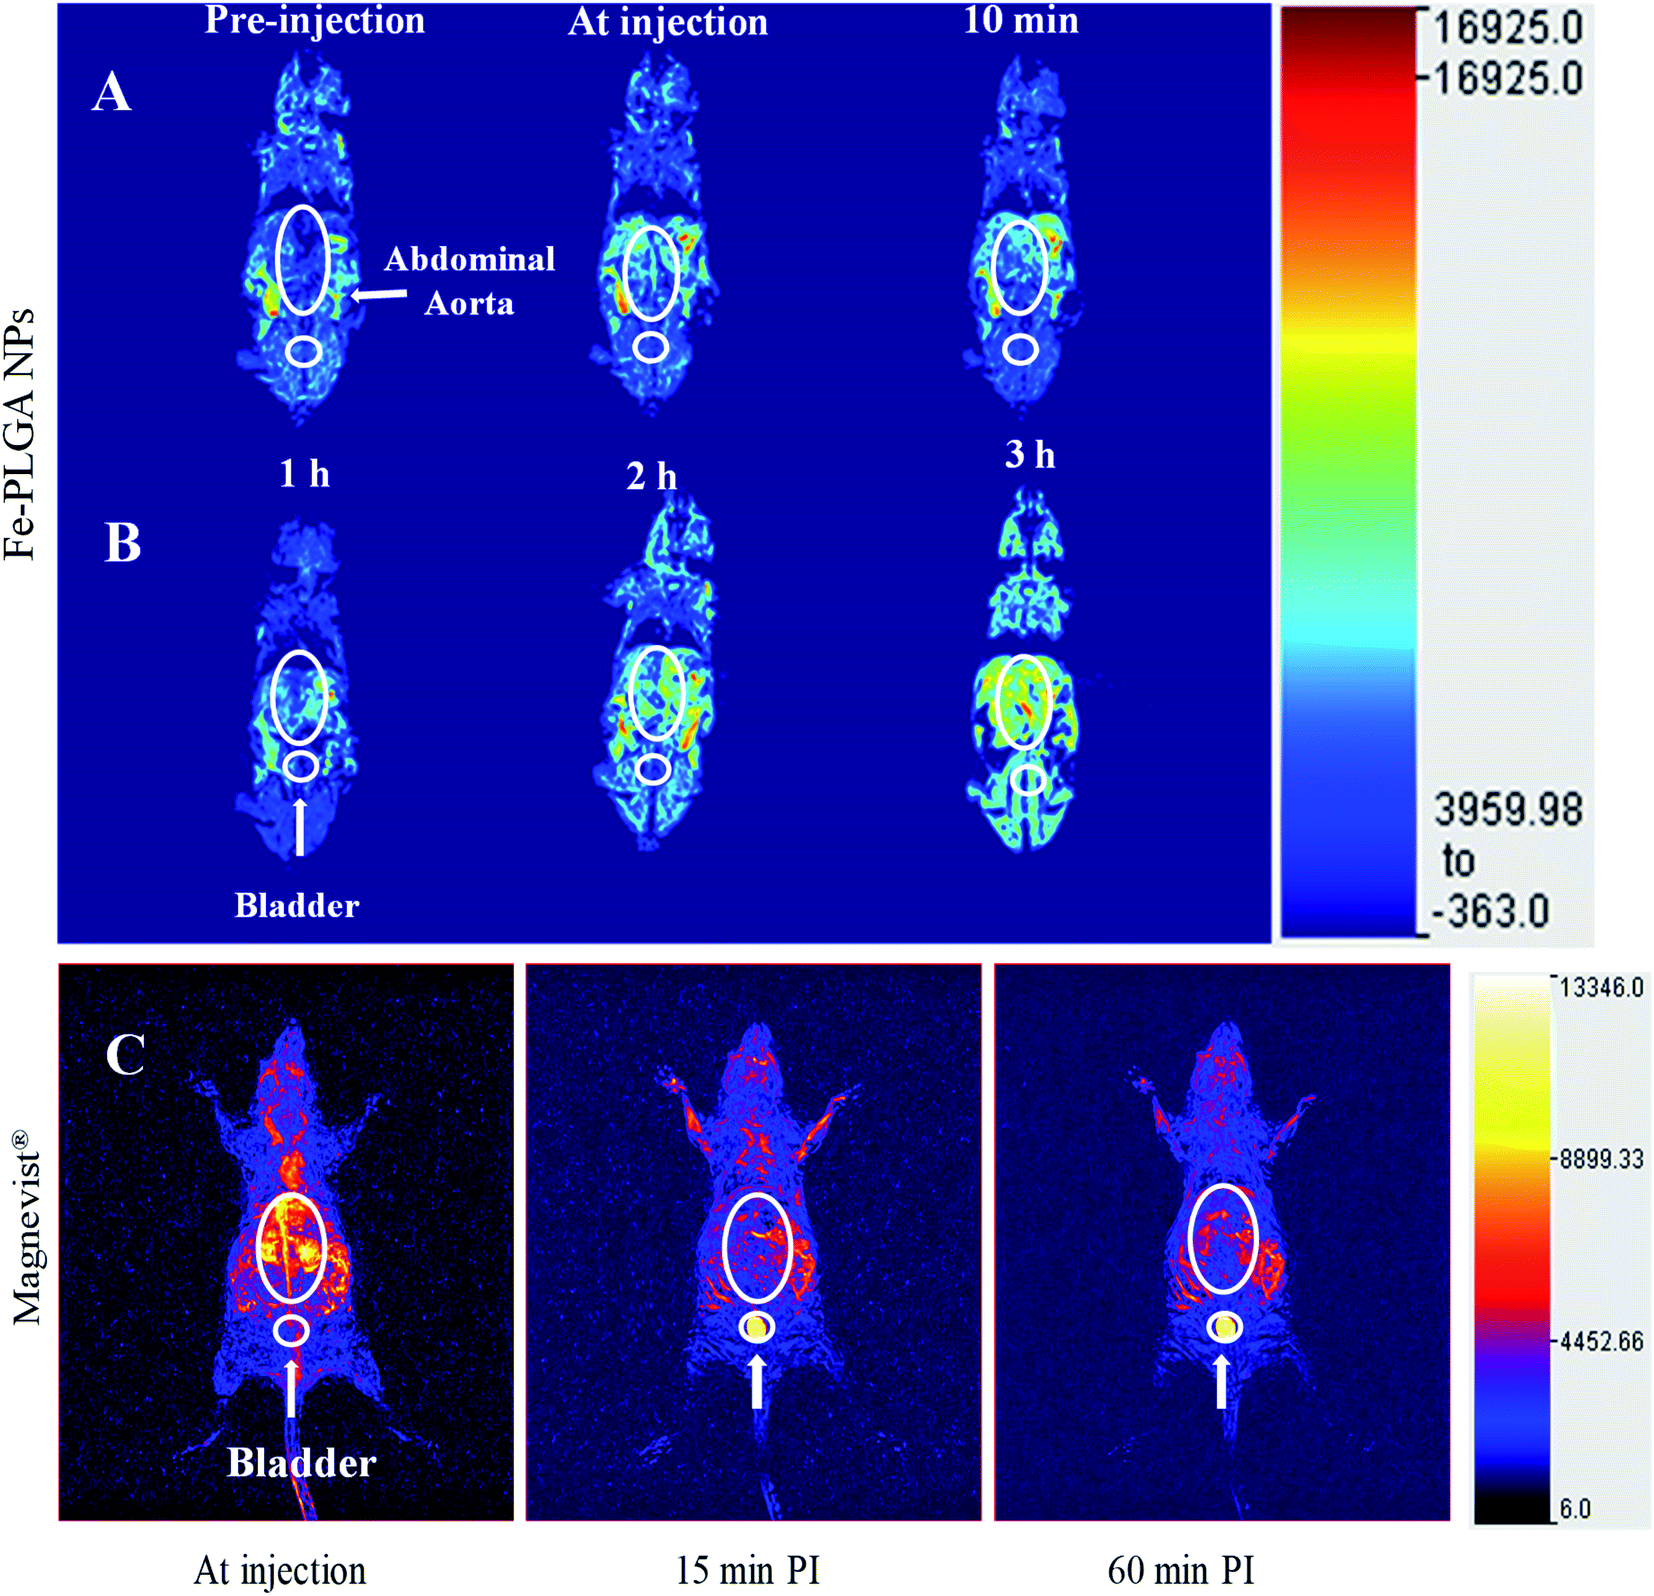 | ||
| Fig. 6 In vivo time-dependent T1-weighted magnetic resonance image of mice at 3 T. (A) A representative 3D reconstruction of images acquired at injection using maximum intensity projection with pre-injection, at-injection, and post-injection after 10 min. (B) Representative 3D reconstruction images at 1, 2, and 3 h post-injection, respectively. (C) Representative 3D reconstruction of images acquired at injection, 15 min, and 1 h post injected images of Magnevist® (equivalent Gd concentration of 0.03 mmol kg−1) from literature (ref. 49). The mice were intravenously injected with Fe–PLGA NPs (equivalent Fe concentration of 0.02 mmol kg−1). | ||
Similar to our observation of Fe–PLGA NPs, a study conducted by Young et al. has demonstrated in a smaller number of human clinical patients by using the oral dose (0.06%) of ferric chloride has significantly reduced the T1 relaxation time from 730 ms to 285 ms in the fundus of the stomach showing the promise as the bowl-labeling contrast agent for Ce-MRI.7
Considering the abundant amount of Fe3+ ions in the living body and its well-known metabolic pathways, Fe–PLGA nanoparticulate system is expected to be metabolized in living subjects. With the significantly higher T1 effect of our designed formulation compared to small molecular GBCAs and potential toxicity of Gd, our delivery system could offer an alternative platform for next-generation of iron-based nanoscale T1-weighted contrast agents for Ce-MRI. On the other hand, the traditional nanoparticulate system, for example, mesoporous silica, SPIONPs, gold nanoparticles, needs complicated multistep functionalization of ligand to chelate Gd3+ for MRI exams. Additionally, the new Fe–PLGA NPs formulation can serve the one-pot fabrication method that significantly simplifies the preparation process and reduces the heterogeneity of the resulting NPs, and can be easily scaled up for large quantities. In addition, the PLGA is an organic and biodegradable FDA-approved material for biomedical application and our delivery system showed relatively good in vivo imaging properties. All of these properties make Fe–PLGA NPs highly promising for potential clinical translation.
Conclusion
In conclusion, a biocompatible one-pot Fe3+-based CA nanoplatform was designed to provide safety with an excellent T1 contrast enhancement at the clinically relevant magnetic field. The nanoformulation facilitated the relaxivity enhancement in vivo and provided stability in a biologically identical condition. Considering the outstanding MRI performance, ease of synthesis, long-term stability, and biocompatibility, the use of Fe–PLGA NPs technology allows in vivo imaging thereby providing a safer and alternative, a Gd free, platform for Ce-MRI. Also, the facile chemistry of PLGA polymer could offer new opportunities for additional targeting ligand functionalization and drug loading; Fe–PLGA NPs has potential applications as multifunctional agents for both disease diagnosis and treatment in a single session. All of these properties make Fe–PLGA NPs highly promising for potential clinical translation.Conflicts of interest
There are no conflicts to declare.Acknowledgements
Authors thanks support from the National Institute of Biomedical Imaging and Bioengineering, National Institute of Health under grant no. 1R15EB030815-01. SA also thanks to the support from Kansas State University (KSU) during his position at KSU. The authors also thank NSF-REU-Award #1852182 for support for AM-S, and the MRI support from Dr David Biuller and Mr Scott VanAmburg, Veterinary Health Center, Department of Clinical Sciences, College of Veterinary Medicine, KSU. Authors further extend their thanks to Dr Yuntao Zhang for his help with ICP-MS training and measurements at the Analytical Core Laboratory of NICKS.References
- M. A. Ibrahim, B. Hazhirkarzar and A. B. Dublin, in StatPearls, StatPearls Publishing, Treasure Island (FL), 2020 Search PubMed.
- MRI in Practice, Wiley, 5th edn, https://www.wiley.com/en-us/MRI+in+Practice%2C+5th+Edition-p-9781119392002, accessed, April 21, 2020 Search PubMed.
- F. J. Hahn, W. K. Chu, P. E. Coleman, J. C. Anderson, C. A. Dobry, T. J. Imray, P. Y. Hahn and S. H. Lee, Radiol. Clin. North Am., 1988, 26, 717–735 CAS.
- R. Marasini, T. D. T. Nguyen and S. Aryal, Wiley Interdiscip. Rev. Nanomed. Nanobiotechnol., 2020, 12, e1580 CAS.
- J. Wahsner, E. M. Gale, A. Rodríguez-Rodríguez and P. Caravan, Chem. Rev., 2019, 119, 957–1057 CrossRef CAS PubMed.
- V. C. Pierre, M. J. Allen and P. Caravan, J. Biol. Inorg. Chem., 2014, 19, 127–131 CrossRef CAS PubMed.
- I. R. Young, G. J. Clarke, D. R. Baffles, J. M. Pennock, F. H. Doyle and G. M. Bydder, J. Comput. Assist. Tomogr., 1981, 5, 543–547 CrossRef CAS.
- T. D. Thanh Nguyen, A. Pitchaimani, C. Ferrel, R. Thakkar and S. Aryal, Nanoscale, 2018, 10, 284–294 RSC.
- G. Morana, C. Cugini, G. Scatto, R. Zanato, M. Fusaro and A. Dorigo, Cancer Imaging, 2013, 13, 350–359 CrossRef PubMed.
- A. Cervadoro, M. Cho, J. Key, C. Cooper, C. Stigliano, S. Aryal, A. Brazdeikis, J. F. Leary and P. Decuzzi, ACS Appl. Mater. Interfaces, 2014, 6, 12939–12946 CrossRef CAS PubMed.
- D. Fornasiero, J. C. Bellen, R. J. Baker and B. E. Chatterton, Invest. Radiol., 1987, 22, 322–327 CrossRef CAS PubMed.
- J. W. M. Bulte and D. L. Kraitchman, NMR Biomed., 2004, 17, 484–499 CrossRef CAS PubMed.
- J. Garcia, S. Z. Liu and A. Y. Louie, Philos. Trans. R. Soc., A, 2017, 375, 20170180 CrossRef PubMed.
- T. Grobner, Nephrol., Dial., Transplant., 2006, 21, 1104–1108 CrossRef CAS PubMed.
- W. A. High, R. A. Ayers, J. Chandler, G. Zito and S. E. Cowper, J. Am. Acad. Dermatol., 2007, 56, 21–26 CrossRef PubMed.
- M. L. Fur and P. Caravan, Metallomics, 2019, 11, 240–254 CrossRef PubMed.
- Kidney Disease Statistics for the United States, NIDDK, https://www.niddk.nih.gov/health-information/health-statistics/kidney-disease, accessed, August 11, 2020 Search PubMed.
- Center for Drug Evaluation and Research, Drug Safety and Availability – FDA Drug Safety Communication, https://www.fda.gov/Drugs/DrugSafety/ucm589213.htm, accessed, January 23, 2019 Search PubMed.
- Gadolinium-containing contrast agents, European Medicines Agency, https://www.ema.europa.eu/medicines/human/referrals/gadolinium-containing-contrast-agents, accessed, January 23, 2019 Search PubMed.
- G. Knobloch, T. Colgan, C. N. Wiens, X. Wang, T. Schubert, D. Hernando, S. D. Sharma and S. B. Reeder, Invest. Radiol., 2018, 53, 257–263 CrossRef CAS PubMed.
- C. Sun, J. S. H. Lee and M. Zhang, Adv. Drug Delivery Rev., 2008, 60, 1252–1265 CrossRef CAS PubMed.
- Z. Shen, A. Wu and X. Chen, Mol. Pharm., 2017, 14, 1352–1364 CrossRef CAS PubMed.
- P. Sharma, N. Holliger, P. H. Pfromm, B. Liu and V. Chikan, ACS Omega, 2020, 5, 19853–19860 CrossRef CAS PubMed.
- P. Sharma, P. Heinz Pfromm, B. Liu and V. Chikan, Mater. Adv., 2021, 2, 5616–5621 RSC.
- H. E. Daldrup-Link, Radiology, 2017, 284, 616–629 CrossRef PubMed.
- W. S. Enochs, P. Petherick, A. Bogdanova, U. Mohr and R. Weissleder, Radiology, 1997, 204, 417–423 CrossRef CAS PubMed.
- H. Koepsell, Expert Opin. Drug Metab. Toxicol., 2015, 11, 1619–1633 CrossRef CAS PubMed.
- Q. Ye, F. Zhou and W. Liu, Chem. Soc. Rev., 2011, 40, 4244–4258 RSC.
- Y. Li, Y. Huang, Z. Wang, F. Carniato, Y. Xie, J. P. Patterson, M. P. Thompson, C. M. Andolina, T. B. Ditri, J. E. Millstone, J. S. Figueroa, J. D. Rinehart, M. Scadeng, M. Botta and N. C. Gianneschi, Small, 2016, 12, 668–677 CrossRef CAS PubMed.
- Iron(III) complexes as contrast agents for image enhancement in magnetic resonance imaging, http://www.freepatentsonline.com/6294152.pdf, accessed, April 19, 2020 Search PubMed.
- B. de P. Cardoso, A. I. Vicente, J. B. J. Ward, P. J. Sebastião, F. V. Chávez, S. Barroso, A. Carvalho, S. J. Keely, P. N. Martinho and M. J. Calhorda, Inorganica Chim. Acta, 2015, 432, 258–266 CrossRef CAS.
- Y. Miao, F. Xie, J. Cen, F. Zhou, X. Tao, J. Luo, G. Han, X. Kong, X. Yang, J. Sun and J. Ling, ACS Macro Lett., 2018, 7, 693–698 CrossRef CAS.
- Fe-HBED Analogs: A Promising Class of Iron-Chelate Contrast Agents for Magnetic Resonance Imaging, https://www.hindawi.com/journals/cmmi/2019/8356931/, accessed, March 15, 2020 Search PubMed.
- E. Kneepkens, A. Fernandes, K. Nicolay and H. Grüll, Invest. Radiol., 2016, 51, 735–745 CrossRef CAS PubMed.
- M. Marotti, U. Schmiedl, D. White, E. Ramos, T. Johnson and B. Engelstad, Rofo, 1987, 147, 89–93 CrossRef PubMed.
- P. Boehm-Sturm, A. Haeckel, R. Hauptmann, S. Mueller, C. K. Kuhl and E. A. Schellenberger, Radiology, 2017, 286, 537–546 CrossRef PubMed.
- Q. Fan, K. Cheng, X. Hu, X. Ma, R. Zhang, M. Yang, X. Lu, L. Xing, W. Huang, S. S. Gambhir and Z. Cheng, J. Am. Chem. Soc., 2014, 136, 15185–15194 CrossRef CAS PubMed.
- A. Pitchaimani, T. D. T. Nguyen, R. Marasini, A. Eliyapura, T. Azizi, M. Jaberi-Douraki and S. Aryal, Adv. Funct. Mater., 2019, 29, 1806817 CrossRef.
- J. Abello, T. D. T. Nguyen, R. Marasini, S. Aryal and M. L. Weiss, Theranostics, 2019, 9, 2325–2345 CrossRef CAS PubMed.
- T. D. Thanh Nguyen, R. Marasini, S. Rayamajhi, C. Aparicio, D. Biller and S. Aryal, Nanoscale, 2020, 12, 4137–4149 RSC.
- G. J. Kelloff, K. A. Krohn, S. M. Larson, R. Weissleder, D. A. Mankoff, J. M. Hoffman, J. M. Link, K. Z. Guyton, W. C. Eckelman, H. I. Scher, J. O'Shaughnessy, B. D. Cheson, C. C. Sigman, J. L. Tatum, G. Q. Mills, D. C. Sullivan and J. Woodcock, Clin. Cancer Res., 2005, 11, 7967–7985 CrossRef CAS PubMed.
- L. Zhang, A. F. Radovic-Moreno, F. Alexis, F. X. Gu, P. A. Basto, V. Bagalkot, S. Jon, R. S. Langer and O. C. Farokhzad, ChemMedChem, 2007, 2, 1268–1271 CrossRef CAS PubMed.
- N. Nasongkla, E. Bey, J. Ren, H. Ai, C. Khemtong, J. S. Guthi, S.-F. Chin, A. D. Sherry, D. A. Boothman and J. Gao, Nano Lett., 2006, 6, 2427–2430 CrossRef CAS PubMed.
- J. M. Chan, L. Zhang, K. P. Yuet, G. Liao, J.-W. Rhee, R. Langer and O. C. Farokhzad, Biomaterials, 2009, 30, 1627–1634 CrossRef CAS PubMed.
- S. Aryal, C.-M. J. Hu and L. Zhang, Mol. Pharm., 2011, 8, 1401–1407 CrossRef CAS PubMed.
- R. Marasini, T. D. Thanh Nguyen, S. Rayamajhi and S. Aryal, Mater. Adv., 2020, 1, 469–480 RSC.
- T. D. T. Nguyen, S. Aryal, A. Pitchaimani, S. Park, J. Key and S. Aryal, Nanomedicine, 2019, 16, 79–87 CrossRef CAS PubMed.
- R. Marasini, A. Pitchaimani, T. D. Thanh Nguyen, J. Comer and S. Aryal, Nanoscale, 2018, 10, 13684–13693 RSC.
- S. Rayamajhi, R. Marasini, T. D. Thanh Nguyen, B. L. Plattner, D. Biller and S. Aryal, Biomater. Sci., 2020, 8, 2887–2904 RSC.
- S. Rayamajhi, J. Marchitto, T. D. T. Nguyen, R. Marasini, C. Celia and S. Aryal, Colloids Surf., B, 2020, 188, 110804 CrossRef CAS PubMed.
- S. Aryal, S. R. Bhattarai, R. B. K.C., M. S. Khil, D.-R. Lee and H. Y. Kim, Mater. Sci. Eng., A, 2006, 426, 202–207 CrossRef.
- A. Cüneyt Tas, Biomaterials, 2000, 21, 1429–1438 CrossRef.
- Y. Jun, J.-H. Lee and J. Cheon, Angew. Chem., Int. Ed., 2008, 47, 5122–5135 CrossRef CAS PubMed.
- C. C. Winterbourn, Toxicol. Lett., 1995, 82–83, 969–974 CrossRef CAS PubMed.
- K. D. Welch, T. Z. Davis, M. E. Van Eden and S. D. Aust, Free Radicals Biol. Med., 2002, 32, 577–583 CrossRef CAS PubMed.
- E. M. Snyder, D. Asik, S. M. Abozeid, A. Burgio, G. Bateman, S. G. Turowski, J. A. Spernyak and J. R. Morrow, Angew. Chem., Int. Ed., 2020, 59, 2414–2419 CrossRef CAS PubMed.
- B. P. Lee, P. b. Messersmith, J. n. Israelachvili and J. h. Waite, Annu. Rev. Mater. Res., 2011, 41, 99–132 CrossRef CAS PubMed.
- H. Zeng, D. S. Hwang, J. N. Israelachvili and J. H. Waite, Proc. Natl. Acad. Sci., 2010, 107, 12850–12853 CrossRef CAS PubMed.
- K.-Y. Ju, J. W. Lee, G. H. Im, S. Lee, J. Pyo, S. B. Park, J. H. Lee and J.-K. Lee, Biomacromolecules, 2013, 14, 3491–3497 CrossRef CAS PubMed.
- L. W. E. Starmans, M. A. P. M. Hummelink, R. Rossin, E. C. M. Kneepkens, R. Lamerichs, K. Donato, K. Nicolay and H. Grüll, Adv. Healthcare Mater., 2015, 4, 2137–2145 CrossRef CAS PubMed.
- S. Rayamajhi, T. D. T. Nguyen, R. Marasini and S. Aryal, Acta Biomater., 2019, 94, 482–494 CrossRef CAS PubMed.
- P. Caravan, J. J. Ellison, T. J. McMurry and R. B. Lauffer, Chem. Rev., 1999, 99, 2293–2352 CrossRef CAS PubMed.
- P. Caravan, C. T. Farrar, L. Frullano and R. Uppal, Contrast Media Mol. Imaging, 2009, 4, 89–100 CrossRef CAS PubMed.
- N. Richardson, J. A. Davies and B. Radüchel, Polyhedron, 1999, 18, 2457–2482 CrossRef CAS.
- S. Aryal, C. Stigliano, J. Key, M. Ramirez, J. Anderson, C. Karmonik, S. Fung and P. Decuzzi, Biomaterials, 2016, 98, 163–170 CrossRef CAS PubMed.
- R. Marasini, T. D. T. Nguyen and S. Aryal, Wiley Interdiscip. Rev. Nanomed. Nanobiotechnol., 2020, 12, e1580 CAS.
Footnote |
| † Electronic supplementary information (ESI) available. See DOI: 10.1039/d1ra05544e |
| This journal is © The Royal Society of Chemistry 2021 |