
 Open Access Article
 This Open Access Article is licensed under a Creative Commons Attribution-Non Commercial 3.0 Unported Licence
Folic acid and deoxycholic acid derivative modified Fe3O4 nanoparticles for efficient pH-dependent drug release and multi-targeting against liver cancer cells†
Xiaoyu Wanga,
Qing Maa,
Chaochao Wenb,
Tao Gong*a,
Jing Lib,
Wenting Liang *b,
Meining Lia,
Yuyao Wanga and
Rui Guo*a
*b,
Meining Lia,
Yuyao Wanga and
Rui Guo*a
aDepartment of Biochemistry and Molecular Biology, Shanxi Medical University, Taiyuan 030001, China. E-mail: gyt830626@163.com; 15834151276@139.com
bInstitute of Environmental Science, Department of Chemistry, Shanxi University, Taiyuan 030006, China. E-mail: liangwt@sxu.edu.cn
First published on 14th December 2021
Abstract
The novel nano-drug carrier (FDCA-FA-MNPs) was constructed by grafting formyl deoxycholic acid (FDCA) and folic acid (FA) on the surface of Fe3O4 magnetic nanoparticles (MNPs), possessing the advantages of superparamagnetism, good stability, low cytotoxicity and good blood compatibility. The hydrophobic anti-cancer drug doxorubicin hydrochloride (DOX) was successfully loaded onto FDCA-FA-MNPs through supramolecular interactions (hydrogen bond between FDCA and drug and hydrophobic interaction and π–π stacking between drug and drug). The drug loading amount and drug loading capacity were 509.1 mg g−1 and 33.73 wt%, respectively. In addition, drug release had a pH responsive and controllable release performance, the release rate at pH 5.3 (45.6%) was four times that at pH 7.4 (11.5%), and the tumor microenvironment was favorable for drug release. More importantly, the novel nano-drug carrier combined the hepatocellular targeting of FDCA, the cancer cell targeting of FA, and the magnetic targeting of Fe3O4, showing excellent cancer-killing efficiency (78%) in vitro. Therefore, the nano-drug carrier synthesized in this paper has potential practical application value in the targeted therapy of liver cancer.
1. Introduction
Hepatocellular carcinoma (HCC) is one of the most common malignant tumors of the digestive system in the world. On account of the main risk factors (alcohol consumption, hepatitis B and C infections and diabetes), the incidence and mortality of HCC still shows an upward tendency.1–5 At present, the common treatments of HCC include surgical resection and chemotherapy, etc. However, the traditional chemotherapy method has brought about a series of serious side effects for patients due to the lack of targeting and the high dosage of therapeutic drugs.6,7 Therefore, it is urgent to establish a drug delivery system with hepatocellular carcinoma targeting and hypotoxicity for effective treatment of hepatocellular carcinoma. In recent years, nanomaterials have been widely used in new therapeutic modes for various diseases because of their good biocompatibility and high drug loading, for example, magnetic nanomaterials (Fe3O4),8–11 graphene oxide (GO),12,13 inorganic nanomaterials (SiO2)14,15 etc. Among them, Fe3O4 magnetic nanoparticles (MNPs) have excellent superparamagnetism, good biocompatibility, chemical stability, simple preparation as well as low price, and have attracted extensive research interest in drug delivery by nanocarriers.16,17 However, Fe3O4 magnetic nanoparticles are prone to aggregation and may be oxidized due to improper storage, which greatly reduces their superparamagnetic properties and limits their applications in biomedical fields to a large extent. In recent years, researchers have reported many surface modification methods for Fe3O4 MNPs, such as polyethyleneimine,18 polyethylene glycol (PEG),19 and chitosan,20 which not only improve the dispersion and stability of Fe3O4 magnetic nanoparticles, but also enhance their biocompatibility and degradability, giving Fe3O4 magnetic nanoparticles new properties and functions.As the effective drug carrier, Fe3O4 MNPs can passively target to tumor cells through enhanced penetration and retention effects (EPR) due to their very small nanometer size.21,22 However, passive targeting alone is not sufficient to effectively enrich nanocarriers to tumor sites. Therefore, many targeting agents, such as small molecules, antibodies, peptides and aptamers, have been modified on the surface of nano agents to realize active targeting of cancer cells.23–25 Folic acid (FA), a small molecular weight vitamin, its folate receptor (FOLR) is a glycoprotein, which highly expresses in the tumor cell membrane surface but rarely expresses in the most of normal tissues. Taking advantage of the high specificity and affinity of folic acid to folic acid receptors, folic acid can be conjugated to nano-drug carrier, giving it the ability to target tumor cells and reduce nonspecific release of drugs in the bloodstream.26,27 In addition, cholic acid and its derivatives have been widely used in biomedical fields such as drug delivery and molecular recognition,28,29 due to their unique molecular structure, good biocompatibility, high stability and high reactivity of side chains. The cholic acid and its derivatives as an endogenous drug delivery carrier, can improve the stability of drug metabolism, and gives specific selectivity of drugs on the liver, to improve the bioavailability of drug, lowering drug side effects.30–32 Our previous work also proved that cholic acid (CA) can achieve good performance in hepatocellular carcinoma (HCC) treatment by its hepatocyte specificity.33 Otherwise, the triformyl cholic acid not only displays the hepatocyte specificity, but also provies the supramolecular interaction to bind with drug molecules.34
Based on these advantages above, we simultaneously modified Fe3O4 magnetic nanoparticles (MNPs) with formyl deoxycholic acid (FDCA) and folic acid (FA) to prepare the novel nano-drug carrier FDCA-FA-MNPs, and successfully loaded with hydrophobic anticancer drug doxorubicin (DOX) to form FDCA-FA-MNPs/DOX nanocomposites for effective targeted chemotherapy therapy of liver cancer (Scheme 1). Herein, this nanoparticle drug carrier had multiple hepatocellular targeting effects, including hepatocellular targeting effect of FDCA, cancer cell targeting effect of FA and magnetic targeting effect of MNPs. The hydrophobic anticancer drug doxorubicin hydrochloride (DOX) was loaded onto FDCA-FA-MNPs nano-drug carrier through supramolecular interactions (hydrogen bonding, π–π stacking and hydrophobic interaction), so as to achieve targeted delivery and controlled release of anticancer drugs. In addition, the nanocarriers could effectively target hepatocellular carcinoma cells in vitro, and showed an excellent effect of killing tumor cells, providing a promising platform for targeted chemotherapy therapy of liver cancer.
 | ||
| Scheme 1 The schematic diagram of synthesis of FDCA-FA-MNPs/DOX and the action of targeted delivery of chemotherapeutic agents to cancer cells for. | ||
2. Materials and methods
2.1 Materials
Ferric chloride hexa-hydrate (FeCl3·6H2O), ferrous chloride tetrahydrate (FeCl2·4H2O) were purchased from Tianjin Hengxing Chemical Reagent Co. Ltd. Deoxycholic acid (DCA) was purchased from Tex Ai-Huacheng Industrial Development Co. Ltd. 3-Aminopropyltriethoxysilane (APTES), dicyclohexylcarbodiimide (DCC), 4-dimethylaminopyridine (DMAP) and doxorubicin hydrochloride (DOX) were obtained from Shanghai Aladdin Biochemical Technology Co. Ltd. All other chemicals were of analytical grade, and were supplied by Beijing Chemical Reagent Co. Ltd. Phosphate Buffer Saline (PBS, pH 7.4) and Cell Counting Kit-8 (CCK8) were obtained from Boster Biological Technology Co. Ltd. Hoechst 33342 was purchased from Beyotime Biotechnology Co. Ltd. Deionized water (DI water) was obtained from PURELAB Classic UVF system (ELGA, UK).Transmission electron microscopy (TEM) images were measured on FEI Tecnai G2 F30 (Jeol, Japan). Fourier transform infrared (FTIR) spectroscopy measurements were performed by a Bruker FTIR spectrometer (INVENIO, GER). Thermogravimetric Analysis (TGA) data were proceeded on TA Instruments Q50 under flowing nitrogen atmosphere from room temperature to 800 °C. Magnetic properties were studied at room temperature by a Lakeshore 1600 vibrating sample magnetometer (VSM). X-ray diffraction (XRD) was carried out on a Bruker D8 Advance diffractometer in the 2θ range of 10–80°. UV-Vis spectra measurements were carried out on a UH5300 UV-Vis spectrophotometer (Tokyo, Japan). Fluorescence (FL) measurements were performed by the F-7000 fluorescence spectrophotometer (Tokyo, Japan). Fluorescence images were observed using the Olympus FV3000 laser scanning confocal microscope (Tokyo, Japan).
2.2 Preparation of formyl deoxycholic acid (FDCA)
Formyl deoxycholic acid was prepared following our previously work.34 Anhydrous deoxycholic acid (DCA, 3.92 g, 10 mmol) was added to a 50 mL round-bottomed flask. Then, formic acid (20 mL, 0.4 mol) was added and stirred for 6 h at 55 °C. After the reaction was completed, the excess reaction liquid was removed by rotational evaporation. A mixture of distilled water and anhydrous ethanol in the ratio of 1![[thin space (1/6-em)]](https://www.rsc.org/images/entities/char_2009.gif) :1.5 was added and heated for recrystallization. The white solid was obtained after the temperature was reduced to room temperature, which was washed by a mixture of distilled water and anhydrous ethanol in the ratio of 1:1.5 for three times and then filtered. FDCA powder was obtained after vacuum drying at 50 °C.
:1.5 was added and heated for recrystallization. The white solid was obtained after the temperature was reduced to room temperature, which was washed by a mixture of distilled water and anhydrous ethanol in the ratio of 1:1.5 for three times and then filtered. FDCA powder was obtained after vacuum drying at 50 °C.
2.3 Preparation of FDCA-MNPs
The aminated MNPs (APTES-MNPs) were synthesized based on our previously published literature (the detailed synthesis process was described in ESI†).34,35 In briefly, FDCA (5.01 g, 11 mmol) was dissolved in 10 mL anhydrous dichloromethane, DCC (2.83 g, 13 mmol) and DMAP (1.5 g, 12 mmol) were added and stirred in the ice bath for 30 min. Then, the pre-synthesized APTES-MNPs was dissolved in dichloromethane by ultrasound and added into the above solution with mechanical stirring at room temperature for 24 h. At the end of the reaction, FDCA-MNPs was obtained by washing with anhydrous ethanol for 3 times and vacuum drying at 50 °C.2.4 Preparation of FDCA-FA-MNPs
Folic acid was dissolved in 20 mL DMSO and stirred at 37 °C for 30 min. DCC (2.83 g, 13 mmol) and DMAP (1.5 g, 12 mmol) were added and stirred at 37 °C for 2 h. Then, FDCA-MNPs was dissolved in 20 mL DMSO and added into the above solution with mechanical stirring at room temperature for 24 h. At the end of the reaction, FDCA-FA-MNPs was obtained by washing with anhydrous ethanol for 3 times and vacuum drying.2.5 Drug loading and releasing performance of FDCA-FA-MNPs
The drug loading and releasing performance of FDCA-FA-MNPs for doxorubicin (DOX) were analyzed by fluorescence spectroscopy. Firstly, the fluorescence intensity of DOX solutions of different concentrations were measured at 558 nm to draw the standard fluorescence curve of DOX. Secondly, we studied the change of drug loading of FDCA-FA-MNPs over time. In short, FDCA-FA-MNPs (1 mg) was dispersed into 4 mL DOX solution (0.01 mg mL−1). Then, oscillating avoiding light under constant temperature at 200 rpm. After that, separating with a magnet at a specific point in time, and measuring the fluorescence intensity of the supernatant to draw the adsorption kinetic curve to determine its drug loading equilibrium time. In addition, the adsorption kinetic data was further analyzed by Lagergren's pseudo-first-order kinetic model and Ho's pseudo-second-order model (the equations were described in ESI†).Subsequently, we evaluated the drug loading behavior by isothermal adsorption experiment. Briefly, 1.0 mg FDCA-FA-MNPs was fully dispersed into 4 mL DOX solution with different concentrations and oscillated at room temperature for 8 h in the dark. After separating with a magnet, the supernatant was properly diluted and then its fluorescence intensity was measured at 558 nm, and the drug loading capacity (DLC) was calculated by the following formula (1). In addition, Langmuir model and Freundlich model (the equations were described in ESI†) were used to evaluate the adsorption manner of FDCA-FA-MNPs to DOX.
 | (1) |
Then, the effect of pH on drug releasing was evaluated. Briefly, 1.0 mg FDCA-FA-MNPs/DOX was dissolved in 4.0 mL PBS (pH 5.3 and pH 7.4, 0.01 M) and placed in a water bath at 37 °C for continuous oscillation at 200 rpm. Separating with a magnet at certain intervals, the supernatant was properly diluted and the fluorescence intensity was measured at 558 nm. The drug release rate under different pH was calculated by the following formula (2):
 | (2) |
2.6 Evaluation of blood compatibility and stability
The blood compatibility of FDCA-FA-MNPs was evaluated by hemolysis test in vitro. Briefly, 2.0 mL mouse blood was taken and centrifuged (4000 rpm, 30 min) to obtain red blood cells, which were washed with PBS solution for three times and diluted with PBS for 10 times. Then, 200 μL red blood cell solution was added to 1.0 mL deionized water (as a positive control), added to 1.0 mL PBS (as a negative control), and added to 1.0 mL FDCA-FA-MNPs solution (as experimental groups) with different concentrations (0.1–0.4 mg mL−1). Subsequently, incubating at 37 °C for 5 h and centrifuged at 3000 rpm for 10 min. Then, measured the absorbance of the supernatant at 541 nm and calculated the hemolysis rate according to the following formula (3):
 | (3) |
We also evaluated the stability of FDCA-FA-MNPs by comparing the UV-Vis spectra of FDCA-FA-MNPs aqueous solution before and after one month of storage.
2.7 In vitro anti-tumor evaluation
Subsequently, in order to further indirectly demonstrate the hepatocellular targeting of FDCA and the cancer cell targeting of FA in FDCA-FA-MNPs/DOX, we seeded human hepatocellular carcinoma cells (HepG2) and human normal liver cells (HL-7702) into 12-well plates at a cell density of 5 × 10⁴ per well. After cells adhering to the wall, we divided cells into four groups. Group (i) without any dispose; groups (ii–iv) replaced the old medium with fresh medium containing a certain amount of FDCA, FA, FA + FDCA, respectively. After incubating for more 1 h, FDCA-FA-MNPs/DOX was added into each group and co-cultured for 4 h. These four groups named (i) FDCA-FA-MNPs/DOX; (ii) FDCA + FDCA-FA-MNPs/DOX, (iii) FA + FDCA-FA-MNPs/DOX, (iv) FDCA + FA + FDCA-FA-MNPs/DOX, respectively. Then, the uptake of cells in each group was observed under the laser scanning confocal microscope.
 | (4) |
3. Results and discussion
3.1 Characterization of FDCA-FA-MNPs
The morphology and size distribution of bare Fe3O4 MNPs and FDCA-FA-MNPs were characterized by TEM. As shown in Fig. S1,† naked Fe3O4 MNPs were spherical with an average particle size of about 13 ± 2 nm. As the image of FDCA-FA-MNPs displayed in Fig. 1a, it could be clearly observed that there was an obvious FDCA and FA modification layer on Fe3O4 MNPs surface and the dispersion of FDCA-FA-MNPs was improved compared with Fe3O4 MNPs after the modification of FDCA and FA. The high-resolution TEM (HRTEM) image revealed that the Fe3O4 MNPs on the FDCA-FA-MNPs had a distinct lattice structure with a lattice spacing of 0.21 nm, which corresponded to the Fe3O4 (311) crystal plane (Fig. 1b). The image inserted in Fig. 1b was the electron diffraction pattern of the FDCA-FA-MNPs, it could be seen that obvious polycrystalline ring characteristics, indicating that they had a polycrystalline structure. In addition, the XRD diffraction pattern of the FDCA-FA-MNPs was showed in Fig. 1c. According to the standard XRD data cards of Fe3O4 crystal (JCPDS no. 85-1436), six characteristic peaks at 2θ = 30.31 (220), 35.53 (311), 43.15 (400), 53.57 (422), 57.17 (511), 62.83 (440) correspond to the diffraction planes of iron oxide.34–36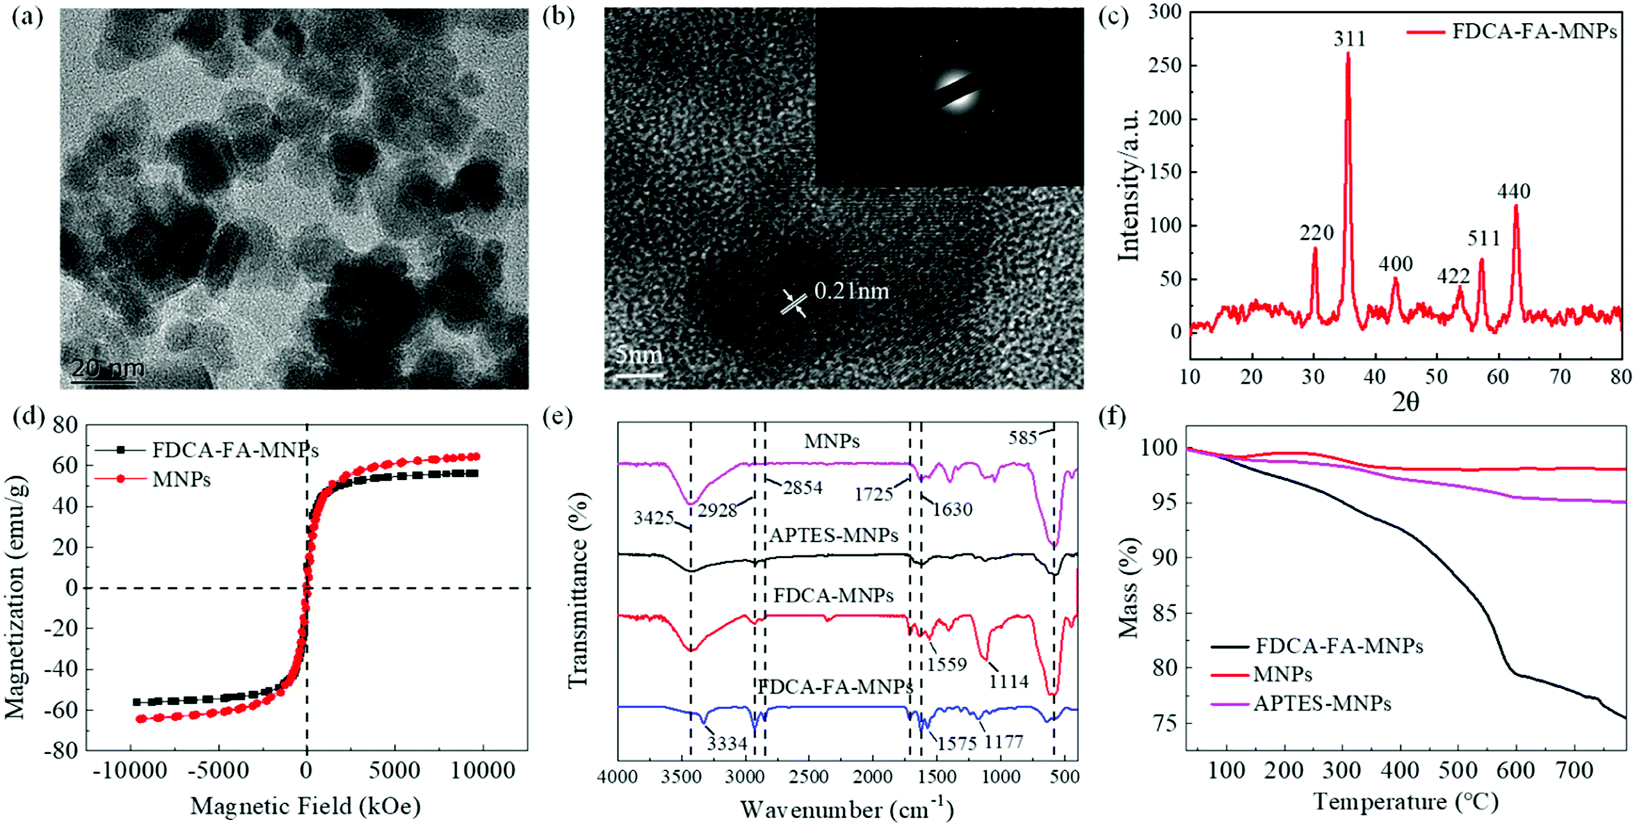 | ||
| Fig. 1 (a) Transmission electron images of FDCA-FA-MNPs; (b) the high-resolution TEM (HRTEM) image of FDCA-FA-MNPs; (c) XRD patterns of the FDCA-FA-MNPs; (d) magnetization curves of MNPs and FDCA-FA-MNPs; (e) FTIR spectra of MNPs, MNPs-APTES, FDCA-MNPs and FDCA-FA-MNPs; (f) TGA curves of MNPs, APTES-MNPs and FDCA-FA-MNPs. | ||
The hysteresis loop diagram of FDCA-FA-MNPs was showed in Fig. 1d. The magnetization curve results showed that the saturation magnetic value of FDCA-FA-MNPs was 56 emu g−1, which was slightly lower than that of Fe3O4 MNPs (64.45 emu g−1). The slight reduction can be attributed to the moderate coating of FDCA and FA.
The FTIR detection was performed to further confirm the successful synthesis of FDCA-FA-MNPs (Fig. 1e). In the FTIR spectrum, the peak at 585 cm−1 should be attributed to the Fe–O stretching band of MNPs and the peak at 3425 cm−1 is attributed to the stretching vibration of –O–H. In the FTIR spectrum of FDCA-MNPs and FDCA-FA-MNPs, the peaks at 2928 cm−1 and 2854 cm−1 are due to the –C–H stretching vibration of the FA molecule and FDCA molecule. The peaks at 1575 cm−1 and 1177 cm−1 are attributed to the stretching vibrations of –C![[double bond, length as m-dash]](https://www.rsc.org/images/entities/char_e001.gif) N and –C–C. The peaks at 1630 cm−1 and 1725 cm−1 are corresponded to the stretching vibrations of –N–H and –CO stretching vibration of the amide bond. Moreover, in the FTIR spectrum of FDCA-FA-MNPs, the peak value of peaks at 1630 cm−1 and 1725 cm−1 were enhanced, indicating that FA is successfully modified on FDCA-MNPs. The results of FTIR analysis showed that FDCA and FA were successfully modified to APTES-MNPs.
N and –C–C. The peaks at 1630 cm−1 and 1725 cm−1 are corresponded to the stretching vibrations of –N–H and –CO stretching vibration of the amide bond. Moreover, in the FTIR spectrum of FDCA-FA-MNPs, the peak value of peaks at 1630 cm−1 and 1725 cm−1 were enhanced, indicating that FA is successfully modified on FDCA-MNPs. The results of FTIR analysis showed that FDCA and FA were successfully modified to APTES-MNPs.
The successful synthesis and stability of FDCA-FA-MNPs were further demonstrated by TGA. As revealed in Fig. 1f, the weight of MNPs only lost 2.0% even after pyrolysis at 800 °C. For APTES-MNPs, the total lost mass in the whole range is 5.0%. However, the weight of FDCA-FA-MNPs lost dramatically with the increase of pyrolysis temperature, the total weight loss of which is 24.55% due to the thermal decomposition of FDCA and FA.
3.2 Drug loading efficiency of DOX on FDCA-FA-MNPs
We investigated the drug loading efficiency of FDCA-FA-MNPs by fluorescence spectroscopy. The concentration of DOX was determined by measuring the absorption at 558 nm. As shown in Fig. S2,† DOX had a good calibration curve in the concentration range of 5 × 10⁻⁴ to 5 × 10⁻³ mg mL−1 (R2 = 0.9924). Then, the loading efficiency was studied by measuring the loading quantity of DOX by FDCA-FA-MNPs over time. It was clearly seen from Fig. 2a that the whole adsorption process could be divided into three stages: (1) as the high DOX concentration at the beginning, the adsorption rate was relatively fast in the first 200 min; (2) with the decrease of DOX concentration, the adsorption rate gradually slowed down within 200–400 min; (3) the adsorption rate reached equilibrium after 400 min, and the adsorption was basically saturated. In addition, Lagergren's quasi-first-order kinetic model (eqn (S1)†) and Ho's quasi-second-order kinetic model (eqn (S2)†) were used to study the adsorption mechanism. The linear fitting curves of the two models and the kinetic parameters were showed in Fig. 2b, c and Table S1,† respectively. The results showed that the drug loading process of DOX by FDCA-FA-MNPs was well corresponded with the Ho's quasi-second-order kinetic model (R2 = 0.9994), indicating that the interaction between DOX and FDCA-FA-MNPs was dominated by chemical adsorption (hydrogen bonding, π–π stacking and hydrophobic interaction), and the qe value calculated via the Ho's quasi-second-order kinetic model was closer to the maximum drug loading of pharmacokinetics.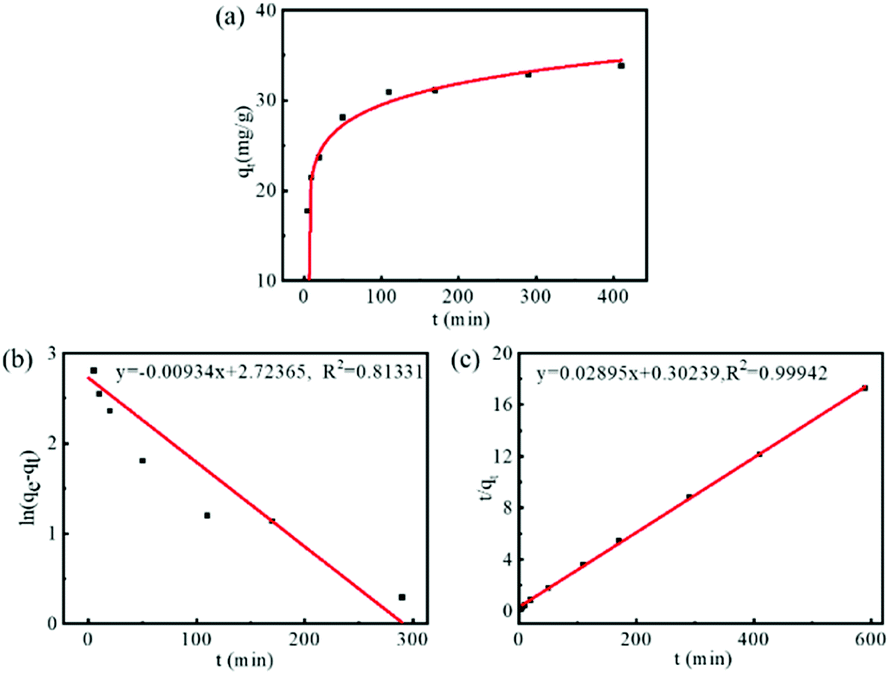 | ||
| Fig. 2 (a) The pharmacokinetic curve of DOX on FDCA-FA-MNPs; line fitting with Lagergren's quasi-first-order kinetic model (b) and Ho's quasi-second-order kinetic model (c) for adsorption kinetics. | ||
Subsequently, the adsorption isotherm of FDCA-FA-MNPs for DOX was determined under dark conditions and further evaluated with Langmuir model (eqn (S3)†) and Freundlich model (eqn (S4)†). As shown in Fig. 3a, with the increase of concentration of DOX, the drug loading of DOX on FDCA-FA-MNPs gradually raised. The drug loading amount of FDCA-FA-MNPs reached to 509.1 mg g−1 and the drug loading capacity (DLC) of FDCA-FA-MNPs was 33.73 wt%, as the initial concentration of DOX was 0.4 mg mL−1. In addition, in the HRTEM diagram of FDCA-FA-MNPs/DOX (Fig. S3†), it could be observed that there was an obvious drug layer around the FDCA-FA-MNPs, indicating that DOX was successfully loaded onto the FDCA-FA-MNPs. Afterwards, the single-layer Langmuir isotherm adsorption model and the multilayer Freundlich isotherm adsorption model were used to further analyze the drug-loading mechanism. The linear fitting of two models were showed in Fig. 3b, c and the relevant parameters of the adsorption isotherm was showed in Table S2.† The results showed that the isotherm adsorption process was more in line with the Freundlich adsorption model (R2 = 0.9944), demonstrating that the main driving force of drug loading was multiple-molecular layer adsorption.
 | ||
| Fig. 3 (a) FDCA-FA-MNPs adsorption isotherm curve for DOX; linear fitting graph with Langmuir adsorption isotherm model (b) and Freundlich absorption isotherm model (c) of FDCA-FA-MNPs for DOX. | ||
3.3 pH-stimulus triggered release of DOX from FDCA-FA-MNPs
Considering that the tumor microenvironment is slightly acidic, the release behavior of DOX from FDCA-FA-MNPs was investigated in PBS with pH 7.4 (normal tissues) and pH 5.3 (tumor tissues) at 37 °C. As displayed in Fig. 4, the release amount of DOX had a significant pH-dependent release phenomenon could be seen. Under the condition of pH 7.4, the maximum released amount of DOX was about 11.5% within 6 h. But in the pH 5.3, the release rate of DOX was fast and the released amount was up to 45.6% in 6 h, which was about four times as much that in the pH 7.4. This may be attributed to the fact that supramolecular interactions, unlike covalent bonds, are weak interactions and are easily broken in acidic environments.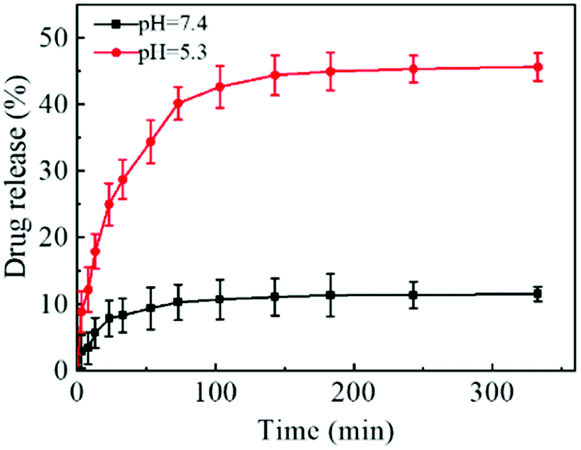 | ||
| Fig. 4 The cumulative release of DOX on FDCA-FA-MNPs in PBS buffer at pH 7.4 and pH 5.3 at 37 °C. | ||
3.4 Blood compatibility and stability
Good blood compatibility is the precondition to ensure the normal function of nanometer drug carrier in vivo.37,38 In order to evaluate its blood compatibility, hemolysis analysis was performed on FDCA-FA-MNPs. As shown in Fig. 5a, the percentage of hemolysis and the image of hemolysis showed that within a certain concentration range (0.1–0.4 mg mL−1), compared with the negative control group, there was no obvious hemolysis phenomenon in the FDCA-FA-MNPs (0.4 mg mL−1) group, indicating that our synthesized nano-drug carrier FDCA-FA-MNPs had excellent blood compatibility and could ensure its safe delivery in the body. This provided the strong evidence for the safe existence of FDCA-FA-MNPs nano-drug vector in vivo.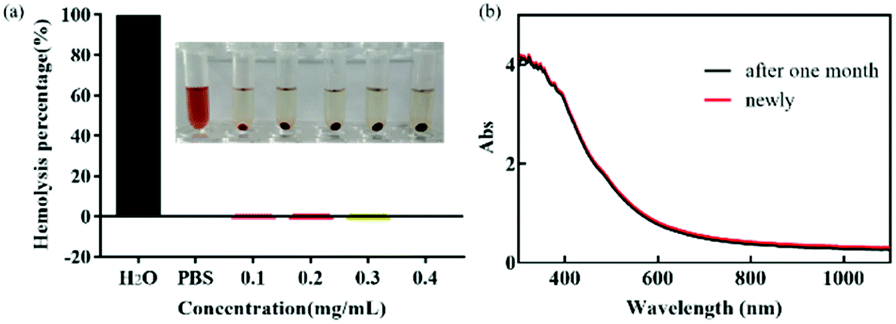 | ||
| Fig. 5 (a) The percentage of hemolysis and the corresponding hemolysis phenomenon of FDCA-FA-MNPs/DOX with concentrations of 0.1, 0.2, 0.3 and 0.4 mg mL−1, in which deionized water was used as a positive control (+), PBS solution is used as a negative control (−). Data are shown as mean ± SD (n = 3); (b) UV-Vis spectra of newly prepared FDCA-FA-MNPs aqueous solution and the aqueous solution after one month. | ||
Favourable stability is one of the essential requirements in biomedical application of nano-materials.39,40 Therefore, the UV-Vis absorption spectrum of the newly prepared FDCA-FA-MNPs aqueous solution and the aqueous solution after 1 month were observed to evaluate the stability of FDCA-FA-MNPs (Fig. 5b), and there was no significant difference in UV-Vis spectrum, indicating that FDCA-FA-MNPs was very stable over a long period of time.
3.5 Anti-tumor activity of FDCA-FA-MNPs in vitro
 | ||
| Fig. 6 (a) The uptake of FDCA-FA-MNPs/DOX into HepG2 and K150 cells at 1 h, 2 h and 4 h observed with the laser scanning confocal microscope, where the red fluorescence represents the natural fluorescence of DOX; (b) fluorescence image of HepG2 and HL-7702 incubated with FDCA-FA-MNPs/DOX, FDCA + FDCA-FA-MNPs/DOX, FA + FDCA-FA-MNPs/DOX and FDCA + FA + FDCA-FA-MNPs/DOX for 4 h (scale bar = 100 μm). | ||
In order to further verify the targeting ability of FDCA-FA-MNPs/DOX for hepatoma cell, HepG2 cells and HL-7702 cells were treated with followed four groups: (i) FDCA-FA-MNPs/DOX; (ii) FDCA + FDCA-FA-MNPs/DOX; (iii) FA + FDCA-FA-MNPs/DOX; (iv) FDCA + FA + FDCA-FA-MNPs/DOX for 4 h and through observing whether the addition of FDCA and (or) FA would inhibit the uptake of FDCA-FA-MNPs/DOX by cells to indirectly demonstrate the hepatocellular targeting of FDCA and the cancer cell targeting of FA. As shown in Fig. 6b, the HepG2 cells treated with only FDCA-FA-MNPs/DOX showed distinct red fluorescence, and almost all the cells had fluorescence signals. Generally, the FDCA could specifically bind with the bile acid transporters, and FA could combine with the over-expressed folate receptors on the surface of cancer cells. Therefore, the HepG2 cells preconditioned with FDCA or FA showed only some of the cells had weak red fluorescence. Moreover, the FDCA-FA-MNPs/DOX + FDCA + FA group showed much weaker red fluorescence, further demonstrating that the addition of FDCA and FA prominently inhibited the uptake of FDCA-FA-MNPs/DOX by HCC cells. In contrast to HepG2 cells, on account of HL-7702 cell was deficient in folate receptors, the FDCA-FA-MNPs/DOX and FA + FDCA-FA-MNPs/DOX groups showed more obvious fluorescence, while the FDCA + FDCA-FA-MNPs/DOX and FDCA + FA + FDCA-FA-MNPs/DOX groups showed much weaker fluorescence. In brief, modification with FDCA and FA could significantly enhance the targeting ability of the FDCA-FA-MNPs/DOX.
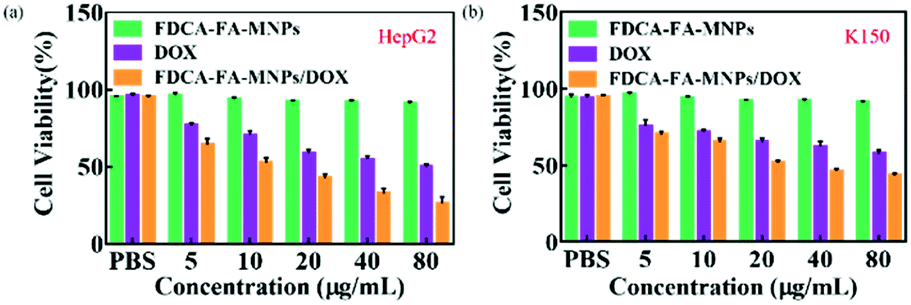 | ||
| Fig. 7 Cell survival rate of HepG2 (a); K150 (b) under treated with PBS, FDCA-FA-MNPs, DOX and FDCA-FA-MNPs/DOX (among them, the concentrations of FDCA-FA-MNPs and FDCA-FA-MNPs/DOX were 10, 20, 40 and 80 μg mL−1, respectively). | ||
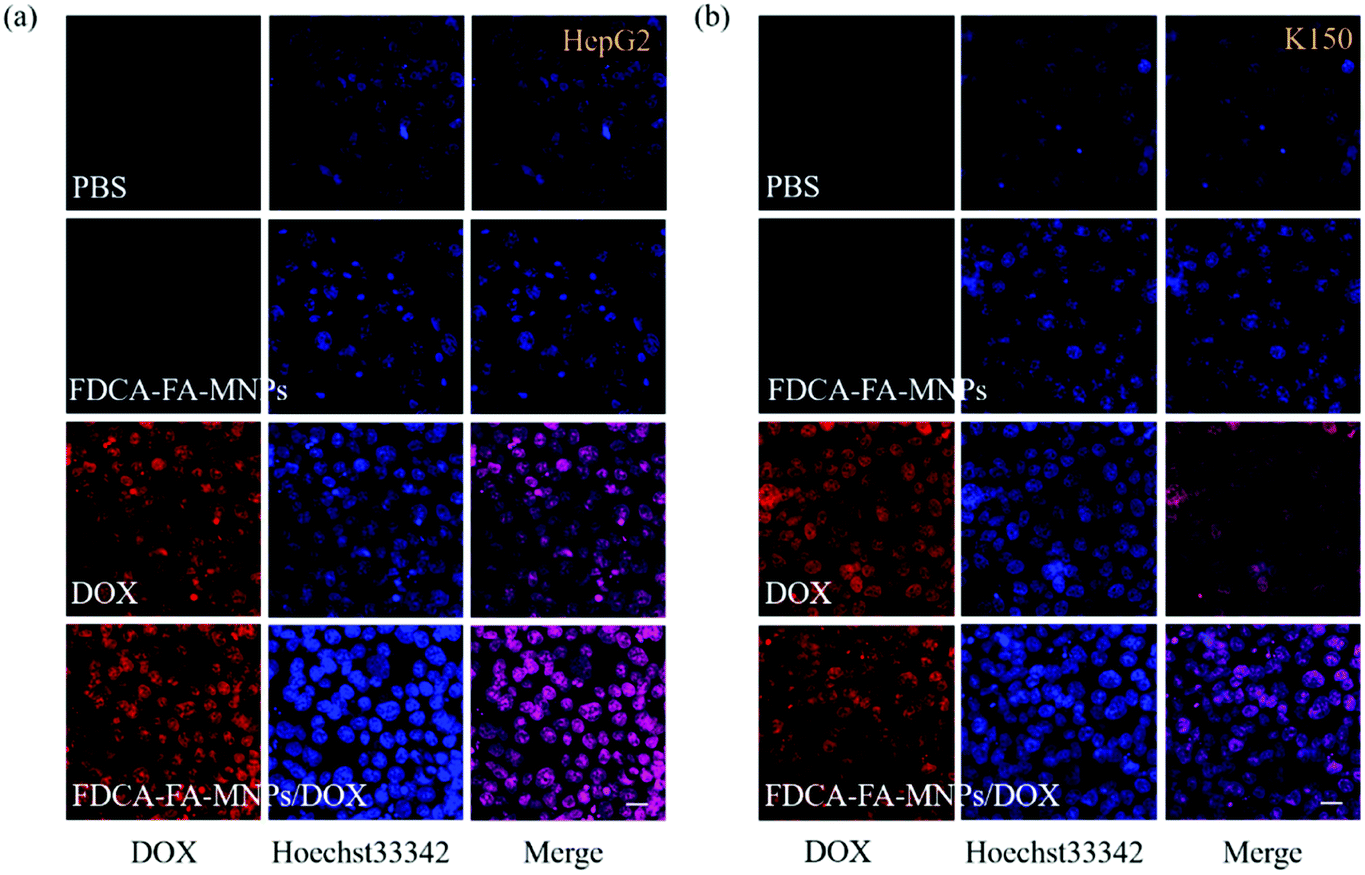 | ||
| Fig. 8 Fluorescence images of HepG2 (a), K150 (b) cells incubated with PBS, FDCA-FA-MNPs, DOX and FDCA-FA-MNPs/DOX, and stained with Hoechst 33342, weak blue fluorescence and bright blue fluorescence represent live cells and apoptotic cells, respectively (scale bar = 100 μm). | ||
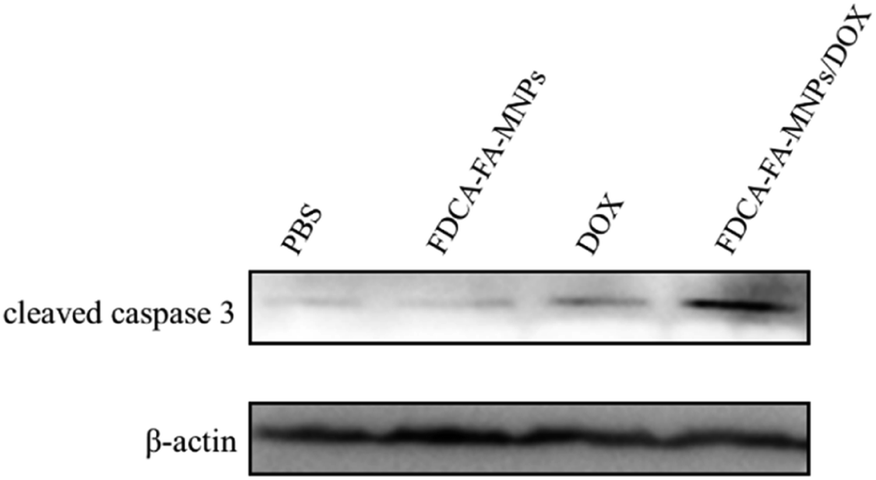 | ||
| Fig. 9 The expression of caspase-3 in HepG2 cells incubated with different formulations. | ||
4. Conclusion
In conclusion, the FDCA-FA-MNPs were successfully synthesized by co-modification of FDCA and FA on the surface of Fe3O4 nanoparticles. After loading anti-cancer drug DOX through supramolecular interactions, the nanocomplexes, FDCA-FA-MNPs/DOX have been successfully used for multi-targeted chemotherapy of liver cancer. The nanomedicine carrier has hepatocellular targeting of FDCA, cancer cell targeting of FA and magnetic targeting of Fe3O4. Multiple targeting effects are conducive to the nanomedicine carrier to accurately deliver anticancer drugs to tumor tissues and reduce the dosage of drugs. It also has a pH-responsive slow-release effect of drugs, which is beneficial to reduce the nonspecific release of drugs and the toxic and side effects of drugs on normal tissues. The nanometer drug carrier integrates multi-targeting, good blood compatibility, drug sustained release, high drug loading, good stability and low cytotoxicity, providing a new therapeutic strategy for targeted treatment of liver cancer. Moreover, we hope that FDCA-FA-MNPs/DOX can further realize the integrated diagnosis and treatment model of liver cancer through NMR combined with targeted chemotherapy.Conflicts of interest
There are no conflicts to declare.Acknowledgements
This work was financially supported by the National Natural Science Foundation of China (No. 21976113), the Key R & D projects in Shanxi Province (201903D321091), Research Project Supported by Shanxi Scholarship Council of China (2021-081), Basic Research Project of Shanxi Province (20210302123322).References
- A. M. Hamed, World Journal of Hepatology, 2015, 12, 1632–1651 Search PubMed
.
- F. L. Varol, J. Gastrointest. Cancer, 2020, 51, 1–7 CrossRef PubMed
- J. Ribes, R. Clèries and L. Esteban, et al., J. Hepatol., 2008, 49, 233–242 CrossRef CAS PubMed
- M. Mitsuru, H. Megumi and W. Ikuko, et al., Am. J. Epidemiol., 2000, 151, 131–139 CrossRef PubMed
- A. Dulskas, P. avaliauskas and K. Zagminas, et al., Int. J. Environ. Res. Public Health, 2021, 18, 1191 CrossRef PubMed
- Y. Sun, W. Zhai and X. Liu, et al., J. Nanobiotechnol., 2020, 18, 60 CrossRef CAS PubMed
- F. Zhang, Y. Jia and X. Zheng, et al., Acta Biomater., 2019, 100, 352–364 CrossRef CAS PubMed
- Y. L. Ding, S. Z. Shen and H. D. Sun, et al., Mater. Sci. Eng., C, 2015, 48, 487–498 CrossRef CAS PubMed
- D. Kim, D. W. Kim, J. Y. Jang and N. Lee, ACS Appl. Mater. Interfaces, 2020, 12, 37628–37636 CrossRef CAS PubMed
- M. Mohammadi and F. P. Aghaei, J. Biomol. Struct. Dyn., 2020, 39, 2798–2805 CrossRef PubMed
- H. Song, C. Wang and H. Zhang, et al., Colloids Surf., B, 2019, 182, 110375 CrossRef CAS PubMed
- Y. F. Yang, F. Y. Meng and X. H. Li, et al., J. Nanosci. Nanotechnol., 2019, 19, 7517–7525 CrossRef CAS PubMed
- A. Ghamkhari, S. Abbaspour and M. Talebi, et al., Int. J. Biol. Macromol., 2020, 169, 521–531 CrossRef PubMed
- Y. Yu, M. Zhou and W. Zhang, et al., Mol. Pharm., 2019, 16, 1929–1938 CrossRef CAS PubMed
- N. Theodorakis, S. F. Saravanou and N. P. Kouli, et al., Polymers, 2021, 13, 1228 CrossRef CAS PubMed
- N. K. Verma, K. Crosbie-Staunton and A. Satti, et al., J. Nanobiotechnol., 2013, 11, 1 CrossRef CAS PubMed
- S. Panja, S. Maji and T. K. Maiti, et al., ACS Appl. Mater. Interfaces, 2015, 7, 24229 CrossRef CAS PubMed
- S. L. Man, M. Li and J. Zhou, et al., Biomater. Sci., 2020, 8, 201–211 RSC
- J. Varshosaz, A. J. Dehkordi and S. Setayesh, Pharm. Dev. Technol., 2016, 22, 1–13 Search PubMed
- X. Li, J. Feng and R. Zhang, et al., J. Biomed. Nanotechnol., 2016, 12, 948–961 CrossRef CAS PubMed
- S. Rajkumar and M. Prabaharan, Curr. Top. Med. Chem., 2017, 17, 1858–1871 CrossRef CAS PubMed
- L. Song, F. Zang, M. Song, G. Chen, Y. Zhang and N. Gu, J. Nanosci. Nanotechnol., 2015, 15, 4111–4118 CrossRef CAS PubMed
- A. B. Shreya, S. Y. Raut and R. S. Managuli, et al., AAPS PharmSciTech, 2019, 20, 15 CrossRef PubMed
- X. Geng, D. Gao and D. Hu, et al., ACS Appl. Mater. Interfaces, 2020, 12, 55624–55637 CrossRef CAS PubMed
- Y. Xu, H. Wu and J. Huang, et al., Theranostics, 2020, 10, 2479–2494 CrossRef CAS PubMed
- S. B. Ghaffari, M. H. Sarrafzadeh and Z. Fakhroueian, et al., Mater. Sci. Eng., 2019, 103, 109827.1–109827.15 Search PubMed
- P. Sun, Z. Nan and Y. Tang, et al., Int. J. Nanomed., 2017, 12, 2657–2672 CrossRef CAS PubMed
- M. Paquette, S. Beaudoin and M. A. Tremblay, et al., Bioconjugate Chem., 2018, 29, 1352–1363 CrossRef CAS PubMed
- L. Ying and C. Zhu, Int. J. Nanomed., 2017, 12, 1673–1684 CrossRef PubMed
- J. T. Zhang, C. J. Yu and G. Q. Jiang, J. Biomater. Sci., Polym. Ed., 2016, 27, 865–879 CrossRef CAS PubMed
- M. W. Amjad, M. Amin and H. Katas, et al., Mol. Pharm., 2015, 12, 4247–4258 CrossRef CAS PubMed
- Q. Shan, J. B. Wu and X. C. Wu, et al., Arch. Pharm., 2010, 342, 513–520 Search PubMed
- C. C. Wen, R. N. Cheng, T. Gong, Y. Huang, D. Li, X. H. Zhao, B. F. Yu, D. Su, Z. L. Song and W. T. Liang, Colloids Surf., B, 2021, 199, 111510 CrossRef CAS PubMed
- T. Gong, R. N. Cheng, X. Y. Wang, J. Li, W. T. Liang, Z. H. Wei, S. M. Shuang, Y. Y. Wang and R. Guo, New J. Chem., 2021, 45, 6880–6888 RSC
- T. Gong, Y. H. Zhou, L. L. Sun, W. T. Liang, J. Yang, S. M. Shuang and C. Dong, RSC Adv., 2016, 6, 80955–80963 RSC
- W. T. Liang, Y. Huang, D. Lu, X. Ma, T. Gong and X. Cui, et al., Polymers, 2019, 11, 133 CrossRef PubMed
- Y. J. Lu, P. Y. Lin and P. H. Huang, et al., Nanomaterials, 2018, 8, 193 CrossRef PubMed
- H. Zhang, Y. Li and Z. Pan, et al., Mol. Pharm., 2019, 16, 1982–1998 CrossRef CAS PubMed
- S. W. Jun, P. Manivasagan and J. Kwon, et al., Int. J. Biol. Macromol., 2020, 155, 961–971 CrossRef CAS PubMed
- F. Inoue, H. Philipsen and A. Radisic, et al., J. Electrochem. Soc., 2012, 159, 437–441 CrossRef
Footnote |
| † Electronic supplementary information (ESI) available: Transmission electron images of Fe3O4 MNPs. Plot of calibration curves for DOX solution. High-resolution transmission electron images of FDCA-FA-MNPs/DOX. Cell viability of HL-7702 under treated with PBS, FDCA-FA-MNPs, DOX and FDCA-FA-MNPs/DOX. The pharmacokinetic parameters of DOX on FDCA-FA-MNPs. Related parameters of Langmuir isotherm and Freundlich isotherm adsorption models for DOX by FDCA-FA-MNPs. See DOI: 10.1039/d1ra05874f |
| This journal is © The Royal Society of Chemistry 2021 |