 Open Access Article
Efficient coupling of MnO2/TiN on carbon cloth positive electrode and Fe2O3/TiN on carbon cloth negative electrode for flexible ultra-fast hybrid supercapacitors†
Mai Li *a,
Kailan Zhua,
Zheyi Meng*b,
Ruihua Hua,
Jiale Wanga,
Chunrui Wang
 a and
Paul K. Chu
 b
b
aCollege of Science, Donghua University, Shanghai 201620, China. E-mail: limai@dhu.edu.cn
bState Key Laboratory for Modification of Chemical Fibers and Polymer Materials, College of Material Science, Donghua University, Shanghai 201620, China. E-mail: mengzheyi@dhu.edu.cn
cDepartment of Physics, Department of Materials Science and Engineering, Department of Biomedical Engineering, City University of Hong Kong, Tat Chee Avenue, Kowloon, Hong Kong, China
First published on 4th November 2021
Abstract
Recent research and development of energy storage devices has focused on new electrode materials because of the critical effects on the electrochemical properties of supercapacitors. In particular, MnO2 and Fe2O3 have drawn extensive attention because of their low cost, high theoretical specific capacity, environmental friendliness, and natural abundance. In this study, MnO2 ultrathin nanosheet arrays and Fe2O3 nanoparticles are fabricated on TiN nanowires to produce binder-free core–shell positive and negative electrodes for a flexible and ultra-fast hybrid supercapacitor. The MnO2/TiN/CC electrode shows larger pseudocapacitance contributions than MnO2/CC. For example, at a scanning rate of 2 mV s−1, the pseudocapacitance contribution of MnO2/TiN/CC is 87.81% which is nearly 25% bigger than that of MnO2/CC (71.26%). The supercapacitor can withstand a high scanning rate of 5000 mV s−1 in the 2 V window and exhibits a maximum energy density of 71.19 W h kg−1 at a power density of 499.79 W kg−1. Even at 5999.99 W kg−1, it still shows an energy density of 31.3 W h kg−1 and after 10![[thin space (1/6-em)]](https://www.rsc.org/images/entities/char_2009.gif) 000 cycles, the device retains 81.16% of the initial specific capacitance. The activation mechanism is explored and explained.
000 cycles, the device retains 81.16% of the initial specific capacitance. The activation mechanism is explored and explained.
1. Introduction
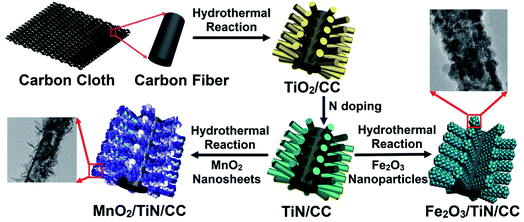
Electrochemical supercapacitors have attracted much attention because of the rapid recharging ability, high power density, environment friendliness, and potential to bridge the gap between high-power devices and lithium-ion batteries.1,2 Recent research has focused on new electrode materials and their critical influence on the electrochemical properties of supercapacitors. Among the various types of electrode materials, manganese oxide (MnO2) is especially interesting because of the low cost, high theoretical specific capacity (1370 F g−1), environmental benignity, and natural abundance boding well for rechargeable lithium-ion batteries and supercapacitors.3–5 However, nanocrystalline MnO2 suffers from low specific capacitance and rate capability because of the low electrical conductivity (10−5 to 10−6 S cm−1)6 as well as severe aggregation and volume expansion during electrochemical reactions consequently limiting practical applications.7One possible means to improve the electrical conductivity and specific area of MnO2 is to produce nanostructured MnO2 thin films on conductive carbon-based materials, nanowires, nanosheets, or conductive polymers, for example, MnO2/nitrogen-doped carbon,8 N + MnO2@TiC/CC,9 MnO2/CuCo2O4,10 and γ-MnO2/PANI.11 In this work, a novel composite structure composed of MnO2 ultrathin nanosheet is prepared on the TiN nanowire array on a piece of conductive carbon cloth (MnO2/TiN/CC) to form a binder-free and flexible positive electrode for supercapacitors as shown in Fig. 1 of the preparation process and structure of electrodes. The nanostructured array of TiN with a small diameter prepared on conductive carbon cloth (TiN/CC) has distinctive advantages such as short diffusion lengths of ions in the electrolyte, excellent substrate conductivity, large surface area, and loading of a large amount of active materials, consequently resulting in improved charging–discharging rates as well as energy and power densities.12,13
In order to complement the MnO2 positive electrode in the asymmetrical hybrid supercapacitor, nanoscale Fe2O3 is deposited on TiN/CC to form the Fe2O3/TiN/CC as the negative electrode. Fe2O3 has advantages similar to MnO2 such as natural abundance, multiple morphologies, crystallographic modification, high thermal stability, and most importantly, high theoretical specific capacity of 3000 F g−1.14 Unfortunately, Fe2O3 also suffers from poor electrical conductivity leading to low capability and cycling stability. Herein, Fe2O3 nanoparticles are prepared on TiN nanowires to form a core–shell structure to solve the problems that plague Fe2O3 in the redox reaction. The asymmetrical hybrid supercapacitor comprising the MnO2/TiN/CC positive electrode and Fe2O3/TiN/CC negative electrode is demonstrated to have excellent properties in 1 M Na2SO4 electrolyte and the enhancement mechanism is investigated.
2. Materials characterization and electrochemical evaluation
2.1 Materials characterization
The morphology, microstructure, elemental composition, and elemental distributions were characterized by scanning electron microscopy (SEM, JEOL JSM-7001F, Japan) and energy-dispersive X-ray spectroscopy (EDS). The crystal structure was examined by X-ray diffraction (XRD, Rigaku, RINT2000, Japan) and the elemental composition and chemical states were determined by X-ray photoelectron spectroscopy (XPS, Kratoms Axis Ultra DLD). Transmission electron micrographs (TEM) were taken on the JEOL (JEM-2000 FX) microscope at 200 kV.2.2 Electrochemical measurements
The CHI660E electrochemical workstation was used in the electrochemical assessment. Using 1.0 M Na2SO4 as the electrolyte, CC, MnO2/CC, TiN/CC, MnO2/TiN/CC, or Fe2O3/TiN/CC was the working electrode, whereas the saturated calomel electrode and platinum wire were the reference electrode and counter electrodes, respectively. Galvanostatic charging–discharging (GCD), cyclic voltammetry (CV), and electrochemical impedance spectroscopy (EIS) were carried out to determine the electrochemical properties of the electrodes.The specific capacitance of the electrode Cs is determined by eqn (1) and the energy (E) and power (P) densities are determined by eqn (2) and (3):15
 | (1) |
 | (2) |
 | (3) |
3. Experimental details
3.1 Materials synthesis
Analytical grade chemicals were used without further purification. A piece of carbon cloth (20 × 20 cm2 size) was cleaned by a nitrogen plasma using a power of 200 W for 10 minutes under vacuum. Subsequently, 0.45 ml of titanium butoxide and 15 titanium butoxide were added to 15 ml of deionized water. The solution was placed in a 50 ml Teflon steel autoclave together with a piece of clean carbon cloth (2 × 2 cm2). After the reaction at 150 °C for 24 h, the product was kept warm for 1 h at 450 °C to form TiO2/CC.16 The TiN NTAs were prepared by annealing the TiO2 nanotube arrays in ammonia to form the TiN/CC.17 The prepared TiN/CC was cut into 0.5 cm2 and weighed for the following experiments.The MnO2 nanosheets were fabricated on TiN/CC hydrothermally. 1 mmol KMnO4 and 1.2 mmol H2SO4 were dissolved in 20 ml of deionized water and stirred for 30 min. The solution containing TiN/CC were transferred to a Teflon-sealed stainless-steel autoclave and heated to 180 °C for 8 h. After cooling to room temperature, the sample was taken out, washed with deionized water, and dried at 60 °C for 10 h. MnO2/CC was also prepared by a similar method as MnO2/TiN/CC, except that TiN/CC was replaced by CC with the area of 0.5 cm2.
Fe2O3 was also fabricated on TiN/CC to form the negative electrode. 1 mmol ferric nitrate was added to 15 mmol urea and the solution put in a reactor with the TiN/CC placed in front. The hydrothermal reaction proceeded for 8 hours at 120 °C followed by natural cooling. The Fe2O3/TiN/CC electrode was formed by rinsing with deionized water and ethanol and dried at 60 °C for 10 h.
3.2 Fabrication of the asymmetrical hybrid supercapacitor
The asymmetrical hybrid supercapacitor was assembled with the MnO2/TiN/CC and Fe2O3/TiN/CC electrodes separated by a polyethylene (PE) membrane. The PE membrane was pretreated and dipped in NaSO4 for 10 min and assembled with the electrodes in a CR2032 battery case in 1 M NaSO4 electrolyte. Galvanostatic charging–discharging (GCD), cyclic voltammetry (CV), and electrochemical impedance spectroscopy (EIS) were carried out to determine the electrochemical properties of the electrodes.4. Results and discussion
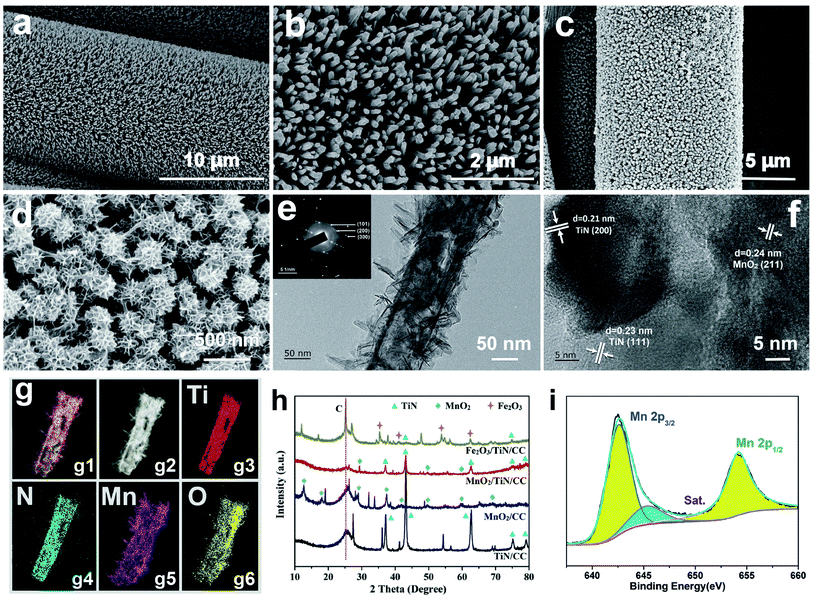
Fig. 2(a)–(d) and S1† depict the SEM images of TiN/CC and MnO2/TiN/CC at different magnifications. The TiN nanowires with an average diameter of 100 nm are distributed uniformly and densely on the carbon cloth forming a cross-linked porous conductive framework boding well for rapid electron and ion transfer. Fig. 2(c) and (d) show the SEM images of MnO2/TiN/CC at different magnifications. The MnO2 nanosheets and TiN nanowires form core–shells with a diameter of about 300 nm that adhere firmly to the carbon cloth. This special structure is expected to expedite adsorption, desorption, and migration of ions in the electrochemical redox process. The TEM images of the MnO2/TiN core–shell structure at different magnifications are displayed in Fig. 2(e) and (f). The lattice spacings of 0.24 nm, 0.21 nm, and 0.23 nm correspond to the (211) plane of MnO2, (200) plane of TiN, and (111) plane of TiN, respectively. The SAED pattern (inset in Fig. 2(e)) shows that the radii of the three diffraction rings are 0.24, 0.22, and 0.14 nm, corresponding to the (101), (200) and (300) planes of MnO2, respectively, and MnO2 is not a single crystal. A regular lattice structure around the diffraction ring of MnO2 can also be observed indicating the SAED pattern of TiN.15 The core–shell composed of MnO2 nanosheets and TiN nanotubes is confirmed by the elemental maps of MnO2/TiN in Fig. 2(g1) and (g2) and the elemental distributions are presented in Fig. 2(g3)–(g6). Nitrogen as a dopant is found uniformly on TiN and MnO2 with a petal structure and evenly deposited on the surface of the TiN nanowires.Fig. 2(h) shows the XRD diffraction patterns of TiN/CC, MnO2/CC, MnO2/TiN/CC, and Fe2O3/TiN/CC. The C peak at 25.74° and TiN peaks at 36.66°, 42.59°, 61.81°, 74.07°, and 77.96° can be indexed to PDF#38-1420 corroborating the TiN/CC structure. The peaks at 28.84°, 49.86°, and 60.27° stem from α-MnO2 in MnO2/CC and MnO2/TiN/CC according to PDF#44-0141. The XRD patterns of Fe2O3 prepared on the carbon cloth with and without TiN are displayed as yellow lines in Fig. 2(h). Both samples exhibit peaks of Fe2O3 at 35.61°, 40.85°, 54.09°, and 62.45°corresponding to the (110), (113), (116) and (214) planes of α-Fe2O3 (PDF#33-0664), respectively.18 The peak of TiN is not particularly obvious because MnO2 or Fe2O3 covers the surface of the materials. Fig. 2(i) shows the XPS Mn 2p spectrum of MnO2/TiN/CC revealing peaks at 642.5 eV and 654.2 eV which represent Mn 2p3/2 and Mn 2p1/2 of MnO2, respectively. The satellite peak (sat) is related to α-MnO2 consistent with previous results further confirming formation of MnO2. Fig. S3(a)† shows the XPS Fe 2p spectrum of Fe2O3/TiN/CC. There are two Fe 2p peaks at 710.86 eV and 724.58 eV related to Fe 2p3/2 and Fe 2p1/2 in α-Fe2O3.19
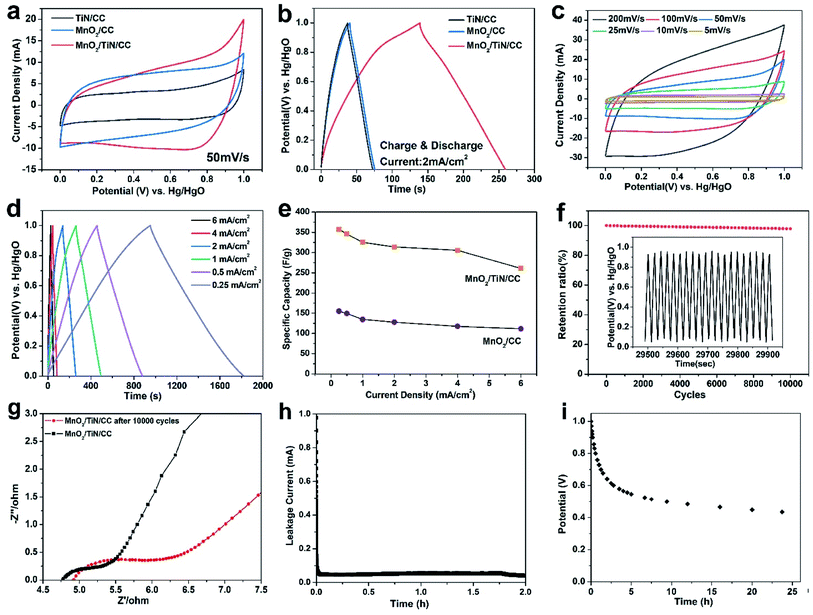
As shown in Fig. 3(a) and (b), the electrochemical properties of MnO2/CC and TiN/CC are similar, whereas MnO2/TiN/CC shows the largest CV area and longest discharging time compared to MnO2/CC and TiN/CC. According to the mass difference of substances before and after the deposition of MnO2 as the active material, it can be calculated that the MnO2 loading of MnO2/CC is 0.58 mg cm−2 and the MnO2/TiN/CC is 0.76 mg cm−2. The discharging time of MnO2/TiN/CC at a current density of 2 mA cm−2 is 120.2 s, but TiN/CC and MnO2/CC show discharging time of only 35 s and 34.8 s, respectively. According to GCD results in Fig. 3(b), the total MnO2 loading and eqn (1), the specific capacity of MnO2/TiN/CC at 2 mA cm−2 is 318.41 F g−1, which is 2.7 times bigger than that of MnO2/CC (120.5 F g−1). Hence, the multi-component core–shell structure plays an important role in the properties of the MnO2-based electrode. Fig. 3(c) shows the CV curves of MnO2/TiN/CC from 5 mV s−1 to 200 mV s−1. The CV curves exhibit a rectangular shape and there is an obvious redox peak suggesting that the specific capacitance is mainly due to the Faraday pseudo capacitance. As the scanning rate goes up, the redox peak gradually shifts to the middle indicating fast ion embedding rates. Hence, MnO2/TiN/CC not only increases the loading amount of MnO2, but also improves the contact area between MnO2 and the electrolyte.
The GCD curves of MnO2@TiN/CC acquired at current densities from 0.25 mA cm−2 to 6.0 mA cm−2 are displayed in Fig. 3(d) and (e) shows the corresponding specific capacitances of MnO2@TiN/CC and MnO2/CC. The GCD curves show a similar shape resembling an isosceles triangle with good symmetry, which indicates that the electrode has good reversibility and high coulomb efficiency. According to Fig. 3(d) and S2†(b), the loading mass of MnO2 and eqn (S1),† the specific capacitances of MnO2/TiN/CC are 365.37 F g−1, 352.83 F g−1, 330.64 F g−1, 318.41 F g−1, 309.87 F g−1, and 261.83 F g−1 at current densities of 0.25 mA cm−2, 0.5 mA cm−2, 1 mA cm−2, 2 mA cm−2, 4 mA cm−2, and 6 mA cm−2, respectively. In comparison, MnO2/CC shows capacitances of 155.66 F g−1, 147.82 F g−1, 127.87 F g−1, 118.34 F g−1, 104.22 F g−1, and 95.82 F g−1 at current densities of 0.25 mA cm−2, 0.5 mA cm−2, 1 mA cm−2, 2 mA cm−2, 4 mA cm−2, and 6 mA cm−2, respectively. In order to analyze the change of specific capacity with current density more clearly, the specific capacity of the above two electrodes are drawn in Fig. 3(e). Fig. 3(f) shows the stability of the MnO2@TiN/CC electrode after 10![[thin space (1/6-em)]](https://www.rsc.org/images/entities/char_2009.gif) 000 cycles. The specific capacitances of MnO2@TiN/CC at a current density of 3 mA cm−2 before cycling is 310.7 F g−1 and after 10
000 cycles. The specific capacitances of MnO2@TiN/CC at a current density of 3 mA cm−2 before cycling is 310.7 F g−1 and after 10![[thin space (1/6-em)]](https://www.rsc.org/images/entities/char_2009.gif) 000 cycles, it increases by only 2.1% to 304.2 F g−1. The impedance data of the MnO2@TiN/CC before and after 10
000 cycles, it increases by only 2.1% to 304.2 F g−1. The impedance data of the MnO2@TiN/CC before and after 10![[thin space (1/6-em)]](https://www.rsc.org/images/entities/char_2009.gif) 000 cycles are presented in Fig. 3(g). The Nyquist curves exhibit an arc in the high frequency region and an oblique line in the low frequency regime. In the high frequency region, the intersection points between the semicircle and Z′ axis changes from 4.75 Ω to 4.92 Ω, indicating that MnO2 dissolves continuously and the solution impedance increases with cycling. The diameter of the semicircle in the Nyquist plots increases with cycling as well. Before cycling, the end of the semicircle is about 5.3 Ω and after 10
000 cycles are presented in Fig. 3(g). The Nyquist curves exhibit an arc in the high frequency region and an oblique line in the low frequency regime. In the high frequency region, the intersection points between the semicircle and Z′ axis changes from 4.75 Ω to 4.92 Ω, indicating that MnO2 dissolves continuously and the solution impedance increases with cycling. The diameter of the semicircle in the Nyquist plots increases with cycling as well. Before cycling, the end of the semicircle is about 5.3 Ω and after 10![[thin space (1/6-em)]](https://www.rsc.org/images/entities/char_2009.gif) 000 cycles, it changes to 6.4 Ω. Furthermore, with increasing GCD cycles, the slope of low frequency region decreases, implying that the electrochemical performance worsens gradually.
000 cycles, it changes to 6.4 Ω. Furthermore, with increasing GCD cycles, the slope of low frequency region decreases, implying that the electrochemical performance worsens gradually.
For practical applications, it is important to evaluate the leakage current and self-discharge performance to analyze the properties of the fabricated pseudocapacitive electrode.20 In order to obtain the leakage current of the electrode, the MnO2/TiN/CC is charged to 1 V under the current of 2 mA, and then a current flowing as the leakage current is applied to the electrode to keep the electrode potential at 1 V. Fig. 3(h) shows the curve of leakage current, which indicate that the leakage current drops to 0.048 mA in a short time and remains stable in the next two hours. The leakage current of our electrode is smaller than the a-NENCs electrode in 0.5 M K2SO4 electrolyte (0.08 mA),21 Ni–Mn LDH/MnO2 in 0.5 M Na2SO4 electrolyte (0.34 mA, after the unit conversion)22 and 3D-NCS-3//N-rGO device (0.086 mA).23 The low leakage current value of the MnO2/TiN/CC suggests fewer reaction of byproduct impurities on the electrode and insignificant diffusion of electrolyte ions on the electrode surface due to the concentration gradient.20 The potentials of the MnO2/TiN/CC were then further measured for 25 h, and the time courses of the open circuit potential are shown in Fig. 3(i), which corresponds to the self-discharge process.24 Based on the plots, the potential of electrode reduces gradually with the extending of time due to the leakage current, and they decrease quickly before 2 h and become gentle subsequently after the following several hours. The plot shows a steady output potential of 641 mV after 5 h and still exhibits a good typical self-discharge rate, with about 436 mV retention after 25 h, which is comparable to previously reported values.24
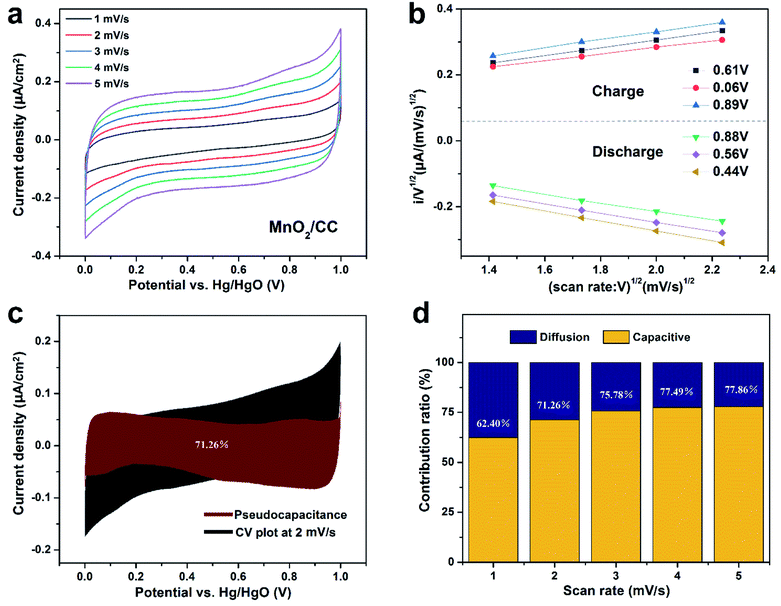 | ||
| Fig. 4 (a) CV curves of MnO2/CC, (b) 6 selected sets of CV data at various voltages for the calculation of k1 using eqn (4), (c) pseudocapacitance of MnO2/CC 2 mV s−1, (d) ratio of pseudocapacitance contributions. | ||
To elucidate the mechanism of the MnO2/CC and MnO2/TiN/CC electrodes, the pseudocapacitance is calculated from the CV plots in Fig. 4(a) and 5(a) and by calculating k1 (Fig. 4(b) and 5(b))25 using eqn (4):
| i(V)/v1/2 = k1v1/2 + k2, | (4) |
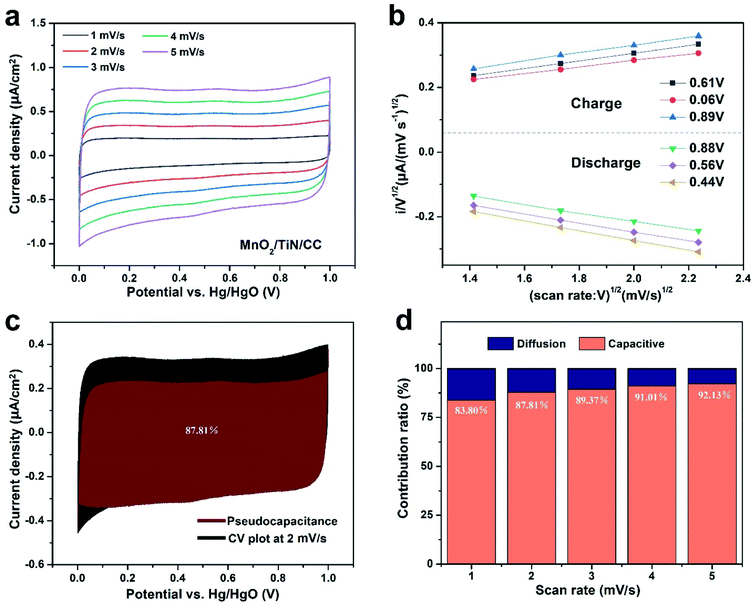 | ||
| Fig. 5 (a) CV curves of MnO2/TiN/CC, (b) 6 selected sets of CV data at various voltages for the calculation of k1 using eqn (4), (c) pseudocapacitance of MnO2/TiN/CC 2 mV s−1, (d) ratio of pseudocapacitance contributions. | ||
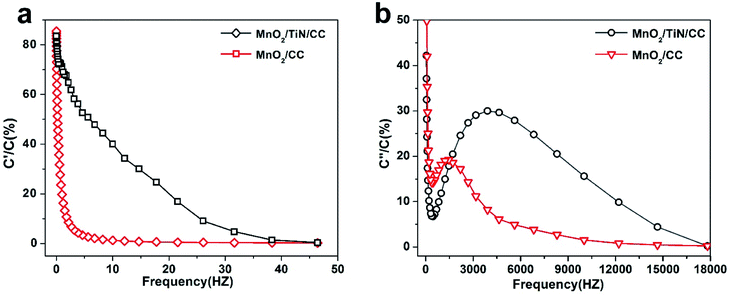 | ||
| Fig. 6 (a) Plots of (a) real capacitance (C′) and (b) imaginary capacitance (C′) vs. frequency for the MnO2/CC and MnO2/TiN/CC electrodes. | ||
The relationship between impedance data and frequency of complex capacitance model is essential to analyze the supercapacitor electrodes. Real capacitance (C′) and complex capacitance (C′′) can be expressed by real, imaginary and total impedance with eqn (5)–(8), respectively26,27
 | (5) |
| C(ω) = C′(ω) − jC′′(ω) in farads | (6) |
Manipulation of eqn (3) and (4) leads to
 | (7) |
 | (8) |
C′ describes the real part of the capacitance and shows the function of frequency can be displayed by the change available of stored energy. C′′ describes the imaginary part of the capacitance and describes the energy loss corresponding to the form of energy dissipation.27 For comparison between MnO2/CC and MnO2/TiN/CC electrodes, the real capacitance value C′ and virtual capacitance value C′′ are normalized against C0 as the highest C values among the electrode.27 Fig. 6(a) shows the relationship between the real part of the capacitance (C′) and frequency. In comparison, the performance of MnO2/TiN/CC is more like an ideal capacitor. When the frequency is greater than 50 Hz, the capacitance decreases and the sample shows pure resistance. Fig. 6(b) shows the relationship between the imaginary part C′′ of capacitance and frequency, and the relaxation time constant τ as the quantitative measurement of the discharge speed of the device, which can be obtained from the C′′ vs. frequency diagram. The relaxation time constant defines predominantly resistive behavior at frequencies above 1/τ and capacitive behavior at frequencies below 1/τ. In other words, a smaller τ defines a higher percentage of useful capacitive energy.27,28 Fig. 6(b) shows that compare with MnO2/CC, MnO2/TiN/CC has a smaller τ, which indicate that the MnO2/TiN/CC electrode has a fairly fast discharge time and potential to deliver stored energy with high power.27
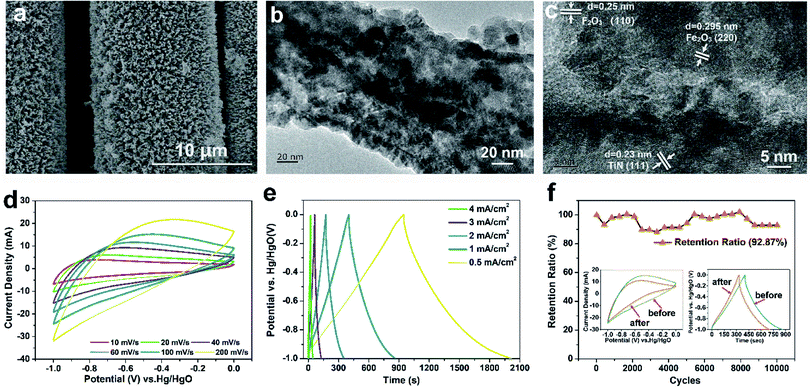
Fig. 7(a) and S3(b)–(d)† depict the SEM images of the Fe2O3/TiN/CC negative electrode at different magnifications. Fe2O3 is uniformly deposited on the TiN nanowires forming a core–shell structure. Owing to the complex surface on TiN, Fe2O3 has a nanogranular structure and the diameter is about 10 nm. The TEM images of the Fe2O3/TiN core–shell at different magnifications are displayed in Fig. 7(b) and (c). As shown in Fig. 7(b), the Fe2O3 nanoparticles and TiN nanowires are combined and Fig. 7(c) shows spacings of 0.25 nm, 0.295 nm and 0.23 nm corresponding to the (110) plane of Fe2O3, (220) plane of Fe2O3, and (111) plane of TiN, respectively, thus confirming the Fe2O3/TiN core–shell structure.
Fig. 7(d) shows the CV curves of Fe2O3/TiN/CC at scanning rates from 10 mV s−1 to 200 mV s−1. As the scanning rate goes up, the redox peak shifts gradually to the right, but the shape of the CV curves remains basically the same without obvious distortion, suggesting that the rates of insertion and extraction on the Fe2O3 surface are fast. As shown in the GCD curves (Fig. 7(e)) of Fe2O3/TiN/CC from 0.5 mA cm−2 to 4 mA cm−2, the shape of the curves resembles an isosceles triangle with good symmetry, implying that Fe2O3/TiN/CC has good reversibility and high coulombic efficiency (98% at 0.5 mA cm−2) in the charging and discharging process. For comparison, the CV curves and GCD curves of TiN/CC are presented in Fig. S4 and S5.† Without Fe2O3, the CV curves of TiN/CC are rectangular and the GCD curves resemble an isosceles triangle with good symmetry. The results indicate that the capacity of the TiN/CC electrode arises from ion adsorption and desorption on the TiN surface. At a current density of 0.5 mA cm−2, the discharging time of Fe2O3/TiN/CC is 958 s compared to 260.1 s for TiN/CC. Therefore, the Fe2O3/TiN/CC core–shell structure plays an important role as the negative electrode in improving the characteristics. Fig. 7(f) shows the cycling performance of Fe2O3/TiN/CC after 10![[thin space (1/6-em)]](https://www.rsc.org/images/entities/char_2009.gif) 000 times at a current density of 8 mA cm−2. In spite of capacity decay near the 2000th cycle, the capacity recovers after 3000 cycles. It is because of dissolution of Fe2O3 in the first two thousand cycles but after 3000 cycles, Fe2O3 is activated gradually. The inset in Fig. 7(f) reveals no significant change in the shape of the CV and GCD curves. Although the area of the CV curves decreases and the GCD discharging time also declines, the total capacity retention rate is quite high at 92.87%.
000 times at a current density of 8 mA cm−2. In spite of capacity decay near the 2000th cycle, the capacity recovers after 3000 cycles. It is because of dissolution of Fe2O3 in the first two thousand cycles but after 3000 cycles, Fe2O3 is activated gradually. The inset in Fig. 7(f) reveals no significant change in the shape of the CV and GCD curves. Although the area of the CV curves decreases and the GCD discharging time also declines, the total capacity retention rate is quite high at 92.87%.
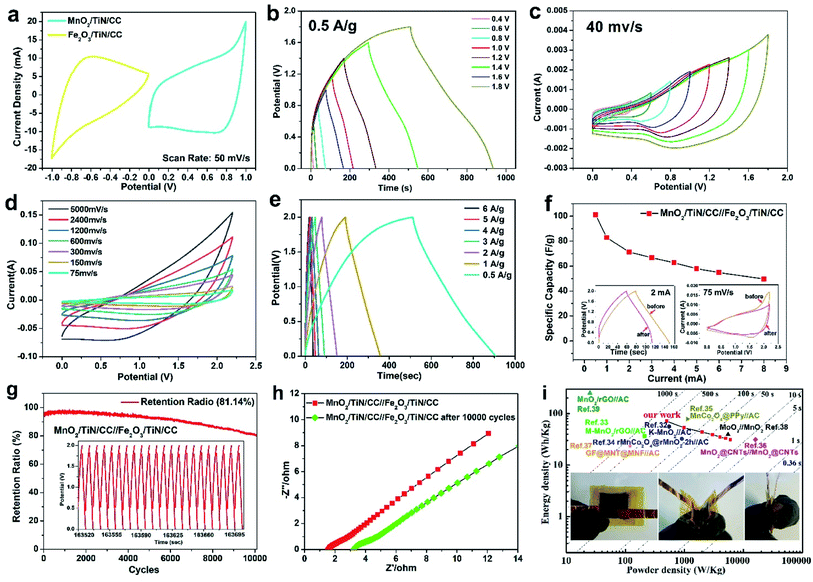
To demonstrate the practicality of the MnO2/TiN/CC and Fe2O3/TiN/CC electrodes, an asymmetrical hybrid supercapacitor is assembled with MnO2/TiN/CC as the positive and Fe2O3/TiN/CC as the negative electrode together with a PE membrane as the separator in the 1 M Na2SO4 electrolyte. All the supercapacitor device components are enclosed in a CR2025 battery cell.29,30 Fig. 8(a) shows the CV curves of MnO2/TiN/CC and Fe2O3/TiN/CC at 50 mV s−1. The CV curves of MnO2/TiN/CC are at positive potentials from 0 to 1 V and Fe2O3/TiN/CC has a negative potential from −1 to 0 V. The two CV curves show similar axial symmetry pertaining to the area, shape, and potential range, thereby indicating high adaptability and the EDLC behavior for both electrodes. Fig. 8(b) and (c) present the GCD and CV curves of MnO2/TiN/CC//Fe2O3/TiN/CC at different potential window. These curves do not exhibit obvious deformation in the 0–1.8 V window and the device can adapt to a working voltage up to 1.8 V. Furthermore, the device can withstand a high scanning rate of 5000 mV s−1 without showing distortion (Fig. 8(d)), corroborating to the large comparative area and rapid ion diffusion capability of the composite nanostructures on the MnO2/TiN resulting in the fast charging–discharging properties of the device.31 The charging–discharging curves at different current densities (Fig. 8(e)) show a triangular shape and so the device has good pseudocapacitive characteristics, fast I–V response, and excellent electrochemical reversibility. The relationship between the specific capacitance and current density in the GCD tests is shown in Fig. 8(f). The specific capacitance of the device is 102.8 F g−1 at a current density of 5 A g−1, which is better than those of MnO2-based devices reported in the literature, for instance, K–MnO2//AC (83 F g−1 at 3 A g−1),32 M–MnO2/rGO//AC (90.7 F g−1 at 0.25 A g−1),33 MnO2@CNTs//MnO2@CNTs (highest specific capacitance of 56 F g−1)34 and GF@MNT@MNF//AC (51.50 F g−1 at 0.13 A g−1).29 More information can be found from Table 1.
| Electrode composition | Electrolyte | Potential window (V) | Specific capacity (F g−1) | Energy density (W h kg−1) | Power density (W kg−1) | Cycling retention (%) | Ref. |
|---|---|---|---|---|---|---|---|
| K–MnO2//AC | 1 M Na2SO4 | 2.2 | 83 | 56 | 550 | 98% (10![[thin space (1/6-em)]](https://www.rsc.org/images/entities/char_2009.gif) 000-cycles) 000-cycles) |
32 |
| M–MnO2/rGO//AC | 1 M Na2SO4 | ∼1.6 | 90.7 | 36.4 | 212.5 | 88.2% (10![[thin space (1/6-em)]](https://www.rsc.org/images/entities/char_2009.gif) 000-cycles) 000-cycles) |
33 |
| rMnCo2O4@rMnO2-2 h//AC | 3 M KOH | 1.6 | 91.2 | 32.4 | 904.9 | 81.8% (5000-cycles) | 34 |
| MnCo2O4@PPy//AC | 2 M KOH | 1.6 | — | 78.5 | 1121 | 95.5% (5000-cycles) | 35 |
| MnO2@CNTs//MnO2@CNTs | 2 mM HTEMPO & 1 M Na2SO4 | 1.0 | 56 | 31.2 | 16![[thin space (1/6-em)]](https://www.rsc.org/images/entities/char_2009.gif) 000 000 |
96% (10![[thin space (1/6-em)]](https://www.rsc.org/images/entities/char_2009.gif) 000-cycles) 000-cycles) |
36 |
| GF@MNT@MNF//AC | 1 M Na2SO4 | 1.8 | 51.50 | 23.2 | 119.9 | 80% (5000-cycles) | 37 |
| MoO2//MnO2 | 1 M Na2SO4 | 2.2 | 58.6 | 39.4 | 5500 | 93.75% (3000-cycles) | 38 |
| MnO2/rGO//AC | 1 M Na2SO4 | 2.0 | 45.25 | 25.14 | 250 | — | 39 |
| MnO2/TiN/CC//Fe2O3/TiN/CC | 1 M Na2SO4 | 2.0 | 102.8 | 71.19 | 499.79 | 82.36% (10![[thin space (1/6-em)]](https://www.rsc.org/images/entities/char_2009.gif) 000-cycles) 000-cycles) |
This work |
Fig. 8(g) discloses that the supercapacitor device has excellent cycling ability up to 10![[thin space (1/6-em)]](https://www.rsc.org/images/entities/char_2009.gif) 000 cycles at a high GCD current of 10 mA, and it should be emphasized such outstanding characteristics have rarely been observed from hybrid devices composed of MnO2 and Fe2O3. Owing to the activation process, the cycling capacity is fully activated and improves significantly in the first 1000 cycles. After 10
000 cycles at a high GCD current of 10 mA, and it should be emphasized such outstanding characteristics have rarely been observed from hybrid devices composed of MnO2 and Fe2O3. Owing to the activation process, the cycling capacity is fully activated and improves significantly in the first 1000 cycles. After 10![[thin space (1/6-em)]](https://www.rsc.org/images/entities/char_2009.gif) 000 cycles, the device retains 81.16% of the initial specific capacitance and fares better than most other devices as shown in Table 1. The inset in Fig. 8(g) shows the data for 20 cycles around the 8000th cycle in the 10
000 cycles, the device retains 81.16% of the initial specific capacitance and fares better than most other devices as shown in Table 1. The inset in Fig. 8(g) shows the data for 20 cycles around the 8000th cycle in the 10![[thin space (1/6-em)]](https://www.rsc.org/images/entities/char_2009.gif) 000-cycle test and demonstrates robust stability. To explain the attenuation before and after the 10
000-cycle test and demonstrates robust stability. To explain the attenuation before and after the 10![[thin space (1/6-em)]](https://www.rsc.org/images/entities/char_2009.gif) 000th GCD cycle, EIS is conducted and the results are presented in Fig. 8(h). The intersection in the Nyquist curve and ordinate axis show that the solution resistance (Rs) values before and after cycling are 1.5 and 3.2 Ω, respectively. The diameter of the semicircle of the Nyquist plots increases with the cycle number. Before cycling, the end of the semicircle is about 1.5 Ω and after 10
000th GCD cycle, EIS is conducted and the results are presented in Fig. 8(h). The intersection in the Nyquist curve and ordinate axis show that the solution resistance (Rs) values before and after cycling are 1.5 and 3.2 Ω, respectively. The diameter of the semicircle of the Nyquist plots increases with the cycle number. Before cycling, the end of the semicircle is about 1.5 Ω and after 10![[thin space (1/6-em)]](https://www.rsc.org/images/entities/char_2009.gif) 000 cycles, it is 1.8 Ω. The supercapacitor device before cycling has the shortest arc radius and largest slope of the inclined line in the low frequency region implying lower impedance and higher ion mobility. After 10
000 cycles, it is 1.8 Ω. The supercapacitor device before cycling has the shortest arc radius and largest slope of the inclined line in the low frequency region implying lower impedance and higher ion mobility. After 10![[thin space (1/6-em)]](https://www.rsc.org/images/entities/char_2009.gif) 000 cycles, the electrical conductivity decreases somewhat because MnO2 dissolves continuously and so the solution impedance increases with the cycle number.
000 cycles, the electrical conductivity decreases somewhat because MnO2 dissolves continuously and so the solution impedance increases with the cycle number.
The energy and power densities of MnO2/TiN/CC//Fe2O3/TiN/CC as the device are calculated according to eqn (S2) and (S3)† and shown in Fig. 8(i). Similar Mn-based supercapacitors reported recently in the literature are compared in Fig. 8(i) and Table 1. The total mass of the active materials of MnO2 is about 1 mg and the discharging time is considered in calculating the energy and power densities. The device shows a maximum energy density of 71.19 W h kg−1 at a power density of 499.79 W kg−1 and even at 5999.99 W kg−1, it still shows an energy density of 31.3 W h kg−1. As aforementioned above, this is one of the best values observed from similar devices regardless of the positive or negative configurations. For instance, it is better than those of K–MnO2//AC (56 W h kg−1 at 550 W kg−1),32 M–MnO2/rGO//AC (36.4 W h kg−1 at 212.5 W kg−1),33 rMnCo2O4@rMnO2-2 h//AC (32.4 W h kg−1 at 904.9 W kg−1),36 MnO2@CNTs//MnO2@CNTs (31.2 W h kg−1 at 16![[thin space (1/6-em)]](https://www.rsc.org/images/entities/char_2009.gif) 000 W kg−1),34 and GF@MNT@MNF//AC (23.2 W h kg−1 at 119.9 W kg−1).36 The excellent electrochemical characteristics of the MnO2/TiN/CC electrode and assembled supercapacitor device can be attributed to the shore-shell structure comprising the MnO2 nanosheets and TiN nanowires that spread evenly on the conductive carbon cloth. In this way, the ion transport efficiency between the nanomaterials and electrolytes is improved while agglomeration of the nanomaterials can be mitigated. The Fe2O3/TiN/CC negative electrode shows good adaptability with the MnO2-based positive electrode giving rise to enhanced cycling ability as well as large energy and power densities. As shown in the inset in Fig. 8(i), the flexible device maintains the good electrochemical activity even when it is bent mechanically.
000 W kg−1),34 and GF@MNT@MNF//AC (23.2 W h kg−1 at 119.9 W kg−1).36 The excellent electrochemical characteristics of the MnO2/TiN/CC electrode and assembled supercapacitor device can be attributed to the shore-shell structure comprising the MnO2 nanosheets and TiN nanowires that spread evenly on the conductive carbon cloth. In this way, the ion transport efficiency between the nanomaterials and electrolytes is improved while agglomeration of the nanomaterials can be mitigated. The Fe2O3/TiN/CC negative electrode shows good adaptability with the MnO2-based positive electrode giving rise to enhanced cycling ability as well as large energy and power densities. As shown in the inset in Fig. 8(i), the flexible device maintains the good electrochemical activity even when it is bent mechanically.
5. Conclusion
Nanoscale MnO2 and Fe2O3 are fabricated on TiN nanowires on a piece of conductive carbon cloth to form flexible electrodes for supercapacitors. The specific capacitances of MnO2@TiN/CC at a current density of 3 mA cm−2 before and after 10![[thin space (1/6-em)]](https://www.rsc.org/images/entities/char_2009.gif) 000 cycles are 310.7 F g−1 and 304.2 F g−1, respectively, indicating a small loss of only 2.1%. An asymmetrical hybrid supercapacitor with MnO2/TiN/CC as the positive electrode and Fe2O3/TiN/CC as the negative electrode is assembled. The device can withstand a high scanning rate of 5000 mV s−1 in the 2 V window. It shows a maximum energy density of 71.19 W h kg−1 at a power density of 499.79 W kg−1, and even at 5999.99 W kg−1, the energy density is still 31.3 W h kg−1. The electrochemical results reveal that the MnO2/TiN/CC and Fe2O3/TiN/CC electrodes have large potential in energy storage devices.
000 cycles are 310.7 F g−1 and 304.2 F g−1, respectively, indicating a small loss of only 2.1%. An asymmetrical hybrid supercapacitor with MnO2/TiN/CC as the positive electrode and Fe2O3/TiN/CC as the negative electrode is assembled. The device can withstand a high scanning rate of 5000 mV s−1 in the 2 V window. It shows a maximum energy density of 71.19 W h kg−1 at a power density of 499.79 W kg−1, and even at 5999.99 W kg−1, the energy density is still 31.3 W h kg−1. The electrochemical results reveal that the MnO2/TiN/CC and Fe2O3/TiN/CC electrodes have large potential in energy storage devices.
Conflicts of interest
There are no conflicts to declare.Acknowledgements
This research was financially supported by National Natural Science Foundation of China (22005046), Fundamental Research Funds for the Central Universities (2232020D-03 and 2232019D3-41), and City University of Hong Kong Strategic Research Grant (SRG) No. 7005505.References
- Z. Ma, G. Shao, Y. Fan, G. Wang, J. Song and D. Shen, ACS Appl. Mater. Interfaces, 2016, 8, 9050–9058 CrossRef CAS PubMed.
- X. Lang, A. Hirata, T. Fujita and M. Chen, Nat. Nanotechnol., 2011, 6, 232–236 CrossRef CAS PubMed.
- T. Li, J. Wu, X. Xiao, B. Zhang, Z. Hu, J. Zhou, P. Yang, X. Chen, B. Wang and L. Huang, RSC Adv., 2016, 6, 13914–13919 RSC.
- L. F. Chen, Z. H. Huang, H. W. Liang, Q. F. Guan and S. H. Yu, Adv. Mater., 2013, 25, 4746 CrossRef CAS PubMed.
- H. Chen, L. Yu, J. M. Zhang and C. P. Liu, Ceram. Int., 2016, 18058–18063 CrossRef CAS.
- A. Sumboja, C. Y. Foo, X. Wang and P. S. Lee, Adv. Mater., 2013, 25, 2809–2815 CrossRef CAS PubMed.
- F. Li, H. Chen, X. Y. Liu, S. J. Zhu, J. Q. Jia, C. H. Xu, F. Dong, Z. Q. Wen and Y. X. Zhang, J. Mater. Chem. A, 2016, 4, 2096–2104 RSC.
- J.-M. Jeong, S. H. Park, H. J. Park, S. B. Jin, S. G. Son, J.-M. Moon, H. Suh and B. G. Choi, Adv. Funct. Mater., 2021, 31, 2009632 CrossRef CAS.
- L. Bao, J. Zang and X. Li, Nano Lett., 2011, 11, 1215–1220 CrossRef CAS PubMed.
- K. Chanda, S. Maiti, S. Sarkar, P. Bairi, S. Thakur, K. Sardar, N. Besra, N. S. Das and K. K. Chattopadhyay, ACS Appl. Nano Mater., 2021, 4, 1420–1433 CrossRef CAS.
- Y. Zhu, H. Xu, J. Tang, X. Jiang, Y. Bao and Y. Chen, J. Electrochem. Soc., 2021, 168, 030542 CrossRef CAS.
- R. Liu, J. Duay and S. B. Lee, ACS Nano, 2011, 5, 5608–5619 CrossRef CAS PubMed.
- S. Li, R. C. Feng, M. Li, X. Zhao, B. H. Zhang, Y. Liang, H. P. Ning, J. L. Wang, C. R. Wang and P. K. Chu, RSC Adv., 2020, 10, 37489 RSC.
- R. R. Atram, V. M. Bhuse, R. G. Atram, C. M. Wu, P. Koinkar and S. B. Kondawar, Mater. Chem. Phys., 2021, 262, 124253 CrossRef CAS.
- R. Feng, M. Li, Y. Wang, J. Lin and P. K. Chu, Electrochim. Acta, 2021, 137716 CrossRef CAS.
- W. Diao, J. He, Q. Wang, X. Rao and Y. Zhang, Catal. Sci. Technol., 2021, 11, 230–238 RSC.
- C. Chen and X. Yang, RSC Adv., 2017, 7, 56440–56446 RSC.
- C. Wu, Y. N. Xu, L. Y. Ao, K. Jiang, L. Y. Shang, Y. W. Li, Z. G. Hu and J. H. Chu, J. Alloys Compd., 2020, 816(5), 152627 CrossRef CAS.
- Y. Zhang, Q. Li, J. Liu, W. You, F. Fang, M. Wang and R. Che, Langmuir, 2018, 34, 5225–5233 CrossRef CAS PubMed.
- Y. Q. Lai, J. Li, H. S. Song, Z. A. Zhang, J. Li and Y. X. Liu, J. Cent. South Univ. Technol., 2007, 5, 633–637 CrossRef.
- C. Wu, X. Y. Wang, B. W. Ju, Y. S. Bai, L. L. Jiang, H. Wu, Q. L. Zhao, J. Gao, X. Y. Wang and L. H. Yi, J. Solid State Electrochem., 2013, 17, 1693–1700 CrossRef CAS.
- W. Quan, C. H. Jiang, S. T. Wang, Y. S. Li, Z. T. Zhang, Z. L. Tang and F. Favier, Electrochim. Acta, 2017, 247, 1072–01079 CrossRef CAS.
- B. Saravanakumar, S. S. Jayaseelan, M. K. Seo, H. Y. Kim and B. S. Kim, Nanoscale, 2017, 9, 18819 RSC.
- X. Wang, Y. P. He, Z. C. Guo, H. Huang, P. P. Zhang and H. B. Lin, New J. Chem., 2019, 43, 18813 RSC.
- J. Wang, J. Polleux, J. Lim and B. Dunn, J. Phys. Chem. A, 2007, 111, 14925–14931 CAS.
- P. L. Taberna, P. Simon and J. F. Fauvarque, J. Electrochem. Soc., 2003, 148, A292 CrossRef.
- J. M. Soon and K. P. Lo, Electrochem. Solid-State Lett., 2007, 10, A250–A254 CrossRef CAS.
- P. L. Taberna, P. Simon and J. F. Fauvarque, J. Electrochem. Soc., 2003, 150, A292–A300 CrossRef CAS.
- P. Sennu, V. Aravindan and Y.-S. Lee, J. Power Sources, 2016, 306, 248–257 CrossRef CAS.
- B. Rfa, L. A. Mai, W. A. Yu, L. A. Jian, A. Kz, A. Jw, A. Cw and C. Pkc, Electrochim. Acta, 2021, 370, 137716 CrossRef.
- Y. Wang, X. Zhang, C. Guo, Y. Zhao, C. Xu, H. Li, Y. Wang, X. Zhang, C. Guo and Y. Zhao, J. Mater. Chem. A, 2013, 1, 13290–13300 RSC.
- N. Zarshad, A. U. Rahman, J. Wu, A. Ali, F. Raziq, L. Han, P. Wang, G. Li and H. Ni, Chem. Eng. J., 2021, 415, 128967 CrossRef CAS.
- L. Chen, H. Yin, Y. Zhang and H. Xie, Nano, 2020, 8, 2050099 CrossRef.
- Y. Zhang, Y. Liu, Z. Sun, Y. Bai, S. Cheng, P. Cui, J. Zhang, Q. Su, J. Fu and E. Xie, Electrochim. Acta, 2021, 375, 137979 CrossRef CAS.
- M. He, L. L. Cao, W. L. Li, X. W. Chang and Z. Y. Ren, J. Alloys Compd., 2021, 865, 158934 CrossRef CAS.
- H. Liu, Z. Guo, S. Wang, X. Xun and J. Lian, J. Alloys Compd., 2020, 846, 156504 CrossRef CAS.
- R. Boopathiraja and M. Parthibavarman, J. Alloys Compd., 2016, 811, 152084 CrossRef.
- C. Zhao, Y. Hu, Y. Zhou, N. Li, Y. Ding, J. Guo, C. Zhao and Y. Yang, Energy Fuels, 2021, 35, 6909–6920 CrossRef CAS.
- S. Jangu, B. K. Satpathy, M. Raju, C. Jacob and D. Pradhan, Dalton Trans., 2021, 50, 6878–6888 RSC.
Footnote |
| † Electronic supplementary information (ESI) available. See DOI: 10.1039/d1ra05742a |
| This journal is © The Royal Society of Chemistry 2021 |

