
 Open Access Article
 This Open Access Article is licensed under a
 Creative Commons Attribution 3.0 Unported Licence
Green synthesis, structural analysis and anticancer activity of dihydropyrimidinone derivatives†
Jayanta Dowaraha,
Devanshi Patelb,
Brilliant N. Maraka,
Umesh Chand Singh Yadav c,
Pramod Kumar Shahd,
Pradeep Kumar Shuklad and
Ved Prakash Singh*ae
c,
Pramod Kumar Shahd,
Pradeep Kumar Shuklad and
Ved Prakash Singh*ae
aDepartment of Chemistry, School of Physical Sciences, Mizoram University, Aizawl-796004, Mizoram, India. E-mail: vpsingh@mzu.edu.in
bSchool of Life Sciences, Central University of Gujarat, Gandhinagar, Gujarat 382030, India
cSpecial Centre for Molecular Medicine, Jawaharlal Nehru University, New Delhi-110067, India
dDepartment of Physics, Assam University, Silchar-788011, India
eDepartment of Industrial Chemistry, School of Physical Sciences, Mizoram University, Aizawl-796004, Mizoram, India
First published on 4th November 2021
Abstract
In this study, for the first time, we have used Citrus macroptera juice to synthesize dihydropyrimidine (DHPM) derivatives via the Biginelli reaction, which showed better yield, shorter reaction time, and did not require an organic solvent for the reaction. A series of DHPM derivatives were synthesized, and characterized, and structural analysis was achieved through SCXRD & Hirshfeld surface analysis. We observed that these synthesized dihydropyrimidine (DHPM) derivatives showed C–H⋯π, C–H⋯O, C–H⋯N, C–H⋯C, lone pair⋯π, π⋯π, etc. interactions. We also performed in silico studies for their inhibitory activities against human kinesin Eg5 enzyme, and the cytotoxic activity of the synthesized compounds was carried out against A549 lung adenocarcinoma cells. In silico analysis demonstrated that compounds with a chloro-group at the 3- or 4-position in the substituted ring of DHPM showed higher binding affinity for the human kinesin Eg5 enzyme (−7.9 kcal mol−1) than the standard drug monastrol (−7.8 kcal mol−1). Furthermore, in vitro cellular studies revealed that compounds with a chloro-group at the 3- or 4-position in the substituted ring of DHPM induced significant cell death in human A549 lung adenocarcinoma cells. This result indicates that a deactivating group (chlorine) at the 3- or 4-position in the substituted ring of DHPM might be a promising anticancer drug candidate for treating different types of cancers, particularly cancer of the lung.
1. Introduction
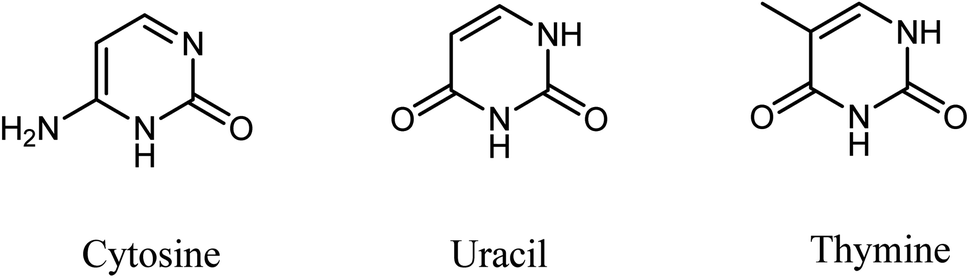
Cancer accounts for the second leading cause of death worldwide despite many breakthroughs for cancer treatment. Almost 10.0 million cancer deaths occurred due to cancer in 2020 alone.1 According to the WHO, if this trend continues, this is expected to rise to 13.1 million by the end of 2030. Due to drug resistance and toxicity associated with its treatment, cancer remains a focus of immense interest.2,3 This warrants newer drug discovery and drug development efforts to mitigate these concerns in cancer therapy.Heterocyclic molecules continue to be attractive targets for synthesis since they often exhibit vital biological properties. In particular, dihydropyrimidinones (DHPMs) are well known for their wide range of bioactivities. DHPMs have vital applications in the field of drug discovery. Three nucleic acid bases are pyrimidine derivatives, which comprise cytosine, found in DNA and RNA, uracil in RNA, and thymine in DNA (Fig. 1). Therefore, the synthesis and study of DHPM systems with methylene-linked ester makes it an exciting topic for synthetic organic chemistry.
 | ||
| Fig. 1 Pyrimidine derivative bases. | ||
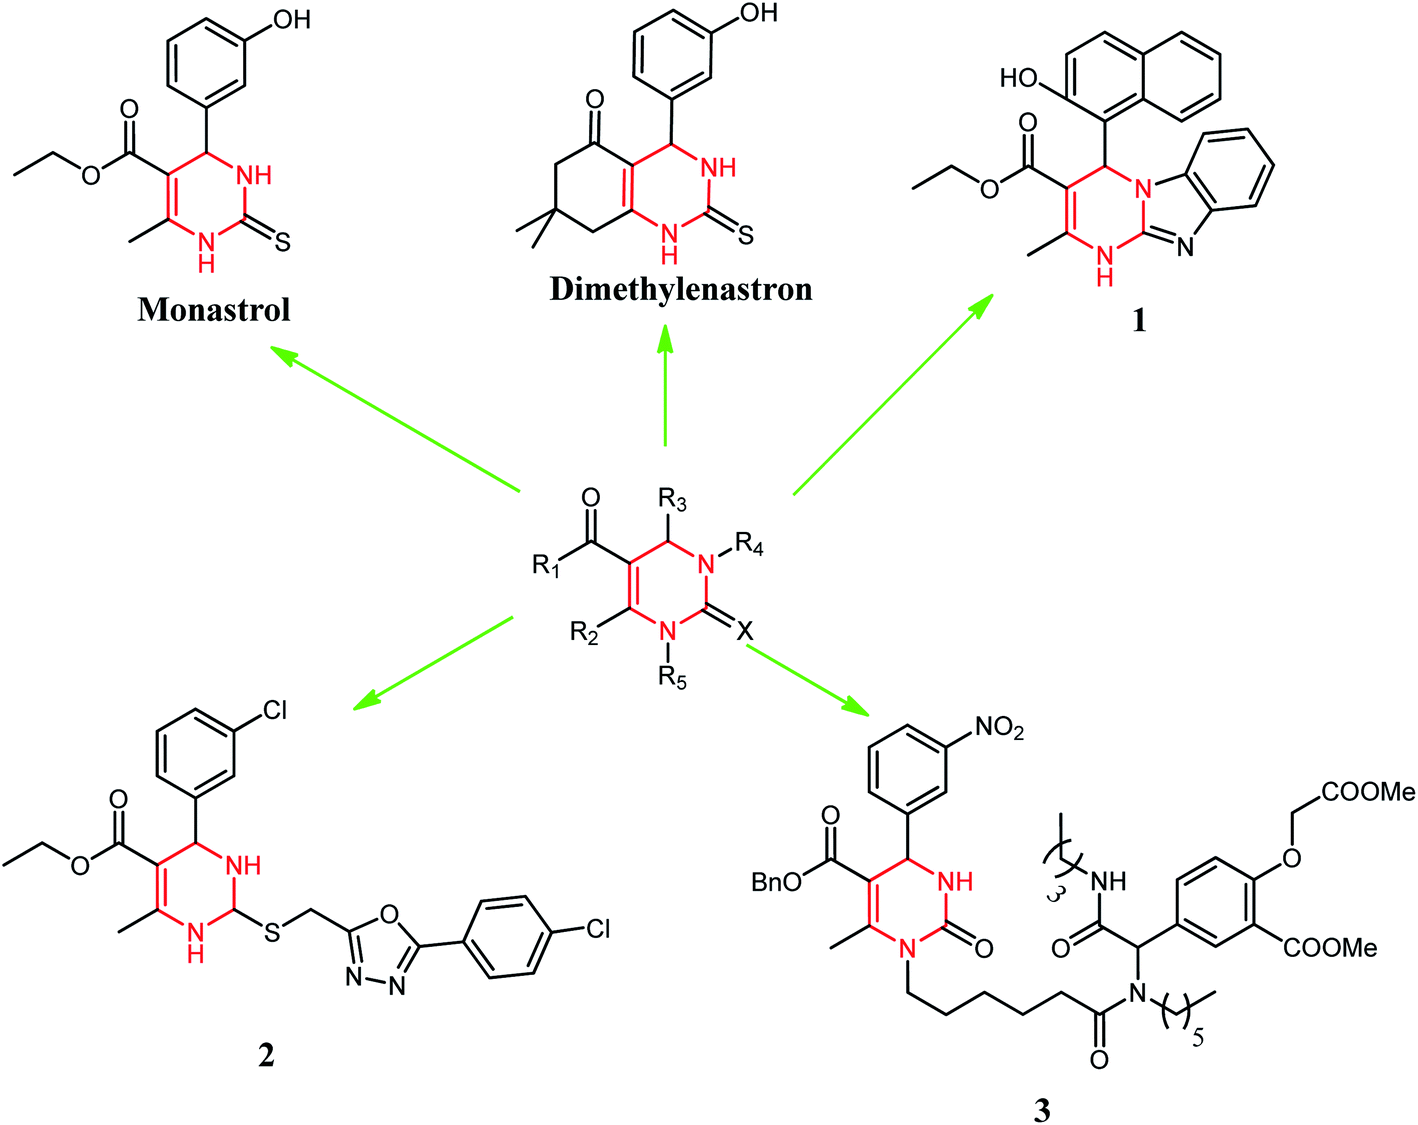
DHPM classes of compounds are structural analogs of monastrol. These are important to medicinal chemistry because of many biological activities.4 These compounds also possess interesting biological activities such as antiviral,5 antitumor,6 and antibacterial,7 as well as calcium channel modulating activity.8 Monastrol is the protagonist of the DHPMs class. Several studies revealed that DHPMs inhibitory action on human kinesin Eg5 leads to a mitotic arrest resulting in apoptosis.9 This was the main action in apoptosis described for this class of compounds. However, some studies have shown other possible targets, such as centrin,10 calcium channels,11 and topoisomerase I12 for these molecules. Monastrol has inspired medicinal chemists to design new anticancer agents based on the DHPM scaffold or its modification with different substituents. Broad replacements (R1, R2, R3, R4, and X) were set on various ring places, meaning to get vital anticancer specialists, for example, dimethylenastron, compounds 1, 2, and 3 (Fig. 2). Thus, we have designed our synthetic compounds based on these structural attributes of monastrol.
 | ||
| Fig. 2 Dihydropyrimidinone (DHPM) scaffold as a potent anticancer drug. | ||
The present study deals with the green synthesis of monastral analogues and studies weak interactions, including π⋯π interactions, C–H⋯π and lone pair⋯π interactions. Our first effort was to understand non-covalent interactions in the synthesized DHPM derivatives and the effect of substituents with different electronic environments on conformations of some selected synthesized molecules.
The synthesis of DHPM and evaluation of their anticancer properties is of ongoing interest to our laboratory. Synthesis of DHPM derivatives by “solvent-free and catalyst-free” green methodology has been done by others.13 Pramanik et al. developed a safe, eco-friendly, and green method for synthesizing DHPM at room temperature using common fruit juice.14 Microwave-assisted green synthesis of DHPM was developed by Bhatewara et al. and studied their antimicrobial properties.15 Citrus macroptera (a fruit from citrus family, usually found in India, Bangladesh, Malaysia and Melanesia) juice medium never have been used for Biginelli reaction using electron-rich/electron-deficient aromatic aldehydes, but similar kind of citrus fruit like orange and lime has been reported earlier for similar reactions.14 Here, we have reported a green synthesis for DHPM with electron-rich and electron-deficient aromatic aldehydes in Citrus macroptera juice medium [Scheme 1]. The non-covalent interactions of these compounds were studied by single-crystal X-ray diffractometers (SCXRD). Hirshfeld surface analyses were performed to study the structural property of molecules. DFT calculations were carried out to know how the substituents impact the geometry of different synthesized DHPM derivatives. In silico analysis studies the molecules binding affinity in the active site of target proteins (Eg5). Subsequently, we also carried out cytotoxic studies of these compounds in the lung adenocarcinoma (A549) cells.
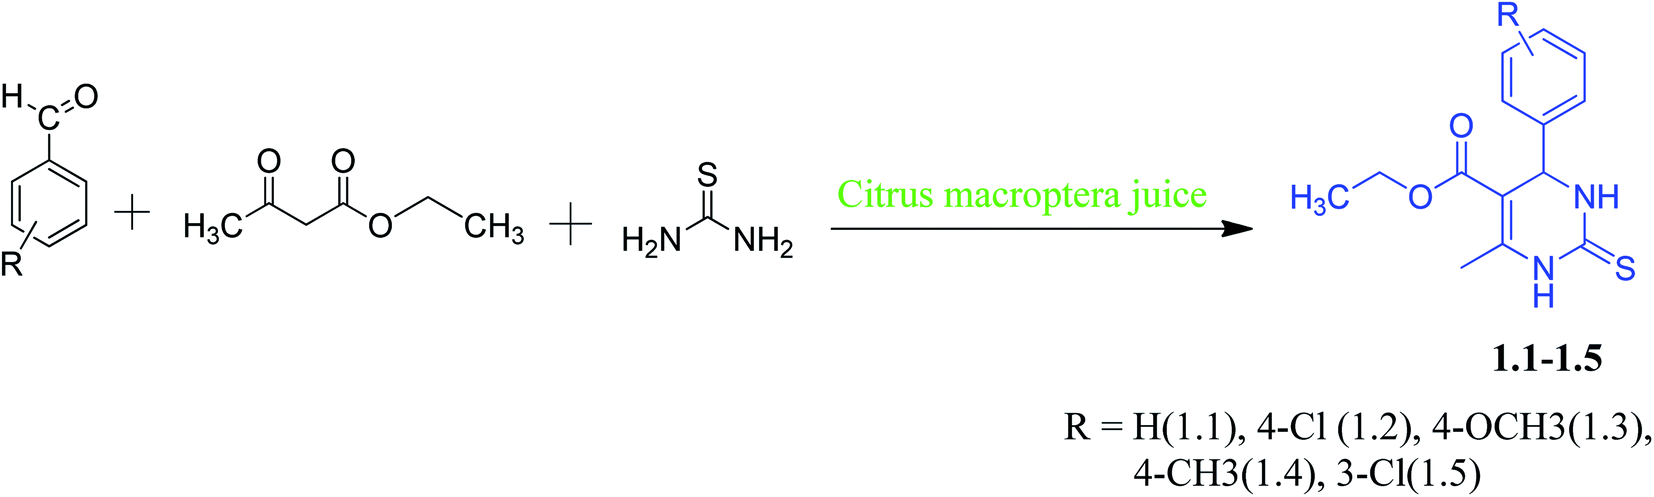 | ||
| Scheme 1 Green synthesis of DHPM derivaties (1.1–1.5). | ||
2. Experimental design
1H NMR (300 MHz) and 13C (75 MHz) NMR spectra were recorded on JEOL AL300 FTNMR spectrometer using TMS as an internal reference, and chemical shift values are expressed in δ, ppm units. Melting points of all the compounds were recorded on the electrically heated instrument and were uncorrected. All the reactions were monitored by thin-layer chromatography (TLC) using an appropriate solvent system. The compound was purified from column chromatography (silica gel size 60–120 mesh) and flash chromatography (silica gel size 230–400 mesh) using the standard protocol.2.1. Chemistry
Our main target was to perform green synthesis of DHPMs containing electron-rich and electron-deficient phenyl rings from Citrus macroptera juice and study the non-covalent interactions of these compounds through X-ray crystallographic study. The required Citrus macroptera juices were extracted directly from the naturally obtained Citrus macroptera fruit, and it was used straightaway for the reaction. DHPMs synthesis via Biginelli reaction with electron-rich and electron-deficient aromatic aldehydes in Citrus macroptera juice medium was done at room temperature (Scheme 1).2.1.1.1. Ethyl-6-methyl-4-phenyl-2-thioxo-1,2,3,4-tetrahydropyrimidine-5-carboxylate (1.1). Yield: 5.6 g, 83%, mp 205–207 °C. Solubility: ethanol, methanol
δH (300 MHz; CDCl3; Me4Si): 1.11–1.15 (3H, t, CH3, J = 7.2 Hz), 2.11–2.16 (3H, s, CH3), 4.15–4.18 (2H, q, CH3, J = 7.2 Hz), 5.29–5.37 (1H, s, CH), 7.22–7.35 (5H, s, Ph), 9.21–9.24 (1H, s, NH), 9.87–9.91(1H, s, NH). δC (75MHz; CDCl3): 14.2, 18.3, 58.6, 61.7, 104.2, 126.3, 126.9, 128.5, 143.3, 160.3, 167.2, 174.1. MS (m/z): 277.09 (M+). Element analysis: found: C, 60.64; H, 5.46; N, 10.33%. Calculated for C14H16N2O2S: C, 60.85; H, 5.84; N, 10.14%.
2.1.1.2. Ethyl-4-(4-chlorophenyl)-6-methyl-2-thioxo-1,2,3,4-tetrahydropyrimidine-5-carbox ylate (1.2). Yield: 4.4 g, 87%, mp 202–204 °C. Solubility: ethanol, methanol
δH (300 MHz; CDCl3; Me4Si): 1.12–1.16 (3H, t, CH3, J = 7.2 Hz), 2.31–2.39 (3H, s, CH3), 4.1–4.13 (2H, q, CH2, J = 7.2 Hz), 5.28–5.33 (1H, s, CH); 7.21–7.32 (4H, s, Ph), 9.27–9.34 (1H, s, NH), 9.88–9.95 (1H, s, NH). δC (75MHz; CDCl3): 14.2, 18.3, 58.6, 61.7, 104.2, 126.9, 128.5, 132.3, 143.3, 160.3, 167.2, 174.1. MS (m/z): 311.05 (M+). Element analysis: found: C, 54.21; H, 4.53; N, 9.12%. Calculated for C14H15ClN2O2S: C, 54.10; H, 4.86; N, 9.01%.
2.1.1.3. Ethyl-4-(4-methoxyphenyl)-6-methyl-2-thioxo-1,2,3,4-tetrahydropyrimidine-5-carboxylate (1.3). Yield: 4.1 g, 79%, mp 210–214 °C. Solubility: ethanol, methanol
δH (300 MHz; CDCl3; Me4Si): 1.11–1.23 (3H, t, CH3, J = 7.2 Hz), 2.32–2.39 (3H, s, CH3), 3.74–3.79 (3H, s, OCH3), 4.11–4.13 (2H, q, CH2, J = 8.4 Hz), 5.31–5.35 (1H, s, CH), 6.78–6.86 (2H, d, Ph, J = 8.4 Hz), 7.16–7.23 (2H, d, Ph, J = 8.4 Hz), 7.8–7.84 (1H, s, NH), 8.43–8.51 (1H, s, NH). δC (75MHz; CDCl3): 14.2, 18.3, 55.8, 58.3, 61.7, 104.2, 114.1, 125.7, 135.6, 158.6, 160.3, 167.2, 174.1. MS (m/z):307.10 (M+). Element analysis: found: C, 58.60; H, 5.84; N, 9.06%. Calculated for C15H18N2O3S: C, 58.80; H, 5.92; N, 9.14%.
2.1.1.4. Ethyl-6-methyl-2-thioxo-4-(p-tolyl)-1,2,3,4-tetrahydropyrimidine-5-carboxylate (1.4). Yield: 5.3 g, 85%, mp 209–2011 °C. Solubility: ethanol, methanol
δH (300 MHz; CDCl3; Me4Si): 1.12–1.23 (3H, t, CH3, J = 7.2 Hz), 2.26–2.32 (3H, s, CH3), 2.33–2.38 (3H, s, CH3), 4.1–4.13 (2H, q, CH2, J = 7.2 Hz), 5.28–5.33 (1H, s, CH), 7.08–7.12 (2H, d, Ph, J = 8.2 Hz) 7.14–7.23 (2H, d, Ph, J = 8.1 Hz), 8.81–8.86(1H, s, NH), 9.48–9.52 (1H, s, NH). δC (75 MHz; CDCl3): 14.2, 18.3, 21.3, 58.3, 61.7, 104.2, 126.8, 128.8, 136.4, 140.3, 160.3, 167.2, 174.1. MS (m/z): 291.11 (M+). Element analysis: found: C, 62.21; H, 6.11; N, 9.38%. Calculated for C15H18N2O2S: C, 62.04; H, 6.25; N, 9.65%.
2.1.1.5. Ethyl-4-(3-chlorophenyl)-6-methyl-2-thioxo-1,2,3,4-tetrahydropyrimidine-5-carboxylate (1.5). Yield: 4.5 g, 92%, mp 212–215 °C. Solubility: ethanol, methanol
δH (300 MHz; CDCl3; Me4Si): 1.13–1.21 (3H, t, CH3, J = 7.2 Hz), 2.24–2.37 (3H, s, CH3), 4.1–4.13 (2H, q, CH2, J = 7.2 Hz), 5.27–5.31 (1H, s, CH), 7.18–7.31 (4H, m, Ph), 9.37–9.44 (1H, s, NH), 9.98–10.03 (1H, s, NH). δC (75 MHz; CDCl3): 14.2, 18.3, 57.8, 61.7, 104.2, 125.0, 126.7, 126.8, 129.9, 134.1, 144.7, 160.3, 167.2, 174.1. MS (m/z): 311.05 (M+). Element analysis: found: C, 54.04; H, 4.45; N, 9.21%. Calculated for C14H15ClN2O2S: C, 54.10; H, 4.86; N, 9.01%.
2.2. X-ray crystallographic study
All crystal data has been used to solve and refine the crystal structure by SHELXL-97![[thin space (1/6-em)]](https://www.rsc.org/images/entities/char_2009.gif) 16 in the program suite WinGX (version 1.80.05).17 The molecular graphics were developed by using ORTEP-318 software. For 3D structure visualization and packing diagrams, Mercury 3.3 software has been used throughout the experiment. PARST-95 and PLATON19 were used for geometrical calculations. Hydrogen bonds were represented by broken light green lines in the packing diagram. Carbon atoms were represented by grey color, hydrogen atoms white, oxygen atoms red, nitrogen atoms light blue, sulphur atoms yellow, chlorine atoms blue, etc., in the packing diagram. Single-crystal X-ray data for compounds 1.3, 1.4, and 1.5 were collected with an Oxford Diffraction Xcalibur CCD diffractometer.
16 in the program suite WinGX (version 1.80.05).17 The molecular graphics were developed by using ORTEP-318 software. For 3D structure visualization and packing diagrams, Mercury 3.3 software has been used throughout the experiment. PARST-95 and PLATON19 were used for geometrical calculations. Hydrogen bonds were represented by broken light green lines in the packing diagram. Carbon atoms were represented by grey color, hydrogen atoms white, oxygen atoms red, nitrogen atoms light blue, sulphur atoms yellow, chlorine atoms blue, etc., in the packing diagram. Single-crystal X-ray data for compounds 1.3, 1.4, and 1.5 were collected with an Oxford Diffraction Xcalibur CCD diffractometer.
2.3. Hirshfeld surface analysis
Hirshfeld surface analysis20 is used to visualize intermolecular interactions in crystals using 3D molecular surface contours and 2D fingerprint plots. The Hirshfeld surface and associated 2D fingerprint plots for the compounds were calculated using Crystal Explorer 17. Differing van der Waals radii determined the distance between the points on the surface to a nucleus (atom) inside (di) and outside (de) the mean surfaces. The Hirshfeld surface, fingerprint plots, and interaction energies of compounds have been calculated using Crystal Explorer 17.21 The C–H bond lengths converted to normalized values. This is based on neutron diffraction results.22 The interaction energies of compounds have been calculated using the CE-B3LYP/6-31G(d,p) functional/basis set combination. Superposition energy (BSSE) was corrected for the basis set using the counterpoise (CP) method.232.4. Density functional theory (DFT) calculations
Prior to investigating the effect of substituents on the synthesized DHPM derivatives on their non-covalent interactions and anticancer drug property, it is of importance to understand how the substituents impact the geometry of different synthesized DHPM derivatives (1.3, 1.4 and 1.5). We, therefore, carried out a series of density functional theory (DFT) calculations with the hybrid meta-GGA functional M06-2X24 and Pople's basis set 6-31+G(d,p), as implemented in Gaussian 09 software suite,25 to evaluate the stability of different possible conformers formed due to twisting of the phenyl rings with respect to the non-aromatic dihydropyrimidinone ring in the synthesized DHPM derivatives. The M06-2X functional developed by Truhlar's group is reported to be a reliable functional for the study of relative stability of conformers, noncovalent interactions, rate constants and for thermochemistry of a wide variety of molecular systems.26,272.5. Biological activity of 1.1–1.5
RPMI-1640 cell culture medium was purchased from Hyclone (GE healthcare life sciences, Marlborough, USA), penicillin–streptomycin–amphotericin B (PSA) cocktail, 0.25% trypsin EDTA, and Fetal Bovine Serum (FBS) were bought from Gibco, Thermo-fisher Scientific (Waltham, MA, USA); [3-(4,5-dimethylthiazol-2-yl)-2,5-diphenyltetrazolium bromide] (MTT) was purchased from Sisco Research Laboratories Pvt. Ltd. (Maharashtra, India). Dimethyl sulfoxide (DMSO), acridine orange, trypan blue, ethidium bromide, and Hoechst 33342 were acquired from Sigma-Aldrich (St. Louis, MO, USA).000 cells were plated in 12-well plates, subjected to various doses of 1.2, 1.4, and 1.5 for 24 and 48 h. The cells were harvested and pelleted at 1200 rpm for 5 min. The cells were mixed in 200 μl 1× PBS after removing the supernatant, and 0.5% trypan blue dye was added. Cells were counted under a phase-contrast microscope (Zeiss, Germany).000 cells were seeded in a 12-well plate followed by treatment with selected compounds 1.2 and 1.5 (200 μM) for 24 and 48 h time points. Afterward, cells were harvested and pelleted at 1200 rpm for 5 min. The cell mix was prepared in 50 μl of 1× PBS after removing the supernatant, and to 10 μl of cell aliquot 1 μl acridine orange (1 μg mL−1) and 1 μl ethidium bromide (1 μg mL−1) were added on a slide and mounted with a cover slip. The slides were subjected to fluorescence microscopy (Olympus, Japan), and photomicrographs were taken at 200×.000 cells per well were seeded and incubated at 37 °C in a humidified CO2 incubator and treated with a 200 μM concentration of 1.2 and 1.5 compounds. After treatment, media were removed, and cells were rinsed with PBS. 1 mL Hoechst 33342 stain (1 μg mL−1 in 1× PBS) was added to the wells and incubated in the dark for 15–20 min at 37 °C. Hoechst 33342 was removed, and cells were washed thrice with chilled 1× PBS. Cover slips were removed from the wells and placed upside down on the slide containing mounting media and subjected to fluorescent microscopy (Olympus, Japan), and photomicrographs were taken at 200×.2.6. Molecular docking
Molecular docking analysis was performed using the AutoDock Vina.28 The crystal structures of the human kinesin Eg5 and survivin protein were retrieved from the RSCB protein data bank (PDB id: 3UIH and 1X88, respectively).29 The protein preparation was done in autodock tools30 by removing co-crystallized ligands, embedded water molecules, and cofactors. It was further processed by adding polar hydrogens and saved in the pdbqt format. The crystal structure of ligands in .cif format were converted to .pdb format in Mercury, which is then imported to autodock tools to add gasteiger charges and saved in pdbqt format. The grid parameters for docking with the kinesin Eg5 motor domain were determined based on the native ligand monastrol. However, for survivin protein, the grid parameters were assigned carefully to encompass the binding sites at the dimerization interface and allosteric site located near it. The parameter was set to 9 modes for analyzing binding affinity, and subsequently, crystal compounds 1.1–1.5 were subjected to molecular docking with prepared proteins. The docking results were validated by re-docking. Further, validation of parameters for Eg5 was done by repeating the docking of the crystal structure of monastrol, which was extracted from Eg5 protein, then superimposing with native monastrol in Eg5 protein. The docked monastrol presented an RMSD value of 0.210 Å concerning native monastrol. Pymol and Discovery studio visualizer was used to analyze the docking results.3. Results and discussion
A series of DHPM derivatives (1.1–1.5) were synthesized using urea, ethyl acetoacetate with electron-rich and electron-deficient aromatic aldehydes through green catalyzed reaction given in Scheme 1. First-time Citrus macroptera juices were used as bio-catalyst for the synthesized DHPM derivatives, which showed better yield and shorter duration. This procedure is also an eco-friendly one, as it does not require any organic solvent for the reaction. Out of five compounds, three compounds (1.3–1.5) crystallized as single crystals. Cytotoxic activity of synthesized compounds was carried out against A549 lung adenocarcinoma cells to assess their anticancer activity.3.1. X-ray crystallographic studies of 1.3–1.5
All three prismatic transparent crystals (1.3, 1.4, and 1.5) were obtained using methanol solvent by slow evaporation, after 15 days, at room temperature. The ORTEP diagrams of 1.3, 1.4, and 1.5 are shown in Fig. 3. In all three crystal structures, the non-aromatic dihydropyrimidinone ring and phenyl ring occupied different planes. Compounds 1.4 and 1.5 crystallized in triclinic space group P![[1 with combining macron]](https://www.rsc.org/images/entities/char_0031_0304.gif) with two independent molecules in the unit cell. Compound 1.3 crystallized in monoclinic space group C2/c, having eight molecules in the unit cell. Further details of crystal data and refinement are presented in Table 1.
with two independent molecules in the unit cell. Compound 1.3 crystallized in monoclinic space group C2/c, having eight molecules in the unit cell. Further details of crystal data and refinement are presented in Table 1.
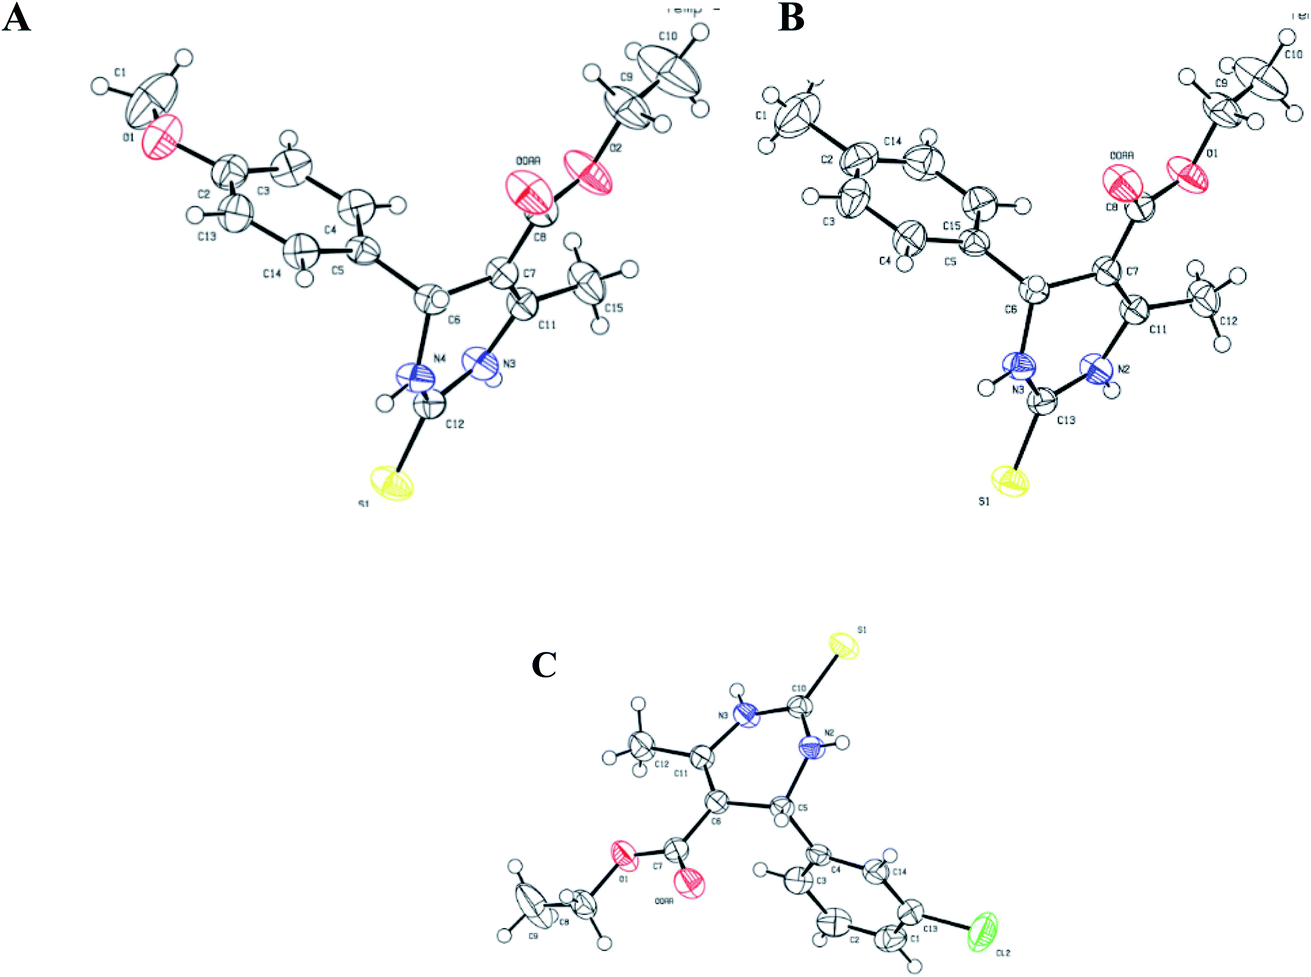 | ||
| Fig. 3 ORTEP diagram of ellipsoids at 50% probability level with the atomic numbering scheme for: (A) 1.3, (B) 1.4, and (C) 1.5. | ||
| Crystal data | 1.3 | 1.4 | 1.5 |
|---|---|---|---|
| Identification code | 1936021 | 1936022 | 1936023 |
| Empirical formula | C15H18N2O3S | C15H18N2O2S | C14H15N2O2SCl |
| Formula weight | 306.39 | 290.39 | 310.81 |
| Temperature (K) | 296 (2) | 296 (2) | 296 (2) |
| Crystal system | Monoclinic | Triclinic | Triclinic |
| Space group | C2/c | P |
P |
| a (Å) | 18.2332 (17) | 7.3603 (10) | 7.3066 (6) |
| b (Å) | 7.3341 (6) | 9.4648 (12) | 10.4657 (8) |
| c (Å) | 25.197 (2) | 12.2076 (16) | 10.6788 (9) |
| α (°) | 90 | 74.216 (4) | 107.568 (3) |
| β (°) | 101.888 (4) | 88.729 (4) | 90.538 (3) |
| γ (°) | 90 | 69.819 (4) | 107.829 (2) |
| Volume (Å3) | 3297.2 (5) | 765.70 (18) | 736.37 (10) |
| Z | 8 | 2 | 2 |
| ρ (g cm−3) | 1.2343 | 1.2594 | 1.4016 |
| μ (mm−1) | 0.207 | 0.214 | 0.403 |
| F (000) | 1297.5879 | 308.3750 | 324.6689 |
| Crystal size (mm3) | 0.24 × 0.22 × 0.22 | 0.22 × 0.20 × 0.18 | 0.26 × 0.25 × 0.20 |
| Radiation | Mo Kα (λ = 0.71073) | Mo Kα (λ = 0.71073) | Mo Kα (λ = 0.71073) |
| 2Θ range for data collection (°) | 2.28 to 28.37 | 2.96 to 2715 | 3.38 to 27.16 |
| Reflections collected | 39480 |
18180 |
14725 |
| Independent reflections | 4117 | 3387 | 3263 |
| Data/restraints/parameters | 4117/0/201 | 3387/0/192 | 3263/0/191 |
| Goodness-of-fit on F2 | 1.0714 | 1.0675 | 1.0760 |
| Final R indexes [I ≥ 2σ (I)] | R1 = 0.0636, wR2 = 0.1885 | R1 = 0.0423, wR2 = 0.1218 | R1 = 0.0384, wR2 = 0.1104 |
| Final R indexes [all data] | R1 = 0.0764, wR2 = 0.2033 | R1 = 0.0487, wR2 = 0.1298 | R1 = 0.0429, wR2 = 0.1156 |
| Largest diff. peak/hole/e Å−3 | 0.57/−0.43 | 0.34/−0.38 | 0.28/−0.43 |
In the crystal structure of compound 1.3, the crystal packing is stabilized by dimers through N–H⋯S hydrogen bonds in a R22 (8) ring motif (Fig. 4). One more intermolecular hydrogen bonding of N–H⋯O & C–H⋯O results in the generation of a dimeric structure, which can be described as R12 (6) graph-set notation in which thioamide & ester oxygen are involved (Fig. 4B). The hydrogen-bonding network for compound 1.3 and crystal packing are given in Fig. 4. Compound 1.3 exhibits a stacked arrangement of molecules. They exhibit a combination of parallel-displaced C–H⋯π, C–H⋯O, N–H⋯O, and N–H⋯S interactions (Table 2). D is the donor, and A is the acceptor in non-covalent interactions in Table 2. Both rings are arranged in an ABBA pattern in crystal packing. The acute angle between the plane of the non-aromatic ring and phenyl ring is 87.68°. The stacking distances for C–H⋯π were 2.669, 2.925, and 3.376 Å (Table 2 and Fig. 4C). The N–H⋯O and N–H⋯S bond distances for hydrogen bonding were 2.184, 2.463 Å, and angles on hydrogen atoms were 169.84°, 172.54°. Apart from these interactions, the C–H⋯O interactions also assist the interlayer connectivity and linear chain formation. The C–H⋯O bond distances for hydrogen bonding were 2.716, 2.770, 2.918 & 2.953 Å, and angles on hydrogen atoms were 132.54°, 137.19°, 119.22, and 118.79°, respectively (Table 2 & Fig. 4).
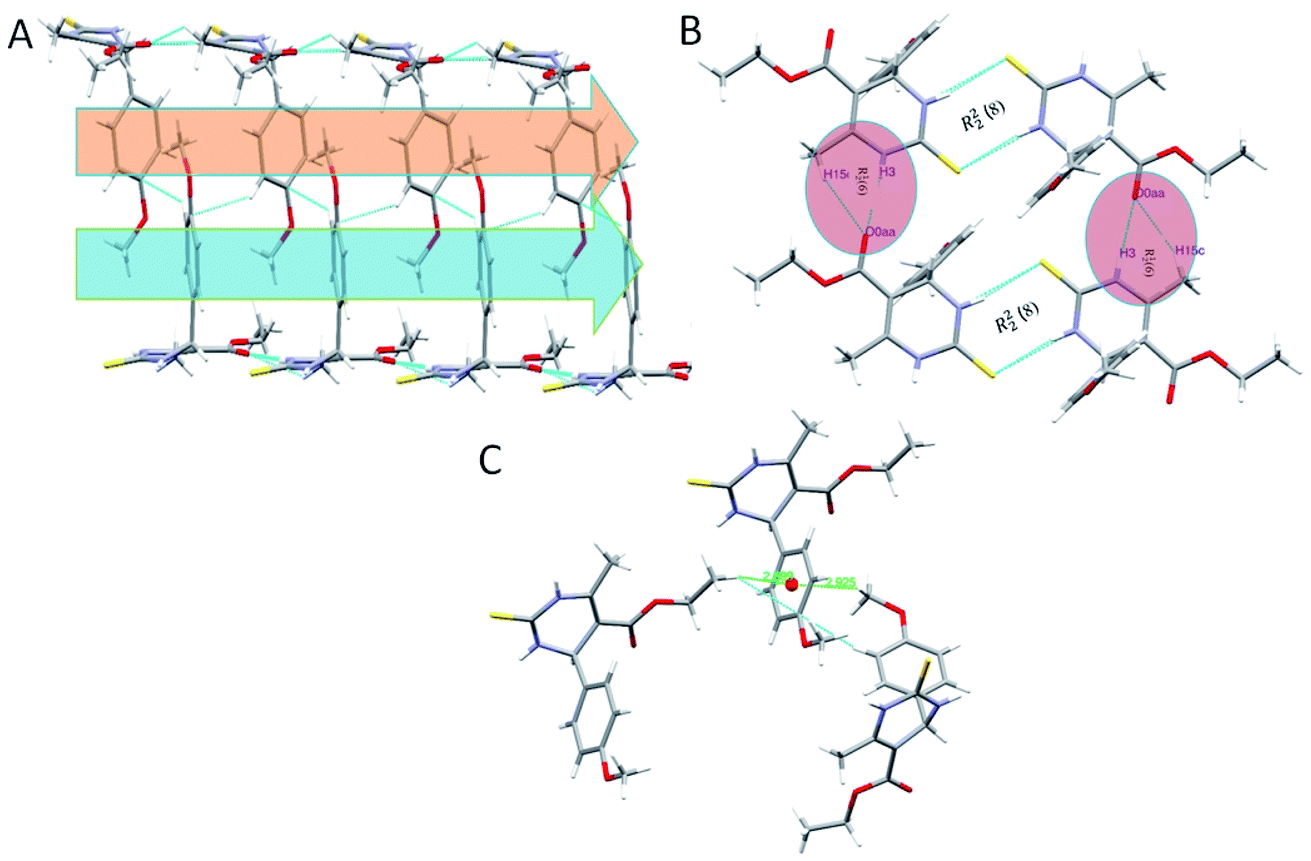 | ||
| Fig. 4 (A) Partial packing diagram of 1.3 showing C–H⋯π interactions with symmetry code 1.5 − x, −1/2 + y, 1.5 − z in layer A, layer B, (B) showing C–H⋯O, N–H⋯O, and N–H⋯S interactions forming R22 (8) and R12 (6) ring motifin 1.3, and (C) C–H⋯π interactions with symmetry code 1.5 − x, −1/2 + y, 1.5 − z and −1/2 + x, 1/2 + y, z. | ||
| D–H⋯A | D–H (Å) | H⋯A (Å) | D⋯A (Å) | D–H⋯A (°) | Symmetry operation |
|---|---|---|---|---|---|
| Compound 1.3 | |||||
| C1–H1c⋯Oaa | 0.959 | 2.770 | 3.534 | 137.19 | 1.5 − x, −1/2 + y, 1.5 − z |
| N4–H4⋯S1 | 0.862 | 2.463 | 3.316 | 169.84 | 1.5 − x, 1/2 − y, 1 − z |
| C3–H3a⋯O1 | 0.930 | 2.918 | 3.468 | 119.22 | 1.5 − x, −1/2 + y, 1.5 − z |
| C4–H4a⋯O1 | 0.930 | 2.953 | 3.497 | 118.79 | 1.5 − x, −1/2 + y, 1.5 − z |
| C15–H15c⋯O0aa | 0.960 | 2.716 | 3.439 | 132.54 | x, −1 + y, z |
| N3–H3⋯O0aa | 0.804 | 2.184 | 2.983 | 172.54 | x, −1 + y, z |
| C10–H10a⋯S1 | 0.961 | 3.251 | 4.001 | 137.89 | −1/2 + x, 1/2 + y, z |
| C14–H14⋯S1 | 0.930 | 3.144 | 3.875 | 136.92 | x, −1 + y, z |
| C6–H6⋯S1 | 0.980 | 3.182 | 4.095 | 155.77 | x, −1 + y, z |
| C1–H1a⋯π (C2, C3, C4, C5, C13, C14) | 0.960 | 3.627 | 3.684 | 1.5 − x, −1/2 + y, 1.5 − z | |
| C1–H1b⋯π (C5, C4, C2, C3, C13, C14) | 0.961 | 2.925 | 3.684 | 1.5 − x, −1/2 + y, 1.5 − z | |
| C10–H10c⋯π (C5, C4, C2, C3, C13, C14) | 0.959 | 2.699 | 3.641 | −1/2 + x, 1/2 + y, z | |
|
|||||
| Intramolecular | |||||
| C3–H3a⋯O1 | 0.930 | 2.644 | 2.443 | ||
| C13–H13a⋯O1 | 0.930 | 2.492 | 2.341 | ||
| C9–H9a⋯O0aa | 0.970 | 2.588 | 2.675 | ||
| C9–H9b⋯O0aa | 0.970 | 2.736 | 2.675 | ||
| C15–H15c⋯N3–H3 | 0.960 | 2.125 | 2.394 | ||
|
|||||
| Compound 1.4 | |||||
| C12–H12c⋯Oaa | 0.960 | 2.713 | 3.403 | 129.33 | −1 + x, y, z |
| C4–H4⋯S1 | 0.930 | 3.063 | 3.731 | 130.12 | −1 + x, y, z |
| C6–H6⋯S1 | 0.980 | 3.268 | 4.146 | 150.03 | −1 + x, y, z |
| N3–H3⋯S1 | 0.889 | 2.450 | 3.322 | 166.91 | 1 − x, −y, −z |
| N2–H2⋯O0aa | 0.810 | 2.257 | 3.058 | 170.02 | −1 + x, y, z |
| C12–H12a⋯Oaa | 0.960 | 2.713 | 3.403 | 129.33 | −1 + x, y, z |
|
|||||
| Intramolecular | |||||
| C15–H15⋯π (C6, C7, C11, C13, N2, N3) | 0.931 | 2.846 | 3.067 | ||
| C12–H12a⋯O1 | 0.960 | 2.914 | 2.800 | ||
| C12–H12b⋯O1 | 0.960 | 2.317 | 2.800 | 110.40 | |
| C6–H6⋯O0aa | 0.980 | 2.474 | 2.812 | ||
| C9–H9a⋯O0aa | 0.970 | 2.546 | 2.686 | ||
|
|||||
| Compound 1.5 | |||||
| C1–H1⋯O0aa | 0.980 | 2.747 | 3.684 | 159.68 | −1 + x, y, z |
| C12–H12a⋯O0aa | 0.960 | 3.456 | 3.390 | 119.22 | −1 + x, y, z |
| C12–H12c⋯O0aa | 0.960 | 2.705 | 3.390 | 128.86 | −1 + x, y, z |
| N3–H3⋯O0aa | 0.805 | 2.186 | 2.981 | 189.86 | −1 + x, y, z |
| C8–H8a⋯Cl2 | 0.970 | 2.952 | 3.767 | 142.39 | −x, 1 −y, 1 − z |
| N2–H2⋯S1 | 0.829 | 2.584 | 3.401 | 188.89 | 1 − x, 1 − y, 2 − z |
| C5–H5⋯S1 | 0.980 | 3.213 | 4.126 | 155.57 | −1 + x, y, z |
| C8–H8b⋯S1 | 0.970 | 3.098 | 4.024 | 160.25 | 1 − x, 2 − y, 2 − z |
| C9–H9a⋯S1 | 0.960 | 3.385 | 4.211 | 145.54 | 1 − x, 2 − y, 2 − z |
| C14–H14⋯S1 | 0.980 | 3.060 | 3.888 | 149.30 | 1 − x, 2 − y, 2 − z |
| C9–H9c⋯π (C1, C2, C3, C4, C13, C14) | 0.959 | 3.180 | 4.128 | x, −1 + y, z | |
| C2–H2a⋯π (C2, C1, C13, C14, C4, C3) | 0.930 | 3.611 | 3.874 | −x, 1 − y, 1 − z | |
| C1–H1⋯π (C1, C2, C3, C4, C13, C14) | 0.930 | 3.480 | 3.369 | −x, 1 − y, 1 − z | |
| (C1, C2, C3, C4, C13, C14) π⋯π (C3, C4, C14, C13, C1, C2) | 3.665 | −x, 1 − y, 1 − z | |||
|
|||||
| Intramolecular | |||||
| C5–H5a⋯O0aa | 0.980 | 2.449 | 2.786 | ||
| C8–H8a⋯O0aa | 0.970 | 2.578 | 2.670 | ||
| C8–H8b⋯O0aa | 0.970 | 2.732 | 2.670 | ||
| C12–H12a⋯O1 | 0.960 | 2.881 | 2.786 | ||
| C12–H12b⋯O1 | 0.960 | 2.309 | 2.786 | ||
The overall structure of 1.4 exhibits a combination of C–H⋯O, N–H⋯O, and N–H⋯S interactions (Table 2). Phenyl rings are arranged in a hairbone pattern in crystal packing. The acute angle between the plane of the non-aromatic ring and phenyl ring is 80.95°. Dimers also stabilize the crystal packing of compound 1.4 through N–H⋯O, N–H⋯S, & C–H⋯O hydrogen bonds in R12 (6), R22 (8), and R44 (20) ring motif, where thioamide & ester oxygen are involved (Fig. 5A and B). The hydrogen-bonding network for compound 1.4 and crystal packing are shown in Fig. 5. In addition to intermolecular C–H⋯O interactions compound, 1.4 also showed intra-molecular C–H⋯O interactions. The N–H⋯O and N–H⋯S bond distances for hydrogen bonding were 2.257, 2.450 Å, and angles on hydrogen atoms were 170.02°, 166.91°, respectively. The C–H⋯O bond distance and angle on hydrogen atom were 2.713 Å and 129.33°, respectively (Table 2 and Fig. 5). An intramolecular C–H⋯π interactions (H15⋯Cg = 2.846 Å) were also observed, which further stabilized interlayer connectivity of crystal structure.
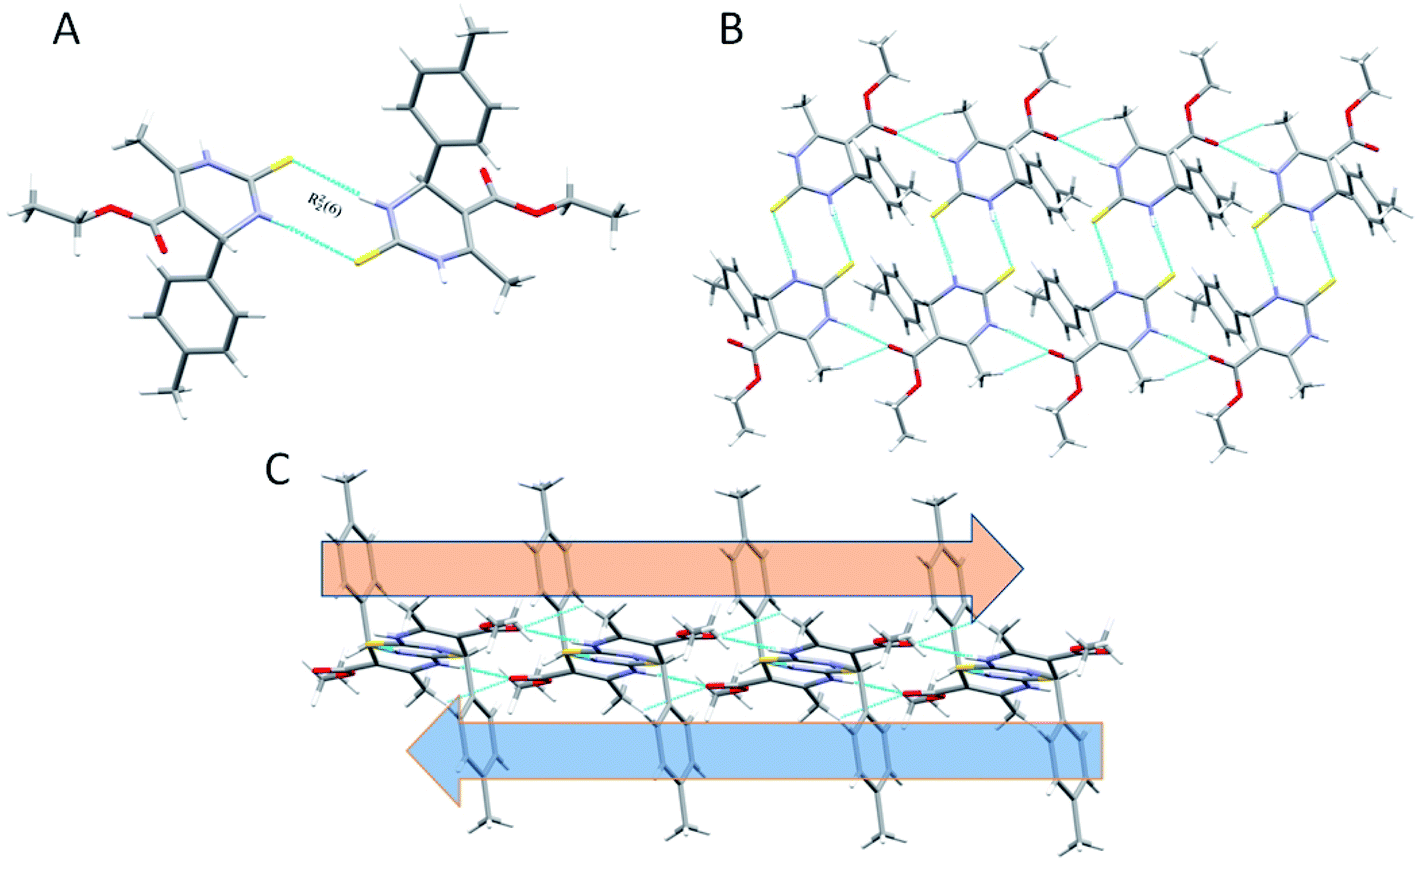 | ||
| Fig. 5 (A) Partial packing diagram of 1.4 forming R22 (8) ring motif with symmetry code 1 − x, −y, −z (B) showing N–H⋯O, C–H⋯O & N–H⋯S interactions in 1.4 (C)partial packing diagram showing an alternate layer of the ring in the alternate pattern. | ||
Crystal structure of 1.5 exhibits a combination of parallel-displaced C–H⋯π, C–H⋯O, N–H⋯O, and N–H⋯S interactions (Table 2). Both rings are arranged in the AABB pattern in crystal packing. The acute angle (dihedral angle) between the non-aromatic ring and phenyl ring plane is 80.18°. Crystal 1.5 also stabilized like the rest two crystals by the dimers through N–H⋯S, N–H⋯O & C–H⋯O non-traditional hydrogen bonds resulting in the R12 (6), R22 (8), and R44 (20) graph-set notation (Fig. 6). For crystal structure of 1.5, one π⋯π stacking interaction was also observed, and distance for π⋯π stacking interaction was 3.665 Å (Fig. 6B). The stacking distances for C–H⋯π were 3.180, 3.611, 3.480 Å (Table 2), which further assisted the interlayer connectivity and linear chain formation of crystal structure. The N–H⋯O and N–H⋯S bond distances for hydrogen bonding were 2.1876, 2.584 Å, and angles on hydrogen atoms were 138.86°, 168.69°, respectively (Table 2 and Fig. 6). The C–H⋯O bond distance for R12 (6) ring motif is 2.705 Å and angles on hydrogen atoms was 128.86°, while the other C–H⋯O bond distance were 2.747, 3.456 Å and angle on hydrogen atom were 159.68 and 119.28°, respectively (Table 2).
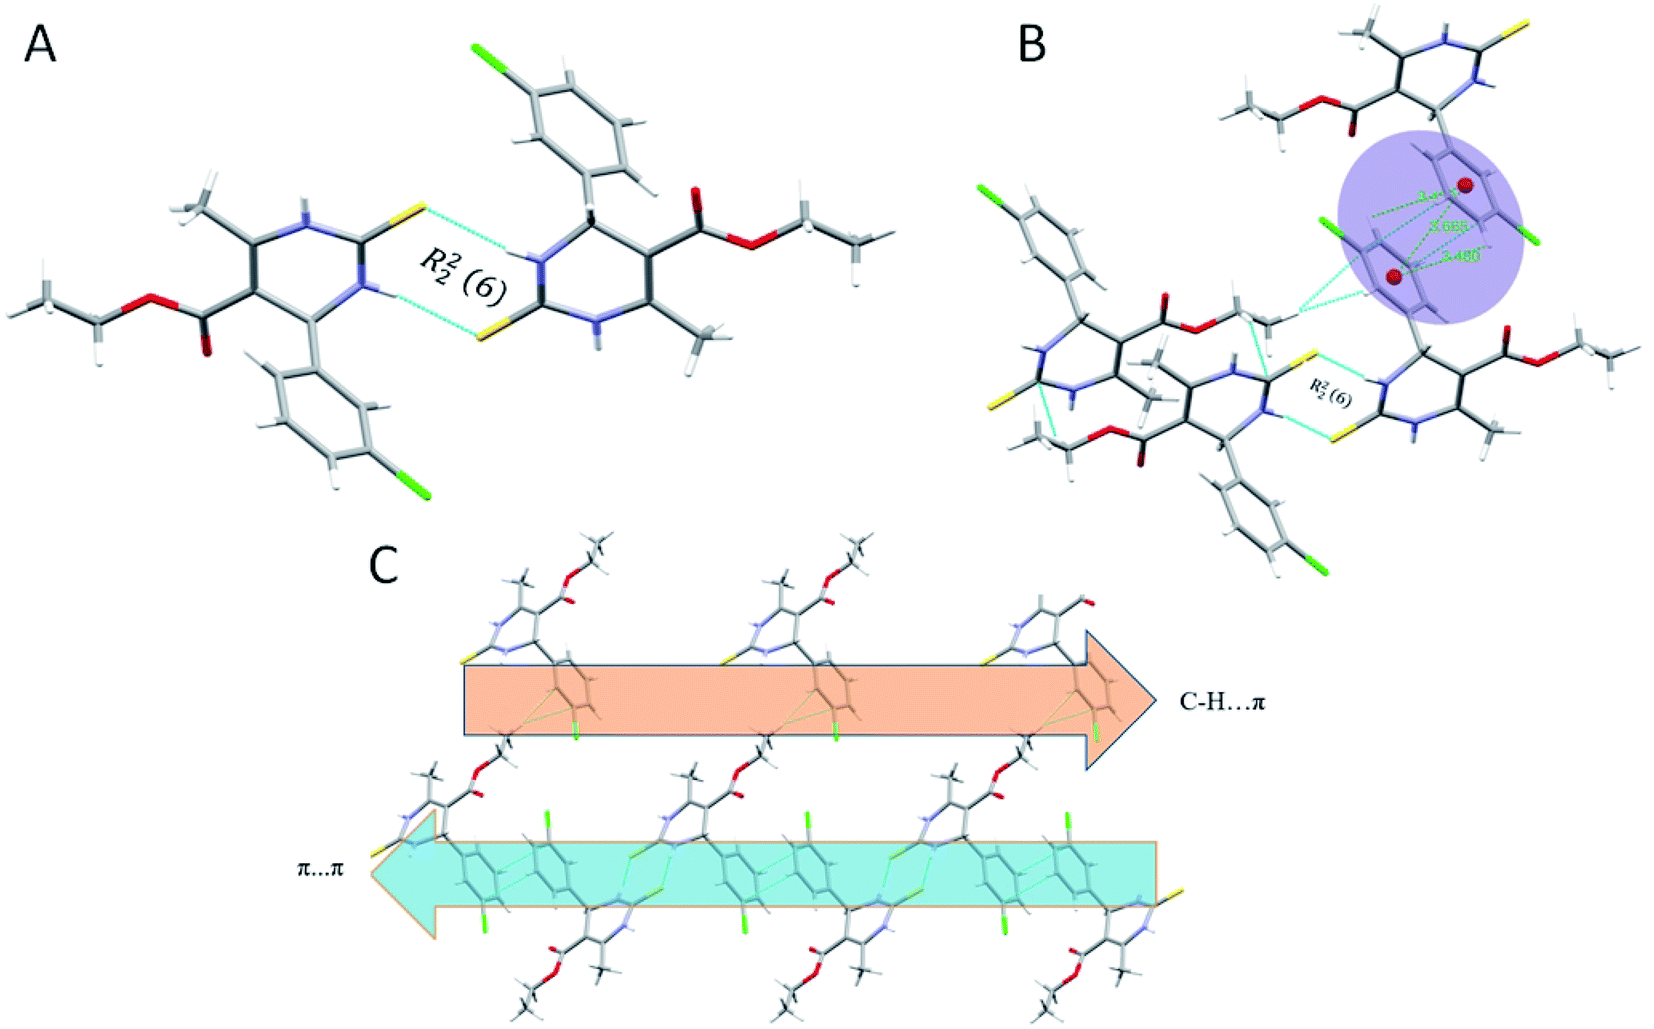 | ||
| Fig. 6 (A) Partial packing diagram of 1.5 forming R22 (8) ring motif with symmetry code 1 − x, 1 − y, 2 − z, (B) π⋯π and C–H⋯π interactions in 1.5, and (C) partial packing diagram of 1.5 showing C–H⋯π interactions in layer A, and π⋯π stacking interactions in layer B. | ||
3.2. Hirshfeld surface analysis of 1.3–1.5
The Hirshfeld surface analysis explores the intermolecular contacts and their role in crystal packing31,32 The Hirshfeld surface mapped on dnorm of compounds 1.3, 1.4, and 1.5 are displayed in Fig. S1(A), S2(A), and S3(A) (ESI†), where the red region indicates the weak interaction contacts with a shorter distance. In contrast, white and blue regions indicate weak interaction contacts with a distance longer and equal to the van der Waals radii, respectively (Fig. S1(A), S2(A), and S3(A)) (ESI†). The red color on the dnorm surface represents more dominant non-covalent C–H⋯O interactions in the crystal structure. The 2D fingerprint plot demonstrates the different combinations of de and di across the molecule's surface. In addition, it also represents the summary of weak intermolecular interactions in crystal structure and provides information about the percentage contribution of 3D Hirshfeld surface.33 The 2D fingerprint plots of compounds 1.3, 1.4, and 1.5 are shown in Fig. 7A, 8A and 9A, and percentage contributions of N⋯H, O⋯H, H⋯H, C⋯C, and C⋯H interactions are represented in a bar graph (Fig. S4) (ESI†). The Hirshfeld weak interactions calculation is in Table 3.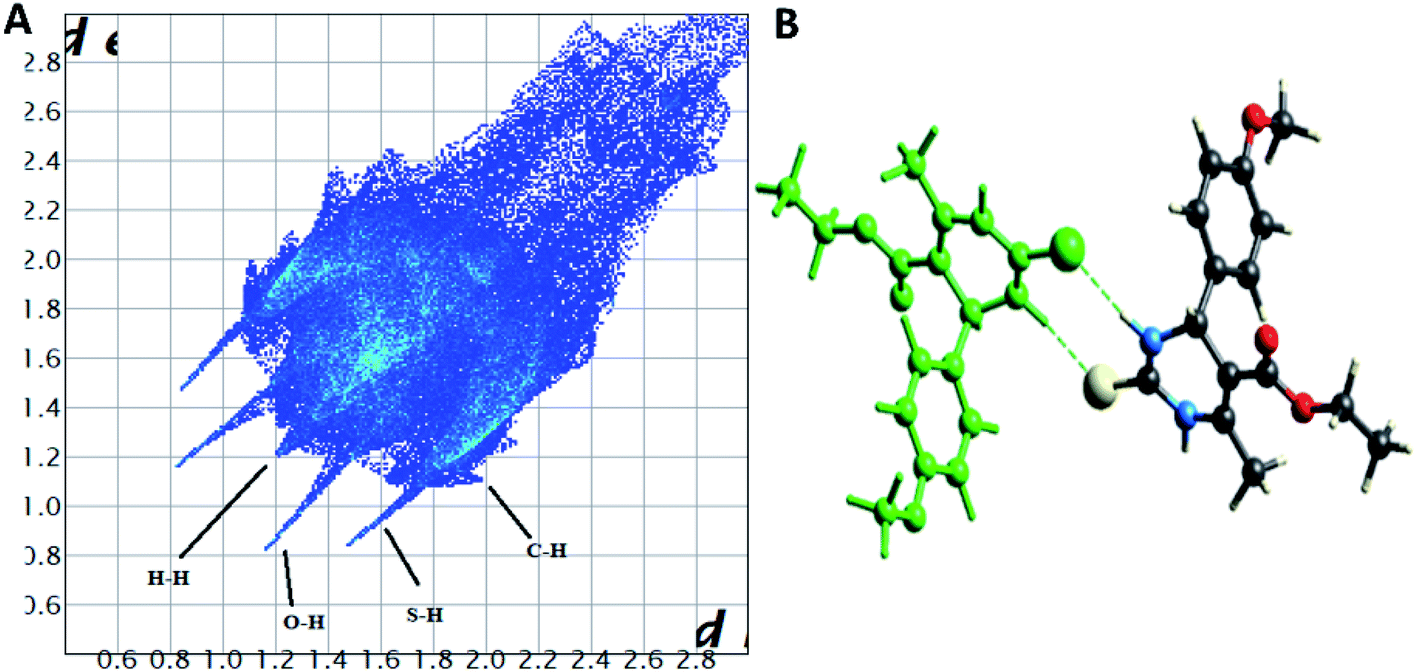 | ||
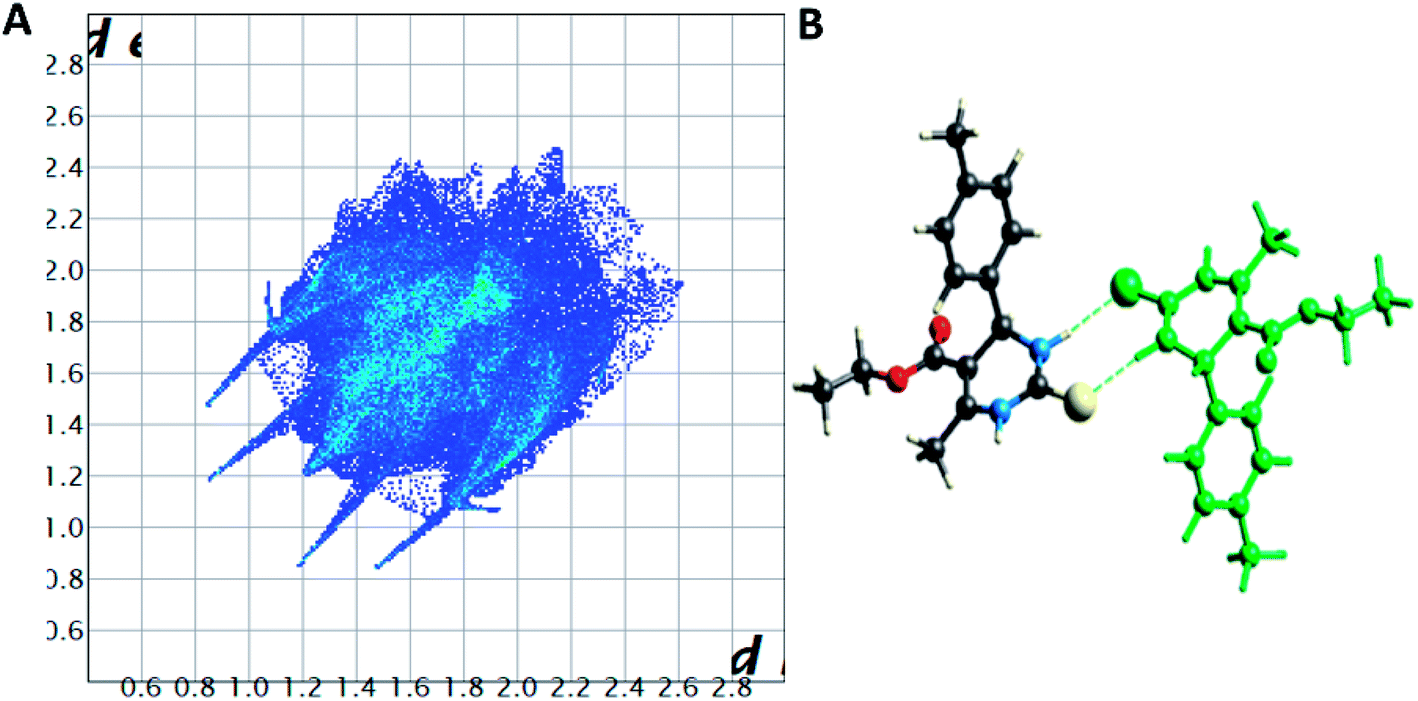
| Fig. 7 (A) Two-dimensional fingerprint plot for compound 1.3, (B) non-covalent interactions forming R22 (8) ring motif. | ||
 | ||
| Fig. 8 (A) Two-dimensional fingerprint plot for compound 1.4, (B) non-covalent interactions forming R22 (8) ring motif. | ||
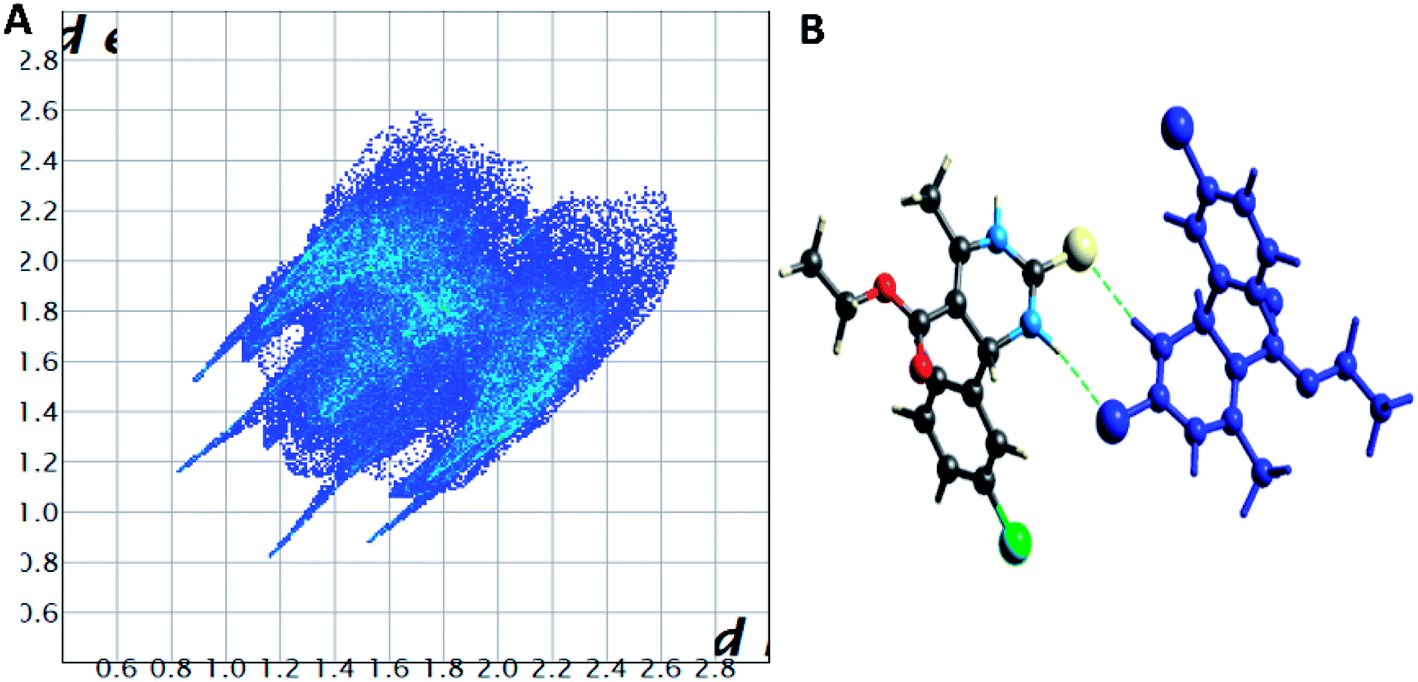 | ||
| Fig. 9 (A) Two-dimensional fingerprint plot for compound 1.5, (B) non-covalent interactions forming R22 (8) ring motif. | ||
| Donor–H⋯acceptor | D–H, Å | H⋯A, Å | D⋯A, Å | D–H⋯A, o | Symmetry operation |
|---|---|---|---|---|---|
| Compound 1.3 | |||||
| N3–H3⋯O0aa | 1.205 | 1.981 | 2.983 | 171.78 | x, y, z |
| N4–H4⋯S1 | 1.009 | 2.319 | 3.316 | 169.20 | −x + 1/2, −y + 1/2, −z |
| C3–H3a⋯C2 | 1.083 | 2.725 | 3.581 | 142.65 | −x + 1/2, y + 1/2, −z + 1/2 |
|
|||||
| Compound 1.4 | |||||
| N2–H2⋯O0aa | 1.009 | 2.061 | 3.058 | 169.06 | x, y, z |
| N3–H3⋯S1 | 1.009 | 2.334 | 3.322 | 166.24 | −x, −y, −z |
| C9–H9b⋯S1 | 1.083 | 2.993 | 4.046 | 164.18 | −x, −y, −z |
|
|||||
| Compound 1.5 | |||||
| C1–H1⋯O0aa | 1.083 | 2.604 | 3.634 | 158.51 | −x, −y, −z |
| N3–H3⋯O0aa | 0.504 | 2.981 | 4.189 | 168.82 | x, y, z |
| C9–H9c⋯C13 | 1.083 | 2.728 | 3.754 | 158.08 | x, y, z |
| C9–H9c⋯C14 | 1.083 | 2.750 | 3.797 | 162.65 | x, y, z |
| N2–H2⋯S1 | 0.504 | 2.408 | 3.401 | 167.85 | −x, −y, −z |
| C8–H8b⋯C10 | 1.083 | 2.676 | 3.672 | 152.66 | −x, −y, −z |
Spoke-like pattern in the fingerprint plots of 1.3, 1.4 and 1.5 represents C–H⋯O interactions in crystal lattice in region of di + de = 2.00–3.0 Å, with H⋯O/O⋯H contributions of 12.4%, 6.9% and 7.7%, respectively (Fig. 7A, 8A and 9A). The second spoke-like pattern in the fingerprint plots of 1.3, 1.4 and 1.5 represents C–H⋯S interactions in crystal lattice in region of di + de = 2.30–3.4 Å with H⋯S/S⋯H contributions of 15.1%, 15.5% and 16.7%, respectively (Fig. 7A, 8A and 9A). The C–H⋯π interactions in compounds 1.3, 1.4 and 1.5 can be seen as a pair of unique blue-colored wings in the region of di + de = 3.2–3.6 Å with H⋯C/C⋯H contribution of 15.2%, 14.2% and 12.9%, respectively (Fig. 7A, 8A and 9A). The C–H⋯N pair of contacts is also reflected as two characteristic wings occupied in di + de = 3.2–3.5 Å in compounds 1.3, 1.4, and 1.5. The yellowish-red bin is absent on the fingerprint plots in compounds 1.3 and 1.4, which means the absence of weak π⋯π stacking in crystal packing (Fig. 7A and 8A. However, there is a light yellowish-red bin (with C⋯C contact of contribution is 3.9%) present on the fingerprint plot indicates the existence of weak π⋯π stacking interactions between the phenyl rings in compound 1.5 (Fig. 9A). The Hirshfeld weak interactions calculation found a similar weak non-covalent intermolecular interactions pattern in crystal packing. C–H⋯π interactions, C–H⋯N, and C–H⋯O interactions, etc., of compound 1.3, 1.4 and 1.5 in crystal packing structure are in Fig. 7B, 8B, 9B) and Table 3. In all three crystal structure's, 1.3, 1.4, and 1.5, extensive hydrogen-bonding network of calculated interactions, terminal carbonyl oxygen, thio-pyrimidine nitrogen, and thio-pyrimidine sulfur are involved in weak interaction and forming eight membered R22 (8) (Fig. 7B, 8B and 9B) rings.
The role of π⋯π stacking is central importance in chemistry as well as bio medicine field. They are key interactions influencing the tertiary structure of proteins, the vertical base stacking in DNA, and the intercalation of different drugs into DNA, which helps in drug design. The role of π⋯π stacking also become prominent in drug–receptor interactions as most of the drugs are aromatic, and about 20% of amino acids are aromatic. The curvedness plots and shape index plots of 3D Hirshfeld is a very promising tool to visualize π⋯π stacking interactions in the crystals.34 In curvedness plots, the yellow spots represent very weak intermolecular interactions, and red-yellow colored spots represent strong hydrogen-bonding interactions in the crystal structures of 1.3, 1.4, and 1.5 (Fig. 10). In curvedness plots of compounds 1.3 and 1.4, the absence of green-colored flat regions bounded by red-colored rectangles on the phenyl rings further confirms the non-existence of π⋯π stacking effect in crystal packing (Fig. 10A & C). However, in the curvedness plots of compound 1.5, flat green colored regions bounded by red-colored rectangles on phenyl rings, once again confirm the presence of π⋯π stacking effect in crystal packing of 1.5 (Fig. 10E). Red and blue regions represent the acceptor and the donor property, respectively, in the shape index of compound 1.3, 1.4, and 1.5 (Fig. 10B, D & F). Yellowish-red colored concave regions inside the counters indicate the presence of weak intermolecular interactions in the Shape index plots of compounds 1.3, 1.4, and 1.5 (Fig. 10B and D).The absence of adjacent red and blue triangles in the shape-index map of 1.3 and 1.4 also proved the lack of π⋯π stacking effect in the crystal packing (Fig. 10B and D). There are adjacent red and blue triangles bounded by the black colored rectangles in the shape-index map of 1.5, once again confirms the π⋯π stacking effect in the crystal packing of 1.5 (Fig. 10F).
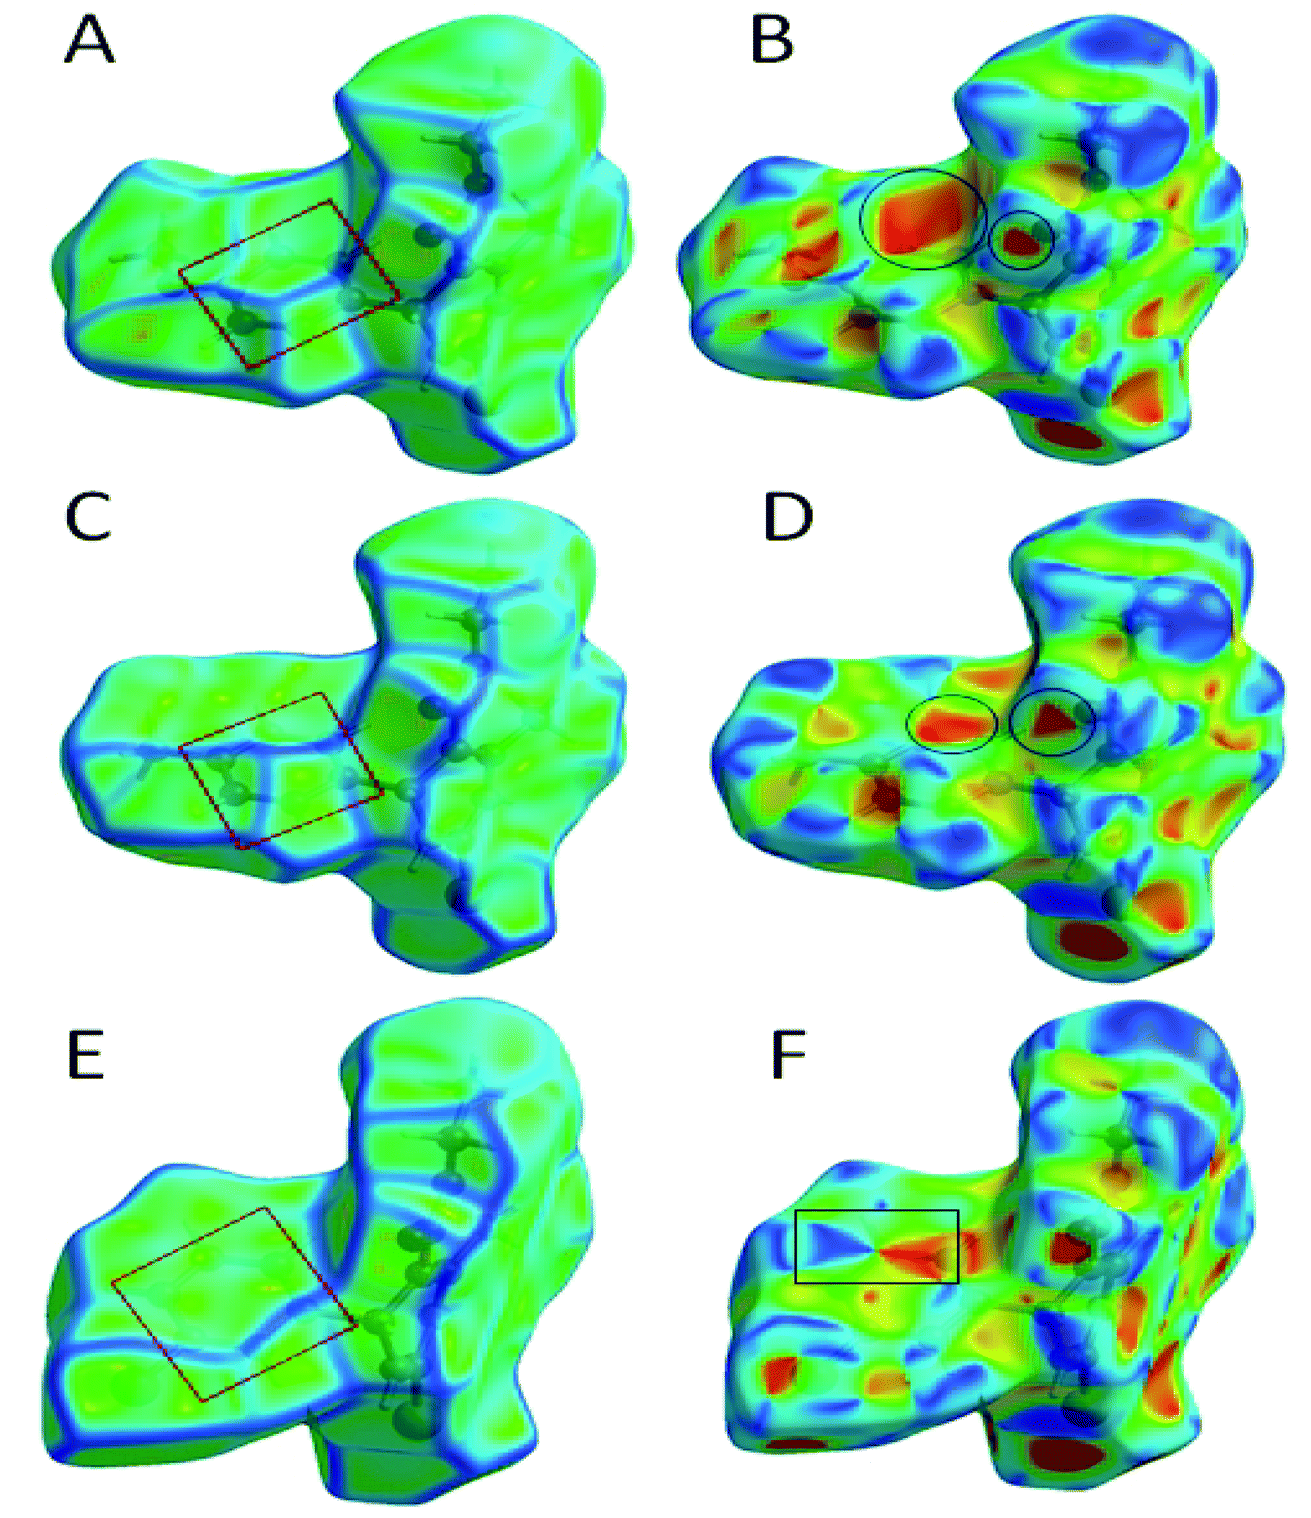 | ||
| Fig. 10 (A) Curvedness plot of compound 1.3, (B) shape index plot of compound 1.3, (C) curvedness plot of compound 1.4, (D) shape index plot of compound 1.4, (E) curvedness plot of compound 1.5, (F) shape index plot of compound 1.5. | ||
3.3. Density functional theory (DFT) calculations for 1.3, 1.4 and 1.5
We have also carried out the DFT calculations to know how the substituents impact the geometry of different synthesized DHPM derivatives and calculated the interaction energies of DHPM derivatives (1.3, 1.4 and 1.5) with their neighbouring molecules in the crystal structure at the M06-2X/6-31+G(d,p) level of theory. Torsional PES (potential energy surfaces) for twisting the phenyl rings in synthesized DHPM derivatives (1.3, 1.4 and 1.5) are shown in Fig. 11.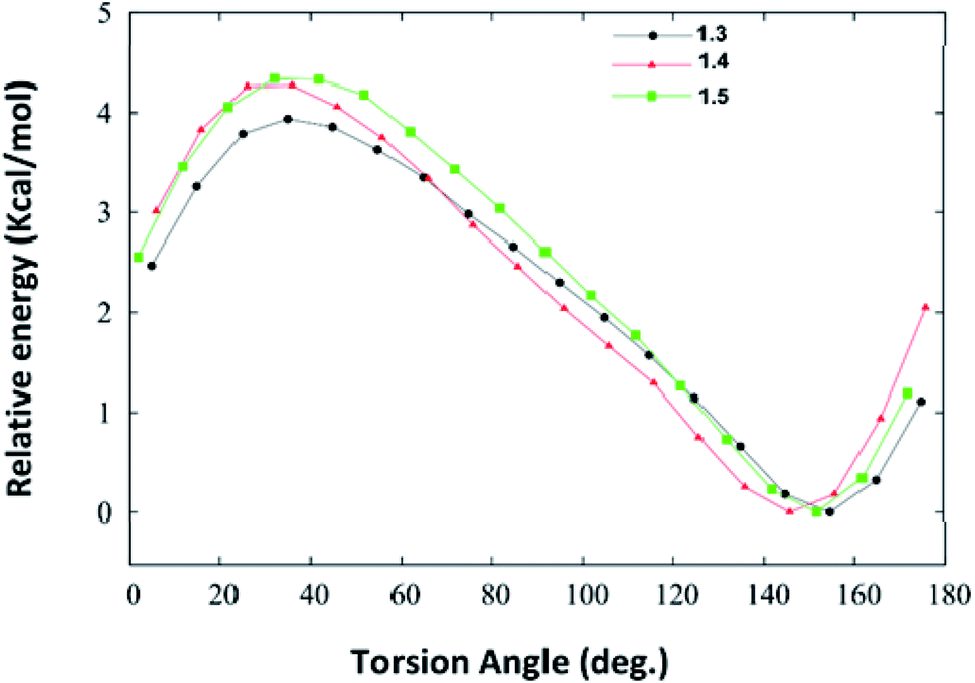 | ||
| Fig. 11 Potential energy surfaces for twisting the phenyl rings in the synthesized DHPM derivatives (1.3, 1.4, 1.5) as obtained at the M06-2X/6-31+G(d,p) level of theory. | ||
We note from Fig. 11 that each PES is characterized by only one minimum and the fully planar configurations (0° and 180°) are unstable. The DHPM derivatives with torsion angle (∼40°) are found to be energetically most unstable. The global minimum for 1.3, 1.4 and 1.5 molecule are found to be at torsion angle of 155.5°, 146.8° and 152.3°, respectively (Fig. 11), which is in agreement with their crystal structure. The optimized geometries of 1.3, 1.4 and 1.5 are shown in Fig. S5 (ESI†). Thus, our DFT calculations show that substituents do not impact the geometry of synthesized DHPM derivatives appreciably.
We also calculated the interaction energies of DHPM derivatives (1.3, 1.4 and 1.5) with their neighbouring molecules in the crystal structure at the M06-2X/6-31+G(d,p) level of theory. We considered neighbouring molecules which are in direct contact with a central molecule for complex formation and thus complexes formed by 8, 5 and 7 molecules for 1.3, 1.4 and 1.5, respectively, were taken for calculation of interaction energy. These complexes are shown in Fig. S7 and S8 (ESI†). The interaction energy of a complex was calculated as follows:
| Interaction energy = total energy of the complex − n × total energy of one molecule |
The interaction energies of the complexes of 1.3, 1.4 and 1.5 are found to be −103.20, −24.61, −90.81 kcal mol−1, respectively. The interaction energy per molecule for 1.3, 1.4 and 1.5 are −12.90, −6.15 and −12.97 kcal mol−1, respectively. This indicates that 1.4 has very less tendency to associate with other molecule as compared to 1.3 and 1.5 molecule.
3.4. Molecular docking analysis of 1.1, 1.2, 1.3, 1.4, and 1.5
In silico analysis was carried out for compounds 1.1, 1.2, 1.3, 1.4, and 1.5 to study the interactions and binding energies of these compounds with kinesin Eg5 protein (PDB id: 3UIH). Pymol and Discovery studio visualizer was for the analysis of docking results.The common trend in the binding interactions of compounds 1.2, 1.5, and 1 (monastrol) in the cavity of Eg5 is observed. Ester group protrudes outside the cavity of Eg5. In silico analysis revealed that compounds 1.2 and 1.5 showed better binding energy (−7.9 kcal mol−1) than the standard drug monastrol (−7.8 kcal mol−1) (Table 4). Chlorobenzene ring of compounds 1.2 and 1.5 is directed towards the hydrophobic region of the active site of Eg5 (Fig. 12A and B). The chlorobenzene ring of 1.2 and 1.5 are orientated towards the hydrophobic region, so π-anion interactions with the negatively charged residue Glu116 will be favorable. Compound 1.5 also showed one halogen bond with the residue Trp127, which indicated that compound 1.5 fits nicely into the cavity of Eg5. Further, the residues Ala 133, Pro137, and Tyr211, Leu214, and Arg221 facilitate the hydrophobic π-alkyl and alkyl interactions with compound 1.5 (Fig. 12B) and (Table 4).
| Compounds | Docking score (kcal mol−1) | Residues involved in H-bond | Residues involved in other interactions (π-anion, π–σ, π–π, π-alkyl, and alkyl) |
|---|---|---|---|
| 1.1 | −7.8 | Glu116 | Ala 133, Pro 137 |
| 1.2 | −7.9 | Glu116 | Leu160, Ile136, Leu214, Arg221, Phe239 |
| 1.3 | −7.1 | Glu116 | Glu116, Arg119, Leu214, Ala218 |
| 1.4 | −7.7 | Glu116 | Glu116, Ile136, Leu214, Phe239 |
| 1.5 | −7.9 | Glu116, Trp127 (halogen bond) | Ala 133, Pro137, Tyr211, Leu214, Arg221 |
| 1 (monastrol) | −7.8 | Glu116, Glu118 | Arg119, Ala133, Pro137, Leu214, Ala218 |
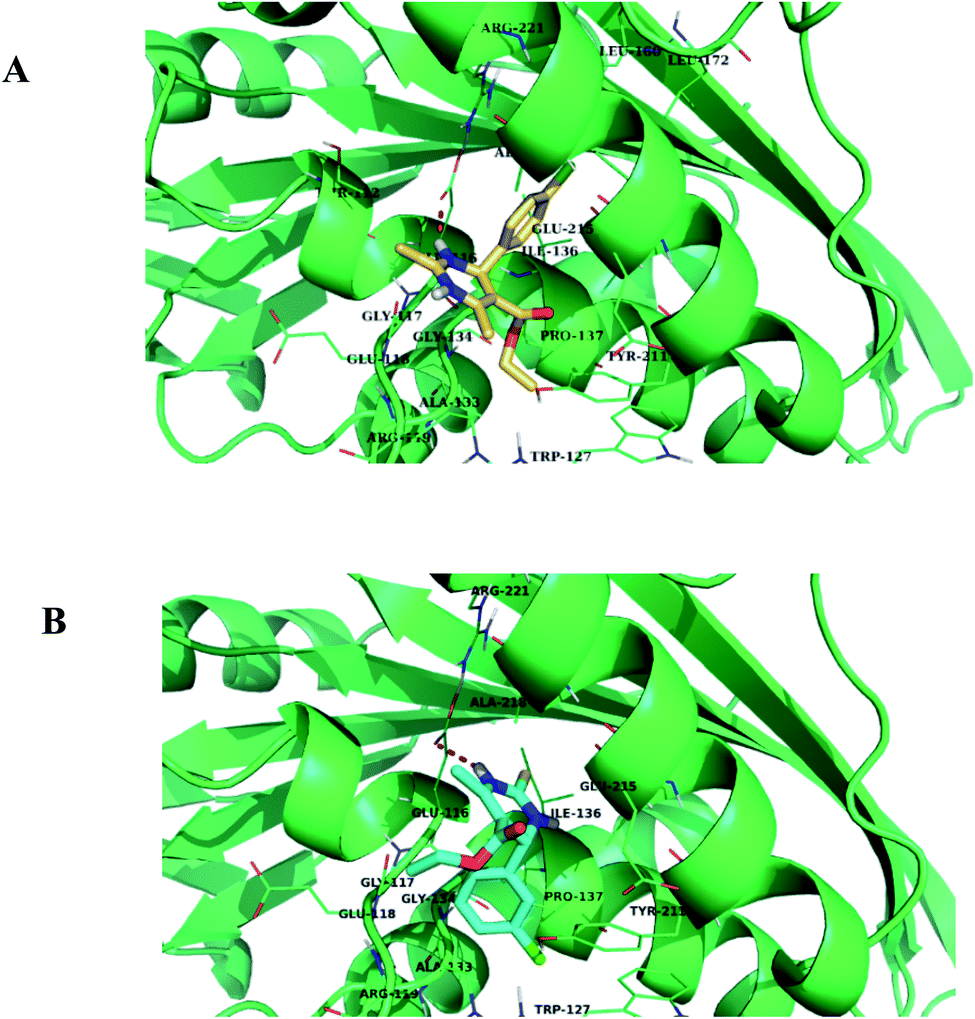 | ||
| Fig. 12 (A) and (B) Binding mode of compounds 1.2 and 1.5 in the active site cavity of Eg5 protein, respectively. | ||
3.5. Cytotoxicity and anti-cancer activity of 1.1–1.5
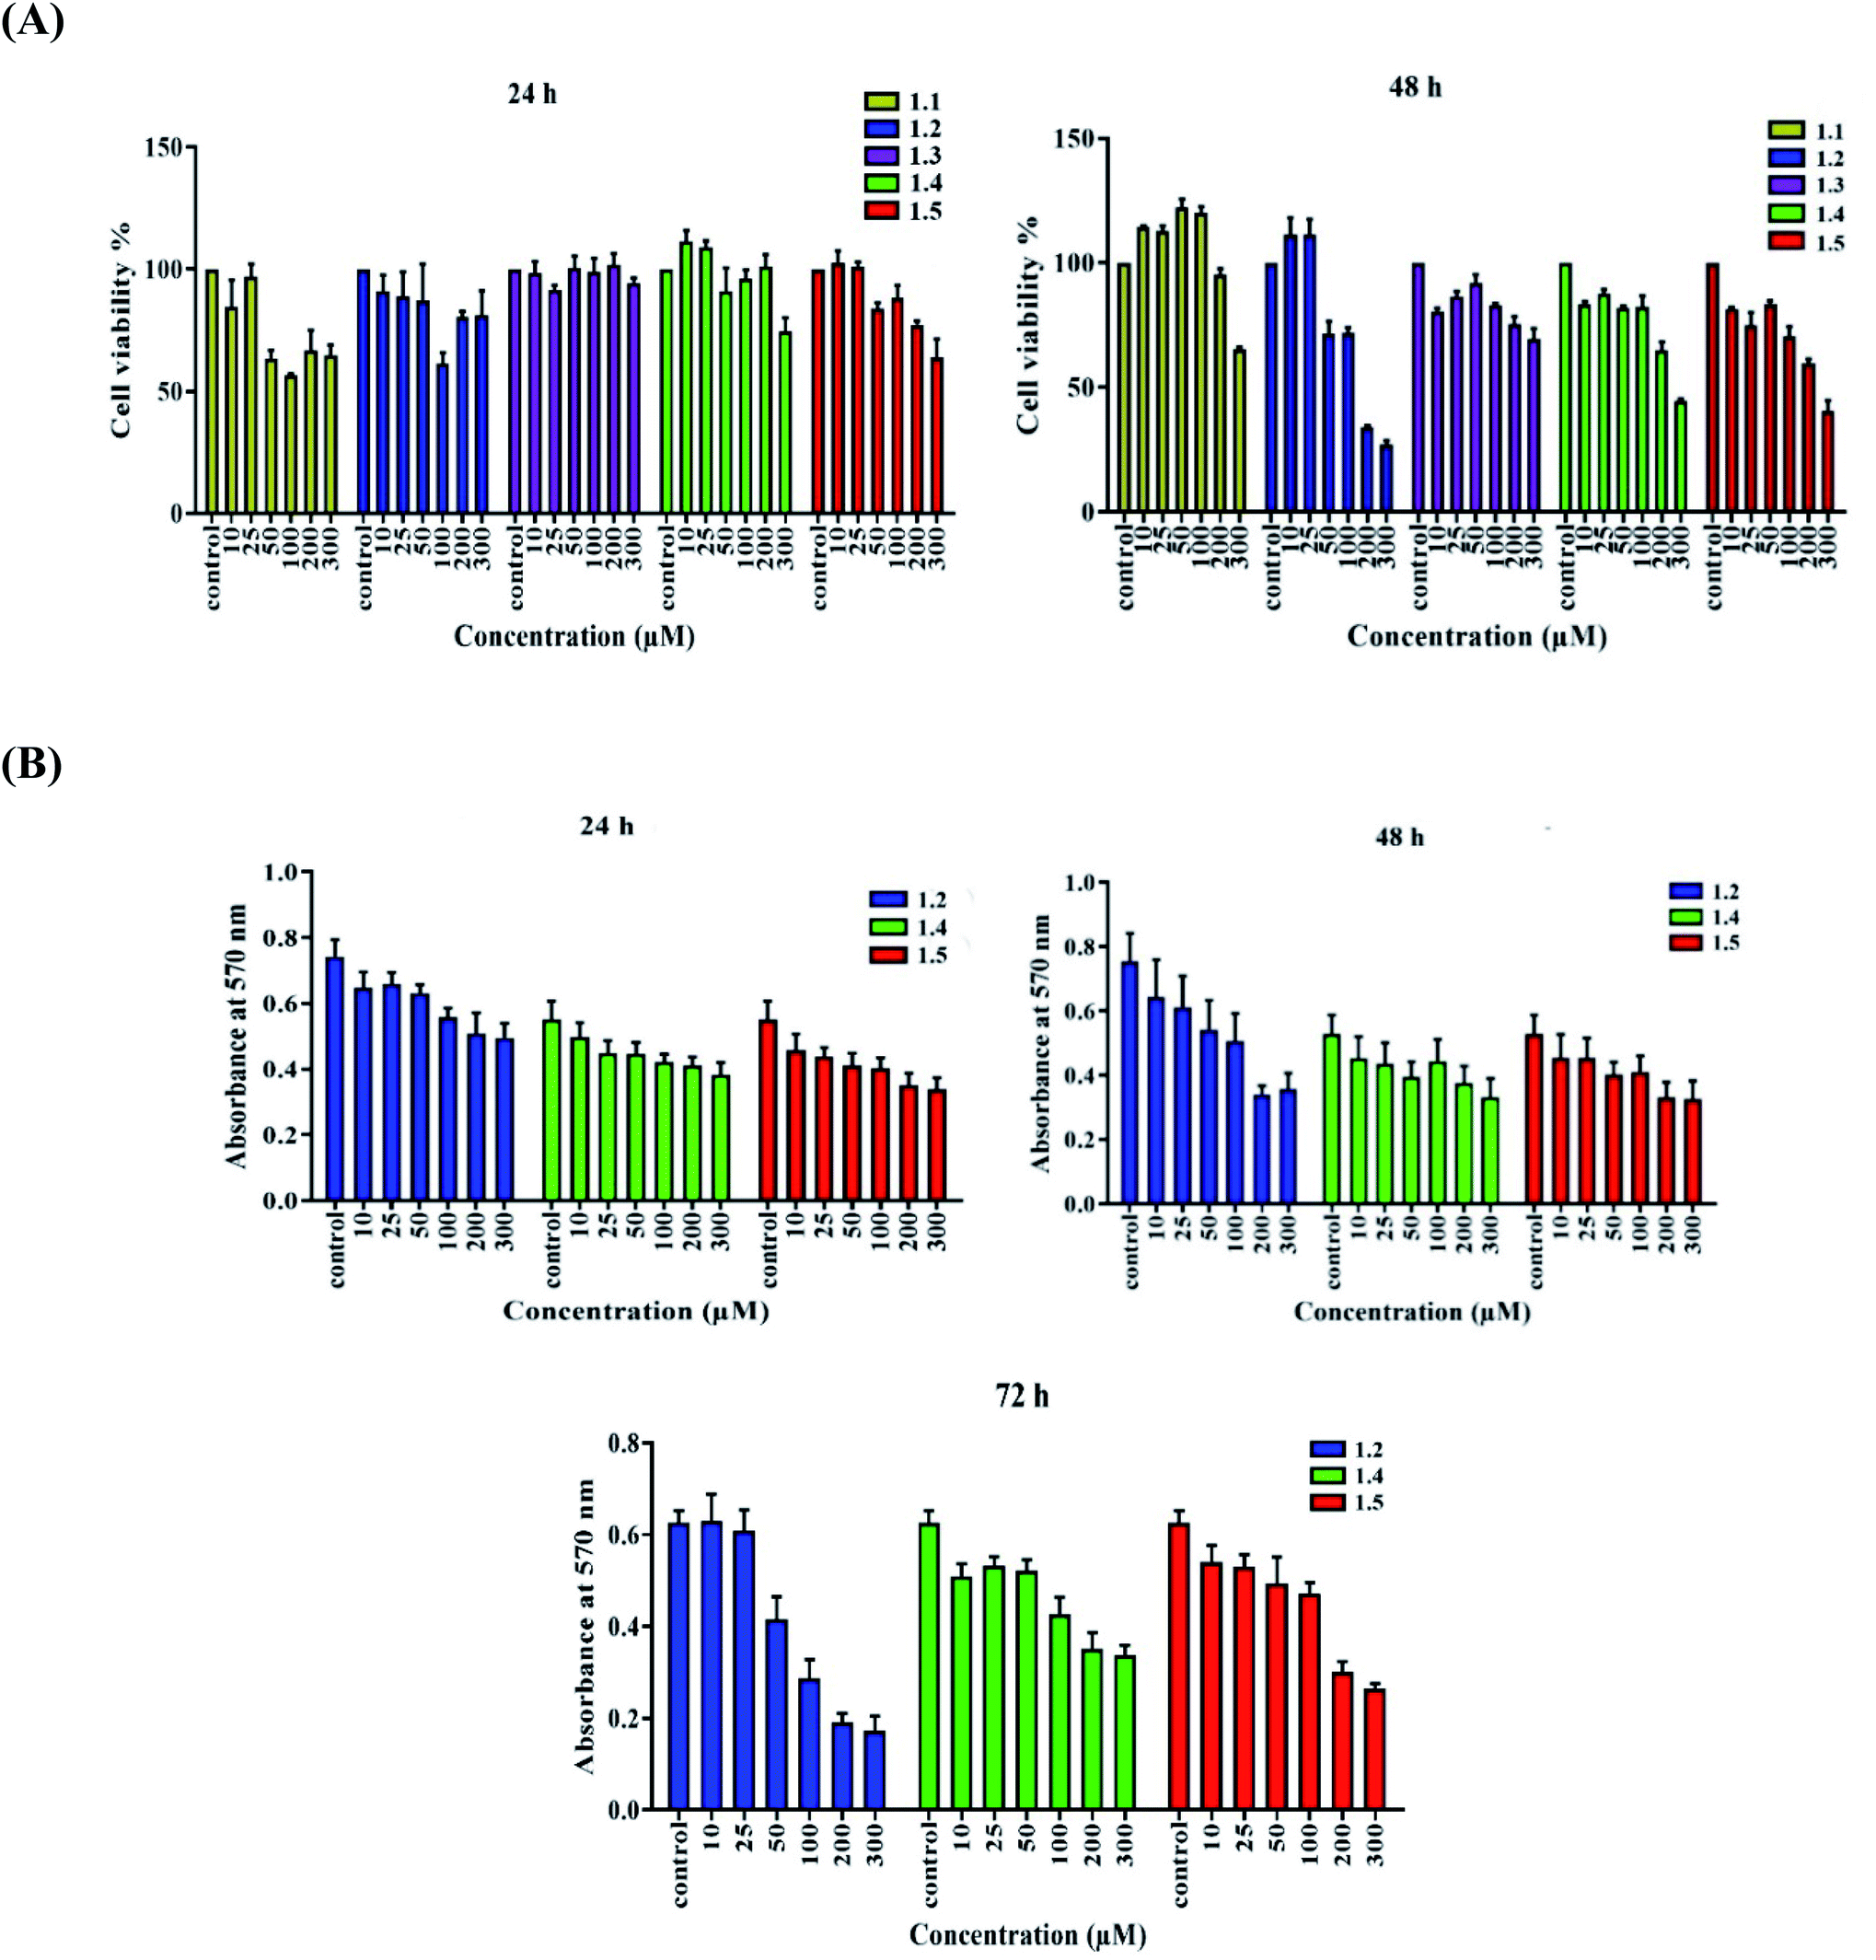 | ||
| Fig. 13 A549 lung adenocarcinoma cells were treated with (A) diverse concentrations (10, 25, 50, 100, 200, and 300 μM) of compounds (1.1, 1.2, 1.3, 1.4, and 1.5), and an MTT assay was done to test cell viability. (B) Varied concentrations of selected compounds 1.2, 1.4, and 1.5 were added for 24, 48, and 72 h, and an MTT assay was done. | ||
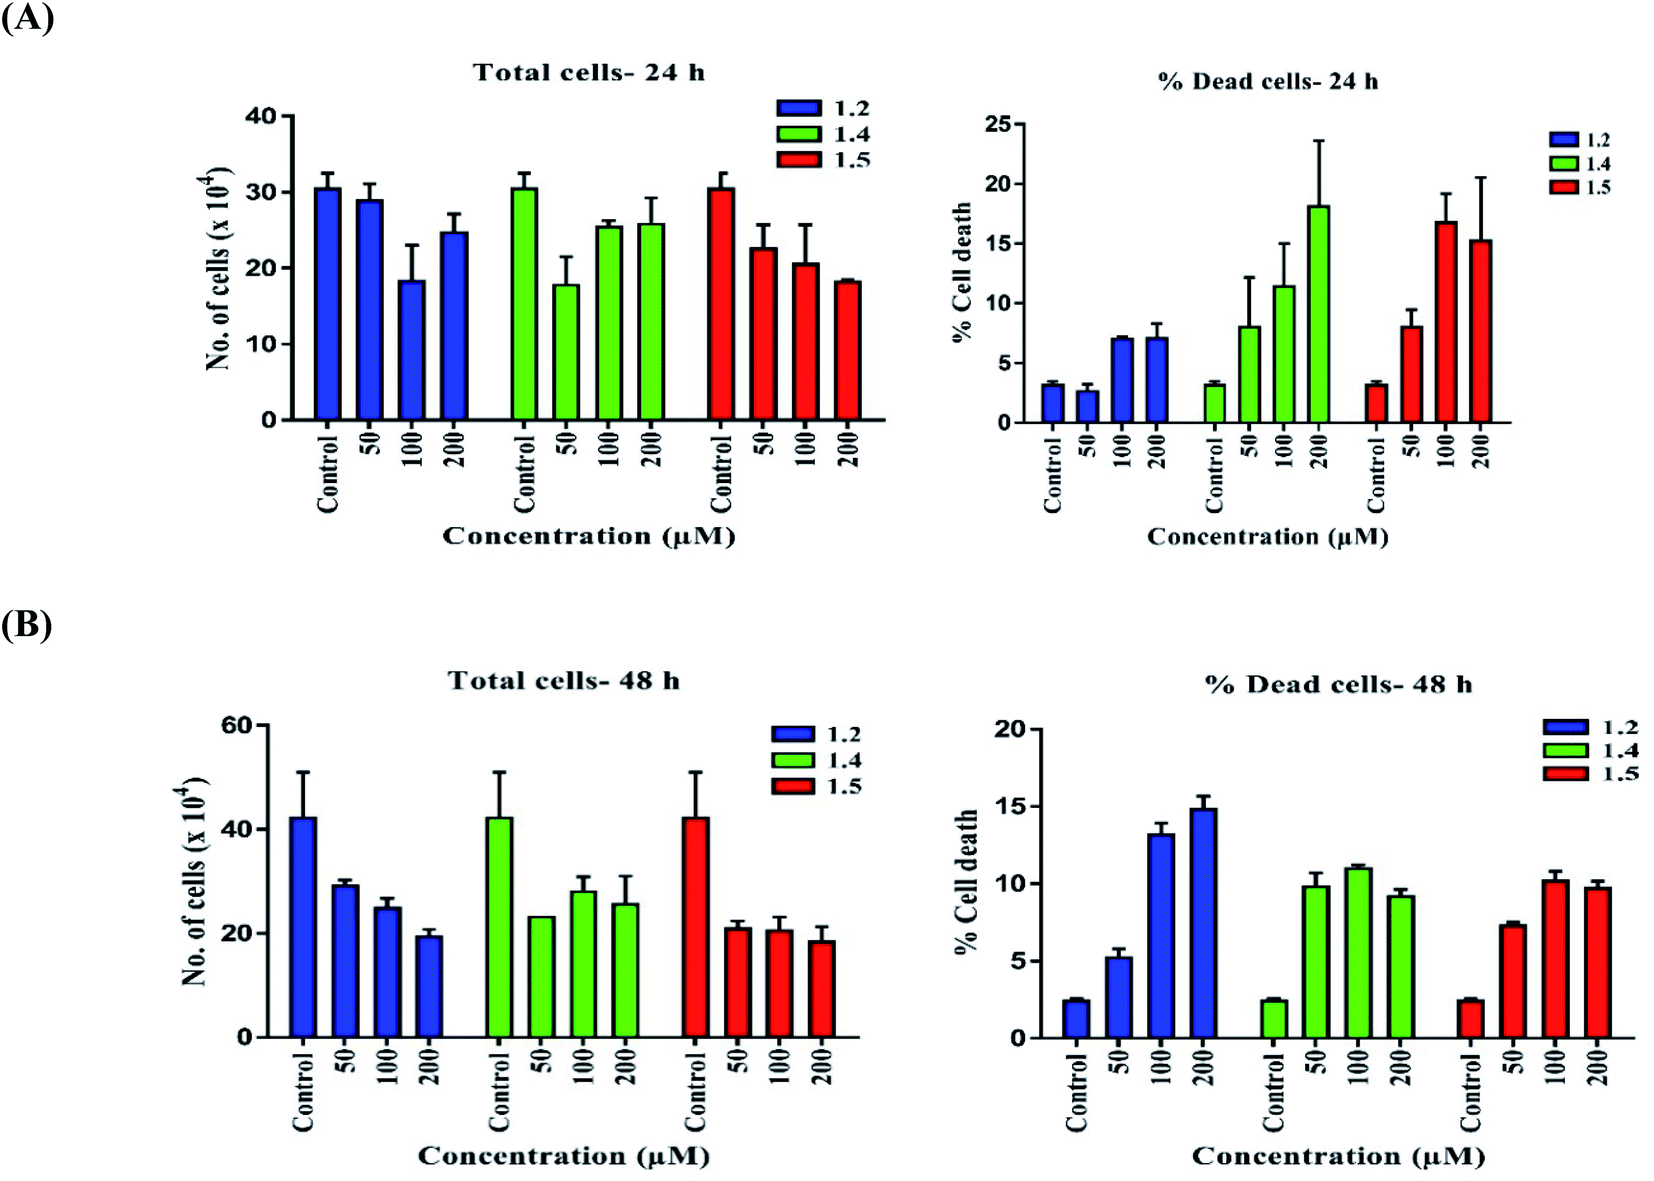 | ||
| Fig. 14 Trypan blue assay was performed to check the effect of 1.2, 1.4, and 1.5 at 50, 100, and 200 μM doses. Graphs represent percent cell death and the total number of cells for (A) 24 h and (B) 48 h. | ||
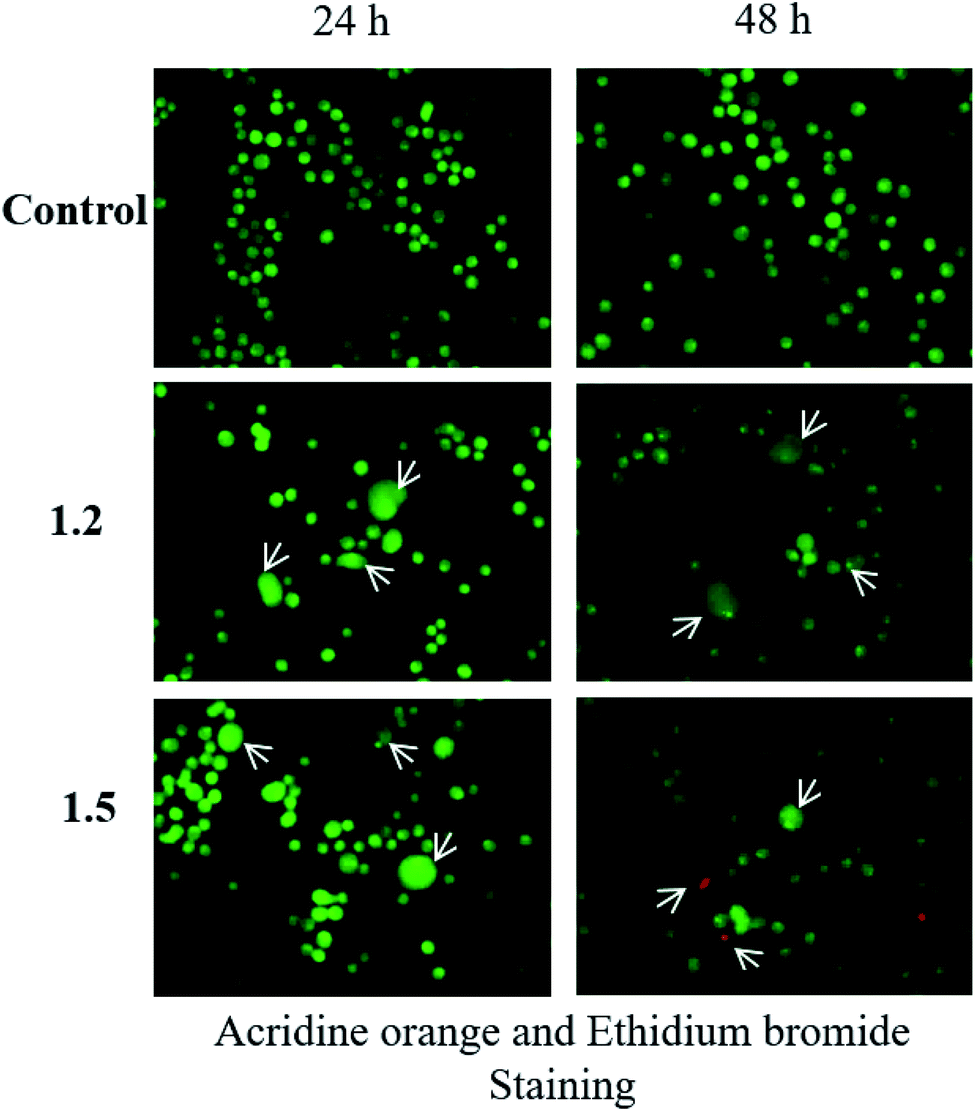 | ||
| Fig. 15 The lung adenocarcinoma cells were treated with 200 μM 1.2 and 1.5 compounds for 24 and 48 h and stained as described in methods (n = 3). | ||
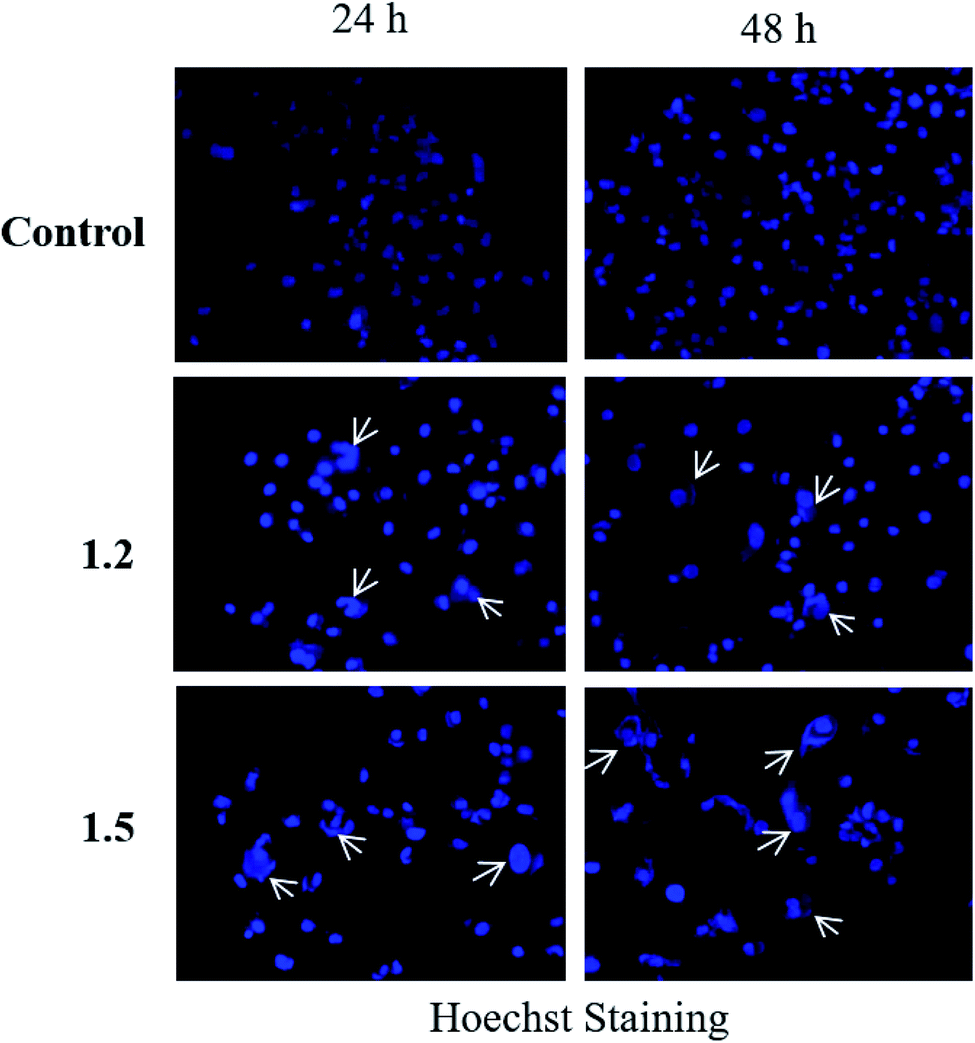 | ||
| Fig. 16 A549 adenocarcinoma cells were treated with 200 μM 1.2 and 1.5 compounds for 24 and 48 h and stained with Hoechst stain. Representative images are shown (n = 3) at 200× magnification. | ||
It has been observed that DHPM exists as a dimer as found in all 1.3, 1.4, and 1.5 crystal structures. Our results through the single crystal and Hirshfeld analysis found the existence of the dimeric structure of DHPM. The two such monomers lead to the dimer by forming an additional hydrogen bond yielding the bifurcated hydrogen bonds and N–H–S bridges. The presence of the thioamide group in the series exists in monomer–dimeric equilibrium. The two monomers lead to the dimer by forming by N–H–S hydrogen bond.
In addition to the N–H–S hydrogen bond (Figs. 4, 5, and 6), two more intermolecular hydrogen bonding interactions C–H⋯O, N–H⋯O are observed between the oxygen atom of the ester group and hydrogen atom of the thioamide group. These additional H-bonds form tetramer of DHPM. The overall structure of the tetramer is close to planar. Hydrogen bonding represents one of the most versatile interactions that could be used for molecular recognition. It might be possible to interfere with the strength of the hydrogen bond effectively by linking the hydrogen-bonding site to a binding site of the molecule with the receptor. The presence of π⋯π stacking in compound 1.5 will also help to study the drug receptor interactions of this compound.
A comparision of in vitro effects of synthesized DHPM derivatives (1.2 and 1.5) with potent anticancer agents such as monastrol, dimethylenastron, compounds 1, 2, and 3 (Fig. 2) from DHPM scaffold is shown in Table 5. Monastrol and dimethylenastron inhibit mitotic kinesin Eg5 protein, whereas compound 1 inhibit proliferation of prostate cancer cells PC3 (IC50 = 37 μM) as well as lung cancer cells NCI–H1299 (IC50 = 40 μM). Compound 2 inhibit proliferation of leukemia cell lines HL-60(TB) (IC50 = 0.05656 μM) as well as MOLT-4 (IC50 = 1.788 μM). Compound 3 also inhibit proliferation of breast cancer cell lines SK-BR-3 with GIC50 value of ±0.4 μM. Whereas, synthesized DHPM derivatives 1.2 and 1.5 significantly inhibit proliferation of lung adenocarcinoma cells A549 at 200 μM concentration.
| Anticancer drugs | Target with efficiency |
|---|---|
| Monastrol | Inhibit mitotic kinesin Eg5 protein (IC50 = 14 μM) |
| Dimethylenastron | Inhibit mitotic kinesin Eg5 protein(IC50 = 200 nM) |
| Compound 1 | Inhibit proliferation of prostate cancer cells PC3 (IC50 = 37 μM), lung cancer cells NCI–H1299 (IC50 = 40 μM) |
| Compound 2 | Inhibit proliferation of leukemia cell lines HL-60(TB) (IC50 = 0.05656 μM) and against MOLT-4 (IC50 = 1.788 μM) |
| Compound 3 | Inhibit proliferation of breast cancer cell lines SK-BR-3 (GIC50 = ±0.4 μM) |
| 1.2 | Significantly inhibit proliferation of lung adenocarcinoma cells A549 at 200 μM |
| 1.3 | Significantly inhibit proliferation of lung adenocarcinoma cells A549 at 200 μM |
Both in silico and in vitro results also found the same order of anti-cancer activity. An in silico study showed that order of binding affinity is 1.2–1.5 > 1.1 > 1.4 > 1.3, whereas in vitro study showed that variants 1.2, 1.4, and 1.5 decreased the cell viability significantly. Analogues 1.2, 1.4, and 1.5 also induced significant cell death in A549, but 1.2 and 1.5 were found significant in this group. Both 1.2 and 1.5 treatment caused apoptosis-induced cell death in A549 cells. Nuclear fragmentation in A549 adenocarcinoma cells by Hoechst staining showed that both 1.2 and 1.5 can induce apoptosis in cells.
As shown in tables 1.4, the values of inhibition zone for ligands are related to the nature of substituent as they increase according to the following order: p-Cl ∼ m-Cl > H > p-CH3 > p-OCH3. This can be attributed to the fact that the effective charge experienced by the central ring increased due to de-activating substituent (p-Cl ∼ m-Cl). At the same time, it decreased by activating group H > p-CH3 > p-OCH3. It is important to note that existence of a methyl and/or methoxy group enhances the electron density in the ring and simultaneously decreases inhibition zone values.
Electron withdrawing bridge would be expected to increase the acidity of proton donors and hence increase its binding ability as the electron-withdrawing character of a chloro group is relevant to the best analogue 1.2 and 1.5. In general, hydrogen bonds involving OH groups are proton donors, and their O atoms are proton acceptors. Both intra and intermolecular OH–N may form several structures in simultaneous equilibrium.
The DHPM series of compounds can induce intracellular oxidation resulting in cytosolic toxicity and genome toxicity in cancer cells. These events can further cause changes at the molecular level, ultimately resulting in an altered cell cycle leading to apoptosis. These events could also reduce migration ability and impede tumor growth resulting in reduced tumor size and migration of cancer cells. These findings suggest that 1.2 and 1.5 might be potential anticancer drug candidates. Thus, these analogues can be promising agents for treating various cancers, including lung cancer.
4. Conclusion
In summary, we elaborated green syntheses of dihydropyrimidinones using Citrus macroptera juice in a solvent-free reaction and deduced the primary SAR of anti-cancer. The advantages of this procedure include good yield, short reaction time, and eco-friendly procedure. The meaningful SARs can be drawn as follow: (i) deactivating group (Chlorine) at 3, 4 positions in the substituted ring of DHPM enhance activity; (ii) activating group in DHPM scaffold not suitable for active drug towards cancer cell. Moreover, we have studied the aromatic interactions using the single-crystal X-ray diffraction (SCXRD) method and the Hirshfeld surface analysis method. We found that C–H⋯π, C–H⋯O, C–H⋯N, C–H⋯C, lone pair⋯π, π⋯π interactions for synthesized compounds were beneficial for drug design, stabilization of DNA structure, protein folding, crystal engineering, material science, etc. Hirshfeld's surface analysis showed various intermolecular interactions in the crystal structures supporting the single-crystal X-ray diffraction (SCXRD) study. DFT calculations show that substituent does not impact the geometry of synthesized DHPM derivatives and conformational study of molecule reveals that it can change its conformation to get best interaction with active site. By these studies, exposure of different groups in analogues in the solid-state provides a clue for further study for biological activity concerning different receptors. As far as cytotoxicity and anticancer activity of these compounds are concerned, we found that they showed good anticancer activity. The anticancer activity was carried out in Human lung adenocarcinoma (A549) cells, where two derivative compounds (1.2 and 1.5) from Scheme 1 showed anticancer activity. The anticancer activity of these compounds (1.2 and 1.5) was well supported by in silico analysis, where they showed better binding energy than standard drug monastrol. Compound 1.4 showed poor anticancer activity compare to 1.2 and 1.5 molecules due to weak tendency of weak interactions as per finding in DFT calculation. Thus, anticancer activities suggest that our synthesized compounds could be potential candidates to develop anticancer drugs.Conflicts of interest
There are no conflicts to declare.Acknowledgements
The DBT and CSIR project supported this work. The authors are grateful to the Department of Chemistry, Mizoram University, Aizawl, Mizoram, India, and the DST-FIST to provide departmental facilities. Brilliant N. Marak acknowledges the NFST for research fellowship. Jayanta Dowarah acknowledges the DST to Inspire fellowship.References
- H. Sung, et al., Global Cancer Statistics 2020: GLOBOCAN Estimates of Incidence and Mortality Worldwide for 36 Cancers in 185 Countries, Ca-Cancer J. Clin., 2021, 71, 209–249 CrossRef PubMed.
- B. N. Marak, J. Dowarah, L. Khiangte and V. P. Singh, A comprehensive insight on the recent development of Cyclic Dependent Kinase inhibitors as anticancer agents, Eur. J. Med. Chem., 2020, 203, 112571 CrossRef CAS PubMed.
- S. Sana, et al., Design and synthesis of substituted dihydropyrimidinone derivatives as cytotoxic and tubulin polymerization inhibitors, Bioorg. Chem., 2019, 93, 103317 CrossRef PubMed.
- T. U. Mayer, Small Molecule Inhibitor of Mitotic Spindle Bipolarity Identified in a Phenotype-Based Screen, Science, 1999, 286, 971–974 CrossRef CAS PubMed.
- E. W. Hurst and R. Hull, Two New Synthetic Substances Active against Viruses of the Psittacosis-Lymphogranuloma-Trachoma Group, J. Med. Pharm. Chem., 1961, 3, 215–229 CrossRef CAS PubMed.
- E. Klein, et al., New chemical tools for investigating human mitotic kinesin Eg5, Bioorg. Med. Chem., 2007, 15, 6474–6488 CrossRef CAS PubMed.
- B. Ramesh and C. M. Bhalgat, Novel dihydropyrimidines and its pyrazole derivatives: Synthesis and pharmacological screening, Eur. J. Med. Chem., 2011, 46, 1882–1891 CrossRef CAS PubMed.
- G. C. Rovnyak, et al., Dihydropyrimidine calcium channel blockers. 4. Basic 3-substituted-4-aryl-1,4-dihydropyrimidine-5-carboxylic acid esters. Potent antihypertensive agents, J. Med. Chem., 1992, 35, 3254–3263 CrossRef CAS PubMed.
- T. M. Kapoor, T. U. Mayer, M. L. Coughlin and T. J. Mitchison, Probing Spindle Assembly Mechanisms with Monastrol, a Small Molecule Inhibitor of the Mitotic Kinesin, Eg5, J. Cell Biol., 2000, 150, 975–988 CrossRef CAS PubMed.
- L. Duan, et al., Centrin: Another target of monastrol, an inhibitor of mitotic spindle, Spectrochim. Acta, Part B, 2015, 137, 1086–1091 CrossRef CAS PubMed.
- Y. A. Abassi, et al., Kinetic Cell-Based Morphological Screening: Prediction of Mechanism of Compound Action and Off-Target Effects, Chem. Biol., 2009, 16, 712–723 CrossRef CAS PubMed.
- L. Zhu, et al., Synthesis and Biological Evaluation of Novel Homocamptothecins Conjugating with Dihydropyrimidine Derivatives as Potent Topoisomerase I Inhibitors, Arch. Pharm., 2011, 344, 726–734 CrossRef CAS PubMed.
- T. Pramanik, K. Majeed and R. Gupta, Solvent free and Catalyst free Synthesis of Octahydroquinazolinone Via Grindstone Chemistry: A Total Green Approach, Orient. J. Chem., 2017, 33, 2090–2094 CrossRef CAS.
- T. Pramanik and A. H. Pathan, Exploring the utility of fruit juices as green medium for Biginelli reaction, Res. J. Pharm., Biol. Chem. Sci., 2014, 5, 444–449 CAS.
- A. Bhatewara, S. R. Jetti, T. Kadre, P. Paliwal and S. Jain, Microwave-Assisted Synthesis and Biological Evaluation of Dihydropyrimidinone Derivatives as Anti-Inflammatory, Antibacterial, and Antifungal Agents, Int. J. Med. Chem., 2013, 2013, e197612 Search PubMed.
- .IUCr, SHELX-97, https://www.iucr.org/resources/other-directories/software/shelx-97 Search PubMed.
- L. J. Farrugia, WinGX suite for small-molecule single-crystal crystallography, J. Appl. Crystallogr., 1999, 32, 837–838 CrossRef CAS.
- L. J. Farrugia, ORTEP-3 for Windows - a version of ORTEP-III with a Graphical User Interface (GUI), J. Appl. Crystallogr., 1997, 30, 565 CrossRef CAS.
- A. L. Spek, Structure validation in chemical crystallography, Acta Crystallogr., Sect. D: Biol. Crystallogr., 2009, 65, 148–155 CrossRef CAS PubMed.
- J. J. McKinnon, M. A. Spackman and A. S. Mitchell, Novel tools for visualizing and exploring intermol-ecular interactions in molecular crystals, Acta Crystallogr., Sect. B: Struct. Sci., 2004, 60, 627–668 CrossRef PubMed.
- C. F. Mackenzie, P. R. Spackman, D. Jayatilaka and M. A. Spackman, CrystalExplorer model energies and energy frameworks: extension to metal coordination compounds, organic salts, solvates and open-shell systems, IUCrJ, 2017, 4, 575–587 CrossRef CAS PubMed.
- F. H. Allen, D. G. Watson, L. Brammer, A. G. Orpen and R. Taylor, Typical interatomic distances: organic compounds, in International Tables for Crystallography, ed. E. Prince, International Union of Crystallography, 2006, pp. 790–811 Search PubMed.
- S. F. Boys and F. Bernardi, The calculation of small molecular interactions by the differences of separate total energies. Some procedures with reduced errors, Mol. Phys., 1970, 19, 553–566 CrossRef CAS.
- Y. Zhao and D. G. Truhlar, The M06 suite of density functionals for main group thermochemistry, thermochemical kinetics, noncovalent interactions, excited states, and transition elements: two new functionals and systematic testing of four M06-class functionals and 12 other functionals, Theor. Chem. Acc., 2008, 120, 215–241 Search PubMed.
- M. J. Frisch, G. W. Trucks, H. B. Schlegel, G. E. Scuseria, M. A. Robb, J. R. Cheeseman, G. Scalmani, V. Barone, B. Mennucci, G. A. Petersson, et al., Gaussian 09, revision D.01, Gaussian, Inc., Wallingford, CT, 2013 Search PubMed.
- M. Walker, A. J. A. Harvey, A. Sen and C. E. H. Dessent, Performance of M06, M06-2X, and M06-HF Density Functionals for Conformationally Flexible Anionic Clusters: M06 Functionals Perform Better than B3LYP for a Model System with Dispersion and Ionic Hydrogen-Bonding Interactions, J. Phys. Chem. A, 2013, 117, 12590–12600 CrossRef CAS PubMed.
- N. Mardirossian and M. Head-Gordon, How Accurate Are the Minnesota Density Functionals for Noncovalent Interactions, Isomerization Energies, Thermochemistry, and Barrier Heights Involving Molecules Composed of Main-Group Elements?, J. Chem. Theory Comput., 2016, 12, 4303–4325 CrossRef CAS PubMed.
- O. Trott and A. J. Olson, AutoDock Vina: Improving the speed and accuracy of docking with a new scoring function, efficient optimization, and multithreading, J. Comput. Chem., 2010, 31, 455–461 CAS.
- Lalhruaizela, et al., Study of supramolecular self-assembly of pyridone and dihydropyridone co-crystal: synthesis, crystal structure, Hirshfeld surface, DFT and molecular docking studies, J. Mol. Struct., 2021, 1235, 130214 CrossRef CAS.
- E. F. Pettersen, et al., UCSF Chimera—A visualization system for exploratory research and analysis, J. Comput. Chem., 2004, 25, 1605–1612 CrossRef CAS PubMed.
- V. P. Singh, J. Dowarah, B. N. Marak, B. S. Sran and A. K. Tewari, Study of the structure-bioactivity of fleximers: synthesis, crystal structure, Hirshfeld surface analysis, and anti-inflammatory assays, J. Mol. Struct., 2021, 1239, 130513 CrossRef CAS.
- J. Dowarah, B. N. Marak, Lalhruaizela, B. S. Sran and V. P. Singh, Design, Synthesis, In Silico Analysis, and Structural Study of 4,6-Dimethyl-2-(3-(p-tolyloxy)propoxy)nicotinonitrile Fleximer, Cryst. Res. Technol., 2020, 55, 2000100 CrossRef CAS.
- V. P. Singh, J. Dowarah, A. K. Tewari and D. K. Geiger, Structural chemistry and anti-inflammatory activity of flexible/restricted phenyl dimers, J. Iran. Chem. Soc., 2020, 17, 1289–1303 CrossRef CAS.
- N. R. Sreenatha, et al., Crystal, spectral characterization, molecular docking, Hirshfeld computational studies and 3D-energy framework analysis of a novel puckered compound (C14H15ClO): 2-Chloro-3-phenyl-5,5-dimethylcyclohex-2-en-1-one, J. Mol. Struct., 2020, 1210, 127979 CrossRef CAS.
Footnote |
| † Electronic supplementary information (ESI) available. CCDC 1936021–1936023. For ESI and crystallographic data in CIF or other electronic format see DOI: 10.1039/d1ra03969e |
| This journal is © The Royal Society of Chemistry 2021 |