
 Open Access Article
 This Open Access Article is licensed under a Creative Commons Attribution-Non Commercial 3.0 Unported Licence
Self-induced cobalt-derived hollow structure Prussian blue as a cathode for sodium-ion batteries†
Yu Luo ,
Jiayu Peng and
Youwei Yan*
,
Jiayu Peng and
Youwei Yan*
State Key Laboratory of Material Processing and Die & Mould Technology, School of Materials Science and Engineering, Huazhong University of Science and Technology, Wuhan, Hubei 430074, China. E-mail: yanyw@hust.edu.cn
First published on 27th September 2021
Abstract
As advanced electrode materials for sodium ion batteries, Prussian blue and its derivatives have attracted considerable attention due to their low cost, structural stability and facile synthesis process. However, the application of commercially available Prussian blue is limited by its poor electronic conductivity as well as the structural defect induced by crystalline/interstitial water molecules. Herein, to address these drawbacks, an etching-agent free method is developed to synthesize Prussian blue with a hollow structure, and the synthesis mechanism is revealed. Owing to the stability of divalent iron ions, the shorter electron/ion diffusion pathway and fewer defect sites of the hollow structure, the obtained Prussian blue exhibits excellent electrochemical performance (specific capacity of 133.6 mA h g−1 at 1C, 1C = 170 mA g−1), which can put forward a new avenue to engineer advanced electrode materials for sodium ion batteries.
1. Introduction
Owing to its intrinsic open frame, stable structure and moderate synthesis process, Prussian blue shows great potential as an advanced sodium ion battery cathode.1–3 Unfortunately, due to its poor electronic conductivity and defects in its inner structure, the electrochemical performance of commercial Prussian blue is poor. Recently, hollow structured Prussian blue has been developed with improved electrochemical performance, since it has a shorter electron/ion diffusion pathway and fewer defect sites in the structure compared to its solid counterparts.4,5 According to previous reports, hollow structured Prussian blue can be synthesized in two ways: through a soft template synthesis method and a hard template synthesis method.6 As a typical soft template synthesis method, Prussian blue can be produced in oil-in-water emulsion with the assistance of surfactants.7 In the hard template synthesis method, an etching agent and surfactants are needed as additives.8 However, methods without any additives to synthesize hollow structure Prussian blue are rarely reported.The self-template synthesis method is a special branch of the hard template synthesis method, in which the precursor is used as the template and no additive is needed.9 In this study, we synthesize the hollow-structured Prussian blue by using the precursor as the self-template, etching agent and surfactants, without any other additives. Compared to the traditional solid structure, this hollow structure improves electrochemical performance due to fewer defect sites, short electron/ion diffusion pathways as well as chemical stability of the divalent iron ions. Besides, we studied the phase and morphology transition process of this hollow structure and the mechanism is explicated. This is the first time to use the final product as the cathode and its precursor as the anode to assemble a full cell. This method might accelerate the study for other Prussian blue analogues and has great potential to be use in other fields, such as supercapacitors, electrocatalysis and bioscience.10
2. Results and discussion
The synthesis methods of sample-FF, sample-CF and sample-PB are interpreted in the Experimental section: sample-CF is defined for Co–C–N–Fe, the sample-FF is defined for its derivate Fe–C–N–Fe, the sample-PB is defined as Prussian blue sample synthesized by the traditional method. The change in the sample color illustrating the synthetic process of sample-FF is shown in Fig. 1a. The X-ray diffraction (XRD) patterns of sample-CF, sample-FF and sample-PB are shown in Fig. 1b. The unique small peak at the 15 degree reveals that the structure of Fe3[Co(CN)6]2 is different from that of Na2Fe[Fe(CN)6]. Raman spectra of sample-PB, sample-FF and sample-CF were obtained to analyze the structure of sample-FF and are shown in Fig. 1c. The peak at 2100 cm−1 is observed in all spectra, which is related to the cyanogen group. The peaks at 498 cm−1 in the Raman spectrum of sample-CF are attributed to the Co–C–N group. Moreover, two peaks located at 534 cm−1 and 603 cm−1 in the Raman spectra of sample-FF and sample-PB correspond to Fe–C and N–Fe groups.11 The sample-CF gives rise to a strong peak at 498 cm−1 and no peak appears at 534 cm−1.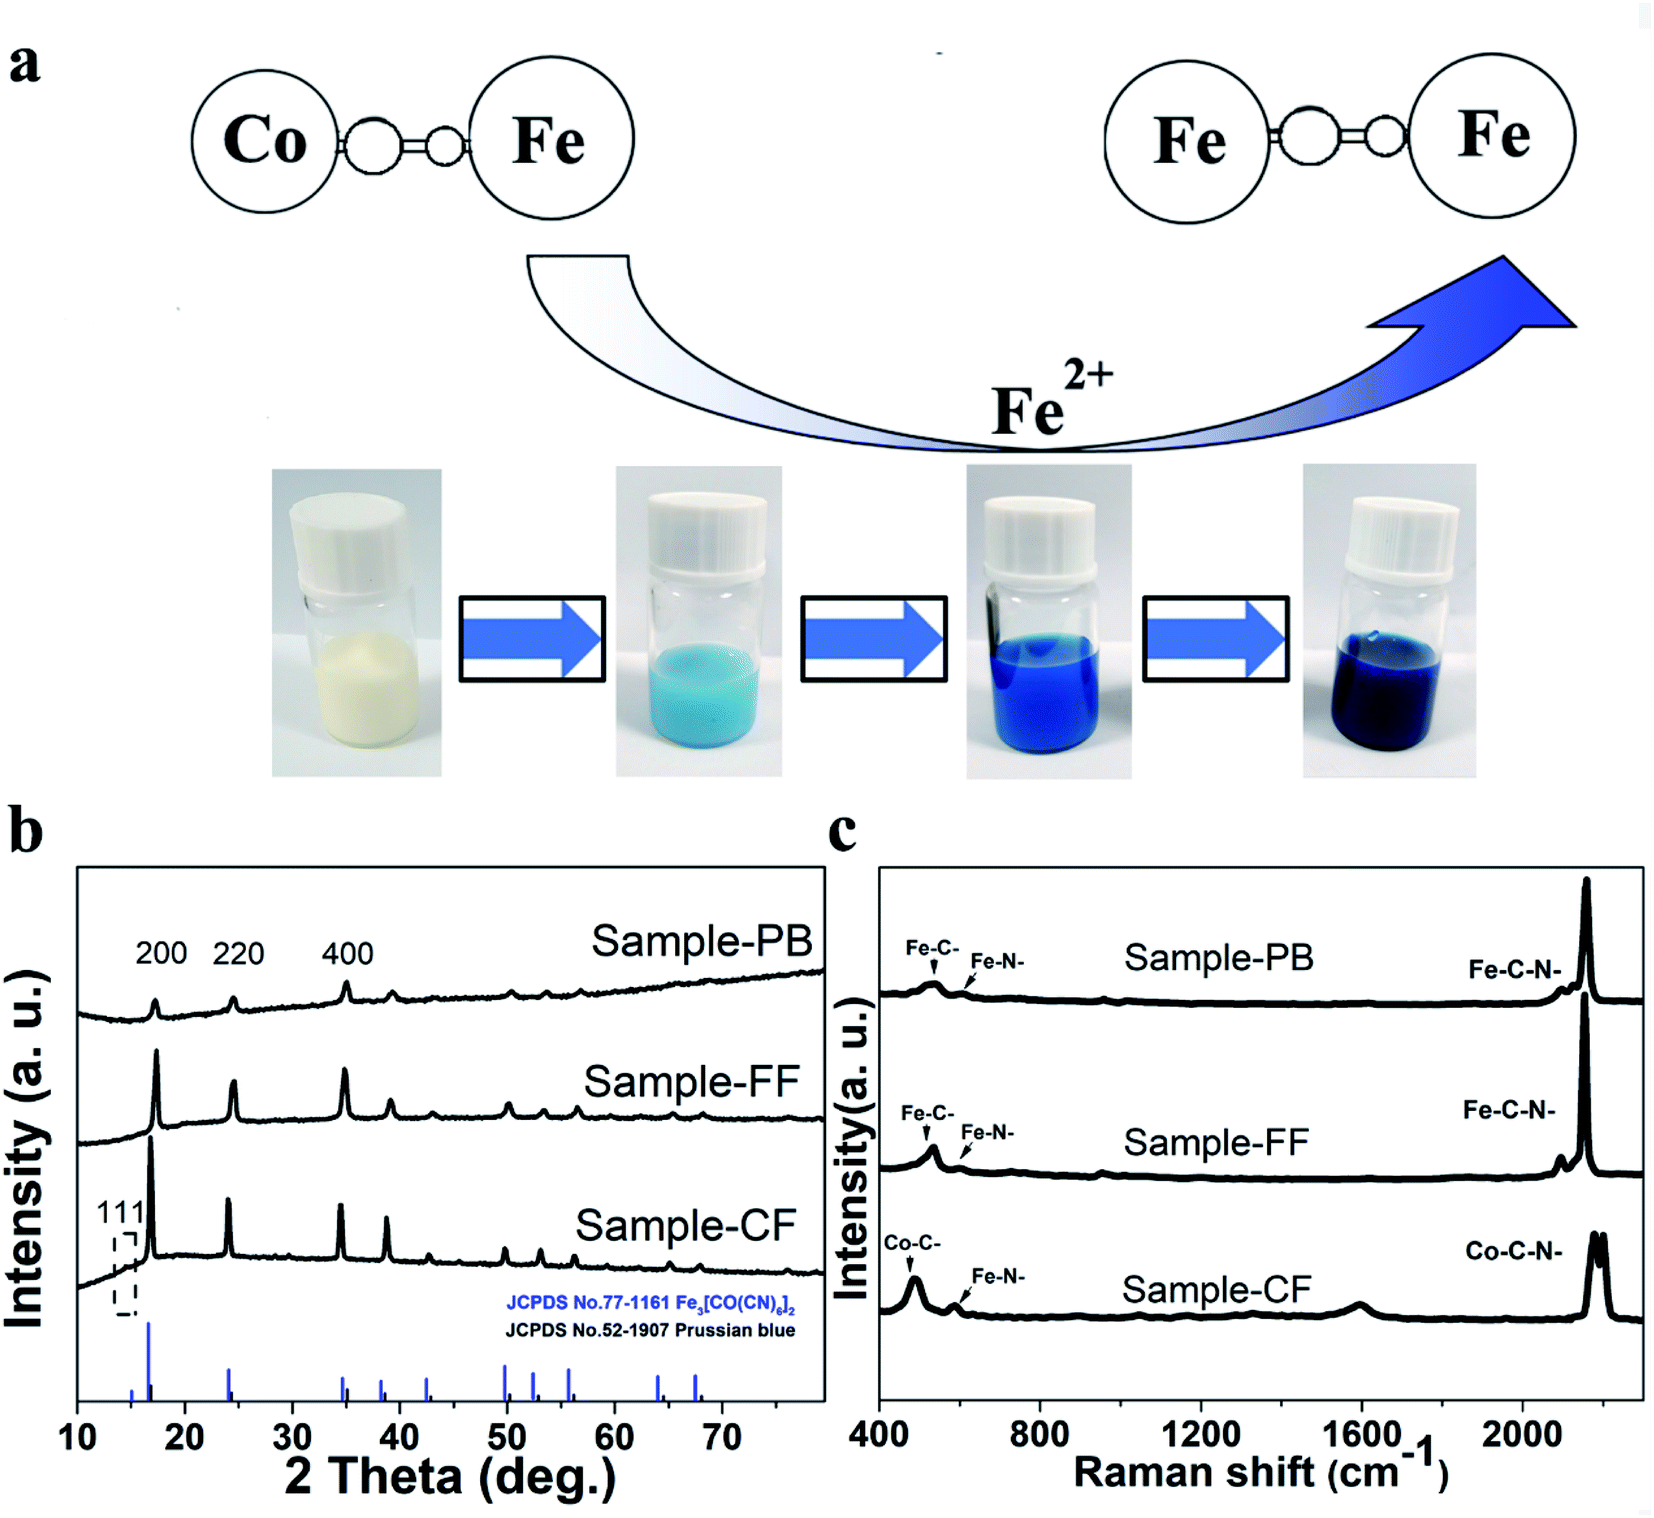 | ||
| Fig. 1 (a) Schematic for the synthetic mechanism of the sample-FF. (b) XRD patterns of sample-PB, sample-FF and sample-CF. (c) Raman plot of sample-PB, sample-FF and sample-CF. | ||
To further reveal the phase transition process from sample-CF to sample-FF, ex situ XRD and Raman analysis were conducted. As the solution A is dropped into suspension B, the chemical reaction starts. Small fractions are extracted from the reaction mixture at the time nodes: 10 mi, 30 min, 1 h, 2 h, and 3 h, which are denoted as sample FF-1 to sample FF-5. These samples are then washed and dried in a vacuum oven for 12 h at 80 °C for ex situ characterization. As this action is destructive, the total quantity of sample diminishes during this production, and the quantity of the small fractions is kept as small as possible in order to minimize any effect on the reaction rate arising from changes in mass quantity within the precipitin reaction. The ex situ Raman test result also confirms that the peaks referred to the Co–C–N group and the Fe–C–N group are gradually changing, as shown in Fig. S1.† The ex situ XRD characterization result shown reveals that the (111) peak weakens sample-CF to sample-FF, indicating the Fe3[Co(CN)6]2 phase is turning into the Na2Fe[Fe(CN)6] phase.
Fig. 2a shows a simplified synthetic process of the hollow structure. The process is evidenced by the transmission electron microscopy (TEM) observation, as shown in Fig. S5.† The Rietveld XRD method is used to fit the XRD pattern, which corresponds to the crystal structure of sample-FF, as shown in Fig. 2b. The crystal structure analysis is based on the crystallography open database.12 The pattern shows strong peak and all the peaks are well-indexed to Na2Fe[Fe(CN)6], (JCPDS no. 52-1907, a = 10.1990 Å, c = 10.1990 Å), revealing that the sample-FF compound is well-crystallized without any impurities (a = 10.247![[thin space (1/6-em)]](https://www.rsc.org/images/entities/char_2009.gif) 093 Å, c = 10.247093 Å, V = Å3 and Rp = 6.30%). Also, the detected value (Yobs) of the XRD pattern is close to the fit value (Ycal). The crystal structure used for the fitting is shown in Fig. 2c. The field emission scanning electron microscopy (FE-SEM) images confirm that the solid structure Prussian blue change to the hollow structure after the self-templated synthesis (Fig. S3†), and the Fig. S3g† shows that most hollow structure is completely integrated. The FESEM image further reveals the difference between sample-FF and sample-PB, as shown in Fig. S9c and d,†. The EDS analysis and the elemental mapping results of sample-CF, sample-FF-1, sample-FF-4, and sample-FF are presented in Fig. S4.† The elemental analysis results reveal that the content of cobalt gradually decreases to zero, while the content of iron is continuously increasing. The excess mass content of oxygen element, carbon element and platinum element owe to the special preparation method of SEM samples.13 The TEM results shown in Fig. S5† are consistent with the SEM data, revealing the morphological change from the solid structure to the hollow structure. It can be seen in Fig. S5a† that sample-CF shows a completely solid structure, and the morphological change starts in the square sides and the corners. Subsequently, new boundary of the cube structure forms, and the inner cubic structure begins to dissolve. Finally, uniform hollow structured Prussian blue particles are produced, as shown in Fig. S5g.† This morphological transition process is reported in other studies but etching agent and surfactant are used in those studies.14–17 Fe3[Co(CN)6]2 plays important roles of divalent iron ion source, etching agent and surfactant in the self-templated synthesis method. In order to figure out whether iron replaces cobalt in the position close to carbon element in the Prussian blue structure, ex situ X-ray photoelectron spectroscopy (XPS) test is conducted. Fig. S6† shows that the peak area of the C–Fe chemical bond continues to increase. The peak area related to the N–Fe chemical bond becomes smaller compared to the C–Fe peak area. The Co–C bond peak area gradually decreases and finally disappears in sample-FF, which indicates that Fe–C–N substitutes the Co–C–N group, rather than Fe–C substituting Co–C (this alternative way would lead to transition metal doping). The FT-IR result shown in Fig. S8a† further proves this substitution process. The intensity of the N–Fe chemical bond becomes weaker compared to the C–Fe chemical bond because the Fe–C–N–Fe functional group substitutes the Co–C–N–Fe functional group.18–20 The above characterizations reveal that the bond energy of the Co–C–N group is weaker than that of the Fe–C–N group. This is the key point for the phase transition from Fe3[Co(CN)6]2 to Na2Fe[Fe(CN)6].
093 Å, c = 10.247093 Å, V = Å3 and Rp = 6.30%). Also, the detected value (Yobs) of the XRD pattern is close to the fit value (Ycal). The crystal structure used for the fitting is shown in Fig. 2c. The field emission scanning electron microscopy (FE-SEM) images confirm that the solid structure Prussian blue change to the hollow structure after the self-templated synthesis (Fig. S3†), and the Fig. S3g† shows that most hollow structure is completely integrated. The FESEM image further reveals the difference between sample-FF and sample-PB, as shown in Fig. S9c and d,†. The EDS analysis and the elemental mapping results of sample-CF, sample-FF-1, sample-FF-4, and sample-FF are presented in Fig. S4.† The elemental analysis results reveal that the content of cobalt gradually decreases to zero, while the content of iron is continuously increasing. The excess mass content of oxygen element, carbon element and platinum element owe to the special preparation method of SEM samples.13 The TEM results shown in Fig. S5† are consistent with the SEM data, revealing the morphological change from the solid structure to the hollow structure. It can be seen in Fig. S5a† that sample-CF shows a completely solid structure, and the morphological change starts in the square sides and the corners. Subsequently, new boundary of the cube structure forms, and the inner cubic structure begins to dissolve. Finally, uniform hollow structured Prussian blue particles are produced, as shown in Fig. S5g.† This morphological transition process is reported in other studies but etching agent and surfactant are used in those studies.14–17 Fe3[Co(CN)6]2 plays important roles of divalent iron ion source, etching agent and surfactant in the self-templated synthesis method. In order to figure out whether iron replaces cobalt in the position close to carbon element in the Prussian blue structure, ex situ X-ray photoelectron spectroscopy (XPS) test is conducted. Fig. S6† shows that the peak area of the C–Fe chemical bond continues to increase. The peak area related to the N–Fe chemical bond becomes smaller compared to the C–Fe peak area. The Co–C bond peak area gradually decreases and finally disappears in sample-FF, which indicates that Fe–C–N substitutes the Co–C–N group, rather than Fe–C substituting Co–C (this alternative way would lead to transition metal doping). The FT-IR result shown in Fig. S8a† further proves this substitution process. The intensity of the N–Fe chemical bond becomes weaker compared to the C–Fe chemical bond because the Fe–C–N–Fe functional group substitutes the Co–C–N–Fe functional group.18–20 The above characterizations reveal that the bond energy of the Co–C–N group is weaker than that of the Fe–C–N group. This is the key point for the phase transition from Fe3[Co(CN)6]2 to Na2Fe[Fe(CN)6].
 | ||
| Fig. 2 (a) Schematic of the synthetic process for sample-FF. (b) The Rietveld XRD pattern of the sample-FF. (c) The crystal structure diagram of sample-FF. | ||
X-Ray photoelectron spectroscopy (XPS) shows that no cobalt ion is detected in sample-FF and sample-PB, as shown in Fig. 3a. This result is in agreement with the XPS element mass content result (Fig. S7†). Moreover, no C–FeII chemical bond can be found in sample-CF, and the relative peak area ratio of FeII/FeIII in sample-FF is higher than that in sample-PB. These XPS results demonstrate that the content of Fe2+ in sample-FF is higher than that in sample-PB. The abundant Fe2+ in Prussian blue owns two advantages: (1) stable structure. (2) Rich sodium ion source.21 According to the above-mentioned results, the formation of Prussian blue of sample-FF can be formulated as:

 | ||
| Fig. 3 X-Ray photoelectron spectrum: (a) XPS wide spectrum for all samples. (b) XPS narrow spectrum of Fe 2p for sample-CF. (c) XPS narrow spectrum of Fe 2p for sample-FF. (d) XPS narrow spectrum of Fe 2p for sample-PB. | ||
The possible formation mechanism can be explained by the Kirkendall effect as reported before in other cases.22,23 Due to the smaller size and higher mobility of Fe2+, Fe2+ moves faster than [Fe(CN)6]2− and [Co(CN)6]3− when sample-CF reacted with Na4Fe(CN)6, thus resulting in a hollow morphology.22–24 Fig. S8b and c† present the thermo-gravimetric analysis result, indicating that sample-FF has lower crystal water content than sample-PB.25 Concluding from the EA/ICP results in Table S1,† formulas of sample-FF and sample-PB can be calculated as Na1.38Fe[Fe(CN)6]0.845·0.86H2O and Na1.07Fe[Fe(CN)6]0.768 1.75H2O. The calculation process of the exact formula is provided in the ESI.† As calculated from the corresponding BJH pore-size distribution, the mean pore size of sample-FF and sample-PB is 3.965 nm and 3.34 nm, respectively (Fig. S9a and b in the ESI†). The mesoporous structure benefits the infiltration and mass transfer of the electrolyte.26 Fig. S9c and d† show the FESEM images of sample-FF and sample-PB, which are similar with those observed in Fig. S3.† Almost the entire surface of the hollow structure is smooth and complete.
The electrochemical cycle performance of both samples is shown in the Fig. 4a. At a current density of 1C, sample-FF delivers a discharge specific capacity of 133.6 mA h g−1, and initial coulombic efficiency is 95.47%. Sample-PB delivers discharge specific capacity of 98.2 mA h g−1, with an 80.26% initial coulombic efficiency. The improvement in the electrochemical performance is due to the stable structure of sample-FF and fewer defects in the hollow structure. This conclusion can be proven by other work reported.27–29 After tested for 100 electrochemical cycles, the discharge specific capacity of those samples remains 95.7 mA h g−1 and 60 mA h g−1, respectively. The coulombic efficiency of sample-FF is nearly 100% in the 500 electrochemical cycling tests, while the coulombic efficiency of sample-PB is discretized. Thus, sample-FF shows a better electrochemical cycling performance than sample-PB. Fig. 4b shows the electrochemical rate performance of sample-FF and sample-PB. Various current densities from 0.5C to 20C are conducted to test the battery. At 0.5, 1, 2, 5 and 20C, sample-FF delivers the specific capacities of 141.7, 127, 115.1, 104.4, and 91.3 mA h g−1, respectively. At the rate of 20C, the electrode still delivers a reversible specific capacity of 91.3 mA h g−1, retaining 64.4% of the specific capacity at 0.5C. In contrast, sample-PB delivers specific capacities of 115.3, 108.7, 104, 98.1, 85 mA h g−1 from 0.5C to 20C, and the reversible specific capacity at 20C is 73.7% of the specific capacity at 0.5C. Fig. 4c and S10a† further show the charge/discharge curves at various current densities of both samples. The charge/discharge curves are stable and there is a stable voltage platform at a high current density. Fig. 4d shows the CV curves of sample-FF and sample-PB in the initial electrochemical charge/discharge process; the several redox couple peaks below 3.25 V are related to the high-spin Fe ion, which is bonded to the N element. The redox couple emerges higher than 3.5 V, which is related to the low-spin state Fe ion, which is bonded to the C element.30 As shown in the electrochemical impedance spectroscopy (EIS) results in Fig. S10b,† the intercept of the X axis in the low frequency part is related to electronic resistance, and the radium of half circle in the high frequency is related to electronic electrolyte transform ability. The test shows that the charge transfer resistance of sample-FF is obviously smaller than that of sample-PB, which proves that the electronic conductivity of sample-FF is better than that of sample-PB. Sample-CF and its derivative sample-FF are tested in a full cell. The charge/discharge curves of sample-CF tested in a half cell are present in Fig. S11a,† and the electrochemical voltage is set from 0.001 V to 2.0 V. Sample-FF is chosen as the cathode and sample-CF is chosen as the anode, and the anode is 5% excess than the cathode.31 Both the cathode electrode plate and the anode electrode plate are activated in half cell at several cycles to be pre-sodiumized. The mass load of the active material for each electrode is about 1.5 mg cm−2. Fig. S11b† reveals the charge/discharge curve matchup of the sample-FF/sample-CF full cell. The voltage of the full cell electrochemical cycle test is set from 0.001 V to 4.0 V. Fig. S11c† shows the electrochemical cycle performance of the full cell at a current density of 0.5C (1C = 170 mA g−1), which delivers a specific capacity of 168.4 mA h g−1 with an initial CE of 77.2%. The capacity loss is attributed to irreversible side reaction and the formation of Na+ solid electrolyte interface (SEI) layers on the anode. As the hollow structure of Prussian blue has attracted considerable attention in the electrochemical field and numerous studies have reported the methods to synthesize the hollow structured Prussian blue, the difference of this work from other work is described in the Fig. S12.†,4,11,16,32–34 Compared to other methods, this work provides a special synthesis method without using any etching agent and surfactant additive.
 | ||
| Fig. 4 Electrochemical performance: (a) cycling performance of both samples at a current of 1C (1C = 170 mA g−1). (b) Rate performance of both samples. (c) Charge/discharge curves of sample-FF at various current densities. (d) CV curves of both samples. | ||
3. Conclusion
In summary, hollow structured Prussian blue is produced through a novel and simple method. The final products exhibit an excellent specific capacity as sodium ion battery cathodes. The mechanism of the phase and morphological transition from solid to hollow structure has been revealed by comprehensive characterizations. The electrochemical performance improvement of the as-obtained Prussian blue derivative is mainly due to the stable structure and hollow morphology. The obtained Prussian blue derivatives exhibit fewer defects and disorder sites, and higher electronic conductivity. The Prussian blue with a stable structure can tolerate the volume change caused by sodium ion insertion and extraction processes.35,36 Finally, Fe3[CO(CN)6]2 and its derivative are assembled as a full cell, which exhibits great potential in Na-ion battery. The low cost, simple synthesis method and excellent electrochemical performance make this hollow structured Prussian blue significant in sodium ion energy storage applications and other fields such as supercapacitors, electro-catalysts, and biosensors.4. Experimental section
4.1 Materials
Potassium cobalt-cyanide, ferrous sulfate, sodium ferro-cyanide and anhydrous ethanol solution were purchased from Aladdin company. Deionized (DI) water was used in all the synthesis process.4.2 Synthesis of sample-CF and sample-PB
Sample-CF was prepared via a custom co-precipitation method. Firstly, FeSO4·7H2O (3 mmol) and K3Co(CN)6·10H2O (2 mmol) were dissolved into 100 ml DI water in a 200 ml beaker, respectively. Following that, the former solution was dropped into the latter solution under the constant inert gas condition to obtain white precipitate. After aging for 12 h, the precipitate was harvested through centrifugation and washed with DI water and anhydrous ethanol for three times, respectively. Finally, the products were dried at 120 °C in a vacuum oven for 12 h. This sample is denoted as sample-CF. Sample-PB was synthesized via the same procedure used that for sample-CF only that K3Co(CN)6·10H2O (2 mmol) was replaced by Na4Fe(CN)6·10H2O (2 mmol).4.3 Synthesis of sample-FF
Sample-FF was prepared through a modified co-precipitation method. First, Na4Fe(CN)6·10H2O (6 mmol) was dissolved into 100 ml DI water and sample-CF (1 mmol) was suspended in 100 ml DI water in another beaker. Following that, the former solution was dropped into the latter under the constant inert gas condition (this is the drop period). The white suspension gradually turned into blue suspension. After placing the mixture for 24 h, the dark blue precipitate was harvested via centrifugation and washed with DI water and anhydrous ethanol for three times, respectively. After drying the products at 120 °C under vacuum for 12 h, sample-FF was obtained.4.4 The sample-FF-1 to sample-FF-5
Small fractions of the reaction mixture were extracted throughout the drop period of the sample-FF with the time nodes: 10 min, 30 min, 1 h, 2 h, and 3 h (the drop period over these time nodes), and then these samples were washed in DI water for purification. Finally, these samples were dried in the vacuum oven at 80 °C, the times of the final dried samples in the vacuum oven at 80 °C is 12 h. As this action is destructive, the total quantity of sample diminished during the production, and the quantity of the small fractions was kept as small as possible in order to minimize any effect on the reaction rate arising from changes in mass quantity during the precipitation reaction. The above samples were denoted as sample-FF-1, sample-FF-2, sample-FF-3, sample-FF-4, sample-FF-5 respectively.4.5 Characterizations
The Raman spectra were obtained by LabRAM HR800, 532 light source test range from 400 to 2400 cm−1. The X-ray diffraction (XRD) pattern was obtained by PANalytical B.V., using Cu Kα radiation with a PIXcel detector, operating at 40 kV and 40 Ma, and the test degree ranged from 10° to 80° at room temperature. The scanning electron microscopy (SEM) images were obtained by Nova NanoSEM 450, equipped with energy dispersive X-ray spectroscopy (EDS) at an accelerating voltage of 25 kV. The transmission electron microscopy (TEM) images were obtained by Talos F200X operated at 200 kV. The X-ray photoelectron spectroscopy was tested by AXIS-ULTRA DLD-600W, and the test voltage ranged from 100 to 1200 eV. All XPS spectra were collected using Al Kα radiation (1486.6 eV), mono-chromatized by a couple crystal mono-chromator, yielding a focused X-ray spot under work conditions of 2 kV and 30 mA. The alpha hemispherical analyzer worked under constant condition at the survey scan pass energy of 200 eV to test the integrity energy band and 50 eV in a narrow scan to electively measure the specific elements. The thermo-gravimetric analyses (TGA) was tested by Diamond TG, for the sample-FF and sample-PB, setting the temperature ranging from 25 °C to 600 °C at a rate of 10 °C min−1 in N2 flow of 50 ml min−1. The N2 adsorption/desorption isotherms for the BJH pore-size distribution plot test was operated on a 3H-2000PM2 micro-pore analyzer at 77 K under inert gas conditions. The elemental analysis (EA) was tested by Vario Micro cube for detecting C and N content. The inductively coupled plasma mass spectrometry (ICP-MS) was tested by Prodigy Plus,for detecting Na and Fe contents. Phase identification and Rietveld quantitative phase analysis were conducted using the PANalytical High Score Plus software with PDF-4+ and ICSD databases.4.6 Measurements
For the electrochemical measurements, the cathode was composed of the specific sample:ketjen black:Super-P:polyvinylidene fluoride (PVDF) at a weight ratio of 7:1:1:1 on a clean Al foil. The cathode was dried in a vacuum oven at 120 °C for 10 h. The half-cell was assembled in an inert-filled glove box (moisture and oxygen contents were less than 1 ppm). The electrolyte is NaClO4 dissolved in 1:1 diethyl-carbonate/ethylene carbonate containing 5 wt% fluoroethylene carbonate. A Whatman glass fiber was chosen as the separator, and Na metal was used as the counter electrode. The electrochemical cycle performance tests, the electrochemical rate performance tests and the electrochemical charge/discharge tests were conducted between 2.0 V and 4.0 V at room temperature on a Land CT2001 battery tester (Land Electronics, China). Cyclic voltammetry measurements and electrochemical impedance spectroscopy tests were carried out on an electrochemical workstation (CHI760E, China).
Author contributions
(1) The author Yu Luo contributes to literature search, figures, study design, data collection, data analysis, writing. (2) The author Jiayu Peng contributes to literature search, figures, data analysis. (3) The corresponding author: Youwei Yan contributes to paper revision.Conflicts of interest
There are no conflicts of interest to declare.Acknowledgements
This work was funded by the National Natural Science Foundation of China (Grant No. 51002054). The authors also thank the Analytical and Testing Centre of HUST for characterization.Notes and references
- Y. Lu, L. Wang, J. Cheng and J. B. Goodenough, Chem. Commun., 2012, 48, 6544–6546 RSC.
- L. Wang, J. Song, R. Qiao, L. A. Wray, M. A. Hossain, Y. D. Chuang, W. Yang, Y. Lu, D. Evans, J. J. Lee, S. Vail, X. Zhao, M. Nishijima, S. Kakimoto and J. B. Goodenough, J. Am. Chem. Soc., 2015, 137, 2548–2554 CrossRef CAS.
- Y. Jiang, S. Yu, B. Wang, Y. Li, W. Sun, Y. Lu, M. Yan, B. Song and S. Dou, Adv. Funct. Mater., 2016, 26, 5315–5321 CrossRef CAS.
- W. Jiang, W. T. Qi, Q. Q. Pan, Q. Jia and C. Yang, Int. J. Hydrogen Energy, 2021, 46, 4252–4258 CrossRef CAS.
- X. W. Lou, L. A. Archer and Z. Yang, Adv. Mater., 2008, 20, 3987 CrossRef CAS.
- J. W. Nai and X. W. Lou, Adv. Mater., 2019, 31, 1706825 CrossRef.
- G. Liang, J. Xu and X. Wang, J. Am. Chem. Soc., 2009, 131, 5378 CrossRef CAS.
- X. Cai, W. Gao, M. Ma, M. Wu, L. Zhang, Y. Zheng, H. Chen and J. Shi, Adv. Mater., 2015, 27, 6382 CrossRef CAS.
- J. Nai, B. Y. Guan, L. Yu and X. W. Lou, Sci. Adv., 2017, 3, e1700732 CrossRef.
- Y. Liu, J. Goebl and Y. Yin, Chem. Soc. Rev., 2013, 42, 2610 RSC.
- L. B. Rena, J. G. Wang, H. Y. Liu, M. H. Shao and B. Q. Wei, Electrochim. Acta, 2019, 321, 134671 CrossRef.
- J. R. Fennick, J. B. Keith, R. H. Leonard, T. N. Truong and J. P. Lewis, J. Appl. Crystallogr., 2008, 41, 471–475 CrossRef CAS.
- M. Hu, S. Furukawa, R. Ohtani, H. Sukegawa, Y. Nemoto, J. Reboul, S. Kitagawa and Y. Yamauchi, Angew. Chem., Int. Ed., 2012, 51, 984 CrossRef CAS.
- Y. Feng, X. Y. Yu and U. Paik, Chem. Commun., 2016, 52, 6269 RSC.
- B. K. Kang, M. H. Woo, J. Lee, Y. H. Song, Z. Wang, Y. Guo, Y. Yamauchi, J. H. Kim, B. Lim and D. H. Yoon, J. Mater. Chem. A, 2017, 5, 4320 RSC.
- W. Zhang, Y. Zhao, V. Malgras, Q. Ji, D. Jiang, R. Qi, K. Ariga, Y. Yamauchi, J. Liu, J.-S. Jiang and M. Hu, Angew. Chem., Int. Ed., 2016, 55, 8228 CrossRef CAS.
- S. Wang, H. Lan, H. Liu and J. Qu, Phys. Chem. Chem. Phys., 2016, 18, 9437 RSC.
- P. Nie, L. F. Shen, H. F. Luo, B. Ding, G. Y. Xu, J. Wang and X. G. Zhang, J. Mater. Chem. A, 2014, 2, 5852–5857 RSC.
- E. J. Canto-Aguilar, M. A. Oliver-Tolentino, G. Ramos-Sánchez and I. González, Electrochim. Acta, 2021, 371, 137828 CrossRef CAS.
- M. Huang, X. P. Wang, J. S. Meng, X. LiU, X. H. Yao, Z. A. Liu and L. Q. Mai, Nano Energy, 2020, 77, 105069 CrossRef CAS.
- Q. Zhang, L. Fu, J. Y. Luan, X. B. Huang, Y. G. Tang, H. L. Xie and H. Y. Wang, J. Power Sources, 2018, 395, 305–313 CrossRef CAS.
- J. G. Wang, Z. Y. Zhang, X. Y. Zhang, X. M. Yin, X. Li, X. R. Liu, F. Y. Kang and B. Q. Wei, Nano Energy, 2017, 39, 647–653 CrossRef CAS.
- Y. J. Fang, X. Y. Yu and X. W. Lou, Adv. Mater., 2018, 30, 1706668 CrossRef.
- Y. J. Fang, X. Y. Yu and X. W. Lou, Angew. Chem., Int. Ed., 2018, 57, 9859–9863 CrossRef CAS.
- A. Bleuzen, V. Escax, A. Ferrier, F. Villain, M. Verdaguer, P. Münsch and J. P. Itié, Angew. Chem., Int. Ed., 2004, 43, 3728 CrossRef CAS.
- R. Chen, Y. Huang, M. Xie, Q. Zhang, X. Zhang, L. Li and F. Wu, ACS Appl. Mater. Interfaces, 2016, 8, 16078 CrossRef CAS.
- O. N. Risset, E. S. Knowles, S. Ma, M. W. Meisel and D. R. Talham, Chem. Mater., 2013, 25, 42 CrossRef CAS.
- Y. Z. Song, X. J. Zhao and Z. H. Liu, Electrochim. Acta, 2021, 374, 137962 CrossRef CAS.
- M. Hu, A. A. Belik, M. Imura and Y. Yamauchi, J. Am. Chem. Soc., 2013, 135, 384 CrossRef CAS.
- P. Nie, J. R. Yuan, J. Wang, Z. Y. Le, G. Y. Xu, L. Hao, G. Pang, Y. T. Wu, H. Dou, X. H. Yan and X. G. Zhang, ACS Appl. Mater. Interfaces, 2017, 24, 20306–20312 CrossRef.
- W. L. Wang, Y. Gang, Z. Hu, Z. C. Yan, W. J. Li, Y. C. Li, Q. F. Gu, Z. X. Wang, S. L. Chou, H. K. Liu and S. X. Dou, Nat. Commun., 2020, 11, 980 CrossRef CAS.
- Y. X. Huang, M. Xie, Z. H. Wang, Y. Jiang, Y. Yao, S. J. Li, Z. H. Li, L. Li, F. Wu and R. J. Chen, Small, 2018, 14, 1801246 CrossRef.
- F. Feng, S. L. Chen, X. Z. Liao and Z. F. Ma, Small Methods, 2019, 3, 1800259 CrossRef CAS.
- X. Tang, H. Liu, D. W. Su, P. H. L. Notten and G. X. Wang, Nano Res., 2018, 11, 3979–3990 CrossRef CAS.
- J. Peng, M. Y. Ou, H. C. Yi, X. P. Sun, Y. P. Zhang, B. Zhang and J. T. Han, et al., Energy Environ. Sci., 2021, 14, 3130–3140 RSC.
- Z. Zhao, X. Liu, C. Luan, X. Liu, D. Wang, T. Qin, L. Sui and W. Zhang, J. Microsc., 2019, 276, 53–62 CrossRef CAS.
Footnote |
| † Electronic supplementary information (ESI) available. See DOI: 10.1039/d1ra05612c |
| This journal is © The Royal Society of Chemistry 2021 |