 Open Access Article
Cu assisted loading of Pt on CeO2 as a carbon-free catalyst for methanol and oxygen reduction reaction†
Linchi Zou *ab,
Jian Pana,
Feng Xuc and
Junfeng Chen*c
aCollege of Materials Science and Engineering, Fujian University of Technology, Fuzhou, 350118, China. E-mail: zoulinchi@fjut.edu.cn
bFujian Provincial Key Laboratory of Advanced Materials Processing and Application, Fuzhou, 350118, China
cSchool of Materials Science and Engineering, Fuzhou University, Qishan Campus, Fuzhou, 350116, China. E-mail: chenjunfeng@fzu.edu.cn
First published on 16th November 2021
Abstract
The widely studied Pt/C catalyst for direct methanol fuel cells (DMFCs) suffers severe carbon corrosion under operation, which undermines the catalytic activity and durability. It is of great importance to develop a carbon-free support with co-catalytic functionality for improving both the activity and durability of Pt-based catalysts. The direct loading of Pt on the smooth surface of oxides may be difficult. Herein, the Cu assisted loading of Pt on CeO2 is developed. Cu pre-coated CeO2 was facilely synthesized and Pt was electrochemically deposited to fabricate the carbon-free PtCu/CeO2 catalyst. The PtCu/CeO2 catalyst has a mass activity up to 1.84 and 1.57 times higher than Pt/C towards methanol oxidation reaction (MOR) and oxygen reduction reaction (ORR), respectively. Better durability is also confirmed by chronoamperometry and accelerated degradation tests. The strategy in this work would be greatly helpful for developing an efficient carbon-free support of Pt-based catalysts for applications in DMFCs.
1. Introduction
Methanol is a cheap fuel source but has higher energy density than hydrogen, making direct methanol fuel cells (DMFCs) a fascinating power source.1,2 Pt or Pt based metallic nanoparticles (NPs) supported on carbon materials, including amorphous carbon, carbon nanotubes, graphene, etc., are commonly used as efficient catalysts.3–7 However, carbon suffers inevitable chemical and electrochemical oxidation due to the high moisture, high temperature, and high operation potentials.8 The electrochemical corrosion occurs as followed:| C + H2O → CO + 2H+ + 2e− | (1) |
Reaction (1) will be promoted in the presence of Pt based catalysts.9 The carbon corrosion leads to the migration and aggregation of supporting metal NPs, which undermine the activity and durability of catalysts.
It is of great importance to develop the stable support for improving both activity and durability of catalyst. Exploring the carbon-free supports with co-catalytic functionality has proven to be an effective approach.10–15 Many materials, such as Ti0.7Ru0.3O2,10 Magnéli phase Ti8O15 nanowires,13 and CeO2,15,16 were studied as potential catalyst supports of DMFC. Kozu and the co-workers reported a one-step electrochemical synthesis of Pt–CeO2 composite thin films and received a 25 mV negative shift toward MOR.15 Lin and the co-workers used poly(vinylpyrrolidone) as template to synthesis porous CeO2 as non-carbon support to load Pt.16 Their as-synthesized catalysts showed nearly twice the activity of Pt/C toward MOR. However, the poor conductivity of such non-carbon materials emerges as a trouble. The surface of oxides is smooth and hence the interaction with Pt is so weak that Pt nanoparticles aggregate easily, leading to the poor activity and durability.
Herein, we explore a facile method, which can load Pt homogeneously on CeO2 support via Cu pre-coating, to prepare a conductive, efficient, and stable carbon-free catalyst support for DMFC. CeO2 is a widely studied oxide, which can promote the activity and stability of catalysts.16,17 We found that Cu is able to coat on CeO2 surface homogeneously, avoiding the aggregation. Moreover, it has been revealed that both Cu and CeO2 can modify the Pt d-band centre to achieve better performance on methanol oxidation reaction (MOR) and oxygen reduction reaction (ORR).16–19 We started with partially covering Cu NPs with CeO2 via a one-pot synthesis method, and then electrodeposited Pt onto the uncovered Cu surface. As a result, the PtCu alloy NPs form and co-exist with CeO2, such structure confines the metal NPs and prevents their migration (Scheme 1). Results show that the MOR, ORR, and durability of the as-prepared catalysts are improved compared to Pt/C.
2. Experimental
2.1 Materials
Chloroplatinic acid hexahydrate (H2PtCl6·6H2O), copper nitrate trihydrate [Cu(NO3)2·3H2O], cerium(III) nitrate hexahydrate [Ce(NO3)3·6H2O], sodium hydroxide (NaOH), sodium borohydride (NaBH4), and glycerol were of analytical reagent (A.R.) grade and purchased from Sinopharm Chemical Reagent Co., Ltd. All chemicals were used as received. Deionized water (DI water, Millipore, 18.2 MΩ at 25 °C) were used in all processes.2.2 Catalyst preparation
Ce(NO3)3·6H2O and Cu(NO3)2·3H2O at different molar ratio (Cu![[thin space (1/6-em)]](https://www.rsc.org/images/entities/char_2009.gif) :
:![[thin space (1/6-em)]](https://www.rsc.org/images/entities/char_2009.gif) Ce = 1
Ce = 1![[thin space (1/6-em)]](https://www.rsc.org/images/entities/char_2009.gif) :
:![[thin space (1/6-em)]](https://www.rsc.org/images/entities/char_2009.gif) 3, 1
3, 1![[thin space (1/6-em)]](https://www.rsc.org/images/entities/char_2009.gif) :
:![[thin space (1/6-em)]](https://www.rsc.org/images/entities/char_2009.gif) 2, 1
2, 1![[thin space (1/6-em)]](https://www.rsc.org/images/entities/char_2009.gif) :
:![[thin space (1/6-em)]](https://www.rsc.org/images/entities/char_2009.gif) 1, 2
1, 2![[thin space (1/6-em)]](https://www.rsc.org/images/entities/char_2009.gif) :
:![[thin space (1/6-em)]](https://www.rsc.org/images/entities/char_2009.gif) 1, and 3
1, and 3![[thin space (1/6-em)]](https://www.rsc.org/images/entities/char_2009.gif) :
:![[thin space (1/6-em)]](https://www.rsc.org/images/entities/char_2009.gif) 1) were added into a three neck flask, then 100 mL of ethylene glycol (EG) were added, following the agitation at 80 °C overnight. 200 and 500 mg of NaOH and NaBH4 were dissolved in 100 mL of DI water and slowly dropped into the flask. When the reaction finished, the Cu/CeO2 composites were collected and rinsed with ethanol by centrifuging. The Cu/CeO2 paste was freeze-dried.
1) were added into a three neck flask, then 100 mL of ethylene glycol (EG) were added, following the agitation at 80 °C overnight. 200 and 500 mg of NaOH and NaBH4 were dissolved in 100 mL of DI water and slowly dropped into the flask. When the reaction finished, the Cu/CeO2 composites were collected and rinsed with ethanol by centrifuging. The Cu/CeO2 paste was freeze-dried.
For Pt electrodeposition, 6 mg of Cu/CeO2 supports and 60 μL of Nafion solution (5% w/w, Dupont) were dispersed in 6 mL of isopropanol solution (isopropanol![[thin space (1/6-em)]](https://www.rsc.org/images/entities/char_2009.gif) :
:![[thin space (1/6-em)]](https://www.rsc.org/images/entities/char_2009.gif) DI water = 1
DI water = 1![[thin space (1/6-em)]](https://www.rsc.org/images/entities/char_2009.gif) :
:![[thin space (1/6-em)]](https://www.rsc.org/images/entities/char_2009.gif) 1). 10 μL of the resultant ink was pipetted onto the surface of glassy carbon electrode (GCE, ϕ = 5 mm) and dried at room temperature. GCE was polished with Al2O3 (<50 nm) to a mirror-like surface before used. The electrode was immersed in the electrolyte containing 0.5 M H2SO4 and 3.86 × 10⁻³ M H2PtCl4, then subjected to the cyclic voltammetry (CV) scanning in the potential range of 0.0–1.2 V at 50 mV s−1 for 40 cycles. Pt wire and saturated calomel electrode (SCE) were used as counter and reference electrode, respectively. The catalysts with Cu
1). 10 μL of the resultant ink was pipetted onto the surface of glassy carbon electrode (GCE, ϕ = 5 mm) and dried at room temperature. GCE was polished with Al2O3 (<50 nm) to a mirror-like surface before used. The electrode was immersed in the electrolyte containing 0.5 M H2SO4 and 3.86 × 10⁻³ M H2PtCl4, then subjected to the cyclic voltammetry (CV) scanning in the potential range of 0.0–1.2 V at 50 mV s−1 for 40 cycles. Pt wire and saturated calomel electrode (SCE) were used as counter and reference electrode, respectively. The catalysts with Cu![[thin space (1/6-em)]](https://www.rsc.org/images/entities/char_2009.gif) :
:![[thin space (1/6-em)]](https://www.rsc.org/images/entities/char_2009.gif) Ce ratios of 1
Ce ratios of 1![[thin space (1/6-em)]](https://www.rsc.org/images/entities/char_2009.gif) :
:![[thin space (1/6-em)]](https://www.rsc.org/images/entities/char_2009.gif) 3, 1
3, 1![[thin space (1/6-em)]](https://www.rsc.org/images/entities/char_2009.gif) :
:![[thin space (1/6-em)]](https://www.rsc.org/images/entities/char_2009.gif) 2, 1
2, 1![[thin space (1/6-em)]](https://www.rsc.org/images/entities/char_2009.gif) :
:![[thin space (1/6-em)]](https://www.rsc.org/images/entities/char_2009.gif) 1, 2
1, 2![[thin space (1/6-em)]](https://www.rsc.org/images/entities/char_2009.gif) :
:![[thin space (1/6-em)]](https://www.rsc.org/images/entities/char_2009.gif) 1, and 3
1, and 3![[thin space (1/6-em)]](https://www.rsc.org/images/entities/char_2009.gif) :
:![[thin space (1/6-em)]](https://www.rsc.org/images/entities/char_2009.gif) 1, were labelled as PtCu/CeO2-13, PtCu/CeO2-12, PtCu/CeO2-11, PtCu/CeO2-21, and PtCu/CeO2-31, respectively.
1, were labelled as PtCu/CeO2-13, PtCu/CeO2-12, PtCu/CeO2-11, PtCu/CeO2-21, and PtCu/CeO2-31, respectively.
2.3 Characterizations and electrochemical tests
X-ray diffraction (XRD) was performed on Ultima3 (D/teX) in the scanning 2θ range of 20–90° with Cu kα (λ = 0.15406 nm) as radiation source. The morphology of catalysts was obtained by transmission electron microscope (TECNAI G2F20, FEI). X-ray photoelectron spectroscopy (XPS) was performed on ESCALAB 250 (Thermo Scientific). The Pt loading was evaluated by inductively coupled plasma atomic emission spectrometry (ICP-MS, XSERIES 2, Thermo Fisher). CV was carried out in a three-electrode cell on CHI650D in the potential range of 0.0–1.2 V scanned at 50 mV s−1. 0.5 M H2SO4 aqueous solution was used as electrolyte. Methanol electrooxidation was tested in 0.5 M H2SO4 and 1 M methanol electrolyte. To perform ORR, glassy carbon rotating-disk electrode was used as WE (RDE, ϕ = 5 mm). Linear sweep voltammogram (LSV) measurements were performed in O2-saturated 0.1 M HClO4 solution at room temperature at the rotating speed of 1600 rpm and sweep rate of 10 mV s−1. The kinetic current was calculated as followed:20
 | (2) |
3. Results and discussion
3.1 Structure and morphology analysis
XRD was used to identify the structure of Cu pre-coated CeO2 (Cu/CeO2) (Fig. 1A). A broad peak in the range of 20–32° is ascribed to CeO2(111) and (200) facets (JCPDS 34-0394). The peak at 47.5° is indexed to CeO2(220). The vague diffraction signals indicate the very small particle size.21 The characteristic peaks at 43.3°, 50.4°, and 74.1° belong to the metallic Cu(111), (200), and (220) facets (JCPDS 04-0836). The 2θ angles of Cu peaks are in very coincidence with JCPDS 04-0836, illustrating that CeO2 did not affect the Cu crystal structure. We also observe the diffraction signals of Cu2O which has the main peak at 36.4° accompanying with a weak one at 61.4°, ascribed to (111) and (220), respectively (JCPDS 05-0667). It is rational of the presence of Cu2O because the lattice oxygen of CeO2 could migrate to Cu surface in the condition of intimate contact.16,17 As Cu dosage decreased, the Cu diffraction signals become fading, due to the lowering Cu contents in Cu/CeO2. After Pt deposition, Pt signal emerges clearly expect on Cu/CeO2-13 (Fig. 1B), due to the low metal content that not sufficient for XRD instrument to receive signal. Pt(100), Pt(200), and Pt(220) facets are identified at 40.0, 46.6, and 68.0°, which are all slightly higher than 2θ of JCPDS 04-0802. This indicates the PtCu alloy formation during Pt deposition.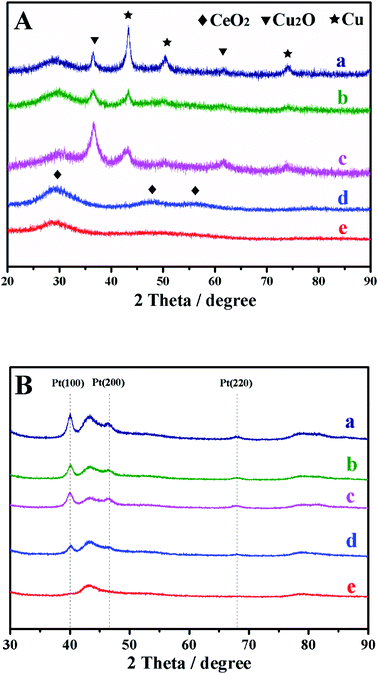 | ||
| Fig. 1 XRD patterns of Cu–CeO2 before (A) and after Pt deposition (B); (a), Cu–CeO2-31; (b), Cu–CeO2-21; (c), Cu–CeO2-11; (d), Cu–CeO2-12; (e), Cu–CeO2-13. | ||
The morphology and particle size of PtCu/CeO2 with the Cu![[thin space (1/6-em)]](https://www.rsc.org/images/entities/char_2009.gif) :
:![[thin space (1/6-em)]](https://www.rsc.org/images/entities/char_2009.gif) Ce molar ratio of 2
Ce molar ratio of 2![[thin space (1/6-em)]](https://www.rsc.org/images/entities/char_2009.gif) :
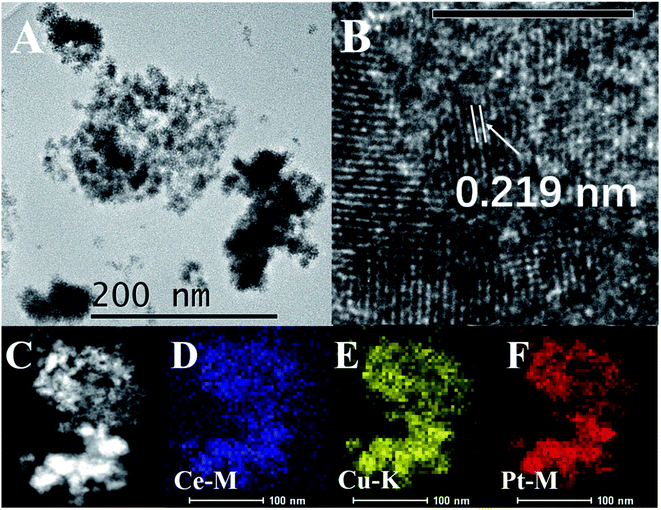
:![[thin space (1/6-em)]](https://www.rsc.org/images/entities/char_2009.gif) 1 were identified by TEM analysis (Fig. 2). TEM images of PtCu/CeO2-12 and Pt/C were also offered (Fig. S1†). The PtCu/CeO2 catalysts are the assembly of small nanoparticles (Fig. 2A and S1A†). The lattice with spacing value of 0.219 nm is commonly found. The value is between 0.226 nm of Pt(111) (JCPDS 04-0802) and 0.208 nm of Cu(111) (JCPDS 04-0836), which is a clear evidence of PtCu alloy.22 The lattice belonging to CeO2 could be barely found, but the EDS mapping reveals the homogeneous dispersion of Ce, Pt, and Cu elements (Fig. 2C–F). We propose that the PtCu alloy coats on CeO2 surface.
1 were identified by TEM analysis (Fig. 2). TEM images of PtCu/CeO2-12 and Pt/C were also offered (Fig. S1†). The PtCu/CeO2 catalysts are the assembly of small nanoparticles (Fig. 2A and S1A†). The lattice with spacing value of 0.219 nm is commonly found. The value is between 0.226 nm of Pt(111) (JCPDS 04-0802) and 0.208 nm of Cu(111) (JCPDS 04-0836), which is a clear evidence of PtCu alloy.22 The lattice belonging to CeO2 could be barely found, but the EDS mapping reveals the homogeneous dispersion of Ce, Pt, and Cu elements (Fig. 2C–F). We propose that the PtCu alloy coats on CeO2 surface.
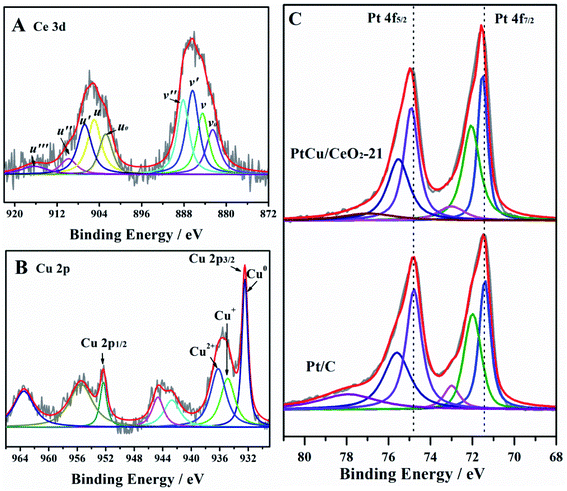
The very intimate contact of CeO2 and PtCu alloy can modify the electronic structure of Ce, Cu, and Pt elements, which is proven by XPS (Fig. 3). Ce 3d orbital is curve-fitted into satellite peaks belonging to Ce3+ (v0, v′, u0, and u′) and Ce4+ (v, v, v′′, v′′′, u, u′′, and u′′′),23,24 respectively (Fig. 3A). The peak u′′′ is a characteristic signal of Ce4+.16 It is very weak here, demonstrating that the Ce4+ concentration in the CeO2 NPs is relatively low, therefore, the concentration of oxygen vacancy is high.24 The ratio ΣCe3+/(ΣCe3+ + ΣCe4+) is commonly used to evaluate the Ce3+ fraction, i.e., the oxygen vacancy concentration.24 PtCu/CeO2-21 has the ratio of 0.42. Cu 2p spectrum shows the co-existence of Cu, Cu+ and Cu2+ (Fig. 3B). The peaks at 932.50 and 952.37 eV are attribute to Cu0, the Cu+ could be found close to Cu0.25 The shakeup satellite peaks at around 935, 944, 955, and 963 eV belong to Cu2+ species.26,27 The intimate contact of CeO2 and PtCu alloy NPs greatly facilitated the migration of lattice oxygen in the surface of CeO2 to metal surface, and the electron transfer from PtCu to CeO2, leading to the presence of high concentration of oxygen vacancy and metal oxide species.16 Both CeO2 and Cu can influence the Pt electronic structure, as a result, Pt 4f orbital shifts positively by 0.18 eV compared to that of Pt/C (Fig. 3C). The positive B.E. shift suggests that the d-band centre of Pt moves downwards, which will reduce the binding strength of adsorbents, leading to the enhancement of activity.28,29
3.2 Electrochemical activity and durability
The Cu-free Pt/CeO2 shows no activity (Fig. S2†), hence, the discussion hereafter focuses on PtCu/CeO2. Fig. S3† demonstrates the electrodeposition process during cyclic voltammetry (CV) cycles between 0.0–1.2 V vs. SHE at a scan rate of 50 mV s−1. The peak at 0.34 V in the initial scans suggests the Cu dissolution from the Cu–CeO2 support.29,30 The Cu dissolution current fades as scanning goes on and dropped to undetectable level after five scans, indicating that Cu dissolution ceases. The peak at around 0.75 V is subject to the Pt reduction from the precursor. The Pt precursor (PtCl62−) was reduced to Pt0 following the probable reactions:31,32| PtCl62− + 2e− → PtCl42− + 2Cl−, E0 = 0.726 V SHE | (3) |
| PtCl42− + 2e− → Pt + 4Cl−, E0 = 0.758 V SHE | (4) |
| PtCl62− + 4e− → Pt + 6Cl−, E0 = 0.744 V SHE | (5) |
The anodic voltammetric responses at potentials higher than 0.95 V are associated with the formation of Pt surface oxide. On the cathodic scan, reduction peak at 0.7 V is related to the partial reduction of Pt oxide.33 The hydrogen adsorption/desorption current in the potential range of 0–0.3 V arises as the deposition cycling goes on, which also illustrates the successful deposition of Pt. When the Pt electrodeposition was finished, the working electrodes were rinsed with plenty of DI water for electrochemical tests.
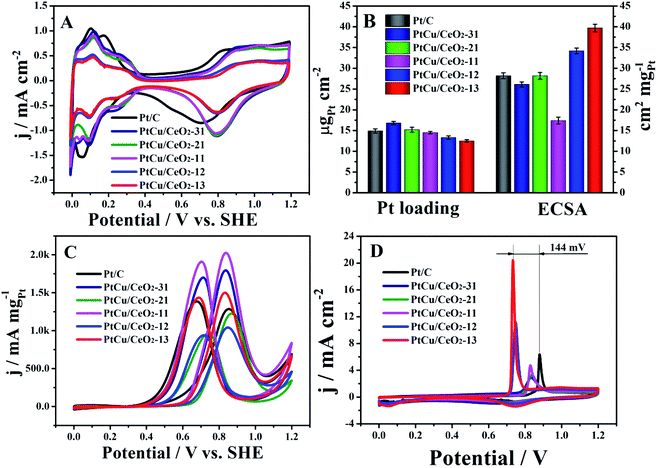
The CVs show familiar H ad/desorption (0–0.4 V) as well as Pt oxide formation (0.6–1.2 V) in 0.5 M H2SO4 (Fig. 4A). The onset potentials of Pt oxide formation of Pt/Cu–CeO2 catalysts are more positive than Pt/C, indicating that Pt of PtCu/CeO2 is more difficult to oxidize.34 The Pt loading on the electrode surface was evaluated by atomic absorption spectrometry. The PtCu/CeO2 catalysts show close Pt loading to Pt/C on the electrode surface (Fig. 4B). PtCu/CeO2 catalysts with higher Cu content demonstrate higher Pt loading, illustrating that Pt is mainly deposited on the Cu surface. This agrees well with the TEM analysis. The electrochemical surface area (ECSA) was calculated by integrating the hydrogen desorption charge (Fig. 4B and Table 1). PtCu/CeO2-13 and PtCu/CeO2-12 shows higher ECSA than Pt/C, due to the lower Pt loading on the electrode. PtCu/CeO2-31 and PtCu/CeO2-21 have the close ECSA to Pt/C, while PtCu/CeO2-11 has the lowest value. Fig. 4A and B show that the PtCu/CeO2 catalysts have comparable electrochemical activity to Pt/C, evidencing that the presence of Cu efficiently ensures the conductivity. The very small particle size is also very beneficial for the catalytic activity.35,36
| Pt loading μgPt cm−2 | ECSA cm−2 mgPt−1 | MOR | ORR | ||||
|---|---|---|---|---|---|---|---|
| If mA mgPt−1 | Ib mA mgPt−1 | If![[thin space (1/6-em)]](https://www.rsc.org/images/entities/char_2009.gif) : :![[thin space (1/6-em)]](https://www.rsc.org/images/entities/char_2009.gif) Ib Ib |
MA mA mgPt−1 | SA mA cmPt−2 | |||
| Pt/C | 14.9 | 28.2 | 1289.89 | 1388.92 | 0.92 | 127.96 | 4.54 |
| PtCu/CeO2-31 | 16.8 | 26.1 | 1804.01 | 1704.98 | 1.05 | 125.63 | 4.81 |
| PtCu/CeO2-21 | 15.2 | 28.2 | 1226.68 | 961.90 | 1.27 | 237.88 | 8.44 |
| PtCu/CeO2-11 | 14.5 | 17.1 | 2025.25 | 1914.63 | 1.06 | 153.67 | 8.68 |
| PtCu/CeO2-12 | 13.3 | 34.2 | 1040.91 | 942.23 | 1.11 | 177.52 | 5.19 |
| PtCu/CeO2-13 | 12.5 | 39.7 | 1507.62 | 1448.27 | 1.04 | 171.53 | 4.32 |
Fig. 4C shows the MOR activity of Pt/C and PtCu/CeO2 catalysts. Both forward (If) and backward (Ib) peak currents of PtCu/CeO2-13, PtCu/CeO2-11 and PtCu/CeO2-31 are higher than Pt/C, while PtCu/CeO2-12 and PtCu/CeO2-21 have the lower values (Table 1). The peak If is attributed to the partially oxidation of methanol to the carbonaceous species such as COads, and the peak Ib comes from the removal of the incomplete oxidized carbonaceous species accumulated on Pt surface during the forward scan.37,38 The ratio If![[thin space (1/6-em)]](https://www.rsc.org/images/entities/char_2009.gif) :
:![[thin space (1/6-em)]](https://www.rsc.org/images/entities/char_2009.gif) Ib is used to evaluated the MOR performance of catalyst, i.e., larger If
Ib is used to evaluated the MOR performance of catalyst, i.e., larger If![[thin space (1/6-em)]](https://www.rsc.org/images/entities/char_2009.gif) :
:![[thin space (1/6-em)]](https://www.rsc.org/images/entities/char_2009.gif) Ib represents better poisoning tolerance and vice versa.39 All PtCu/CeO2 catalysts have higher If
Ib represents better poisoning tolerance and vice versa.39 All PtCu/CeO2 catalysts have higher If![[thin space (1/6-em)]](https://www.rsc.org/images/entities/char_2009.gif) :
:![[thin space (1/6-em)]](https://www.rsc.org/images/entities/char_2009.gif) Ib than Pt/C, illustrating the better poison tolerance of PtCu/CeO2. As shown in Table 1, PtCu/CeO2-21 has the highest If
Ib than Pt/C, illustrating the better poison tolerance of PtCu/CeO2. As shown in Table 1, PtCu/CeO2-21 has the highest If![[thin space (1/6-em)]](https://www.rsc.org/images/entities/char_2009.gif) :
:![[thin space (1/6-em)]](https://www.rsc.org/images/entities/char_2009.gif) Ib value of 1.27, which is 1.4 times higher than 0.92 of Pt/C. The CO stripping was performed for confirmation (Fig. 4D). During the first scans of all catalysts, signals related to hydrogen ad/desorption does not show, which is attributed to the CO coverage on Pt surface and no marginal for H adsorption. The sharp peaks in the potential range of 0.6–0.8 V belong to the CO oxidation.40 The CO peak of Pt/C locates at 0.878 V, more positively than all the PtCu/CeO2 catalysts, especially PtCu/CeO2-12 (0.745 V) and PtCu/CeO2-13 (0.734 V). One could find out that Cu is prone to enhance the MOR activity, due to the electronic effect,41,42 because the compressive lattice resulting from alloy structure can weaken the binding of Pt surface atoms to adsorbed intermediates.41
Ib value of 1.27, which is 1.4 times higher than 0.92 of Pt/C. The CO stripping was performed for confirmation (Fig. 4D). During the first scans of all catalysts, signals related to hydrogen ad/desorption does not show, which is attributed to the CO coverage on Pt surface and no marginal for H adsorption. The sharp peaks in the potential range of 0.6–0.8 V belong to the CO oxidation.40 The CO peak of Pt/C locates at 0.878 V, more positively than all the PtCu/CeO2 catalysts, especially PtCu/CeO2-12 (0.745 V) and PtCu/CeO2-13 (0.734 V). One could find out that Cu is prone to enhance the MOR activity, due to the electronic effect,41,42 because the compressive lattice resulting from alloy structure can weaken the binding of Pt surface atoms to adsorbed intermediates.41
The ORR polarization curves of Pt/C and PtCu/CeO2 catalysts are shown in Fig. 5. The onset and half-wave potentials of PtCu/CeO2 catalysts shift positively relative to Pt/C, implying the decrease in overpotential of ORR.43 PtCu/CeO2-21, PtCu/CeO2-11, PtCu/CeO2-12, and PtCu/CeO2-13 exhibit the mass activity (MA) of 237.88, 153.67, 177.52, and 171.53 mA mgPt−1 on the basis of Pt mass at 0.9 V, which are 1.86, 1.20, 1.39, and 1.34 times of MAPt/C (127.96 mA mgPt−1) (Table 1). PtCu/CeO2-31 exhibits MA value of 125.63 mA mgPt−1, slightly lower than Pt/C. The surface-area-specific activity (SA) is calculated by dividing the mass activity by total ECSA on the electrode surface.11 The SAs of PtCu/CeO2-31, PtCu/CeO2-21, PtCu/CeO2-11, and PtCu/CeO2-12 are 1.06, 1.86, 1.91, and 1.14 times higher than Pt/C (Table 1).
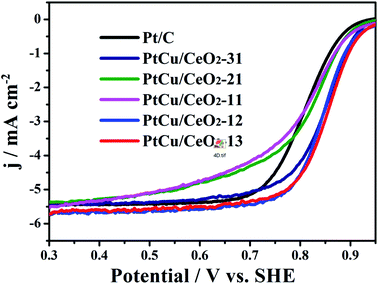 | ||
| Fig. 5 The ORR curves obtained with on a glassy carbon rotating electrode disk in O2-saturated 0.1 M HClO4 solution at a sweep rate of 10 mV s−1. | ||
It is known that the binding energy is strongly related to the ad/desorption capability of reaction intermediates on the catalyst surface. The quantity oxygen vacancies can bind Pt more strongly due to the Pt-oxygen vacancy interaction.44 Moreover, the oxygen vacancies decrease the energy barrier for lattice oxygen movement. The lattice oxygen at the Pt–CeO2 interface is well accepted that key for promoting the methanol electrooxidation.45 The positive shift of B.E. and the resulting downward-move of d-band centre of Pt 4f can decrease the B.E. of adsorbents, such as COads and OHads, on the Pt surface, which facilitate the remove of adsorbents and promote the catalytic activity towards MOR and ORR.34 Furthermore, the reduced Pt lattice constant which decrease the B.E. of OHads and the suppression of Pt oxide formation are also proposed to be responsible for the enhanced ORR of PtCu/CeO2 catalysts, because OHads could inhibit the oxygen adsorption on Pt surface and Pt oxide has inherently lower ORR activity than bare Pt.40,46
The durability of catalyst is highly concerned and evaluated by chronoamperometry (CA) and accelerated degradation test (ADT). At the initial stage of CA measurements (Fig. 6A), PtCu/CeO2-31, PtCu/CeO2-21, PtCu/CeO2-11, PtCu/CeO2-12 and PtCu/CeO2-13 catalysts exhibit the current densities of 16.45, 9.66, 18.81, 8.32, and 12.34 mA cm−2, much higher than 2.74 mA cm−2 of Pt/C. During the CA operation, methanol was continuously oxidized and the intermediates (such as COads) would accumulate on Pt surface,47 leading to the catalyst poisoning and current decrease. Pt/Cu–CeO2 exhibited a much slower decay of current density over time than Pt/C, due to a faster remove rate of intermediates on Pt surface and better CO tolerance.
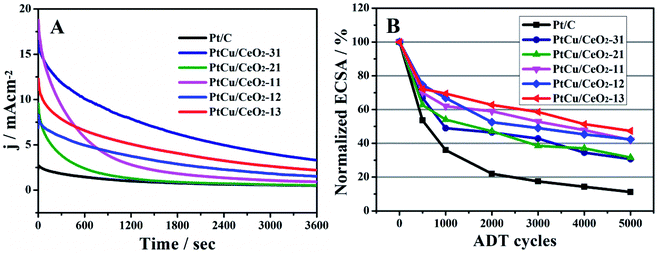 | ||
| Fig. 6 (A), the chronoamperometry running at the constant potential of 0.6 V for 3600 s in 0.5 M H2SO4 and 1 M CH3OH; (B), the relative change of ECSA obtained by ADT. | ||
It is interesting that after the 10 h continuous CA running, the If and Ib peak potentials of PtCu/CeO2 move to lower potentials by upmost 30 mV, and the If:Ib values increase (Fig. S4 and S5†). The If:Ib values of PtCu/CeO2-31, PtCu/CeO2-21, PtCu/CeO2-11, PtCu/CeO2-12, and PtCu/CeO2-13 catalysts are 1.23, 1.61, 1.28, 1.26, and 1.36, higher than their original values by 0.17, 0.34, 0.22, 0.15, and 0.20, respectively. Pt/C has no change in these features. The positive change of MOR activities of PtCu/CeO2 catalysts indicates that the interaction between Pt and Cu–CeO2 support becomes stronger under operation.
ADT was carried out to further examine the durability of PtCu/CeO2 catalysts (Fig. 6B and S6†). Pt suffers oxidation and dissolution in the potential range of 0.6–1.2 V by following reactions:48,49
| Pt + H2O ↔ PtO + 2H+ + 2e− | (6) |
| PtO + H2O ↔ PtO2 + 2H+ + 2e− | (7) |
| Pt ↔ Pt2+ + 2e− | (8) |
| PtO + 2H+ ↔ Pt2+ + H2O | (9) |
| PtO2 + 4H+ ↔ Pt2+ + 2H2O | (10) |
Which lead to the loss of ECSA. After 5000 ADT scans, PtCu/CeO2-31, PtCu/CeO2-21, PtCu/CeO2-11, PtCu/CeO2-12 and PtCu/CeO2-13 catalysts retain 31, 32, 42, 42, and 47% of initial ECSA. As a comparison, Pt/C has only 12% of initial ECSA left. Better durability is obtained with higher CeO2 content. The oxygen vacancy has the effect of anchoring metal NPs, which could inhibit the migration and sintering, leading to an improved durability.17,50
4. Conclusion
The Cu pre-coated CeO2 carbon-free support was facilely synthesized via a one-pot method and Pt was electrochemically deposited to fabricate the PtCu/CeO2 catalyst. The PtCu/CeO2 catalysts show higher activity toward methanol oxidation reaction and oxygen reduction reaction than Pt/C. The better durability is confirmed by chronoamperometry and accelerated degradation test. We find that Cu is preferential to the MOR enhancement, and CeO2 leans to the improvement in ORR and durability. The downshift of Pt d-band centre of PtCu/CeO2 catalysts, caused by the interaction between Pt and Cu–CeO2 composite support, is responsible for the MOR, ORR, and durability enhancement. Besides, the compressive strain effect of Cu on Pt and the depression of Pt oxidation are beneficial to MOR and ORR, respectively; high concentration of oxygen vacancy of CeO2 could strongly anchor metallic nanoparticles which inhibits the migration and sintering of Pt, leading to durability improvement.Conflicts of interest
We declare that we do not have any commercial or associative interest that represents a conflict of interest in connection with the work submitted.Acknowledgements
This work is financially supported by the National Natural Science Foundation of China (Grant No. 51901044 and 51871057), and Fujian Natural Science Foundation (2019J01227), and Natural Science Foundation for Youth Key Projects in College of Fujian (JZ160463), and Open research project of Fujian Provincial Key Laboratory of Advanced Materials Processing and Application (No. KF-C19003).References
- Z. M. Cui, H. Chen, M. T. Zhao, D. Marshall, Y. C. Yu, H. Abruña and F. J. DiSalvo, J. Am. Chem. Soc., 2014, 136, 10206–10209 CrossRef CAS PubMed.
- W. Y. Yuan, Y. Cheng, P. K. Sheng, C. M. Li and S. P. Jiang, J. Mater. Chem. A, 2015, 3, 1961–1971 RSC.
- J. Y. Cao, Y. Y. Du, M. M. Dong, Z. D. Chen and J. Xu, J. Alloys Compd., 2018, 747, 124–130 CrossRef CAS.
- Y. Y. Hu, J. Lu and H. Feng, RSC Adv., 2021, 11, 11918–11942 RSC.
- F. J. García-Mateos, T. Cordero-Lanzac, R. Berenguer, E. Morallón, D. Cazorla-Amorós, J. Rodríguez-Mirasol and T. Cordero, Appl. Catal., B, 2017, 211, 18–30 CrossRef.
- H. Q. Song, M. S. Luo, X. P. Qiu and G. Z. Cao, Electrochim. Acta, 2016, 213, 578–586 CrossRef CAS.
- T. C. Wu, M. Y. Gan, L. Ma, S. Wei, Q. L. Fu, Y. L. Yang, T. T. Li, F. Xie, W. Zhan and X. J. Zhong, New J. Chem., 2021, 45, 11035–11041 RSC.
- X. X. Yuan, X. L. Ding, C. Y. Wang and Z. F. Ma, Energy Environ. Sci., 2013, 6, 1105–1124 RSC.
- Z. K. Kou, K. Cheng, H. Wu, R. H Sun, B. B. Guo and S. C. Mu, ACS Appl. Mater. Interfaces, 2016, 8, 3940–3947 CrossRef CAS PubMed.
- V. T. T. Ho, K. C. Pillai, H. L. Chou, C. J. Pan, J. Rick, W. N. Su, B. J. Hwang, J. F. Lee, H. S. Sheu and W. T. Chuang, Energy Environ. Sci., 2011, 4, 4194–4200 RSC.
- T. Tamaki, H. Kuroki, S. Ogura, T. Fuchigami, Y. Kitamoto and T. Yamaguchi, Energy Environ. Sci., 2015, 8, 3545–3549 RSC.
- N. R. Elezovic, V. R. Radmilovic and N. V. Krstajic, RSC Adv., 2016, 6, 6788 RSC.
- P. K. Shen, C. Y. He, S. Y. Chang, X. D. Huang and Z. Q. Tian, J. Mater. Chem. A, 2015, 3, 14416–14423 RSC.
- K. E. Fritz, P. A. Beaucage, F. Matsuoka, U. Wiesner and J. Suntivich, Chem. Commun., 2017, 53, 7250–7253 RSC.
- Y. Kozu, S. Kawashima and F. Kitamura, J. Solid State Electrochem., 2013, 17, 761–765 CrossRef CAS.
- B. F. Lin, Z. Lei, F. Xu, N. C. Cheng and S. C. Mu, Electrochim. Acta, 2018, 290, 55–62 CrossRef CAS.
- F. Xu, D. Q. Wang, B. S. Sa, Y. Yu and S. C. Mu, Int. J. Hydrogen Energy, 2017, 42, 13011–13019 CrossRef CAS.
- J. A. Wittkopf, J. Zheng and Y. S. Yan, ACS Catal., 2014, 4, 3145–3151 CrossRef CAS.
- M. L. Xiao, S. T. Li, X. Zhao, J. B. Zhu, M. Yin, C. P. Liu and W. Xing, ChemCatChem, 2014, 6, 2825–2831 CrossRef CAS.
- I. S. Amiinu, Z. H. Pu, X. B. Liu, K. A. Owusu, H. G. R. Monestel, F. O. Boakye, H. N. Zhang and S. C. Mu, Adv. Funct. Mater., 2017, 27, 1702300 CrossRef.
- Y. J. Cen, Q. W. Qin, R. D. Sisson and J. Y. Liang, Electrochim. Acta, 2017, 251, 690–698 CrossRef CAS.
- Q. Dai, Y. Yang, Z. Zhao, A. Fisher, Z. P. Liu and D. J. Cheng, Nanoscale, 2017, 9, 8945–8951 RSC.
- L. Zhang and Y. Shen, ChemElectroChem, 2015, 2, 887–895 CrossRef CAS.
- Z. P. Qu, F. L. Yu, X. D. Zhang, Y. Wang and J. S. Gao, Chem. Eng. J, 2013, 229, 522–532 CrossRef CAS.
- K. Samson, M. Śliwa, R. P. Socha, K. Góra-Marek, D. Mucha, D. Rutkowska-Zbik, J.-F. Paul, M. Ruggiero-Mikołajczyk, R. Grabowski and J. Słoczyński, ACS Catal., 2014, 4, 3730–3741 CrossRef CAS.
- J. Y. Jin, H. Mei, H. M. Wu, S. F. Wang, Q. H. Xia and Y. Ding, J. Alloys Compd., 2016, 689, 174–181 CrossRef CAS.
- X. Y. Zhang, P. Gu, X. Y. Li and G. H. Zhang, Chem. Eng. J., 2017, 322, 129–139 CrossRef CAS.
- B. Y. Xia, H. B. Wu, N. Li, X. W. Lou and X. Wang, Angew. Chem., 2015, 127, 3868–3872 CrossRef.
- M. L. Xiao, J. B. Zhu, J. J. Ge, C. P. Liu and W. Xing, J. Power Sources, 2015, 281, 34–43 CrossRef CAS.
- M. Allemand, M. H. Martin, D. Reyter, L. Roué, D. Guay, C. Andrei and G. A. Botton, Electrochim. Acta, 2011, 56, 7397–7403 CrossRef CAS.
- A. F. Ilkhchy, F. Nasirpouri, C. Bran and M. Vázquez, J. Solid State Chem., 2016, 244, 35–44 CrossRef.
- H. Z. Yang, J. Zhang, K. Sun, S. Z. Zou and J. Y. Fang, Angew. Chem., Int. Ed., 2010, 49, 6848–6851 CrossRef CAS PubMed.
- X. W. Du, S. P. Luo, H. Y. Du, M. Tang, X. D. Huang and P. K. Shen, J. Mater. Chem. A, 2016, 4, 1579–1585 RSC.
- T. Ariyanto, A. M. Kern, B. J. M. Etzold and G. R. Zhang, Electrochem. Commun., 2017, 82, 12–15 CrossRef CAS.
- L. Zhang, K. D. Davis and X. L. Sun, Energy Environ. Sci., 2019, 12, 492–517 RSC.
- N. C. Cheng, M. N. Banis, J. Liu, A. Riese, X. Li, R. Y. Li, S. Y. Ye, S. Knights and X. L. Sun, Adv. Mater., 2015, 27, 277–281 CrossRef CAS PubMed.
- K. Bhunia, S. Khilari and D. Pradhan, ACS Sustainable Chem. Eng., 2018, 6, 7769–7778 CrossRef CAS.
- K. Bhunia, S. Khilari and D. Pradhan, Dalton Trans., 2017, 46, 15558–15566 RSC.
- G. L. Zhang, Z. Z. Yang, W. Zhang and Y. X. Wang, J. Mater. Chem. A, 2017, 5, 1481–1487 RSC.
- W. P. Xiao, J. Zhu, L. L. Han, S. F. Liu, J. Wang, Z. X. Wu, W. Lei, C. J. Xuan, H. L. L. Xin and D. L. Wang, Nanoscale, 2016, 8, 14793–14802 RSC.
- I. E. L. Stephens, A. S. Bondarenko, F. J. Perez-Alonso, F. Calle-Vallejo, L. Bech, T. P. Johansson, A. K. Jepsen, R. Frydendal, B. P. Knudsen, J. Rossmeisl and I. Chorkendorff, J. Am. Chem. Soc., 2011, 133, 5485–5491 CrossRef CAS PubMed.
- J. Y. Liu, G. R. Xu, B. C. Liu and J. Zhang, Chem. Commun., 2017, 53, 7457–7460 RSC.
- S. Parwaiz, K. Bhunia, A. K. Das, M. M. Khan and D. Pradhan, J. Phys. Chem. C, 2017, 121, 20165–20176 CrossRef CAS.
- H. Xu, A. L. Wang, Y. X. Tong and G. R. Li, ACS Catal., 2016, 6, 5198–5206 CrossRef CAS.
- G. L. Zhou, P. Li, Q. M. Ma, Z. X. Tian and Y. Liu, Nano Lett., 2018, 18, 1668–1677 CrossRef CAS PubMed.
- M. Y. Jing, L. H. Jiang, B. L. Yi and G. Q. Sun, J. Electroanal. Chem., 2013, 688, 172–179 CrossRef CAS.
- W. D. Zhang, Q. Z. Dong, H. Z. Lu, B. N. Hu, Y. Xie and G. Yu, J. Alloys Compd., 2017, 727, 475–483 CrossRef CAS.
- A. A. Topalov, S. Cherevko, A. R. Zeradjanin, J. C. Meier, I. Katsounaros and K. J. J. Mayrhofer, Chem. Sci., 2014, 5, 631–638 RSC.
- M. Zhao, W. Y. Shi, B. B. Wu, W. M. Liu, J. G. Liu, D. M. Xin, Y. F. Yao, Z. J. Hou, P. W. Ming, J. Gu and Z. G. Zou, Int. J. Hydrogen Energy, 2014, 39, 13725–13737 CrossRef CAS.
- S. W. Li, Y. Xu, Y. F. Chen, W. Z. Li, L. L. Lin, M. Z. Li, Y. C. Deng, X. P. Wang, B. H. Ge, C. Yang, S. Y. Yao, J. L. Xie, Y. W. Li, X. Liu and D. Ma, Angew. Chem., Int. Ed., 2017, 56, 1–6 CrossRef.
Footnote |
| † Electronic supplementary information (ESI) available. See DOI: 10.1039/d1ra05501a |
| This journal is © The Royal Society of Chemistry 2021 |


