 Open Access Article
Preparation of acid aluminum phosphate solutions for metakaolin phosphate geopolymer binder†
Jean Noël Yankwa Djobo *ab and
Rachel Yanou Nkwajua
aLocal Materials Promotion Authority (MIPROMALO), MINRESI, Nkolbikok, Yaoundé, 2396, Cameroon. E-mail: noeldjobo@gmail.com
bBuilding Materials and Construction Chemistry, Technische Universität Berlin, Gustav-Meyer-Allee 25, Berlin, 13355, Germany. E-mail: noel.djobo@campus.tu-berlin.de; Tel: +49 15222355719
First published on 30th September 2021
Abstract
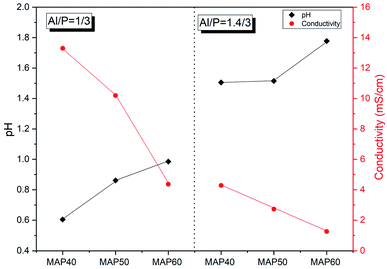
This work assessed the potential of synthetic acid aluminum phosphate solutions for the enhancement of the characteristics of metakaolin phosphate geopolymer binders obtained at room temperature. The main parameters dealt with are the concentration of the initial phosphoric acid solution (40 wt%, 50 wt%, and 60 wt%) and the molar ratio Al/P (1/3 and 1.4/3) of the synthesized acid aluminum phosphate solutions. The prepared solutions have different contents and types of mono aluminum phosphate compounds (MAP) and their reactivity is pH-dependent. This is because of the continuous neutralization of the protons due to the dissolution of aluminum hydroxide, which raises the pH and decreases the conductivity. Thus the acid aluminum phosphate solutions with molar ratio Al/P of 1/3 are the most reactive. They have significantly enhanced the compressive strength of the resulting phosphate geopolymer binders. But, when compared to phosphate geopolymer obtained with pure phosphoric acid of the same concentration, the highest rate of compressive strength improvement is recorded for acid aluminum phosphate solutions having an initial concentration of phosphoric acid of 40 wt%. Thus, the modification of the composition of the phosphoric acid with the addition of the appropriate amount of aluminum is beneficial for enhancing the characteristics of phosphate geopolymer binder at any age.
1. Introduction
Phosphate binders are low-carbon materials that use an acid phosphate with a metal oxide and/or aluminosilicate to develop their bonding properties.1–3 They are developed mainly because of their good early properties (high early strength and bonding properties, rapid initial and final setting times).4 The latter makes them suitable for application as rapid repair materials for damaged concrete structures, and waste management mainly immobilization of radioactive wastes.4 The phosphate binders made of aluminosilicate as solid precursors are also named phosphate geopolymers. The replacement of metal oxide by an aluminosilicate has a positive environmental impact on the manufacturing of phosphate binder. That is because the metal oxides which occurred naturally in the form of carbonate compounds are obtained by the calcination of the respective carbonate at elevated temperature (up to 1400 °C).The phosphate geopolymer binders show different settings and hardening behavior at an ambient or elevated temperature depending on the type of aluminosilicate used. Indeed, the reaction mechanism of aluminosilicate with and acid phosphate include the dealumination of the aluminosilicate and the reaction of the Al3+ ions with the phosphate species.5,6 These reactions are very slow at room temperature and can be accelerated by applying additional heat with mild temperatures.7,8 When the aluminosilicate is rich in iron, calcium, and magnesium the reaction mechanism is modified. Then during the first stage of the reaction, the dissolution process involves Al3+, Fe2+/Fe3+, Ca2+, and Mg2+ ions. Afterward, those ions react preferentially with the phosphate species to form the binder as follows: Ca2+ = Mg2+ > Al3+, Fe2+/Fe3+.9 The binder is amorphous and/or semi-crystalline depending on the synthesis conditions, and has been described as a solid solution of two or more of the following phases: aluminophosphate, silico-aluminophosphate, silicophosphate, iron phosphate, calcium phosphate, and magnesium phosphate.6,9–14 In recent work, the authors demonstrated that calcium phosphate and magnesium phosphate phase are responsible for the fast hardening at room temperature of the phosphate geopolymer.9 Whereas aluminum and iron phosphate phases were found responsible for the high strength development mainly at a late age. Moreover, the silicophosphate phase mainly contributes to the reinforcement of the matrix and increases the late age compressive strength of the binder.15
Metakaolin-based phosphate geopolymer binder is a slow-setting binder due to the slow rate of dissolution of aluminum in phosphoric acid. In this regard, alternative acid phosphate-containing aluminum was used to activate metakaolin, accelerate the hardening behavior, and enhance the mechanical properties. That consists mainly of the commercial monoaluminum phosphate (MAP) powder and liquid which were used to prepare MK-phosphate geopolymer. It was demonstrated that using MAP makes readily available aluminum for reacting with dissolved phosphate species at a very early stage of the reaction process. That contributes to the acceleration of the setting and hardening reactions which is most useful at room temperature.16,17 However, the reactivity of the MAP depends upon its form and dosage, knowing that aluminum phosphate exists in different forms according to the molar ratio Al/P.18–20
Thus, this work aims at understanding the role of the types of monoaluminum phosphate compounds and their content for getting the optimum characteristics of the metakaolin phosphate geopolymer binder obtained at room temperature. To address this, two acid aluminum phosphate solutions were prepared by targeting specific molar concentrations Al/P that give different types and percentages of monoaluminum phosphate compounds. Then, they were used to prepare metakaolin phosphate geopolymer binders at room temperature.
2. Experimental methods
2.1 Materials
The phosphoric acid (PA) used was analytical grade orthophosphoric acid, 85 wt% obtained from VWR International GmbH, Germany. Analytical grade of aluminum hydroxide with formula Al2(OH)6 (65% of Al2O3) and mean particle size of 40 μm was used as the aluminum source for the preparation of acid aluminum phosphate solution. Metakaolin is obtained from Argeco, France. The chemical composition of metakaolin measured by X-ray fluorescence (PW 2400 PHILIPS instrument, Eindhoven, the Netherlands) is reported in Table 1. The characteristic diameters of MK particles were measured by laser granulometry (Mastersizer 2000 from Malvern Instruments, Worcestershire, UK) and reported in Table 1.| Oxides | SiO2 | Al2O3 | Fe2O3 | CaO | MgO | Na2O | TiO2 | K2O | MnO | P2O5 | LOI | Total |
| MK (wt%) | 56.99 | 35.97 | 1.18 | 0.40 | 0.18 | 0.10 | 1.27 | 0.16 | 0.04 | 0.03 | 1.73 | 98.05 |
| Particles size distribution (μm) | D10 | D50 | D90 | |||||||||
| 3.66 | 31.80 | 101.01 | ||||||||||
2.2 Preparation of acid aluminum phosphate solution
Three concentrations of phosphoric acid solution 40 wt% (PA40), 50 wt% (PA50), and 60 wt% (PA60) were used. Two distinct amounts of aluminum hydroxide were used to get two major compositions of acid aluminum phosphate solutions with molar ratios Al/P of 1/3 and 1.4/3 each. These molar ratios were chosen to get acid aluminum phosphate solution in which the dominant components are the forms of monoaluminum phosphate (MAP) Al(H2PO4)3 and/or Al(OH)(H2PO4)2 for the solution with molar ratio Al/P of 1/3 and 1.4/3. The role of the Al/P molar ratio on the type of monoaluminum phosphate obtained was reported in the literature.19,20 Thus MAP will be used along this paper to define the acid aluminum phosphate solution prepared. The phosphoric acid was first diluted with distilled water to obtain the desired concentration, then the corresponding amount of aluminum hydroxide was added. The mix was heated at 60 °C under stirring for 10 minutes to accelerate the dissolution of aluminum hydroxide. The obtained solutions were stored for at least 24 h for allowing them to cool down before use.2.3 Synthesis of MK phosphate geopolymer binder
The phosphate geopolymer binder was prepared by mixing each MAP solution with metakaolin at a constant liquid to powder ratio of 0.8. For comparison purposes, plain phosphate geopolymer was also prepared with phosphoric acid of concentrations of 40 wt%, 50 wt%, and 60 wt% using the same liquid to powder ratio of 0.8. The whole was mixed for 3 min using a kitchen aid, cast in 20 mm cubic mold later vibrated for 3 min. Afterward, all samples were covered with a plastic bag and stored in a climatic room with 20 °C and 65% relative humidity. The samples were demolded after 7 days and kept in the same condition till tests are performed. The summary of the mix composition is reported in Table 2.| Designation | Initial concentration of phosphoric acid (wt%) | MAP/MK mass ratio | PA/MK mass ratio | |
|---|---|---|---|---|
| Plain phosphoric acid (PA) | MKPA40 | 40 | — | 0.8 |
| MKPA50 | 50 | — | 0.8 | |
| MKPA60 | 60 | — | 0.8 | |
| Monoaluminum phosphate (MAP) Al/P = 1/3 | MKMAP40 | 40 | 0.8 | — |
| MKMAP50 | 50 | 0.8 | — | |
| MKMAP60 | 60 | 0.8 | — | |
| Monoaluminum phosphate (MAP) Al/P = 1.4/3 | MKMAP40 | 40 | 0.8 | — |
| MKMAP50 | 50 | 0.8 | — | |
| MKMAP60 | 60 | 0.8 | — | |
2.4 Characterization techniques
The pH and conductivity of the different acid aluminum phosphate solutions were measured using a Mettler Toledo pH meter (SevenGo Duo Pro).The water absorption and the apparent porosity were determined according to the ASTM C-642 method, and the Archimedes principle, respectively. The samples were dried in an oven at 65 °C for 48 h and then put in water for 48 h. These tests were carried out on 28 days aged samples. The compressive strength was measured using a compression testing machine (Toni Technik, Berlin, Germany) at 7 d and 28 d. The device directly gives the value of the strength in MPa after the break is detected. The final result is the average value of 3 replicated samples for each formulation.
Attenuated Total Reflectance (ATR)-Fourier-transform infrared spectroscopy (FTIR) technique was used to collect information on the structure and composition of the samples. This was performed using Spectrum Two of the PerkinElmer instruments (UK) operating in the wavenumber range 400 to 4000 cm−1 with a resolution of 4 cm−1. The changes in the mineralogy were assessed with an Empyrean PANalytical diffractometer (Malvern Panalytical Ltd, Malvern, UK) with a Ni filter transmitting the CuKα radiation (k = 1.540598 Å) produced by an electric current of 40 mA with a voltage of 40 kV. After being, the diffracted X-rays by the sample were recorded by a PiXcel1D detector. The thermal gravimetry analysis (TGA) coupled with differential scanning calorimetry (3+ SARe System, Mettler Toledo, Columbus, OH, USA) was used to characterize the binder. The temperature range was 25–1000 °C, and it operated at a heating rate of 5 K min−1 at a synthetic air atmosphere flowing at 70 mL min−1.
Pascal series mercury intrusion porosimeter (140/240, from Thermo Scientific) was used to assess the pore size distribution of the fractured samples. The microstructure of the hardened products was observed using a backscattered electron scanning electron microscope (SEM) coupled with energy-dispersive X-ray spectroscopy (EDX) (Zeiss Gemini SEM 500 NanoVP microscope Oberkochen, Germany) to determine the phase composition. The device operated in low-vacuum mode with 15 kV acceleration voltage.
3. Results and discussion
3.1 Characterization of the acid aluminum phosphate solution
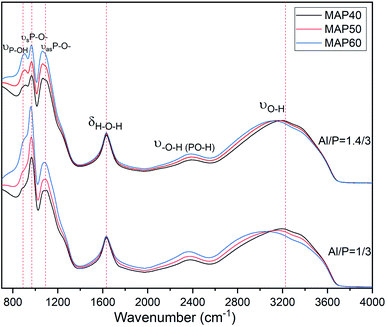
From a stoichiometric point of view, the reactions of the aluminum hydroxide with phosphoric acid using the synthesis conditions described in this paper (60 °C for 10 min) should lead to Al(H2PO4)3 and Al(OH)(H2PO4)2 when the molar ratio for Al/P of the initial solution is 1/3 and Al/P = 1.5/3 respectively (eqn (1) and (2)). In a recent study, Wei et al. reported that when an aluminum hydroxide reacts with phosphoric acid in molar ratio Al/P between 1/3 and 1.5/3 the reaction is a mixture of Al(OH)(H2PO4)2 and Al(H2PO4)3. The proportion of these two phases depends on the Al/P molar ratio. Thus, the amount of Al(H2PO4)3 decreases from 72.7% (Al/P = 1.1/3) to 14.3% (Al/P = 1.4/3) while the amount of Al(OH)(H2PO4)2 increases from 27.3% (Al/P = 1.1/3) to 85.7% (Al/P = 1.4/3). Thus, the acid aluminum phosphate solution obtained from this work is a monoaluminum phosphate solution with the molar ratio of Al/P 1/3 and 1.4/3, composed of a single phase of Al(H2PO4)3 and a mixture of Al(H2PO4)3/Al(OH)(H2PO4)2 respectively.
 | (1) |
 | (2) |
3.2 Physical and mechanical properties
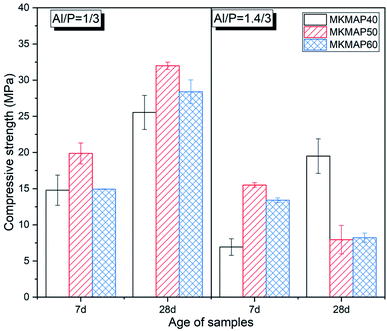 | ||
| Fig. 4 Compressive strength evolution of the MK-based phosphate geopolymer binder obtained with MAP having molar ratio Al/P = 1/3 (left) and 1.4/3 (right). | ||
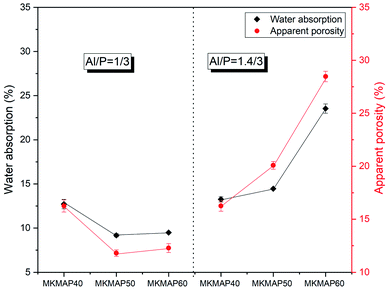
The compressive strength ranges from 14.79 MPa to 19.87 MPa at 7 d and 25.53 MPa to 31.98 MPa at 28 d for MK phosphate geopolymer binder obtained from MAP solution with molar ratio Al/P = 1/3. The optimum compressive strength in this series was achieved for MKMAP50 at all ages. It must be recalled that the reaction products are formed when the amount of dissolved species reaches the critical value to undergo condensation. In other words, there is a window of the Al/P and Si/P molar ratio of the phosphate binder within which the physical properties are the best.11,22–24 The 7 d compressive strength of the series of samples obtained with MAP having molar ratio Al/P = 1.4/3 is the highest (15.5 MPa) for MKMAP50. At 28 d the compressive strength of samples MKMAP40 in that series becomes the highest one while the compressive strength of samples MKMAP50 and MKMAP60 dropped to 7.95 MPa and 8.23 MPa, respectively. The decrease of the compressive strength with time means that the binder or the reaction products in those samples are not stable and tend to self-deteriorate upon aging. This has also been observed in the literature.11 The significant increase of the compressive strength of MKMAP40 (obtained with MAP having molar ratio Al/P = 1.4/3) with time indicates that there is a continuous dissolution of metakaolin with the time that contributes to the formation of a high volume of reaction products leading to a sample with reducing porosity as shown in Fig. 3.
To assess the suitability of the acid aluminum phosphate solutions to react with metakaolin in comparison to the diluted phosphoric acid solution, the strength activity index (SAI) was measured. The SAI is used very often to assess the strength improvement in blended Portland cement due to the pozzolanic activity of the added pozzolanic materials.25 The SAI is defined in this work as the ratio of the compressive strength (28 d) of each MKMAP binder to one of its correspondent MKPA obtained with similar phosphoric acid solutions (PA40, PA50, and PA60) at the same age. The results of the measured strength activity index are presented in Fig. 5. It must be noted that the red dotted line is the reference beyond which the gain in compressive strength was achieved, whereas below the line it is the loss in strength. Therefore one can observe that the SAI is higher for the phosphate geopolymer binder obtained with MAP having a molar ratio Al/P = 1/3. Also, their SAI is higher than 100%, which means that the use of MAP solutions having molar ratio Al/P = 1/3 for the preparation of MK phosphate geopolymer binder is beneficial for strength improvement. That corroborates the previous statement made in this work stressing that the ready availability of soluble aluminum species in the right amount in the phosphate solution accelerates the reaction. When considering the series of formulations obtained with MAP solutions having molar ratio Al/P = 1.4/3, only the sample MKMAP40 has the SAI that crosses the reference line (100%). This means that the other samples MKMAP50 and MKMAP60 lose strength at 28 d compared to the respective ones obtained from PA50 (MKPA50) and PA60 (MKPA60). In other words, the amount of aluminum hydroxide added to these solutions (PA50 and PA60) to get the final Al/P molar ratio of 1.4/3, delays the reaction process and is detrimental to the compressive strength development at a late age. This corroborates the recent findings where the addition of aluminum only improved the early age compressive strength and decreased the late age strength.17
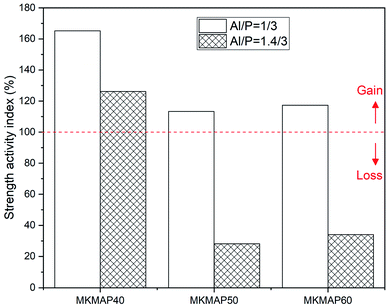 | ||
| Fig. 5 Effect of phosphorus concentration and molar ratio Al/P of the MAP solution on the strength activity index. | ||
Regardless of the type of MAP solution, the samples MKMAP40 have the highest SAI. The 28 d compressive strength of the series of samples obtained with different concentrations of pure phosphoric acid (Fig. S2 ESI†) is lower for MKPA40 (15.46 MPa) than the one of MKPA50 (28.23 MPa) which is also higher than the one of MKPA60 (24.20 MPa). Moreover, within each series of MAP solutions, one can see that the SAI of the resulting phosphate binder decreases with the increase of the concentration of the initial phosphoric acid used. All this indicates that the availability of soluble aluminum at the early stage of the reaction is most effective in accelerating the reaction kinetic and strength development of low concentration and pH of acid aluminum phosphate solution. Therefore, this ascertains the benefit of using soluble aluminum to compensate for its low availability when preparing phosphate geopolymer from low soluble phosphoric acid solution to improving its compressive strength.
3.3 Microstructural characteristic of the phosphate geopolymer binder
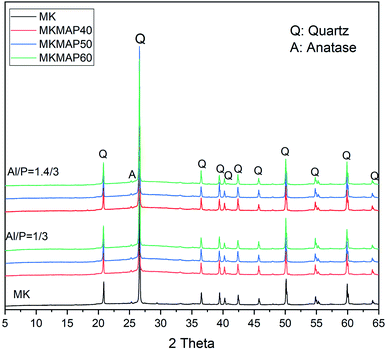 | ||
| Fig. 6 X-ray patterns of MK and MKMAP samples prepared from different concentrations of phosphorus and molar ratio Al/P. | ||
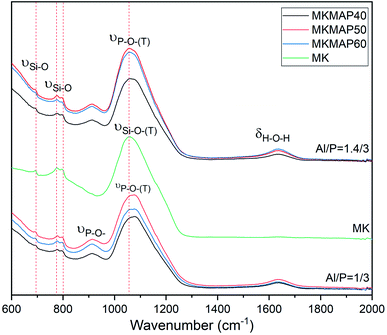
More information on the structural compositions and the resulting changes with the concentrations of phosphorus and molar ratio Al/P of the MAP can be seen in the ATR-FTIR in the range 600–2000 cm−1 of the phosphate binder showed in Fig. 7. One can see in the spectra the bands appearing at near 692 cm−1, 776 cm−1 and 798 cm−1 characteristics of the Si–O stretching vibration from quartz.26,27 The band at 1630 cm−1 present in all spectra except MK is characteristic of the bending vibration of the H–O–H bonds of the water. In the spectrum of MK, the main band is broad and centered at 1056 cm−1. It corresponds to the stretching vibration of the Si–O–(T) bond where T is either Si or Al. Such broadband in an IR spectrum indicates the availability of several types of disordered bonds that come mainly from the amorphous phase of MK. In the spectra of MKMAP, that broadband has shifted to a higher wavenumber and is centered at 1077 cm−1 and 106 cm−1 for MKMAP obtained with molar ratio Al/P = 1/3 and 1.4/3 respectively. That main band characteristic of the phosphate binder corresponds to the stretching vibration of the P–O–(T) bond where T is Al and/or Si. So, such broadband indicates the presence of P–O–T vibration bonds corresponding to various types of aluminum phosphate/silicophosphate phases and is characteristic of the amorphous phase of the binder. The increase of the wavenumber is ascribed to an increase in the degree of condensation–polycondensation of the dissolved species, which leads to a longer polymeric chain with stronger bonds Si–O–P–O–Al/Al–O–P–.14,22 The shift of the wavenumber of the main band is more pronounce (21 cm−1) for the series of MKMAP obtained with MAP solution having molar ratio Al/P = 1/3 than the other series obtained with MAP having molar ratio Al/P = 1.4/3 (11 cm−1). The latter corroborates well with the previous results presented in this work which show that MAP solutions with molar ratio Al/P = 1/3 are more reactive than MAP with molar ratio Al/P = 1.4/3. Another change observed involves the presence of the band at 911 cm−1 not present in the spectrum of MK and characteristic of the stretching vibration of the P–O– bond of the phosphate binder.28
3.4 Microstructure
The pore size distribution determined from MIP is shown in Fig. 9. Roughly, the diameter of the pores ranges from 0.007 μm to 100 μm in all samples. On the other hand, the multiple slope change as highlighted in all curves of the specific pore volume vs. pore diameter demonstrates that all the mixes have a multimodal pore distribution.31 That indicates the heterogeneity of the pores structures of the phosphate binder developed. Within each series, the characteristic pore diameter d90 (corresponding to the maximum size of 90% of the pores present in the phosphate binder) is 0.03 μm (MKMAP40), 0.118 μm (MKMAP50), and 0.21 μm MKMAP60 for the MKMAP obtained with MAP solution having molar ratio Al/P = 1/3. Whereas in the other series prepared with the MAP solution having molar ratio Al/P = 1.4/3, d90 is 0.013 μm for MKMAP40 and MKMAP50 and 0.20 μm for MKMAP60. These results indicate that the porosity is dominated by the capillary pores, since d90 ranges between 0.01 to 1 μm, which corresponds to a more connected pore network. A clear trend of the pores size distribution could not be observed which confirms the complexity of the pore structure of the binder developed. Whilst from the Archimedes method, the trend of the apparent porosity measured correlates well with the compressive strength evolution. The discrepancies of the MIP result with the Archimedes method rely on the fact that MIP does not measure internal pore and the porosity is a function of the pressure applied, which always gives different results.31 But it was used here to assess the pore size distribution of the binders.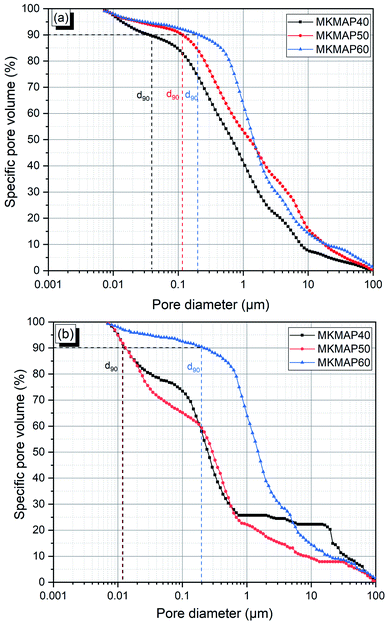 | ||
| Fig. 9 Pore size distribution of the phosphate geopolymer binder obtained with: (a) MAP solution having molar ratio Al/P = 1/3 and (b) MAP solution having molar ratio Al/P = 1.4/3. | ||
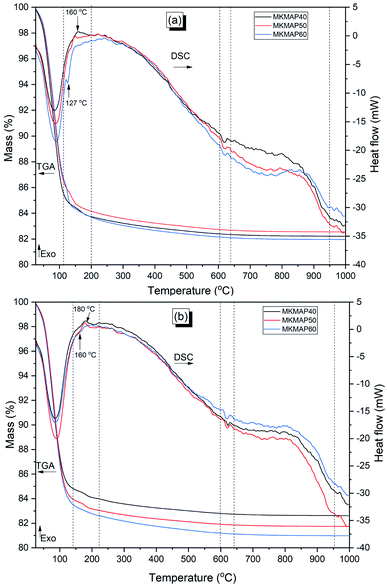
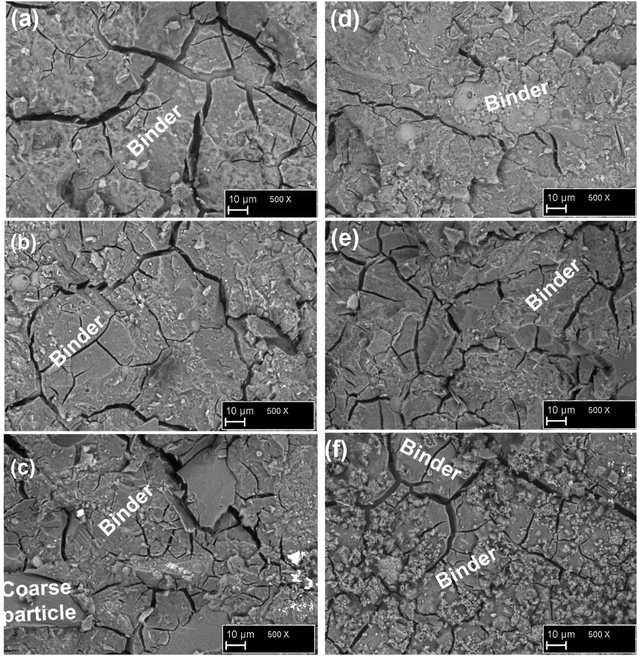
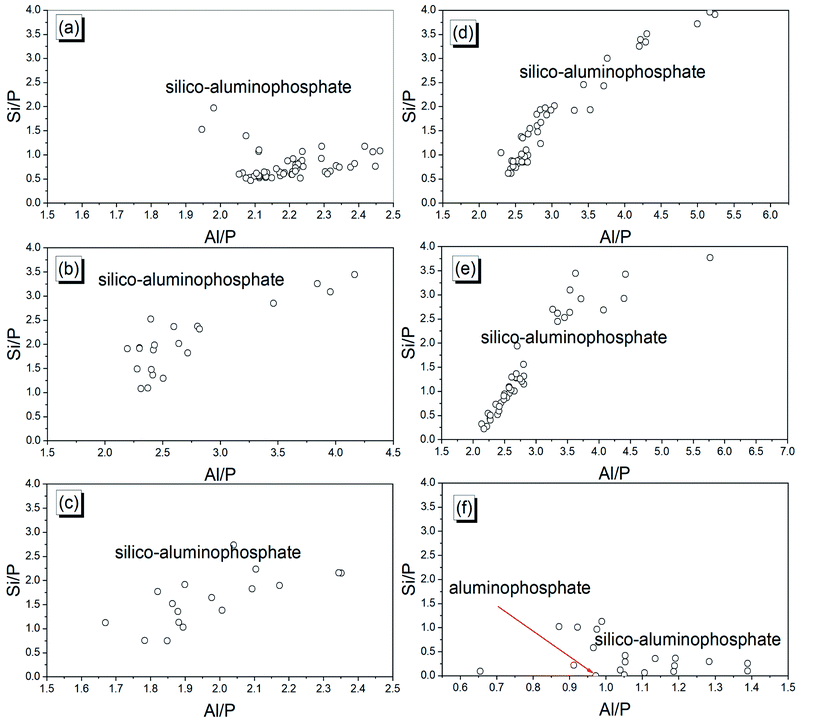
The distribution of different phases of the phosphate geopolymer binders at the microstructural level is depicted in Fig. 10. The micrographs on the fractured samples are characterized by microcracks and coarse particles of various sizes. Moreover, dense and homogeneous areas are also visible in all samples which may be ascribed to the binding phases resulting from the acid–base reaction between MAP and MK. The different phases are shapeless, meaning that the reaction products are amorphous. This correlates well with the XRD results where no new mineral was detected. The result of the EDX analysis performed on at least 20 points of the reacted phases is shown in Fig. 11. The dense and homogeneous phases appearing as the major phase in all samples are identified as silico-aluminophosphate. Another phase identified by EDX as the aluminophosphate phase (Fig. 11f) has a gel-like structure and is stuck on the surface of the dense phase. The silico-aluminophosphate phase is simply pure silica diffused in an aluminophosphate phase or the mixture of silicophosphate/aluminophosphate. That was confirmed by the DSC curves and also agrees with literature that showed the crystallization of the aluminophosphate phase indicating that it stands as the major phase beside others in the phosphate geopolymer binder.32,33 When looking closely at the range of atomic ratio Si/P, one can distinguish two types of the composition of the silico-aluminophosphate phase based on the silicon content. Those with the atomic ratios Si/P < 0.5 imply a silica poor silico-aluminophosphate phase, whereas the atomic ratios Si/P > 0.5 correspond to the silica-rich silico-aluminophosphate phase. The poor silica-based silico-aluminophosphate phase is the consequence of the low rate of dissolution of MK as discussed previously.
4. Conclusion
This work reported the role of the concentration of phosphorus and molar ratio Al/P of synthesized acid aluminum phosphate solution in its suitability for the activation of metakaolin at room temperature. The main findings are summarized as follows:(1) The characterization of the acid aluminum phosphate solution revealed that it is mainly composed of various types of monoaluminum phosphate (MAP) compounds depending on the aluminum dosage. For solutions with molar ratio Al/P = 1/3, the main compound is Al(H2PO4)3, while those with molar ratio Al/P = 1.4/3 Al(OH)(H2PO4)2 as the main compound and Al(H2PO4)3 as the secondary.
(2) The acid aluminum phosphate solutions obtained with molar ratio Al/P = 1/3 are most reactive because of their higher acidity as compared to the solutions with molar ratio Al/P = 1.4/3.
(3) The highest 7 and 28 d compressive strength was achieved by the phosphate geopolymer binders obtained with solutions having molar Al/P = 1/3 and the initial concentration of phosphoric acid 50 wt%. That is because of the availability of the appropriate amount of Al and P in the matrix that leads to the strongest binder.
(4) The early availability of soluble aluminum from the MAP is beneficial for accelerating the reaction kinetic and the compressive strength of the resulting phosphate geopolymer as compared to those prepared with diluted phosphoric acid only. Further, this is most effective when the appropriate amount of aluminum has been used.
Author contributions
Jean Noël Yankwa Djobo, design, carried out the experiments, and wrote the manuscript, Rachel Yanou Nkwaju performed some experiments and revised the final manuscript.Conflicts of interest
There are no conflicts to declare.Acknowledgements
The authors are grateful to the Alexander von Humboldt Foundation for the financial support of this work through the Georg Forster postdoctoral fellowship program (CM-1201499-GF-P). The technical assistance of Tobias Dorn in collecting SEM-EDX data is also acknowledged.References
- A. S. Wagh, in Advances in ceramic matrix composites, ed. N. P. Bansal, J. P. Singh and W. M. Kriven, The American Ceramic Society, 2005, pp. 107–116 Search PubMed.
- A. S. Wagh, in Developments in Strategie Materials and Computational Design II Developments in Strategie Materials and Computational Design II, ed. W. M. Kriven, A. L. Gyekenyesi and J. Wang, John Wiley & Sons, Inc., Hoboken, New Jersey, 2011, pp. 91–103 Search PubMed.
- A. S. Wagh and S. Y. Jeong, J. Am. Ceram. Soc., 2003, 44, 1838–1844 CrossRef.
- A. S. Wagh, Chemically Bonded Phosphate Ceramics Twenty-First Century Materials with Diverse Applications, Elsevier Science, Amsterdam, 2 edn, 2016, vol. 24 Search PubMed.
- A. Katsik, Adv. Appl. Ceram., 2019, 1–13 Search PubMed.
- Y.-S. Wang, Y. Alrefaei and J.-G. Dai, Front. Mater., 2019, 6, 1–17 CrossRef.
- M. Zribi, B. Samet and S. Baklouti, J. Non-Cryst. Solids, 2019, 511, 62–67 CrossRef CAS.
- H. Celerier, J. Jouin, N. Tessier-Doyen and S. Rossignol, J. Non-Cryst. Solids, 2018, 500, 493–501 CrossRef CAS.
- J. N. Y. Djobo, D. Stephan and A. Elimbi, J. Build. Eng., 2020, 31, 101427 CrossRef.
- M. Lassinantti Gualtieri, M. Romagnoli and A. F. Gualtieri, J. Eur. Ceram. Soc., 2015, 35, 3167–3178 CrossRef CAS.
- A. Katsiki, T. Hertel, T. Tysmans, Y. Pontikes and H. Rahier, Materials, 2019, 12, 1–15 CrossRef PubMed.
- T. Dong, S. Xie, J. Wang, Z. Chen and Q. Liu, J. Aust. Ceram. Soc., 2020, 56, 175–184 CrossRef CAS.
- C. R. Kaze, G. L. Lecomte-Nana, E. Kamseu, P. S. Camacho, A. S. Yorkshire, J. L. Provis, M. Duttine, A. Wattiaux and U. C. Melo, Cem. Concr. Res., 2021, 140, 106320 CrossRef CAS.
- J. N. Y. Djobo, A. Elimbi and D. Stephan, SN Appl. Sci., 2020, 2, 828 CrossRef CAS.
- B. Zhang, H. Guo, P. Yuan, L. Deng, X. Zhong, Y. Li, Q. Wang and D. Liu, Cem. Concr. Compos., 2020, 110, 103601 CrossRef CAS.
- Y.-S. Wang, J.-G. Dai, Z. Ding and W.-T. Xu, Mater. Lett., 2017, 190, 209–212 CrossRef CAS.
- Y.-S. Wang, J. L. Provis and J. G. Dai, Cem. Concr. Compos., 2018, 93, 186–195 CrossRef CAS.
- E. Palacios, P. Leret, M. J. De La Mata, J. F. Fernández, A. H. De Aza and M. A. Rodríguez, CrystEngComm, 2013, 15, 3359–3365 RSC.
- Y. Li, G. Chen, S. Zhu, H. Li, Z. Ma, Y. Liu and L. Liu, Bull. Mater. Sci., 2019, 45(5) DOI:10.1007/s12034-019-1912-3.
- H. Wei, T. Wang, Q. Zhang, Y. Jiang and C. Mo, J. Chin. Chem. Soc., 2020, 67, 116–124 CrossRef CAS.
- A. S. Wagh, Chemically Bonded Phosphate Ceramics, 2016, pp. 141–155 Search PubMed.
- H. K. Tchakouté, C. H. Rüscher, E. Kamseu, F. Andreola and C. Leonelli, Appl. Clay Sci., 2017, 147, 184–194 CrossRef.
- H. Douiri, S. Louati, S. Baklouti, M. Arous and Z. Fakhfakh, Mater. Lett., 2014, 116, 9–12 CrossRef CAS.
- S. Louati, S. Baklouti and B. Samet, Adv. Mater. Sci. Eng., 2016, 2016 DOI:10.1155/2016/2359759.
- S. Kumar, J. N. Y. Djobo, A. Kumar and S. Kumar, Eur. J. Environ. Civ. Eng., 2020, 24, 833–848 CrossRef.
- C. N. Bewa, H. K. Tchakouté, C. Banenzoué, L. Cakanou, T. T. Mbakop, E. Kamseu and C. H. Rüscher, Appl. Clay Sci., 2020, 198, 105813 CrossRef CAS.
- B. Zhang, H. Guo, L. Deng, W. Fan, T. Yu and Q. Wang, Appl. Clay Sci., 2020, 199, 105887 CrossRef CAS.
- S. Louati, W. Hajjaji, S. Baklouti and B. Samet, Appl. Clay Sci., 2014, 101, 60–67 CrossRef CAS.
- P. L. Zhuravleva, N. S. Kitaeva, Y. M. Shiryakina and A. A. Novikova, Russ. J. Appl. Chem., 2016, 89, 367–373 CrossRef CAS.
- P. Prado-Herrero, J. Garcia-Guinea, E. Crespo-Feo and V. Correcher, Phase Transitions, 2010, 83, 440–449 CrossRef CAS.
- H. Giesche, Part. Part. Syst. Charact., 2006, 23, 9–19 CrossRef.
- M. Zribi and S. Baklouti, Polym. Bull., 2021 DOI:10.1007/s00289-021-03829-0.
- H. Guo, B. Zhang, L. Deng, P. Yuan, M. Li and Q. Wang, Appl. Clay Sci., 2021, 204, 106019 CrossRef CAS.
Footnote |
| † Electronic supplementary information (ESI) available. See DOI: 10.1039/d1ra05433c |
| This journal is © The Royal Society of Chemistry 2021 |

