 Open Access Article
In situ synthesis of holey g-C3N4 nanosheets decorated by hydroxyapatite nanospheres as efficient visible light photocatalyst†
Mohammad Chahkandi *a,
Mahboobeh Zargazi*b,
Afsaneh Ahmadia,
Ehsan Koushki
 c and
Arman Ghasedi
 c
c
aDepartment of Chemistry, Hakim Sabzevari University, Sabzevar 96179-76487, Iran. E-mail: m.chahkandi@hsu.ac.ir; Fax: +985144012451; Tel: +985144013342
bDepartment of Chemistry, Faculty of Science, Ferdowsi University of Mashhad, Mashhad, 91775, Iran
cDepartment of Physics, Hakim Sabzevari University, Sabzevar 96179-76487, Iran
First published on 22nd September 2021
Abstract
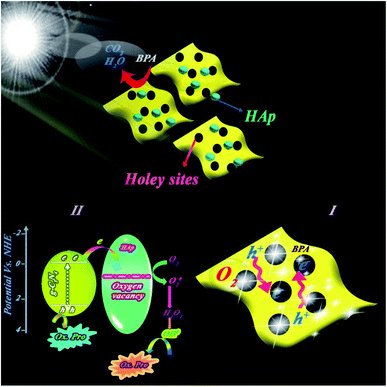
The interesting g-C3N4 nanosheet morphology has drawn huge attention in photocatalytic applications because of its special features. Nonetheless, the relative activity of these nanosheets is still controversial due to the low available active sites and the high recombination probability of photo-induced charge carriers. In this work, in situ sol–gel approach was applied to synthesize holey g-C3N4 nanosheets/hydroxyapatite (HAp) nanospheres with plentiful in-plane holes. Herein, the presence of Ca2+ plays a key role in the formation of holey defects on 2D g-C3N4. In-plane holes provide nanosheets with more active edges and diffusion channelsv, resulting in a tremendous enhanced mass and photo-induced charge transfer speed. Moreover, the holes make highly numbered boundaries, which lead to the prevention of aggregation. On the other hand, distributed nano-HAp spheres on these nanosheets can form effective heterojunctions having high photo-degradation ability of pollutants. Intrinsic O-vacancies inside HAp unit cells mainly affect the capture of photogenerated electrons, pollutant molecules, and O2 gas. The synergistic presence of O-vacancies and holey defects (C-vacancies) on 2D g-C3N4 plays a key role in raising the photocatalytic performance of holey g-C3N4/HAp. It can be concluded that the proposed preparation method is a promising approach for simultaneous synthesis of holey g-C3N4 and surface heterojunctions of Ca-based materials. This new structure has shown significant degradation ability of bisphenol A, a prominent pollutant, with a low amount (0.01 g) and short time.
1. Introduction
Technology and industries in the modern world have rapidly grown to facilitate human life, such as the construction of advanced machines and employing nano fabrications in various fields (medicine, genetics, and so on).1,2 Despite the benefits, they have also caused irreparable damage to the environment and ultimately to human health. The fast flux of dangerous contaminants to the ground and surface water with the malicious footprints in ecosystems are worrying.3,4 For many years, researchers have pursued simple but still effective ways to reduce or eliminate these pollutants from aquatic environments.5,6 Among the techniques, the photocatalytic process has attracted more attention due to the simple, low cost (from the view of energy source), and supreme performance without the liberation of any secondary pollutants compared to the conventional methods (adsorption, ozonation, and ion exchange).7,8 Recently, because of diminishing photocatalytic activities, researchers have switched their routes to the synthesis of nanocomposites or immobilized forms on supports.9,11–13 Immobilized photocatalysts could improve charge separation and enhance degradation performance. Considering this effective remediation method, graphitic carbon nitride (g-C3N4) was introduced in 2009 as an excellent photocatalyst with eco-friendly characteristics, nontoxicity, thermal and chemical stability, low-cost preparation, and easy cut-rate fabrication.14,15 Nevertheless, low surface area, unsatisfactory high visible-light absorption, and fast recombination rate of photogenerated charges from the π–π system (triazine rings) severely restrict the photocatalytic activity of pristine bulk g-C3N4. Hitherto, two main classified strategies were proposed to resolve the g-C3N4 deficiencies considering the band gap and structural engineering.16 The former factor can be obtained by insertion and/or doping functional elements, modification using heteroatoms, and making heterojunction semiconductors.17,18 The latter method provides various morphological structures of g-C3N4 such as nanosheets,19 nanorods,20 nanotubes,15 and so on with remarkable physicochemical features. Especially, 2D nanosheets of g-C3N4 have attracted much attention due to their high surface area, enhanced electron–phonon interactions, and vast in-plane electron mobility.21 Nevertheless, the available active sites on the nanosheet surface are still confined due to boundaries and edges. The delocalized electron density of triazine rings makes π–π stacking forces to array those ordered nanosheets averting the aggregation and also prevent the transportation of the formed H2O2 intermediates, which results in poisoning g-C3N4 nanosheets, leading to limited photocatalytic performance. The highlighted drawbacks can be remarkably diminished by the creation of porous sites in g-C3N4 nanosheets. Recently, high photocatalytic performance has been demonstrated within the fabrication of 3D g-C3N4 with porous sheets.22 The in-plane pores dispersed all over the holey g-C3N4 nanosheets can improve mass and charge transport along the sheets. On the other hand, holes prevent sheet aggregation because of possessing of interstice interaction sites. Despite the numerous investigations about the synthesis of g-C3N4 nanosheets, preparation of its composites with holey nanosheet morphology is still a controversial challenge. Liang et al. reported a thermal treatment synthetic method for this morphological structure under ammonia gas with great photocatalytic performance for hydrogen evolution compared to the conventional g-C3N4.23 An effective photocatalyst of oxygen edged holey g-C3N4 nanosheets was constructed under photo-Fenton-reaction and UV irradiation with remarkable pollutant degradation.24,25 Moreover, porous holey nanosheets were synthesized via the pre-polymerization method showing high photocatalytic H2 evolution under ammonia gas pressure.26 Also, similar works for the preparation of the mentioned morphologies suffer from complex processes and are time-consuming.27,28 However, herein, an effective strategy was applied for simple and cost-effective sol–gel-derived holey g-C3N4 nanosheets decorated by HAp NPs.Recently, the photocatalytic activity of HAp in different forms was investigated. Biphasic HAp–titana indicated high photocatalytic performance compared to the single phase titana or HAp and also Ti-doped form of HAp. However, some single forms of HAp without any dopant have photocatalytic efficiency in the degradation of methyl mercaptan and dimethyl sulphate.29
Z-scan method is a well-known technique for measurements of nonlinear refractive and absorption coefficients because of its accuracy and simplicity.30 In this method, through movement of the sample along the z-axis (horizontal direction shown in Scheme 1) nonlinear absorption coefficient and refractive index of the sample are obtained by open and close aperture experiments, respectively. Nonlinear refraction could be due to thermal lensing, electron transition attributed to third order nonlinearity (Kerr effect), and optical reorientation effect.31 Electrical nonlinear refraction is a weak phenomenon in low laser illuminations and could be negligible. Z-scan experiments give useful information about the nonlinear optical coefficients of materials in interaction with different laser beam intensities. NPs have been extensively used in optical and electrical applications due to their unique electronic and quantum structures and also thermal and chemical stability. High photoluminescence efficiency, photovoltaic property, and plasmonic resonance of NPs have been widely considered in optical applications.31–33 Nonlinear optical properties of NPs are studied due to their unique characteristics, such as saturation absorption,34 optical Kerr effect,35 and reorientation effect.36 Materials with low threshold saturation intensity are proposed in controllable transparent media, light amplifier mediums, laser cavities, and Q-switching devices.37
In the present work, we introduced a novel facile sol–gel-derived heterojunction of holey g-C3N4 nanosheets/HAp. The structure includes HAp NPs decorated on the holey sites of in situ fabricated g-C3N4 nanosheets. Compared with pure HAp and g-C3N4, the prepared composite demonstrated significantly improved photocatalytic capability for bisphenol A (BPA) degradation under visible-light illumination. This activity can be attributed to the numerous holes dispersed on the in-planes of g-C3N4. Moreover, the obtained results of z-scan experiments for the appropriate NPs show the low threshold saturable intensity for the colloidal solution of these particles, which confirms its potential implementation in the optical devices.
2. Experimental
2.1. Materials
Calcium nitrate Ca(NO3)2·4H2O, melamine (C3H6N6), sodium dihydrogen phosphate (NaH2PO4), and bisphenol A (C15H16O2) were purchased from Merck Company. Tri-ethyl phosphate (TEP; (C2H5)3PO4) was also purchased from FLUKA. All materials were used without further purification.2.2. Synthesis of photocatalyst
![[thin space (1/6-em)]](https://www.rsc.org/images/entities/char_2009.gif) :
:![[thin space (1/6-em)]](https://www.rsc.org/images/entities/char_2009.gif) 20, 70
20, 70![[thin space (1/6-em)]](https://www.rsc.org/images/entities/char_2009.gif) :
:![[thin space (1/6-em)]](https://www.rsc.org/images/entities/char_2009.gif) 30, 60
30, 60![[thin space (1/6-em)]](https://www.rsc.org/images/entities/char_2009.gif) :
:![[thin space (1/6-em)]](https://www.rsc.org/images/entities/char_2009.gif) 40, and 50
40, and 50![[thin space (1/6-em)]](https://www.rsc.org/images/entities/char_2009.gif) :
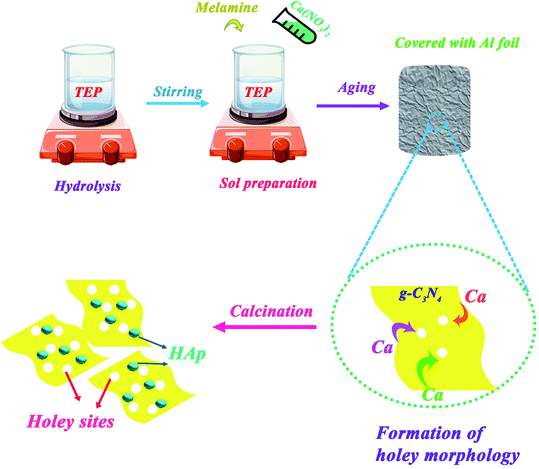
:![[thin space (1/6-em)]](https://www.rsc.org/images/entities/char_2009.gif) 50 ratios were synthesized via a facile sol–gel method as described below: first, the mixture sol of solutions A and B was prepared similar to the above-mentioned synthesis procedure of HAp. Then, after adding an aqueous solution of TEP, appropriate amounts of melamine for every mentioned ratio of HAp to g-C3N4 were added to the sol suspension and continuously stirred for 1 h. The obtained sols were aged, dried, and calcined at 600 °C for 2 h in a closed crucible. Resultant powder samples were washed with distilled water and absolute ethanol several times. More details are depicted in Scheme 2. The exhaust of nitrogen gas because of HAp calcination led to the exfoliation of g-C3N4 nanosheet from its bulk form.
50 ratios were synthesized via a facile sol–gel method as described below: first, the mixture sol of solutions A and B was prepared similar to the above-mentioned synthesis procedure of HAp. Then, after adding an aqueous solution of TEP, appropriate amounts of melamine for every mentioned ratio of HAp to g-C3N4 were added to the sol suspension and continuously stirred for 1 h. The obtained sols were aged, dried, and calcined at 600 °C for 2 h in a closed crucible. Resultant powder samples were washed with distilled water and absolute ethanol several times. More details are depicted in Scheme 2. The exhaust of nitrogen gas because of HAp calcination led to the exfoliation of g-C3N4 nanosheet from its bulk form.
2.3. Characterization of photocatalyst
Crystalline structures of samples were determined by X-ray diffraction (XRD) (Explorer GNR Italia at 40 kV and 30 mA with CuKα radiation (λ = 1.5418 Å)). Samples were also evaluated by Fourier transmittance infrared (FT-IR) spectroscopy using Shimadzu FT-IR 8400S spectrometer (KBr) in the range of 500–4000 cm−1. Morphology and shape of photocatalysts were observed using field emission scanning electron microscopy (FE-SEM) by (SEM; LEO-Germany). The elemental composition of photocatalysts was also investigated by energy X-ray dispersive spectroscopy (EDS) attached to the SEM apparatus. Morphology of the nanocomposite was detected by transmittance electron microscopy (TEM-FM 208S-USA). X-ray photoelectron spectroscopy (XPS) was applied for g-C3N4 and HAp/g-C3N4 by an AvaSpec-ULS-TEC (Poland) system. The specific surface area of all compounds was measured by an appropriate instrument (BET, Quantachrome Instruments, USA) based on Brunauer–Emmett–Teller (BET) method. Photoluminescence (PL-AVATAR-USA) was applied for the determination of the hole–electron pairs photogenerated on the photocatalyst surface. Mott–Schottky (M–S) measurement was done via a routine three-electrode system (counter: Pt; reference: standard calomel in saturated KCl; working: glassy carbon) controlled with a computer of potentiostat/galvanostat (METROHM AUTOLAB 201). The performance of photoelectron chemical cell of all samples (HAp, g-C3N4, and HAp/g-C3N4) was executed in a quartz cell filled with 0.5 M Na2SO4 electrolyte at a potential ranging from −0.1 to 1.5 V with Ag/AgCl as reference electrode under 1000 Hz frequency.2.4. Photocatalytic evaluation
Photocatalytic activity of nanocomposites was evaluated by photodegradation of BPA (10 ppm, 10 ml) in an aqueous solution. First, the photocatalyst and pollutant were inserted in the dark to reach adsorption–desorption equilibration for 90 min. The photocatalytic activity was evaluated by subjecting the suspension to an LED lamp (IP 65, 200 W) as the light source. After specific interval times, the sample was centrifuged, and the concentration of BPA by UV-visible spectroscopy (EU-2200) at a characterized wavelength (665 nm) was measured. To gain high photocatalytic efficiency, the related parameters were optimized for the photocatalytic process. These parameters include photocatalyst amount, pH, and BPA concentration. For a comparative evaluation of the photocatalytic activity of the nanocomposite, the photocatalytic process was also conducted for single phases of HAp and g-C3N4.2.5. Optical procedure
In z-scan experiment, a laser beam is focused using a lens, and the sample scans the focused beam. As the sample approaches the focal point, the beam intensity increases, and the optical indices change. The change in the refractive index shows itself in diverging (for samples with nonlinear refractive index n < 20) or converging (n > 20) of the beam. It changes the power of the passing beam through a close circular aperture. The obtained data of the passing power versus the sample position (z) is called the close-aperture z-scan curve. If the aperture is removed and the total transmitted power is measured, the effect of absorption only can be detected in the detector, and the resultant curve is named open-aperture z-scan curve.3. Results and discussion
3.1. Nanocomposite (HAp/g-C3N4) characterization
XRD patterns indicated the crystallinity and phase of HAp/g-C3N4(50![[thin space (1/6-em)]](https://www.rsc.org/images/entities/char_2009.gif) :
:![[thin space (1/6-em)]](https://www.rsc.org/images/entities/char_2009.gif) 50), HAp, and g-C3N4 (Fig. 1a). Diffraction peaks of g-C3N4 sample are attributed to pure g-C3N4 phase (JCPDS card no. 87-1526) with a strong characteristic peak at 2θ = 27.4° having hexagonal unit cell. Moreover, all recorded diffracted peaks of HAp at 2θ = 26° (002), 32° (112), 34° (202), 37° (310), 47° (222) well indexed to its hexagonal structural unit cell (JCPDS card no. 9-0432). However, the diffraction pattern of the HAp/g-C3N4 nanocomposite shows a mixture of all peaks of single phases but with some shift to lower degrees and losing the crystallinity toward an amorphous composite, but can be assigned to two individual contents (HAp and g-C3N4) without the formation of any secondary phase. The diffraction peak of {002} hkl plane of g-C3N4 in the nanocomposite has shifted to a higher degree along with the decreased intensity due to the formation of holes in g-C3N4 nanosheets.23
50), HAp, and g-C3N4 (Fig. 1a). Diffraction peaks of g-C3N4 sample are attributed to pure g-C3N4 phase (JCPDS card no. 87-1526) with a strong characteristic peak at 2θ = 27.4° having hexagonal unit cell. Moreover, all recorded diffracted peaks of HAp at 2θ = 26° (002), 32° (112), 34° (202), 37° (310), 47° (222) well indexed to its hexagonal structural unit cell (JCPDS card no. 9-0432). However, the diffraction pattern of the HAp/g-C3N4 nanocomposite shows a mixture of all peaks of single phases but with some shift to lower degrees and losing the crystallinity toward an amorphous composite, but can be assigned to two individual contents (HAp and g-C3N4) without the formation of any secondary phase. The diffraction peak of {002} hkl plane of g-C3N4 in the nanocomposite has shifted to a higher degree along with the decreased intensity due to the formation of holes in g-C3N4 nanosheets.23
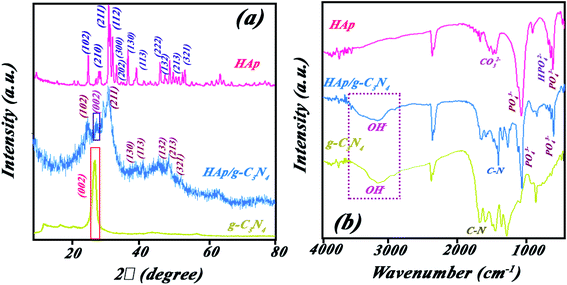 | ||
| Fig. 1 (a) XRD patterns for HAp/g-C3N4, HAp, and g-C3N4 samples and inset figure shows high resolution of nanocomposite pattern and (b) FT-IR spectra for HAp-g-C3N4, HAp, and g-C3N4. | ||
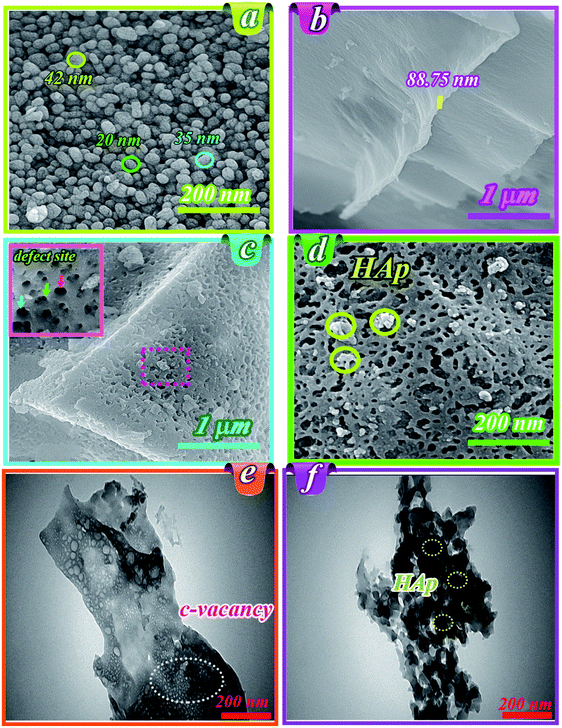
Fig. 1b shows the FT-IR spectra for HAp, g-C3N4, and HAp/g-C3N4 nanocomposite. The characteristic peaks of PO43− group of HAp in wavenumbers of 567, 1041, and 1097 cm−1 can be assigned to the bending and stretching modes (asymmetric and symmetric) of the P–O bond, respectively (see Fig. 1b).38,39 For g-C3N4, several peaks at 812, 1241, and 1641 cm−1 were observed, which can be attributed to the successful synthesis of g-C3N4. In the case of HAp/g-C3N4 nanocomposite, the main characteristic bands of both compounds, HAp and g-C3N4, can be observed (refer to Fig. 1b). HAp/g-C3N4 and single phase of g-C3N4 sheet show peak at 3300 cm−1 and the broader peak for the single phase g-C3N4 can be related to more nitrogen bonding due to enhanced N content. Morphology and shapes of as-prepared samples were evaluated by FE-SEM, which are shown in Fig. 2a–c. This new observed nano-morphology should be compared with the recently reported one. Xu et al. have reported a stable structure of g-C3N4/HAp with an inverse micro-morphology, in which the microsphere of HAp was decorated by particles of g-C3N4 with a considerable agglomeration of HAp spheres, reducing the specific surface area. Fig. 2a depicted the morphology of HAp, showing spherical nanoparticles ranging in size between 15–50 nm with almost homogenous size distribution. Fig. 2b also indicated the layered structures of g-C3N4, including the assembled sheets with nanosize thickness (for example: 88.75 nm). Morphology of the nanocomposite HAp/g-C3N4 (50![[thin space (1/6-em)]](https://www.rsc.org/images/entities/char_2009.gif) :
:![[thin space (1/6-em)]](https://www.rsc.org/images/entities/char_2009.gif) 50) shows the distributed holey structures on g-C3N4 nanosheets in the presence of HAp nanospheres (see Fig. 2c). The inset figure in Fig. 2c indicates defect sites, which originated from C-vacancies on nanosheets. Various holes with different sizes were formed on nanosheet surfaces (see Fig. 2d). White accumulated nanospheres coated on nanosheets correspond to HAp. TEM images of holey nanosheets are indicated in Fig. 2e, which clearly shows the in-plane hole sites by small white points. Indeed, these white points could be assigned to the C-vacancies in g-C3N4 nanosheets. Fig. 2f depicts the TEM image for the nanocomposite consisting of holey structures of g-C3N4 nanosheets and distributed HAp nanospheres on its surface. EPR curve confirmed the presence of simultaneous C and O vacancies in the HAp/g-C3N4 nanocomposite (Fig. 1S, ESI file†).
50) shows the distributed holey structures on g-C3N4 nanosheets in the presence of HAp nanospheres (see Fig. 2c). The inset figure in Fig. 2c indicates defect sites, which originated from C-vacancies on nanosheets. Various holes with different sizes were formed on nanosheet surfaces (see Fig. 2d). White accumulated nanospheres coated on nanosheets correspond to HAp. TEM images of holey nanosheets are indicated in Fig. 2e, which clearly shows the in-plane hole sites by small white points. Indeed, these white points could be assigned to the C-vacancies in g-C3N4 nanosheets. Fig. 2f depicts the TEM image for the nanocomposite consisting of holey structures of g-C3N4 nanosheets and distributed HAp nanospheres on its surface. EPR curve confirmed the presence of simultaneous C and O vacancies in the HAp/g-C3N4 nanocomposite (Fig. 1S, ESI file†).
The elemental composition of the nanocomposite is indicated in Fig. 3a by EDS spectra. The peaks observed in the EDS spectra were attributed to Ca, P, N, C, and O. Approximate percentage of elements in the nanocomposite was also evaluated by mapping studies (see Fig. 3b–g). Results of mapping analysis confirmed the successful synthesis method for HAp/g-C3N4. Based on BET analysis, it can be highlighted that a permanent spread specific surface area of HAp/g-C3N4 nanocomposite (205 m2 g−1) and holey morphological structured g-C3N4 nano-sheets (86 m2 g−1) in comparison with HAp nanospheres (24.5 m2 g−1) were determined (see Fig. 4). To investigate the pore structure, pore size distributions of samples were obtained from the BJH method, and the curves are shown in Fig. 4b. The results confirmed the presence of massive nanosized pores on g-C3N4 sheets in the presence of Ca2+ ions in comparison with HAp and g-C3N4 nanosheets.
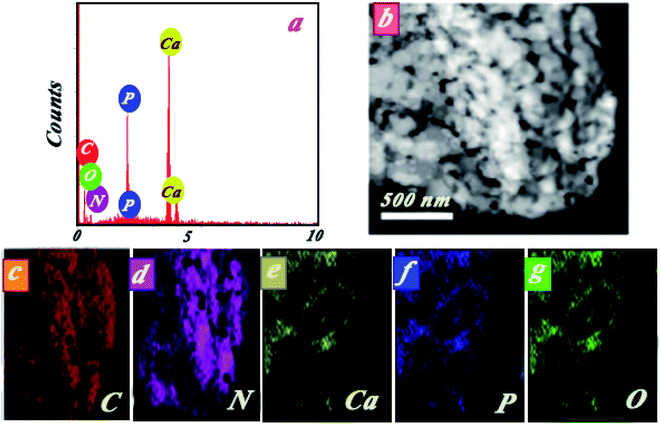 | ||
| Fig. 3 (a) Initial EDS spectra, (b) selected area for elemental mapping analysis of HAp/g-C3N4, (c–g) C, N, Ca, P, and O, respectively. | ||
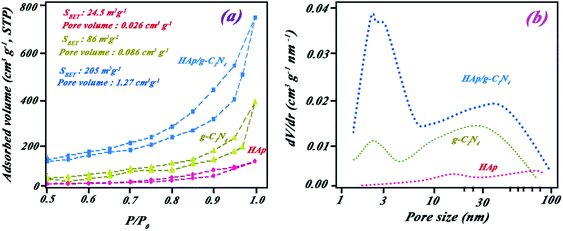 | ||
| Fig. 4 (a) N2 adsorption–desorption isotherms for g-C3N4 (▲), HAp (●), and HAp/g-C3N4 nanocomposite (■) and (b) corresponding BJH pore-size distribution curves. | ||
Except for graphitic carbon nitride, the obtained BET data, especially for the nanocomposite, are remarkably higher than reported by Xu et al.10 For this reason, the fabricated nano-morphology of the composite resulted in enhanced active light harvesting sites favoring a rise in photocatalytic efficiency toward BPA remediation. The holey structure of nanocomposite flattened the active surface area more due to the appearance of numerous holes and edges in the nanosheet planes. Resultant morphology led to the production of a higher pore volume in the nanocomposite in comparison with HAp and g-C3N4 nanosheets. Enhanced surface area and pore volume could affect the catalytic activity.
XPS spectra for HAp/g-C3N4 compound are shown in Fig. 5. The survey spectra is demonstrated in Fig. 5a, which shows related peaks of O 1s, P 2p, Ca 2p, N 1s, and C 1s for the composite. Orbitals of C 1s in Fig. 5b are located in four positions at binding energies corresponding to N–C![[double bond, length as m-dash]](https://www.rsc.org/images/entities/char_e001.gif) N (289.7 eV), C
N (289.7 eV), C![[double bond, length as m-dash]](https://www.rsc.org/images/entities/char_e001.gif) O (288.4 eV), C–N (287.6 eV), and C–C (284.6 eV). Two peaks of Ca 2p orbitals appeared at 347.2 and 350.8 eV for Ca 2p3/2 and Ca 2p1/2 orbitals, respectively (Fig. 5c). Orbital 2p for the P element was observed at 132.7 eV (see Fig. 5d). Binding energies for C–O and C
O (288.4 eV), C–N (287.6 eV), and C–C (284.6 eV). Two peaks of Ca 2p orbitals appeared at 347.2 and 350.8 eV for Ca 2p3/2 and Ca 2p1/2 orbitals, respectively (Fig. 5c). Orbital 2p for the P element was observed at 132.7 eV (see Fig. 5d). Binding energies for C–O and C![[double bond, length as m-dash]](https://www.rsc.org/images/entities/char_e001.gif) O bonds are located at 530.9 and 532.6 eV, respectively (see Fig. 5e). Various bonds between N and C elements are shown in Fig. 5f at binding energies of C–N (398.3 eV), C–N–C (398.7 eV), and N(C)3 (400.7 eV).
O bonds are located at 530.9 and 532.6 eV, respectively (see Fig. 5e). Various bonds between N and C elements are shown in Fig. 5f at binding energies of C–N (398.3 eV), C–N–C (398.7 eV), and N(C)3 (400.7 eV).
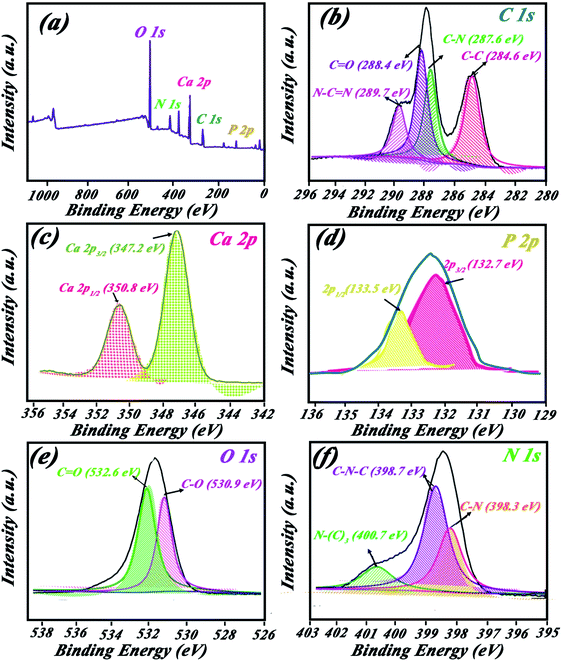 | ||
| Fig. 5 XPS spectrum (a) survive peaks, (b) C 1s, (c) Ca 2p, (d) P 2p, (e) O 1s, and (f) N 1s orbitals. | ||
As shown in Fig. 6a, XPS survey spectra of both g-C3N4 and HAp/g-C3N4 contain three peaks at 288, 399, and 532 eV, which can be assigned to C 1s, N 1s, and O 1s signals, respectively. It may be noted that the O 1s weak signal for g-C3N4 sample may be originating from adsorbed H2O on its surface.40 The molar ratio of C/N elements for HAp/g-C3N4 is much smaller than g-C3N4, which suggested the presence of C-vacancies in HAp/g-C3N4. C-vacancies could be related to the reaction of Ca ions with carbonic compounds, forming holey structures.41 The N 1s spectra are almost the same for both g-C3N4 and HAp/g-C3N4 (Fig. 6b), indicating that Ca2+ ions has little effect on g-C3N4 aromatic systems. But the increasing N 1s peak intensity for HAp/g-C3N4 sample is considered, which can be assigned to N atoms in the vicinity of C-vacancies and obtaining fewer electrons than the others. C 1s spectra for both samples are different due to the presence of HAp component in the HAp/g-C3N4 sample. The intensity of C–N in 288.6 eV is higher for the HAp/g-C3N4 sample compared to g-C3N4 sample, which can be attributed to the electron transfer between C-vacancies and N elements. These C-vacancies can enhance the electrical conductivity of the sample and increase the mobility of photoinduced hole–electrons.
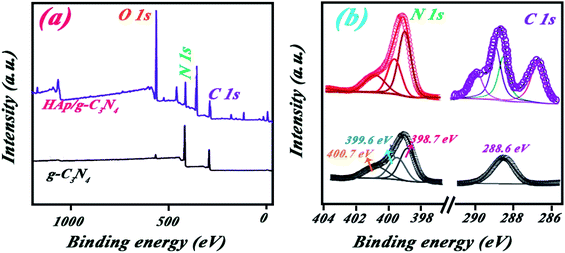 | ||
| Fig. 6 (a) XPS survey spectra and (b) high resolution C 1s and N 1s peaks for g-C3N4 and HAp/g-C3N4. | ||
3.2. UV-visible spectra
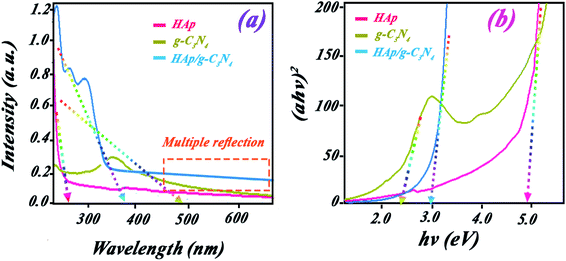
UV-visible studies were done for evaluating the photocatalytic activity of HAp, g-C3N4, and HAp/g-C3N4 nanocomposite. The spectra of HAp nanospheres, nanosheets of g-C3N4, and HAp/g-C3N4 nanocomposite are indicated in Fig. 7a. The HAp nanospheres exhibit a peak in the UV region (<400 nm) with an adsorption edge at 286 nm. For the g-C3N4 nanosheets, a broad peak extended from UV to visible region with an adsorption edge at 435 nm. There is a sharp peak for HAp/g-C3N4 with an adsorption edge (390 nm) between the two adsorptions of HAp and g-C3N4 alone. For the HAp/g-C3N4 composite, a broader tail extended from 540 nm to the near IR region, which can be attributed to the multiple reflections of light in the existing holes. These results were confirmed by the determination of band gaps of the nanocomposite, Hap, and g-C3N4 by Tauc plot, as shown in Fig. 7b. The calculated band gaps of HAp and g-C3N4 are 3.57 and 2.48 eV, respectively. HAp/g-C3N4 composite has a band gap (2.88 eV) between 3.57 and 2.48 eV. Results suggested that g-C3N4 and nanocomposite are active in the visible light region while HAp does not exhibit any activation in visible light irradiation. Contrary to expectations, the holey structure of HAp/g-C3N4 shows a higher band gap compared to g-C3N4, which can be related to the influence of quantum confinement in the introduced holey structures.23As we know, the most common method to find the band gap from the absorption spectrum is the Tauc method. However, as we used in Fig. 7b, the scattering effect prevents finding a single oblique asymptote.
M–S plots of contents of HAp and g-C3N4 and related nanocomposite HAp/g-C3N4 were established at 1 kHz. It can be noted that all M–S plots have positive slopes, signifying the symbolic n-type character of the semiconductor. The known eqn (1) for the determination of the type of semiconductor and pertinent flat band potential (Vfb) is applied.42
 | (1) |
| ENHE = EAg/AgCl + E0Ag/AgCl | (2) |
| Eg = ECB + EVB | (3) |
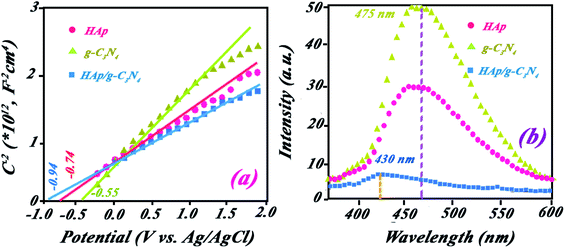 | ||
| Fig. 8 (a) Mott–Schottky plots for HAp, g-C3N4, and HAp/g-C3N4 in a 0.5 M Na2SO4 aqueous solution. (b) PL spectra for HAp, g-C3N4, and HAp/g-C3N4 recorded in the excitation wavelength. | ||
The position of VB for HAp and g-C3N4 are 2.97 and 2.02 V (vs. NHE).
Moreover, ND can be determined by eqn (4):
 | (4) |
The obtained value of ND for HAp/g-C3N4 composite is 3.3 × 10¹⁹, which is higher in comparison with the related values of HAp and g-C3N4, which are 2.6 ×10¹⁹ and 2.36 ×10¹⁹, showing the shortest and faster charge transport routes for this junction semiconductor with further photocatalytic efficiency. The slope in eqn (4) corresponds to the slope of the M–S plot.
To show the fate of photogenerated hole–electrons in the photocatalytic process, PL spectra were recorded at a suitable excitation wavelength. The sharp peaks of PL with high intensity can be appropriated to the high emission for excited electrons (photogenerated electrons) from conductive band to valence band. Indeed, the low emission of PL spectra indicated the low comeback rate of photoelectrons to the valence band and combination with photogenerated holes. As expected, g-C3N4 exhibited high PL intensity while HAp and HAp/g-C3N4 have lower intensities (see Fig. 8b). It can be concluded that HAp/g-C3N4 indicated a low recombination rate in comparison with the singular phases of HAp and g-C3N4. The low recombination rate confirms the high separation of photogenerated holes and electrons, which led to higher photocatalytic efficiency for BPA degradation. Compared to g-C3N4, HAp/g-C3N4 exhibits a blue shift to lower wavelength emission, which could be assigned to the reported band gaps for these compounds.
3.3. Photocatalytic evolution of HAp/g-C3N4 nanocomposite
The photocatalytic activity of the nanocomposite was investigated by photocatalytic degradation of BPA under various conditions. Effective parameters such as photocatalyst amount, solution pH, and concentration of BPA were evaluated to obtain the optimal conditions for high photocatalytic efficiency. Furthermore, the photostability and reusability capability of the nanocomposite were also studied for scale-up aims.![[thin space (1/6-em)]](https://www.rsc.org/images/entities/char_2009.gif) :
:![[thin space (1/6-em)]](https://www.rsc.org/images/entities/char_2009.gif) 20, 70
20, 70![[thin space (1/6-em)]](https://www.rsc.org/images/entities/char_2009.gif) :
:![[thin space (1/6-em)]](https://www.rsc.org/images/entities/char_2009.gif) 30, 60
30, 60![[thin space (1/6-em)]](https://www.rsc.org/images/entities/char_2009.gif) :
:![[thin space (1/6-em)]](https://www.rsc.org/images/entities/char_2009.gif) 40, 50
40, 50![[thin space (1/6-em)]](https://www.rsc.org/images/entities/char_2009.gif) :
:![[thin space (1/6-em)]](https://www.rsc.org/images/entities/char_2009.gif) 50, 40
50, 40![[thin space (1/6-em)]](https://www.rsc.org/images/entities/char_2009.gif) :
:![[thin space (1/6-em)]](https://www.rsc.org/images/entities/char_2009.gif) 60, 30
60, 30![[thin space (1/6-em)]](https://www.rsc.org/images/entities/char_2009.gif) :
:![[thin space (1/6-em)]](https://www.rsc.org/images/entities/char_2009.gif) 70, and 20
70, and 20![[thin space (1/6-em)]](https://www.rsc.org/images/entities/char_2009.gif) :
:![[thin space (1/6-em)]](https://www.rsc.org/images/entities/char_2009.gif) 80 HAp/g-C3H4 ratios are depicted in Fig. 3S (ESI file†). With increasing g-C3N4 component, the color of the prepared nanocomposite in powder form changed from yellowish to dark brown. The ratio of 50
80 HAp/g-C3H4 ratios are depicted in Fig. 3S (ESI file†). With increasing g-C3N4 component, the color of the prepared nanocomposite in powder form changed from yellowish to dark brown. The ratio of 50![[thin space (1/6-em)]](https://www.rsc.org/images/entities/char_2009.gif) :
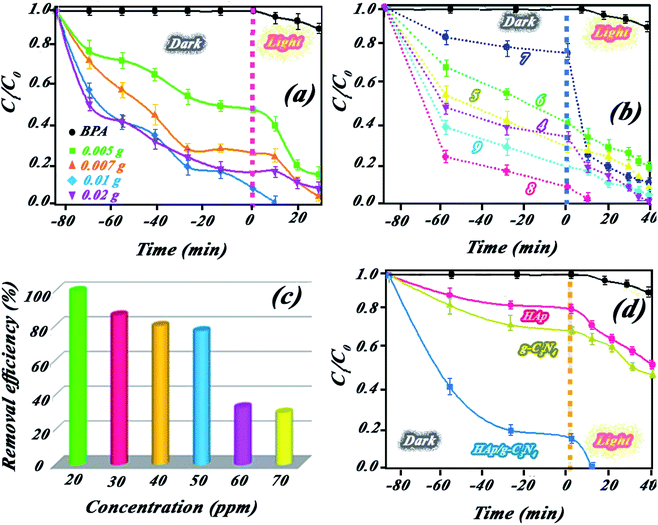
:![[thin space (1/6-em)]](https://www.rsc.org/images/entities/char_2009.gif) 50 for the nanocomposite indicated higher catalytic BPA photodegradation compared to the other ratios (cf. Fig. 9a). This behavior has been attributed to the effect of HAp concentration to create a holey structure on g-C3N4 nanosheets, which play a key role in photocatalytic performance. It is probable that the presence of HAp in different proportions had a significant effect on the size of the created holes on the g-C3N4 nanosheets.
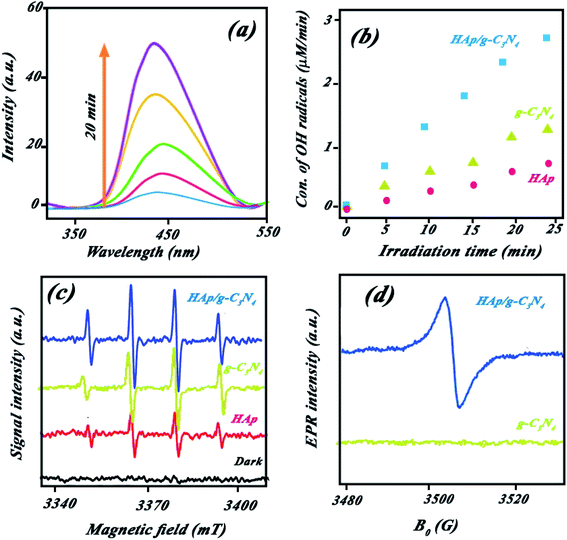
50 for the nanocomposite indicated higher catalytic BPA photodegradation compared to the other ratios (cf. Fig. 9a). This behavior has been attributed to the effect of HAp concentration to create a holey structure on g-C3N4 nanosheets, which play a key role in photocatalytic performance. It is probable that the presence of HAp in different proportions had a significant effect on the size of the created holes on the g-C3N4 nanosheets.The photocatalytic performance of the nanocomposite was investigated for other pollutants, such as dyes (MB or RhB) and pharmaceutical (diclofenac) pollutants. Indicated results in Fig. 4Sc (ESI file†) suggested the high performance of the nanocomposite for other pollutants. XPS survey of nanocomposite before and after use illustrated in Fig. 4Sd (ESI file†) confirmed high stability of the nanocomposite in successive runs. Scavenging studies in Fig. 3Sa† indicated that hydroxyl radicals are mainly responsible for the photocatalytic degradation of pollutants. Produced hydroxyl radicals were measured by luminescence emission of 2-hydroxyterephthalic acid complex obtained from the reaction of OH˙ radicals with terephthalic acid (as probe). As shown in Fig. 10a, HAp/g-C3N4 produces more OH˙ radicals due to enhanced PL emission through 20 min illumination. For comparison study, OH˙ radicals from HAp, g-C3N4, and HAp/g-C3N4 were measured and plotted in Fig. 10b. It can be seen that HAp/g-C3N4 illustrated a higher amount of OH˙ radical in comparison with HAp and g-C3N4.25,26 ESR analysis also confirmed the production of more OH˙ radicals by HAp/g-C3N4. Other works have also shown that the g-C3N4 nanocomposite produced more oxygen radicals under light irradiation in comparison to single g-C3N4.53 Generally, it can be highlighted that carbon-based materials, such as g-C3N4 or carbon nanotubes could influence the production of more active radicals due to spatial separation of photogenerated charges.54,55
Electron paramagnetic resonance (EPR) analysis at room temperature indicated that the holey structure bears heavily delocalized electrons, which led to a high separation of photoinduced charge pairs. Fig. 10d shows that HAp/g-C3N4 exhibited one single Lorentzian line with a g value of 2.004 in the specific range of magnetic field due to lone electrons on the carbon atoms of heptazine rings. Higher intensity EPR for HAp/g-C3N4 suggested that a higher number of unpaired electrons improves the production of active radicals. These C-vacancies could act as active sites for the adsorption of photogenerated electrons, oxygen gas, and pollutant molecules.
3.4. Optical characterization
As discussed in Section 3.2 and depicted in Fig. 7, the plotted absorption spectrum of HAp/g-C3N4 shows no absorption peak, with a descending curve and its band gap energy can be measured by the Tauc equation.35 In the z-scan experiments, a colloidal dispersion of the particles in water was prepared and was poured in a 1 mm quartz cell. A He–Ne laser beam with 5 mW output power (λ = 632.8 nm) was focused with the radius of the beam waist of 45 microns.This refractive index of the sample would be
| n = n0 + Δn = n0 + n2I | (5) |
The electric field of the passing laser beam at the exit plane of the sample could be written as:56
 | (6) |
 | (7) |
 | (8) |
 | (9) |
This quantity is highly dependent on n2 and this value can be precisely determined by fitting the experimental curve of the close aperture curve to the theoretical one. Close aperture experiments have been performed, and results are plotted in Fig. 11a. As shown, the peak-valley configuration indicates that the self-defocusing effect (n < 20) is the main nonlinear refractive phenomenon. Using the numerical curve fitting by the mentioned equations, the value of the nonlinear refractive index is obtained as n2 = −1.8 × 10⁻⁷ cm2 W−1. In low laser radiations, this phenomenon is mainly due to the thermal lensing effect.56,57 The fitted normalized curve to the average of measurement for the solution has been plotted in Fig. 11b. By opening the aperture, the open aperture curve is obtained that gives nonlinear absorption coefficient β by numerical curve fitting. Theoretical and numerical methods have been discussed in detailes by Alikhani et al.56 The value of nonlinear absorption coefficients has been obtained β = −7.3 × 10⁻³ cm W−1 by numerical curve fitting and theoretical relations. The peak configuration of the open aperture curve indicates that the main nonlinear optical phenomenon is the saturation in absorption.34 As we know, when the light is absorbed by an ensemble of atoms (molecules), the light will force the atoms (molecules) to undergo the transition 2 → 1. Increasing the intensity of the light enhances the population of level 2 until the population inversion occurs. An active material undergoes this population inversion. The threshold beam intensity that can provide the population inversion is called the saturation intensity.58 In z-scan experiments, the values of saturation intensity can be obtained by the equation:34
| Is = −α0/β. | (10) |
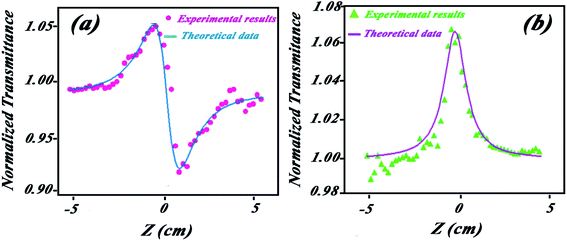 | ||
| Fig. 11 (a) Theoretical fitted curve (reference) and experimental data of (a) close and (b) open aperture z-scan. | ||
The saturation intensity of the synthesized HAP/g-C3N4 NPs is obtained as Is = 96 cm2 W−1 which is lower than the saturation intensity of alumina and ZnO NPs,34 indicating that these NPs can be suitable for light amplifier devices.
4. Conclusion
In conclusion, for the first time, holey g-C3N4 nanosheets with numerous carbon vacancies decorated by HAp nanospheres were synthesized through in situ sol–gel approach. The presence of Ca2+ ions in the initial precursors led to the formation of in-plane hole sites on the g-C3N4 nanosheets. On the other hand, the existence of nitrogen gas during the calcination process of HAp created a desirable platform for the exfoliation of nanosheets from the bulk form. The as-prepared holey structure HAp/g-C3N4 delivers high photocatalytic performance for BPA, a resistant pollutant. Synthesized HAp/g-C3N4 shows a high surface area of about 205 m2 g−1 and a highly porous structure compared to the non-holey g-C3N4 nanosheets. This work not only proposes an intelligent approach for the holey structure of g-C3N4 but also provides a strategy for the synthesis of heterojunctions between two effective components of HAp and g-C3N4 nanosheets. Excellent photocatalytic performance is attributed to a variety of material features, such as high surface area, heterojunction between two components, shortening path length, and enhancing the lifetime of charge carriers. Holey structure of nanosheets plays several effective roles: trapping and multiscattering of light, adsorption of photogenerated electrons, adsorption of more pollutant molecules. This newly reported photocatalyst has a high capability for large-scale photocatalytic processes due to its eco-friendly characteristics and biodegradability. Moreover, the measured saturation intensity of this nanocomposite via z-scan experiments showed a lower value in comparison with well-known NPs of ZnO and alumina, enabling this new HAp/g-C3N4 nanocomposite as a suitable candidate for use in light amplifier devices.Conflicts of interest
The authors declare that there is no conflict of interest.Acknowledgements
MCH is highly grateful to Hakim Sabzevari University, Sabzevar, Iran for financial support.References
- D. Fine, A. Grattoni, R. Goodall, S. S. Bansal, C. Chiappini, S. Hosali, A. L. van de Ven, S. Srinivasan, X. Liu, B. Godin, L. Brousseau, I. K. Yazdi, J. Fernandez-Moure, E. Tasciotti, H. J. Wu, Y. Hu, S. Klemm and M. Ferrari, Adv. Healthcare Mater., 2013, 2, 632–666 CrossRef CAS PubMed.
- K. Kang, Y. Cho and K. J. Yu, Micromachines, 2018, 9(6), 263–285 CrossRef PubMed.
- A. Bashar Bhuiyan, M. B. Mokhtar, M. E. Toriman, M. B. Gasim, G. C. Ta, R. Elfithri and M. R. Razman, Am.-Eurasian J. Sustain. Agric., 2013, 7, 126–136 Search PubMed.
- F. N. Chaudhry and M. F. Malik, J. Ecosyst. Ecography, 2017, 07, 111–118 Search PubMed.
- A. K. Dwivedi, International Research Journal of Mathematics, Engineering and IT, 2017, 4, 34–42 Search PubMed.
- M. Hu, Y. Liu, Z. Yao, L. Ma and X. Wang, Front. Environ. Sci. Eng., 2018, 12, 18 CrossRef.
- F. Opoku, K. K. Govender, C. G. C. E. van Sittert and P. P. Govender, Adv. Sustainable Syst., 2017, 1, 1700006 CrossRef.
- M. E. Simonsen, Chemistry of Advanced Environmental Purification Processes of Water: Fundamentals and Applications, 2014, 135–170 CrossRef CAS.
- M. Chahkandi and M. Zargazi, J. Hazard. Mater., 2020, 389, 121850 CrossRef CAS PubMed.
- T. Xu, R. Zuo, X. Lei, X. Qi, Q. Wu, W. Yao and Q. Xu, Appl. Catal., B, 2019, 245, 662–671 CrossRef CAS.
- M. Chahkandi and M. Zargazi, J. Hazard. Mater., 2019, 380, 120879 CrossRef CAS PubMed.
- M. Zargazi and M. H. Entezari, Ultrason. Sonochem., 2020, 62, 104867 CrossRef CAS PubMed.
- M. Zargazi and M. H. Entezari, Ultrason. Sonochem., 2020, 67, 105145 CrossRef CAS PubMed.
- L. Jiang, X. Yuan, G. Zeng, Z. Wu, J. Liang, X. Chen, L. Leng, H. Wang and H. Wang, Appl. Catal., B, 2018, 221, 715–725 CrossRef CAS.
- L. Jia, X. Cheng, X. Wang, H. Cai, P. He, J. Ma, L. Li, Y. Ding and X. Fan, Ind. Eng. Chem. Res., 2020, 59, 1065–1072 CrossRef CAS.
- Z. Jin, Q. Zhang, S. Yuan and T. Ohno, RSC Adv., 2015, 5, 4026–4029 RSC.
- M. Salimi, A. Esrafili, H. R. Sobhi, M. Behbahani, M. Gholami, M. Farzadkia, A. J. Jafari and R. R. Kalantary, ChemistrySelect, 2019, 4, 10288–10295 CrossRef CAS.
- X. Li, J. Xiong, J. Huang, Z. Feng and J. Luo, J. Alloys Compd., 2019, 774, 768–778 CrossRef CAS.
- R. Shen, J. Xie, H. Zhang, A. Zhang, X. Chen and X. Li, ACS Sustainable Chem. Eng., 2018, 6, 816–826 CrossRef CAS.
- X. Bai, L. Wang, R. Zong and Y. Zhu, J. Phys. Chem. C, 2013, 117, 9952–9961 CrossRef CAS.
- L. R. Zou, G. F. Huang, D. F. Li, J. H. Liu, A. L. Pan and W. Q. Huang, RSC Adv., 2016, 6, 86688–86694 RSC.
- X. Wu, H. Ma, W. Zhong, J. Fan and H. Yu, Porous crystalline g-C3N4: Bifunctional NaHCO3 template-mediated synthesis and improved photocatalytic H2-evolution rate, Elsevier B.V., 2020, vol. 271 Search PubMed.
- Q. Liang, Z. Li, Z. H. Huang, F. Kang and Q. H. Yang, Adv. Funct. Mater., 2015, 25, 6885–6892 CrossRef CAS.
- Y. Cao, Z. Xing, Z. Li, X. Wu, M. Hu, X. Yan, Q. Zhu, S. Yang and W. Zhou, J. Hazard. Mater., 2018, 343, 181–190 CrossRef CAS PubMed.
- F. Yang, H. Li, K. Pan, S. Wang, H. Sun, Y. Xie, Y. Xu, J. Wu and W. Zhou, Sol. RRL, 2021, 5, 2000610 CrossRef CAS.
- T. Zhao, Z. Xing, Z. Xiu, Z. Li, S. Yang and W. Zhou, ACS Appl. Mater. Interfaces, 2019, 11, 7104–7111 CrossRef CAS PubMed.
- S. Cao, B. Fan, Y. Feng, H. Chen, F. Jiang and X. Wang, Chem. Eng. J., 2018, 353, 147–156 CrossRef CAS.
- S. Tan, Z. Xing, J. Zhang, Z. Li, X. Wu, J. Cui, J. Kuang, Q. Zhu and W. Zhou, J. Catal., 2018, 357, 90–99 CrossRef.
- V. S. Bystrov, C. Piccirillo, D. M. Tobaldi, P. M. L. Castro, J. Coutinho, S. Kopyl and R. C. Pullar, Appl. Catal., B, 2016, 196, 100–107 CrossRef CAS.
- M. Sheik-Bahae, A. A. Said, T. H. Wei, D. J. Hagan and E. W. Van Stryland, IEEE J. Quantum Electron., 1990, 26, 760–769 CrossRef CAS.
- X. Miao, D. Qu, D. Yang, B. Nie, Y. Zhao, H. Fan and Z. Sun, Adv. Mater., 2018, 30, 1–8 Search PubMed.
- T. W. Hamann, A. B. F. Martinson, J. W. Elam, M. J. Pellin and J. T. Hupp, Adv. Mater., 2008, 20, 1560–1564 CrossRef CAS.
- X. Li, W. C. H. Choy, L. Huo, F. Xie, W. E. I. Sha, B. Ding, X. Guo, Y. Li, J. Hou, J. You and Y. Yang, Adv. Mater., 2012, 24, 3046–3052 CrossRef CAS PubMed.
- E. Koushki, M. H. Majles Ara and H. Akherat Doost, Appl. Phys. B: Lasers Opt., 2014, 115, 279–284 CrossRef CAS.
- Q. Yang, F. Yu, W. Sima and M. Zahn, AIP Adv., 2015, 5 DOI:10.1063/1.4931947.
- M. Gich, A. Roig, C. Frontera, E. Molins, J. Sort, M. Popovici, G. Chouteau, D. Martín y Marero and J. Nogús, J. Appl. Phys., 2005, 98 DOI:10.1063/1.1997297.
- Z. L. I. Iqi, R. L. I. Ang, C. H. I. P. Ang, N. I. D. Ong, J. U. N. W. Ang and H. Aohai, Opt. Express, 2019, 27, 8727–8737 CrossRef PubMed.
- C. L. Popa, M. Albu, C. Bartha, A. Costescu, C. Luculescu, R. Trusca and S. Antohe, Rom. Rep. Phys., 2016, 68, 1149–1158 Search PubMed.
- L. Berzina-Cimdina and N. Borodajenko, Infrared Spectrosc.: Mater. Sci., Eng. Technol., 2012 DOI:10.5772/36942.
- H. Liu, D. Chen, Z. Wang, H. Jing and R. Zhang, Appl. Catal., B, 2017, 203, 300–313 CrossRef CAS.
- R. P. Panmand, P. Patil, Y. Sethi, S. R. Kadam, M. V. Kulkarni, S. W. Gosavi, N. R. Munirathnam and B. B. Kale, Nanoscale, 2017, 9, 4801–4809 RSC.
- A. Fattah-alhosseini, Arabian J. Chem., 2016, 9, S1342–S1348 CrossRef CAS.
- A. K. Dubey and K. I. Kakimoto, Mater. Sci. Eng., C, 2016, 63, 211–221 CrossRef CAS.
- Y. Surendranath, D. A. Lutterman, Y. Liu and D. G. Nocera, J. Am. Chem. Soc., 2012, 134, 6326–6336 CrossRef CAS PubMed.
- J. Wang, Y. Yu and L. Zhang, Appl. Catal., B, 2013, 136–137, 112–121 CrossRef CAS.
- W. Liu, L. Qiao, A. Zhu, Y. Liu and J. Pan, Appl. Surf. Sci., 2017, 426, 897–905 CrossRef CAS.
- R. Mohammadi, H. Alamgholiloo, B. Gholipour, S. Rostamnia, S. Khaksar, M. Farajzadeh and M. Shokouhimehr, J. Photochem. Photobiol., A, 2020, 402, 112786 CrossRef CAS.
- V.-H. Nguyen, M. Mousavi, J. B. Ghasemi, Q. Van Le, S. A. Delbari, A. Sabahi Namini, M. Shahedi Asl, M. Shokouhimehr and M. Mohammadi, J. Phys. Chem. C, 2020, 124, 27519–27528 CrossRef CAS.
- V. H. Nguyen, M. Mousavi, J. B. Ghasemi, Q. Van Le, S. A. Delbari, M. Shahedi Asl, M. Shokouhimehr, M. Mohammadi, Y. Azizian-Kalandaragh and A. Sabahi Namini, J. Colloid Interface Sci., 2021, 587, 538–549 CrossRef CAS PubMed.
- V.-H. Nguyen, M. Mousavi, J. B. Ghasemi, Q. Van Le, S. A. Delbari, A. Sabahi Namini, M. Shahedi Asl, M. Shokouhimehr, H. W. Jang and M. Mohammadi, Mater. Sci. Semicond. Process., 2021, 125, 105651 CrossRef CAS.
- V. H. Nguyen, M. Mousavi, J. B. Ghasemi, Q. Van Le, S. A. Delbari, M. Shahedi Asl, M. Mohammadi, M. Shokouhimehr and A. Sabahi Namini, J. Taiwan Inst. Chem. Eng., 2021, 118, 140–151 CrossRef CAS.
- H. D. Pham, M. A. Tekalgne, H. H. Do, V. H. Nguyen, D. V. N. Vo, C. K. Cheng, M. Shokouhimehr, C. C. Nguyen, P. Singh, P. Raizada, S. Y. Kim and Q. Van Le, Mater. Lett., 2021, 288, 129355 CrossRef CAS.
- Q. Zhang, Y. Peng, Y. Lin, S. Wu, X. Yu and C. Yang, Chem. Eng. J., 2021, 405, 126661 CrossRef CAS.
- Y. Lin, C. Yang, S. Wu, X. Li, Y. Chen and W. L. Yang, Adv. Funct. Mater., 2020, 30, 2002918 CrossRef CAS.
- Y. Lin, X. Wu, Y. Han, C. Yang, Y. Ma, C. Du, Q. Teng, H. Liu and Y. Zhong, Appl. Catal., B, 2019, 258, 117969 CrossRef CAS.
- S. Alikhani, H. Tajalli and E. Koushki, Opt. Commun., 2013, 286, 318–321 CrossRef CAS.
- E. Koushki, J. Baedi and A. Tasbandi, J. Electron. Mater., 2019, 48, 1066–1073 CrossRef CAS.
- O. Svelto, Energy Levels, Radiative and Nonradiative Transitions in Molecules and Semiconductors, 2010 Search PubMed.
Footnote |
| † Electronic supplementary information (ESI) available: Includes the isoelectric point of HAp/g-C3N4; photodegradation BPA efficiency for various ratios of HAp and g-C3N4 components; photocatalytic degradation in the presence of trapping agents; re-cycling studies for photocatalytic process; photocatalytic efficiency for other pollutants; and XPS spectra for the nanocomposite before and after the photocatalytic process. See DOI: 10.1039/d1ra05259d |
| This journal is © The Royal Society of Chemistry 2021 |


