
 Open Access Article
 This Open Access Article is licensed under a Creative Commons Attribution-Non Commercial 3.0 Unported Licence
Aptamer-functionalized pH-sensitive liposomes for a selective delivery of echinomycin into cancer cells†
Zainab Lafiab,
Walhan Alshaer *c,
Ma'mon M. Hatmald,
Malek Zihlife,
Dana A. Alqudahc,
Hamdi Nsairatf,
Hanan Azzamg,
Talal Aburjaih,
Yasser Bustanji*i and
Abdalla Awidicjk
*c,
Ma'mon M. Hatmald,
Malek Zihlife,
Dana A. Alqudahc,
Hamdi Nsairatf,
Hanan Azzamg,
Talal Aburjaih,
Yasser Bustanji*i and
Abdalla Awidicjk
aFaculty of Pharmacy, The Middle East University, Amman, Jordan
bDepartment of Clinical Pharmacy, Faculty of Pharmacy, The University of Jordan, Amman 11942, Jordan
cCell Therapy Center, The University of Jordan, Amman 11942, Jordan. E-mail: walhan.alshaer@ju.edu.jo; Tel: +962 65355000 ext. 23960 Tel: +962 790823678
dDepartment of Medical Laboratory Sciences, Faculty of Applied Medical Sciences, The Hashemite University, Zarqa 13133, Jordan
eDepartment of Pharmacology, Faculty of Medicine, The University of Jordan, Amman 11942, Jordan
fPharmacological and Diagnostic Research Center, Faculty of Pharmacy, Al-Ahliyya Amman University, Amman 19328, Jordan
gHMCSR, The University of Jordan, Amman 11942, Jordan
hDepartment of Pharmaceutical Sciences, Faculty of Pharmacy, The University of Jordan, Amman 11942, Jordan. E-mail: bustanji@ju.edu.jo; Tel: +962 798515388
iDepartment of Basic Medical Sciences, College of Medicine, University of Sharjah, Sharjah 27272, UAE
jDepartment of Internal Medicine, Faculty of Medicine, The University of Jordan, Amman 11942, Jordan
kDepartment of Hematology and Oncology, Jordan University Hospital, The University of Jordan, Amman 11942, Jordan
First published on 1st September 2021
Abstract
Echinomycin (quinomycin A) is a peptide antibiotic from the quinoxaline family, which has a DNA bifunctional intercalating activity and an inhibitor of hypoxia-inducible factor (HIF1α). Echinomycin was discovered in 1957 as a potent antitumor agent; however, it was not successful in clinical use due to its low water solubility and short half-life. To revitalize this potent drug, it is important to increase its aqueous solubility and bioavailability. In this study, echinomycin was loaded into PEGylated pH-sensitive liposomes (PEGLippH) and functionalized with anti-nucleolin aptamer (AptNCL) for selective targeting and pH-responsive release of echinomycin into cancer cells. Echinomycin was complexed with γ-cyclodextrin (ECγCD) to enhance its water solubility and then encapsulated into pH-sensitive liposomes (PEGLippH-ECγCD). Then, liposomes were functionalized with AptNCL (AptNCL-PEGLippH-ECγCD) and the successful functionalization was confirmed by dynamic light scattering (DLS) measurements and gel electrophoresis. Cellular uptake for AptNCL-PEGLippH was evaluated by flow cytometry analysis using MDA-MB-231, MCF7, A549 cancer cell lines with respect to the normal fibroblast cells. The results showed a higher uptake and selectivity for AptNCL-PEGLippH compared to PEGLippH. The anti-proliferative effects of AptNCL-PEGLippH-ECγCD were more potent than PEGLippH-ECγCD by 3.5, 4, and 5 folds for A549, MDA-MB-231, and MCF7, respectively. Selectivity indices (SI) for AptNCL-PEGLippH-ECγCD for the tumor cell lines compared to the normal cell line after 72 h were MDA-MB-231 (43.3), MCF7 (16.9), and A549 (8.5). Furthermore, SI after 3 h for the three cancer cell lines were 4.7, 2.5, 2.8, respectively.
1. Introduction
Echinomycin (quinomycin A), a hydrophobic DNA bis-intercalator peptide and an inhibitor of Hypoxia-Inducible Factor (HIF1α) has been proved to have potent anticancer1,2 and antibacterial activities.3,4 Echinomycin structure is composed of two quinoxaline-2-carboxylic acid moieties, depsipeptide ring, and a thioacetal bridge.5 Echinomycin is an example of promising drug that failed in clinical trials.3,6,7 For example, a clinical trial conducted to investigate echinomycin in patients with metastatic soft tissue sarcoma using cremophor as a solubilizing agent and dose escalation on subsequent cycles of therapy produced no clinical responses in the 12 evaluated patients.6 Unfortunately, because of severe side effects including severe nausea and vomiting dose escalation occurred in only 5 of 25 treatment cycles.6 Most anticancer drugs lack specificity and belong to substances with both low solubility in aqueous fluids and poor cellular uptake, which leads to unwanted side effects.8 The development of drug delivery systems implied to reconsider the benefit of such toxic products.8,9 In 2015, echinomycin received an orphan drug designation for the treatment of acute myeloid leukemia in the U.S.A.9Drug delivery systems offer the potential to enhance the therapeutic index of drugs, by increasing the drug concentration, the residence time in target cells, and by decreasing the contact in normal host tissues.10,11 Liposomes are widely used nanoparticles for drug delivery mainly due to their biocompatibility, stability, ease in formulation, high drug-loading efficiency,12 and high bioavailability, and their safe excipients are used in formulations.13–15 Moreover, liposome cell-specific targeting can be achieved by decorating the surface of liposomes with ligand moieties such as aptamer, antibody, polymers, small molecules, and peptides.16,17 Aptamers are single-stranded oligonucleotides that can be selected for a wide range of targets and can bind its target with high affinity and selectivity. Aptamers were used as a targeting ligand for many drug delivery systems and showed potent and promising targeting efficacy in vitro and in vivo.18,19
Trigger-release liposomes are smart liposomes that release their payload on demand in response to endogenous (pH, enzymes, redox, or molecules) or external stimuli (heat or light).20 pH-triggered release liposomes undergo bilayer destabilization and leakage of their cargo at low pH inside diseased tissues or cells.21,22 These pH-sensitive liposomes are of particular interest for the delivery of anticancer drugs since the extracellular pH of cancer tissues is slightly acidic due to the22,23 high metabolic activity of cancer cells24,25 in addition to the low pH of some intracellular organelles that enable liposomes to release their loads into the cell cytoplasm.26 These types of liposomes are categorized into different classes, mainly composed of polymorphic lipids, e.g., dioleoyl phosphatidylethanolamine (DOPE), which can be stabilized by PEG and cholesterol.27–30
After internalization inside tumor cells, pH-sensitive liposomes are retained in early endosomes (pH 6.5), which will be developed into late endosomes (pH 5), without being destructed by the lysosomal enzymes.31,32 There are three mechanisms for cytoplasmic delivery of the cargo from pH-sensitive liposomes; (i) destabilization of liposomes and drug defuses through the endosomal membrane into the cytoplasm, (ii) liposomes destabilize the endosomal membrane by the formation of pores in the membrane, and (iii) finally, the fusion of liposome with the endosome leading to drug release into the cytoplasm.22,33
In a previous study, echinomycin was complexed with γ-cyclodextrin and inclusion complexes were encapsulated inside PEGylated liposomes and showed promising anti-proliferative and anti-invasive activity against U-87 MG glioblastoma cells.9 In the current study, we propose aptamer-guided and stimuli-sensitive liposomes as a smart multifunctional drug delivery system for selective delivery of echinomycin into breast and lung cancer cell lines. First, the echinomycin-γ-cyclodextrin complexes were prepared and loaded into PEGylated and pH-sensitive liposomes. Then, the loaded liposomes were functionalized with anti-nucleolin aptamer using a post-insertion method for targeting nucleolin-expressing cancer cells. Further, the selectivity and anti-proliferative activity of the resulting aptamer-functionalized and echinomycin-loaded pH-sensitive liposomes were tested against three types of nucleolin-expressing cancer cell lines and compared with normal cell line fibroblasts. Finally, the impact of freeze-drying on the stability and functionality of the formulated liposomes was investigated.
2. Materials and methods
2.1. Chemicals
Echinomycin (N-(2-quinoxalinyl carbonyl)-O-[N-(2-quinoxalinyl carbonyl)-D-seryl-L-alanyl-3-mercapto-N,S-dimethyl-cysteinyl-N-methyl-L-valyl]-D-seryl-L-alanyl-N-methyl cysteinyl-N-methyl L-valine (81)-lactone cyclic (37)-thioester) obtained from TOCRIS® bioscience (Bristol, UK). The lipids; DPPC (1,2-dihexadecanoyl-sn-glycero-3-phosphocholine), oleic acid, 1,2-dioleoyl-sn-glycero-3-phosphoethanolamine (DOPE), DSPE-PEG2000(1,2-distearoyl-sn-glycero-3-phosphoethanolamine-N-[methoxy (polyethyl-eneglycol)-2000]). 1,2-Dioleoyl-sn-glycero-3-phosphoethanolamine-N-(lissamine rhodamine B sulfonyl) (Lissamine) (Rho-PE), and cholesterol were purchased from Avanti Polar Lipids (Alabaster, USA). Calcein dye, γ-cyclodextrin, and trypan blue 0.4% solution were purchased from Sigma-Aldrich (USA). Anti-nucleolin aptamers with the sequence: (5′-GGT GGT GGT GGT GGT TGT GGT GGT GGT GGT TTT TTT TTT TT/3CholTEG/-3′) and alexa-labeled anti-nucleolin aptamers (5′-/5Alexa647N-GGT GGT GGT GGT GGT TGT GGT GGT GGT GGT TTT TTT TTT TT/3CholTEG/-3′) were purchased from Integrated DNA Technologies Inc. (Coralville, IA, USA). Phosphate buffer saline (PBS) and Tris-base EDTA buffer (TBE) were obtained from LONZA® (USA). 6-Diamidino-2-phenylindole dihydrochloride (DAPI) from Merck Millipore (Germany) and ethidium bromide from Fisher Scientific Ltd (England). All other chemicals and solvents were of analytical grade. All reagents and chemicals were used without further treatment.2.2. Cells
MCF-7 (ATCC number: HTB-22) and A549 (ATCC Number: CCL-185) cell lines were cultured in RPMI-1640 growth medium (Capricorn Scientific GmbH, Germany), MDA-MB-231(ATCC number: HTB-26) and human skin cells (fibroblasts) (ATCC® PCS-201-012) cell lines were cultured Eagle's Minimum Essential Medium (EMEM) (Euroclone SpA, Italy). Both RPMI-1640 and EMEM medium were supplemented with 10% (v/v) fetal bovine serum (FBS), 1% (v/v) 200 mM L-glutamine, and antibiotics, penicillin–streptomycin (100 IU/mL-100 μg mL−1). Cells were maintained in humidified 5% CO2 incubator at 37 °C.2.3. Preparing echinomycin-γ-cyclodextrin (ECγCD) complex
Based on our previous work,9 ECγCD inclusion complexes were prepared using the co-evaporation dispersion method. Echinomycin solution in chloroform (100 μL) was added dropwise to 235 μL of γCD aqueous solution to get an ECγCD ratio of 1![[thin space (1/6-em)]](https://www.rsc.org/images/entities/char_2009.gif) :2 (v/v). The complex solution was shaken for 24 h to achieve equilibrium, then chloroform was evaporated under vacuum for 30 min. The final volume of ECγCD inclusion was adjusted to 1 mL in PBS (pH 7.4) for loading into liposomes.9
:2 (v/v). The complex solution was shaken for 24 h to achieve equilibrium, then chloroform was evaporated under vacuum for 30 min. The final volume of ECγCD inclusion was adjusted to 1 mL in PBS (pH 7.4) for loading into liposomes.9
2.4. Preparation of liposomes
Liposomes were formulated using molar ratios of 40% of DPPC, 30% of DOPE, 30% of cholesterol, 3% DSPE-PEG2000 (10 mM total lipids concentration). Liposomes made from 10 mM of DPPC and cholesterol (70:30) were used for comparison. PE-rhodamine-labelled liposomes were prepared using PE-rhodamine 0.5% molar ratio subtracted from the DPPC ratio.
Liposomes were prepared using the conventional thin-film hydration technique.34–36 Briefly, lipids were mixed in 3 mL of chloroform in a 50 mL round bottom flask. The thin film was formed by evaporation of chloroform using 20 rpm at 50 °C under a gradual decrease in negative pressure down to 100 psi (IKA RV 05 Basic Rotary Evaporator combined with VacuuBrand CVC2000, Germany). The film was then hydrated with 2 mL of PBS buffer, pH 7.4 at ∼50 °C for 30–60 min with vigorous vortexing every 2–3 min.34 The vesicle suspension was successively extruded through a polycarbonate membrane (100 nm, Whatman®) using Mini-Extruder (Avanti Polar Lipids, Inc. USA) at 50 °C for 13 times (same size for more than 13 times) to obtain the final liposomes with low polydispersity and desired size, which then stored at 4 °C for further use.
2.5. Calcein releasing assay
For the calcein-releasing assay, the dry film was dispersed into 2 mL of 50 mM calcein solution of pH 8.8. Then, calcein-loaded vesicles (50 μL) were added to 1 mL PBS solutions with different pHs (4.4, 5.4, 6.4, and 7.4). The mixtures were incubated for 15 min at room temperature under 100 rpm stirring. Then, 10 μL of the samples were diluted to 1 mL and the pH was adjusted to 7.4. Calcein fluorescence was measured using the GloMax-Multi detection system (Promega, USA) before and after the addition of 50% absolute ethanol.The percentage of calcein release was calculated using the following equation:
 | (1) |
2.6. Simulations of the liposomal lipid bilayer decorated with PEG2000 and AptNCL
Molecular dynamics (MD) simulations of the liposomal heterogeneous lipid bilayer composed of 37% of DPPC, 30% of DOPE, 30% of cholesterol, 3% DSPE-PEG2000 were performed using the CHARMM-GUI Membrane Builder (http://www.charmm-gui.org/input/membrane), a web-based graphical user interface. The initial membrane bilayer was built with 200 Angstroms for the X and Y axes. A replacement method was used for the build system, and 171 positive and 171 negative ions (0.15 M KCL) were added to neutralize the system. The final resulting bilayer contains 225 cholesterol molecules, 285 DPPC, 15 DSPE-PEG2000, and 225 DOPE.PEG2000 conical smile was imported from PUBCHEM (https://pubchem.ncbi.nlm.nih.gov) to Discovery Studio (version 2.5.5, Biovia, San Diego, CA, USA), and the covalent bond forming tool was used to connect it to DSPE. The aptamer was imported from the PDB databank (PDB ID: 2N3M) by removing the first nucleotide at the 5′ end and adding an extra 11 thymidine monophosphate (TMP) at the 3′ end by Discovery Studio. The resulting aptamer was added by a linker using a “covalent bond forming tool” in Discovery studio to a cholesterol molecule (according to the experimentally calculated ratio). The final structure was minimized several times with the minimization tool in Discovery studio untill converging to the most stable state.
2.7. Preparing liposomes loaded with echinomycin-γ-cyclodextrin complexes
pH-Sensitive liposomes composed of DPPC, DOPE, cholesterol, and DSPE-PEG2000 with a molar ratio of 37:30:30:3, respectively, were prepared by a thin-film-hydration extrusion method as described before. Instead of PBS buffer hydration, the thin film was hydrated with 400 μL of ECγCD complexes and continued with the liposomal preparation protocol. The free ECγCD complexes were removed and washed two times with PBS solution using ultrafiltration 100 kDa cutoff amicon filter (Millipore, USA). The ECγCD loaded-liposomes were stored at 4 °C for further use.37
2.8. Differential scanning calorimetry (DSC) for pH-sensitive liposomes
The liposome samples weights in the range of 3–6 mg were analyzed by Netzsch DSC 204 F1 instrument (Germany). The liposome suspension was heated up to 50 °C and was then cooled with liquid nitrogen to −50 °C. The DSC patterns of the samples were obtained by heating liposomes suspension gradually from −50 °C to 200 °C at a heating rate of 5 °C min−1 under a constant flow (100 mL min−1) of nitrogen gas.2.9. Post-insertion of AptNCL into PEGylated liposomes
Functionalizing liposomes and PEG-liposomes with AptNCL aptamer was performed using a post-insertion method.38,39 Free or loaded different liposome formulations were mixed with cholesterol-linked AptNCL at (0.3 mg lipid: 10 μg AptNCL) or Alexa-tagged AptNCL (0.3 mg lipid: 9 μg AptNCL: 1 μg Alexa-tagged AptNC). The mixture was stirred at room temperature (25 °C) for 1 h. Post-inserted AptNCL was finally mixed with 2.5 mM MgCl2 and 140 mM KCl in 1× PBS, pH 7.4 as a folding buffer for an extra 10 min to enable folding.2.10. Characterization of aptamer-liposomes (AptNCL-LippH)
2.11. Freeze-drying of the liposomes
Freshly prepared liposomal suspensions were freeze-dried in the presence of trehalose and sucrose ratios; 1%, 2.5%, 5%, and 10% (w/v). Liposomes without lyoprotectant were lyophilized as a reference. Liposomes were freeze-dried using an OPERON freeze-dryer (OPERON Co., Ltd). A volume of 1 mL liposomal dispersion was transferred into vials and stored for 24 h at −20 °C. Then, the liposomes were soaked in liquid nitrogen for 10 min. The temperature of the freeze dryer was then lowered to −55 °C. Sublimation of the aqueous solvent was then initiated by decreasing the pressure to 150 μbar for the next 24 h. At the end of the process, the vials were closed with rubber caps and stored at −20 °C until further analysis. The influence of the type and molar ratio of lyoprotectant on the final quality of the product was examined by measuring size and charge before and after lyophilization, with and without lyoprotectants.2.12. Flow cytometry analysis
AptNCL-LippH binding selectivity and cellular uptake against four cell lines (fibroblast, A459, MCF7, and MDA-23) were evaluated by measuring the mean fluorescence intensity (MFI) using a flow cytometer (BD FACSCantoTM II). Approximately, 2.5 × 10⁵ cells of each cell line were seeded in 12-well plates and incubated for 24 h at 37 °C to reach 80% confluency. After that, cells were washed with PBS and incubated in 500 μL of fresh media and 200 nM tagged Alexa-AptNCL-Rhod-LippH was incubated with cells for 3 h at 37 °C. The unbound Alexa-AptNCL-Rhod-LippH was washed three times with PBS and detached by 100 μL of EDTA-accutase for 5 min. After detachment, cells were transferred into flow cytometry tubes and 10000 events were counted for each sample using y FACS Canto II and analyzed using BD FACSDiva™ software version 8.0 (BD, USA). Cells treated with lipo-Rhod and Alexa-tagged aptamers were used for comparison. Cells with media have been used as negative controls.
2.13. In vitro stability of PEGLippH-ECγCD and AptNCL-PEGLippH-ECγCD
The stability assay of PEGLippH-ECγCD and AptNCL-PEGLippH-ECγCD was performed by measuring the mean hydrodynamic diameter, zeta potential, and PDI in PBS at pH 7.4 with a storage period of 10 at 4 °C and 3 days at 37 °C. The releasing assay of echinomycin from PEGLippH-ECγCD and AptNCL-PEGLippH-ECγCD was performed at 37 °C in PBS at pH 7.4 and 5.4. Different samples of 700 μL were incubated at different time intervals (0, 10, 20, 30,60, and 720 min). The free ECγCD inclusions at each time point were removed by ultrafiltration using Amicon® filters (cut-off of 100 kDa) (Millipore, Germany). The concentration of echinomycin in the liposomal fraction was quantified by HPLC.2.14. Cytotoxicity (MTT) assay of LippH-ECγCD and AptNCL-LippH-ECγCD
The cytotoxicity of free echinomycin and liposomal preparations was measured using the cell viability MTT assay (microculture tetrazolium). Cells were seeded at a density of 5 × 10⁴ cells per well in a microtiter 96-well plate (Costar, USA) in 100 μL complete culture medium and incubated for 24 h in a humidified atmosphere of 5% CO2 at 37 °C. Then, stock solutions of free echinomycin (free EC), PEGLippH-ECγCD, and AptNCL-PEGLippH-ECγCD were serially diluted in the medium of concentrations range from 0.02 to 50 nM in 100 μL medium and added to seeded cells. After that, treated cells were incubated in a humidified atmosphere of 5% CO2 at 37 °C for 72 h. For comparison with the 72 h treatment time, cells were treated with similar concentrations of free EC, PEGLippH-ECγCD, and AptNCL-PEGLippH-ECγCD for 3 h and replaced with 100 μL fresh medium and incubated in a humidified atmosphere of 5% CO2 at 37 °C for 72 h. The solutions were then removed and replaced with 100 μL fresh media and 15 μL of MTT solution were added to each well, followed by incubation at 37 °C for 3 h. After that, MTT-media solution was removed and 50 μL of DMSO was added to solubilize the dark blue formazan crystals. The absorbance of formazan was measured at 570 nm with a microplate reader Synergy™ HTX by BioTek Instruments Inc. (USA) and then IC50 values were calculated according to the following equation:
 | (2) |
 | (3) |
3. Results and discussion
3.1. pH-sensitive liposomes preparation and characterization
To optimize a stable pH-sensitive liposomal formulation with a good release under acidic pHs, DPPC was used as the bulk constituent of the formulation (≥40%), while the DOPE molar ratio was ≤30%. DPPC can form a stable lamellar phase (Lβ) and has a transitional temperature slightly higher than physiological temperature (41 °C).43 This stable lipid can decrease the intermolecular interaction of the headgroups of DOPE and increase surface hydration.32 Cholesterol, at a molar ratio up to 30%, increased the stability of nanoparticles.44 Cholesterol fills up gaps between the packing of other lipid species. It is a membrane constituent widely found in biological systems and serves a unique purpose of modulating membrane fluidity, elasticity, as well as permeability.44 Cholesterol serves the same purpose in model membranes.45 These lipid combinations are consistent with a previous literature10,33 in which the pH-sensitive liposomes should contain the very low transition temperature phospholipid, DOPE, as a basic component in addition to cholesterol as a stability lipid.43
The calcein-releasing experiment revealed that the release at physiological pH (pH ≈ 7.4) was (8.82 ± 2.5%), while the release at pH ≈ 5.4 was (46.65 ± 6.3%) (Fig. 1A). Based on these results, the pH-sensitive liposomal formulation is stable at physiological pH and releases approximately 50% of its content at the endosomal pH. Moreover, the incorporation of DSPE-PEG2000 into DOPE-containing liposomes decreased the release of calcein (24.7 ± 1.2%) from DOPE-containing liposomes at acidic pHs, which indicates higher stability and lower pH-sensitivity. Besides, liposomes containing DPPC and cholesterol only showed low and stable release at different pHs.
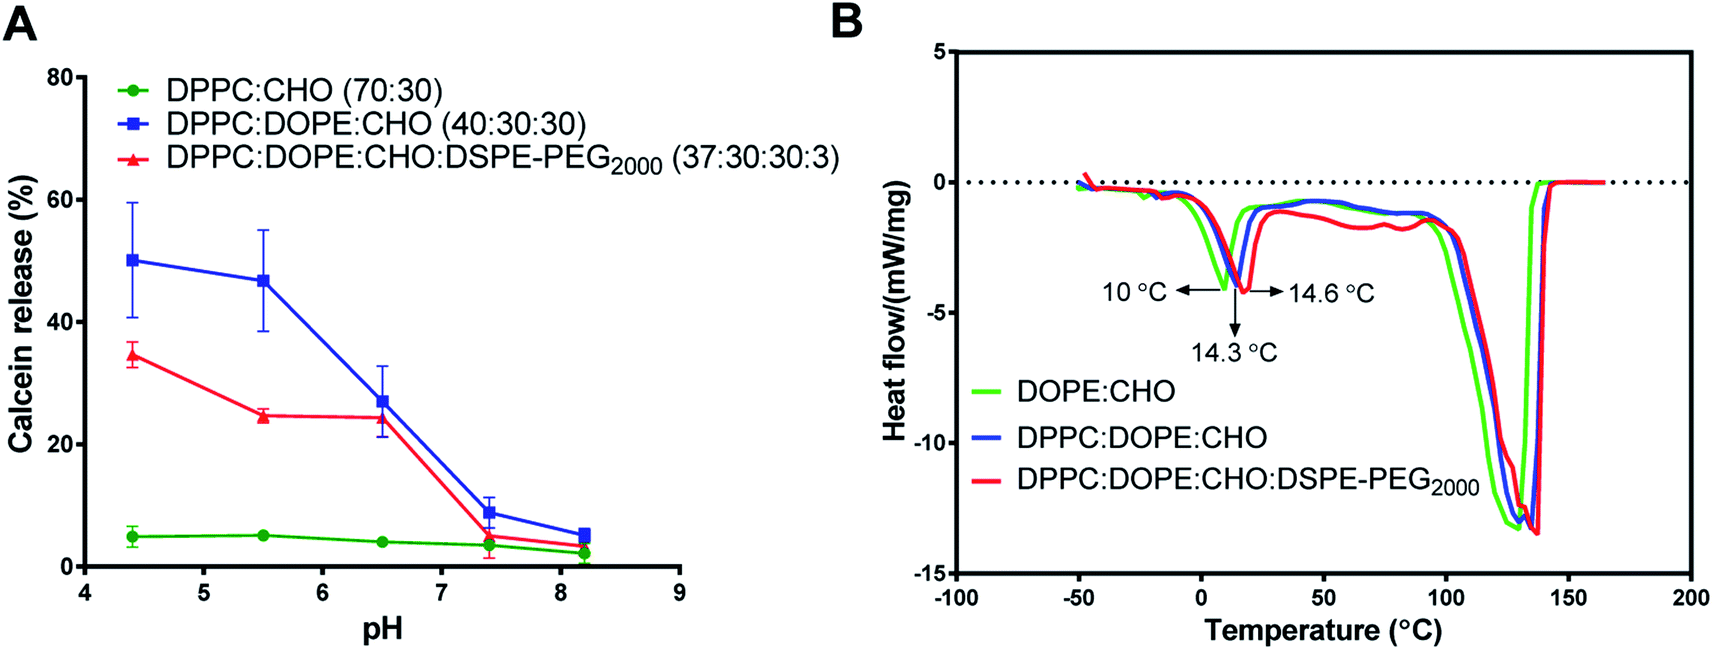 | ||
| Fig. 1 Effect of lipid constituents on pH sensitivity and transitional temperature (Tm) of different liposomal formulations. (A) Calcein dye leakage at different pHs from (DPPC:CHO), (DPPC:DOPE:CHO), and (DPPC:DOPE:CHO:DSPE-PEG2000) liposomal formulations. (B) Differential scanning calorimetric (DSC) analysis for (DOPE:CHO), (DPPC:DOPE:CHO), and (DPPC:DOPE:CHO:DSPE-PEG2000). (mean ± SD, n = 3, CHO was 30% in all formulations). | ||
The stability and pH sensitivity results of the developed formula were consistent with previous studies. For example, Ghanbarzadeh et al., (2014) developed a liposomal formula composed of DPPC: DOPE: CHO: with a molar ratio of 50:30:20, respectively, and had a better antiproliferative effect on MCF-7 cells compared to conventional liposomes.33
Fig. 1B shows a clear endothermic peak between 10-14.6 °C for the Tm of DOPE in the intended liposomes. Another broad and highly endothermic peak at 100–130 °C, which indicates the evaporation of water or melting of other constituents. The slight shift in DOPE Tm indicates the effect of different formulations on the DOPE transition temperature. Despite these slight shifts in DOPE Tm, the results of DSC and calcein release at acidic pH indicate that the release is pH-sensitive rather than thermo-sensitive.
3.2. AptNCL post-insertion into liposome surface and characterization of AptNCL-PEGLippH
In this study, PEGylated pH-sensitive liposomes (PEGLippH) were functionalized with anti-nucleolin cholesterol-modified AS1411 aptamer (AptNCL-PEGLippH) to selectively target nucleolin-expressing cancer cells. The liposomes were stealthed with 3% DSPE-PEG2000 and encapsulated with calcein to investigate release and pH-sensitivity or with ECγCD complexes to investigate the anti-proliferative effect on different cancer cell lines. The pegylated LippH was grafted with AptNCL using a post-insertion method that utilized cholesterol (CHO) as an anchoring unit to incorporate AptNCL on the surface of preformed and loaded liposomes (Fig. 2A).38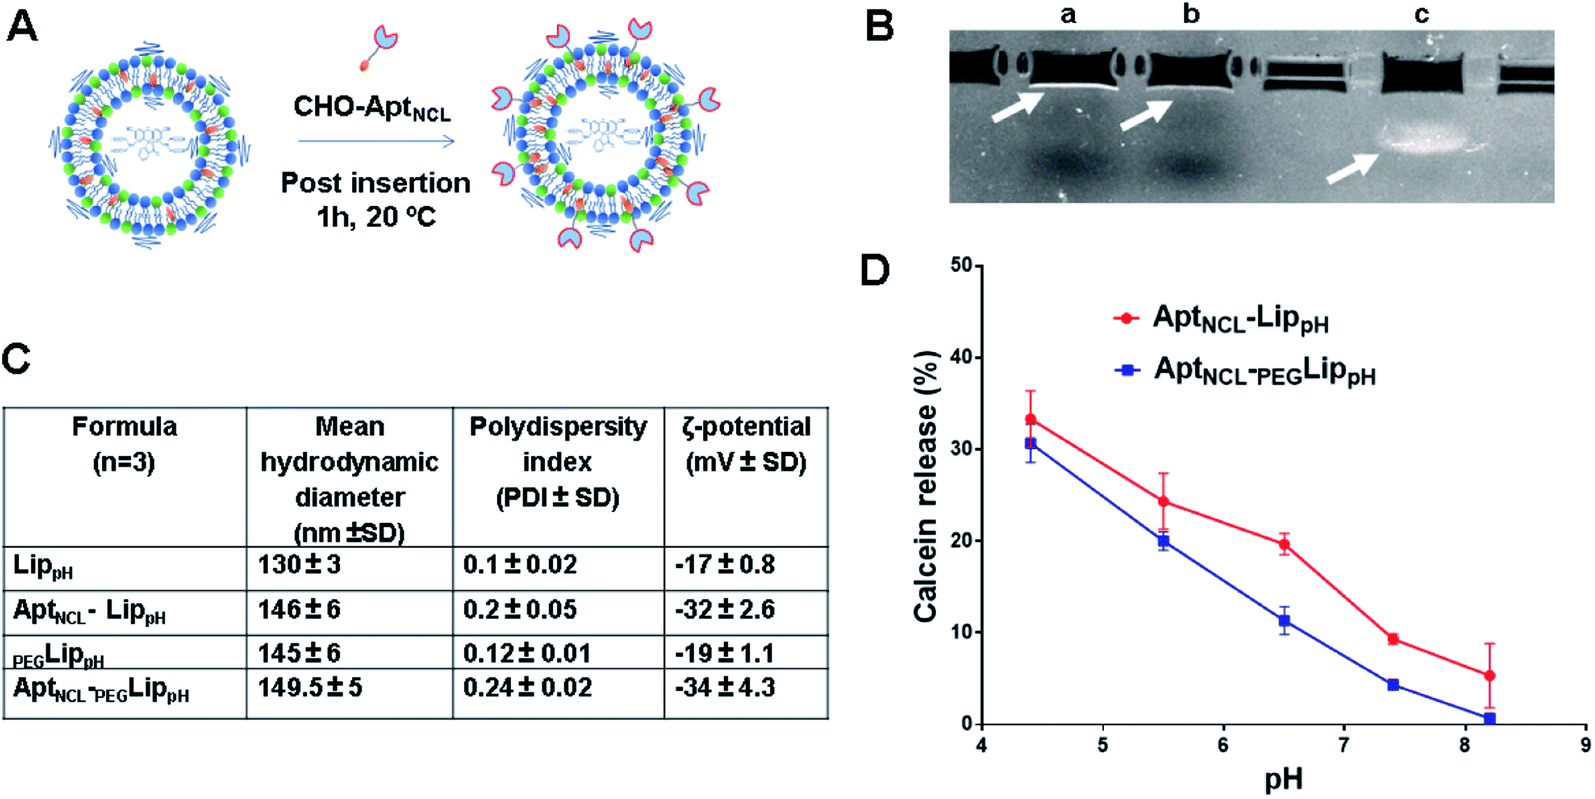 | ||
| Fig. 2 AptNCL post-insertion and pH sensitivity of AptNCL-LippH and PEGylated AptNCL-PEGLippH formulations. (A) Schematic representation of post-insertion of cholesterol-conjugated AptNCL on the surface of LippH and PEGLippH. (B) and (C) Characterization of liposomes before and after AptNCL post insertion on the surface of LippH and PEGLippH (B) Agarose gel electrophoresis. Lanes: a, AptNCL- PEGLippH; b, Free PEGLipPH; c, free AptNCL (C) the change of hydrodynamic diameter and the polydispersity index of LippH, AptNCL-Lip, PEGLippH, and AptNCL-PEGLippH (D) calcein dye releasing assay from AptNCL-LippH and PEGylated AptNCL-PEGLippH formulations. (mean ± SD, n = 3). | ||
The increase in liposome size (16 nm) and a decrease in zeta potential (−15 mV) confirm the successful post-insertion of the negatively charged aptamer to our liposomes. Moreover, our results indicated that aptamer conjugation has increased liposomal stability by decreasing aggregation through the process of aptamer immobilization onto the surface of LippH as reported in previous reports.47
3.3. pH-Sensitivity and calcein release from the AptNCL-PEGLippH
The calcein releasing assay was performed to demonstrate the effect of aptamer and PEG2000 on the pH sensitivity and stability of liposome formulation. Fig. 2D shows higher stability of AptNCL-PEGLippH liposomes than AptNCL-LippH at different pHs. These results evidenced the role of PEG and aptamer in increasing liposome stability.3.4. Cellular uptake and selectivity of AptNCL-LippH using flow cytometry
The in vitro selectivity and cellular uptake of AptNCL-PEGLippH against MDA-MB-231, MCF7, A549, and normal skin fibroblast cells were examined by measuring the mean fluorescence intensity (MFI) of the fluorescent signal obtained from Alexa 647-labeled AptNCL and rhodamine-labeled liposomes in free AptNCL,PEGLippH, and AptNCL-PEGLippH (Fig. 3A–D).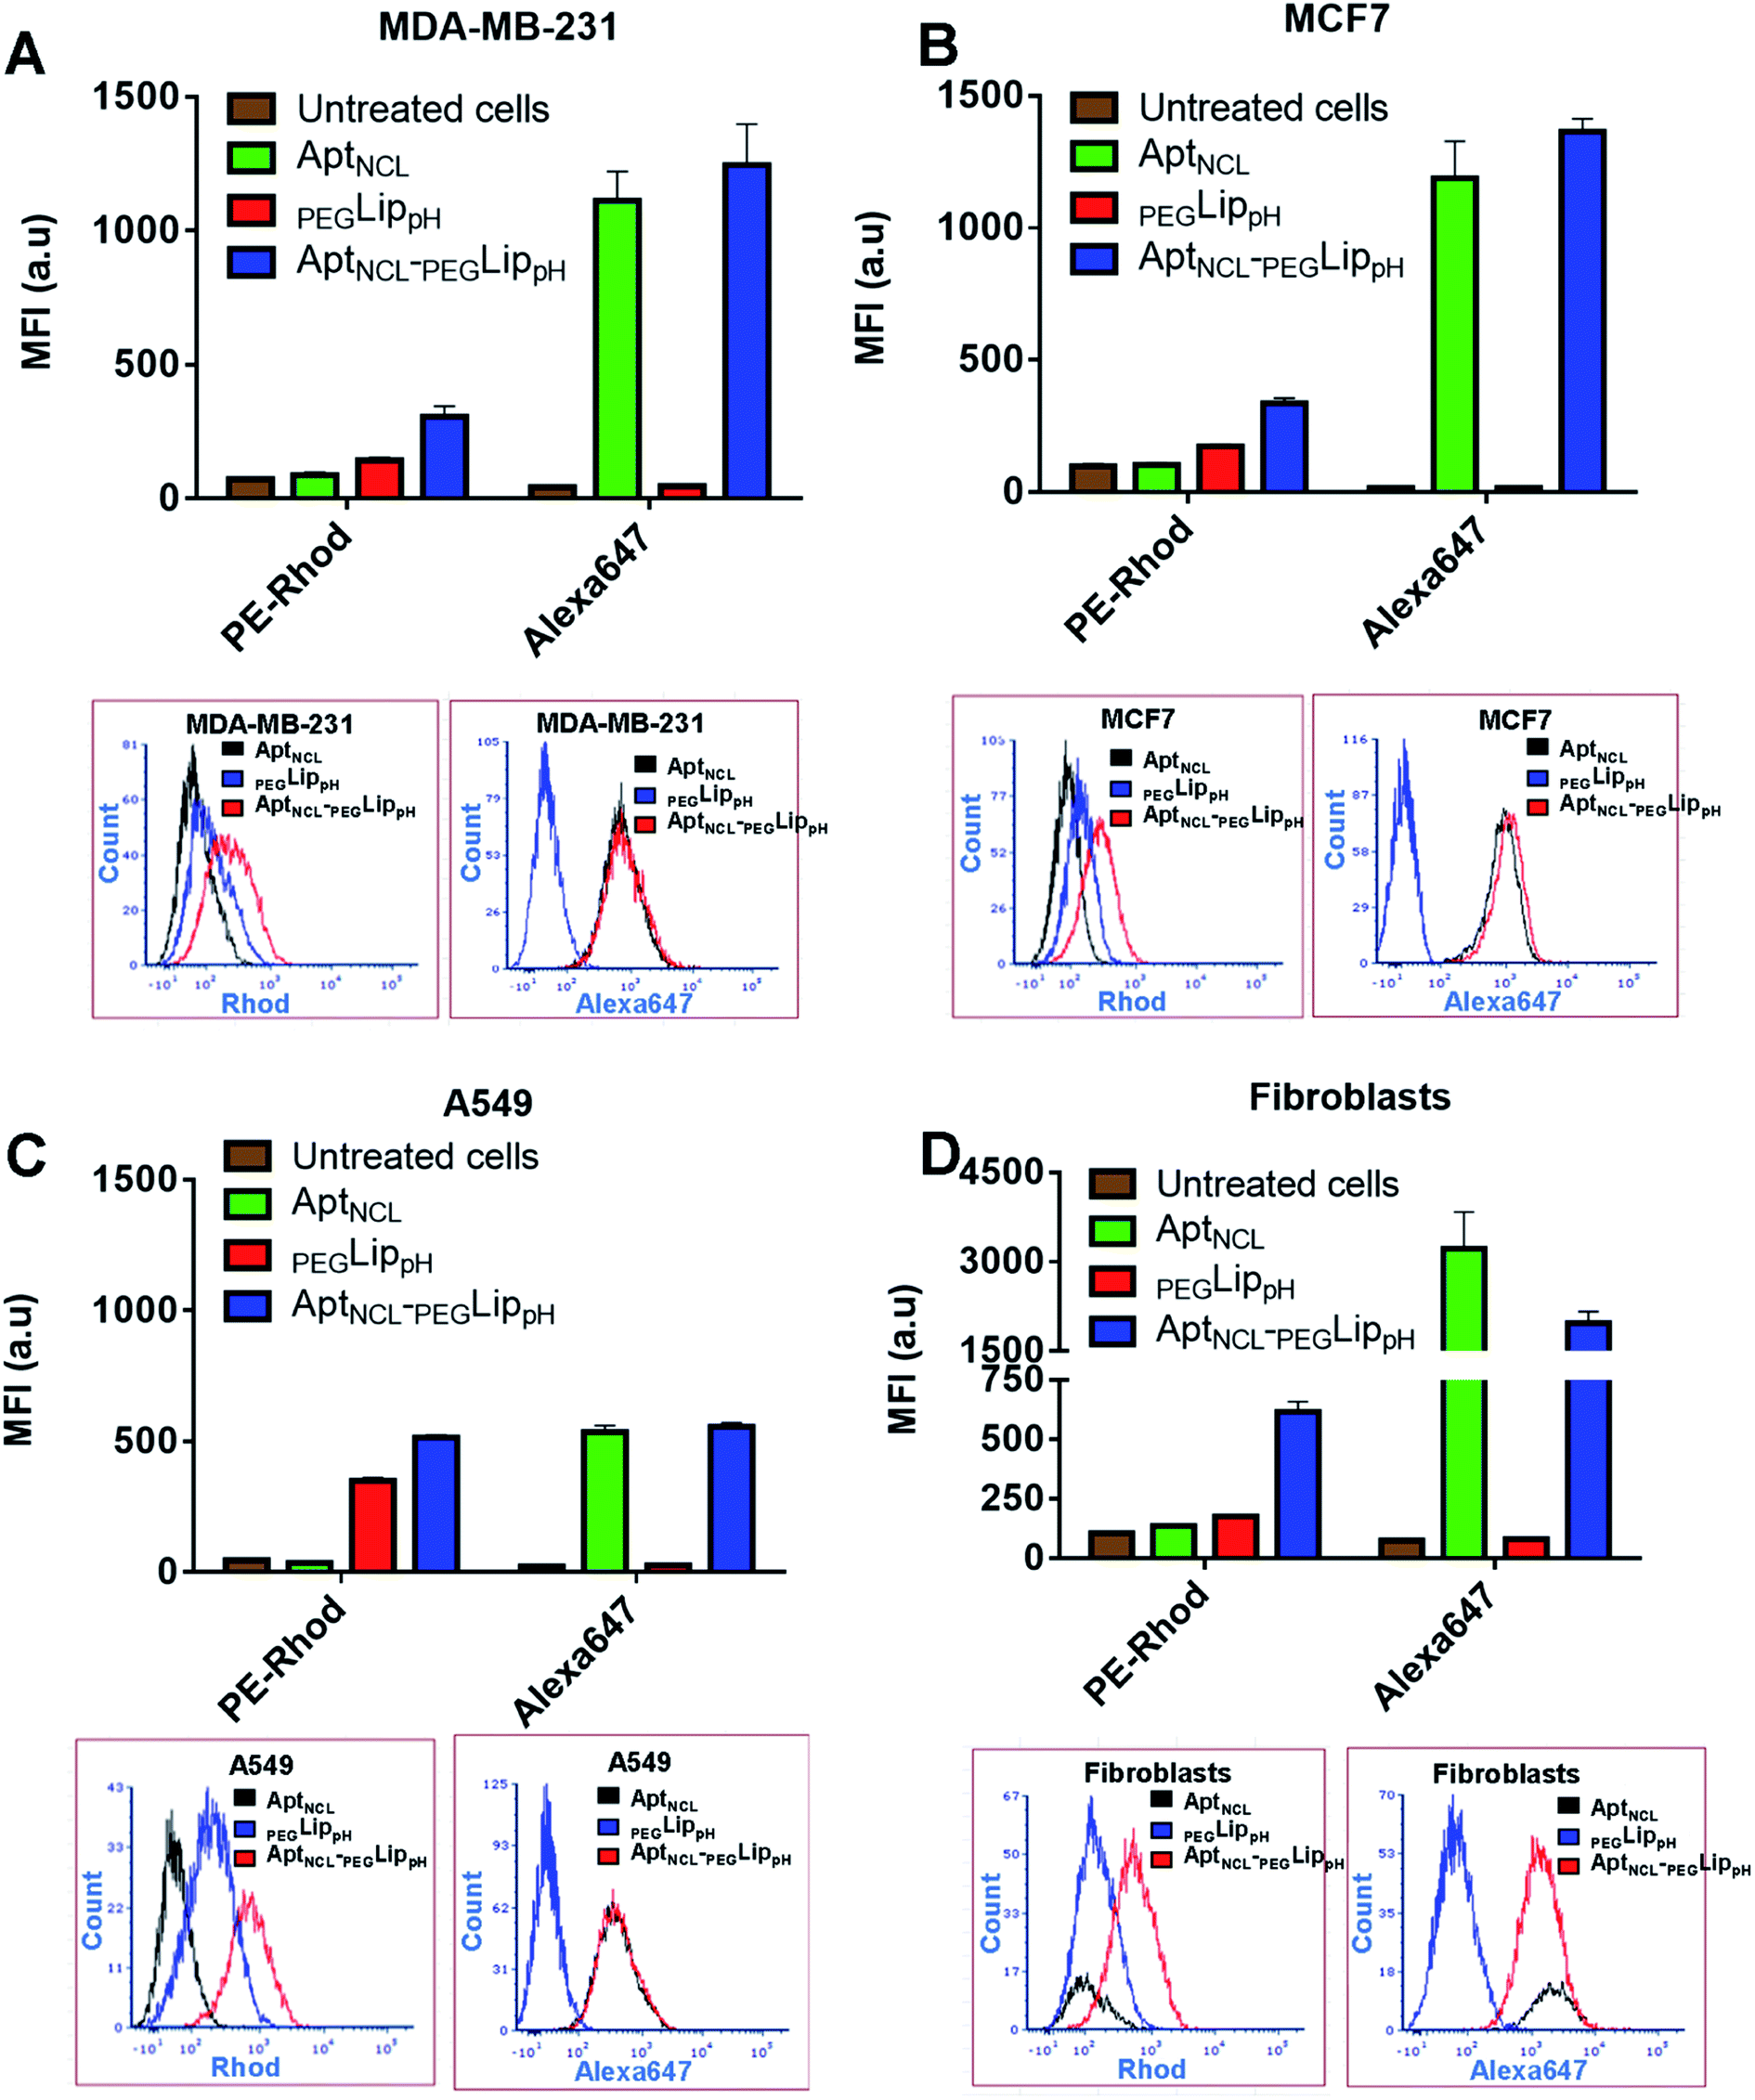 | ||
| Fig. 3 Flow cytometry analyses for the uptake of free AptNCL,PEGLippH, and AptNCL-PEGLippH in cultured cells; for each cell line (A) MDA-MB-231, (B) MCF7 (C) A549, (D) fibroblasts; (upper part of A, B, C, D) show the mean fluorescence intensity (MFI) measurements after treatment with free AptNCL,PEGLippH, and AptNCL-PEGLippH. (Lower part of A, B, C, D) show flow cytometry histogram analysis after treatment with free AptNCL,PEGLippH, and AptNCL-PEGLippH. Cells were treated with free AptNCL (200 nM), or PEGLippH (120 mM), or AptNCL-PEGLipPh (200 nM AptNCL/120 mM PEGLippH) and compared to untreated cells. AptNCL labeled with Alexa647 and PEGLippH labeled with rhodamine. (mean ± SD, n = 3). | ||
All examined cells showed higher MFI of rhodamine signals when treated with Rhod-labelled AptNCL-PEGLippH compared to rhod-labeled PEGLippH and untreated cells, whereas all cells showed a slight increase in the MFI of Alexa Fluor 647 signals when treated with Alexa- and Rhod-labelled AptNCL-PEGLippH compared to Rhod labeled PEGLippH and untreated cells. The cellular uptake results proved the role of the aptamer for liposomal selective targeting and accumulation into the cancer cells by at least by two folds versus the plain liposome in cancer cells. The same conclusion can be obtained from the flow cytometry histogram analysis as reported in Fig. 3A–D. Interestingly, fibroblasts showed a higher uptake for the free Alexa-AptNCL and Alexa- and Rhod-labelled AptNCL-PEGLippH compared to cancer cell lines. Previous reports have explained that the higher uptake of the anti-nucleolin aptamer by the normal cells compared to cancer cells is due to different uptake mechanism.48,49 In cancer cells, the uptake was mediated by macropinocytosis (fluid-phase endocytosis) that stimulates further macropinocytosis by nucleolin-dependent mechanism while in normal cells the uptake is mediated by a different mechanism (nonmacropinocytic pathway).
3.5. Encapsulation of echinomycin-γCD into pH-sensitive liposomes (PEGLippH-ECγCD)
In our previous study,9 echinomycin-γCD (ECγCD) was prepared and characterized using 1H-NMR spectroscopy, the phase solubility diagram, and the Benesi–Hildebrand method. In the current work, ECγCD was prepared and encapsulated into PEGylated pH-sensitive liposome formulation composed of DPPC:DOPE:CHO:DSPE-PEG2000 with 37:30:30:3 molar ratio (Fig. 4A–D). It is worth mentioning that the current formula is different from the previously investigated liposomes, which were composed of DPPC, and cholesterol.
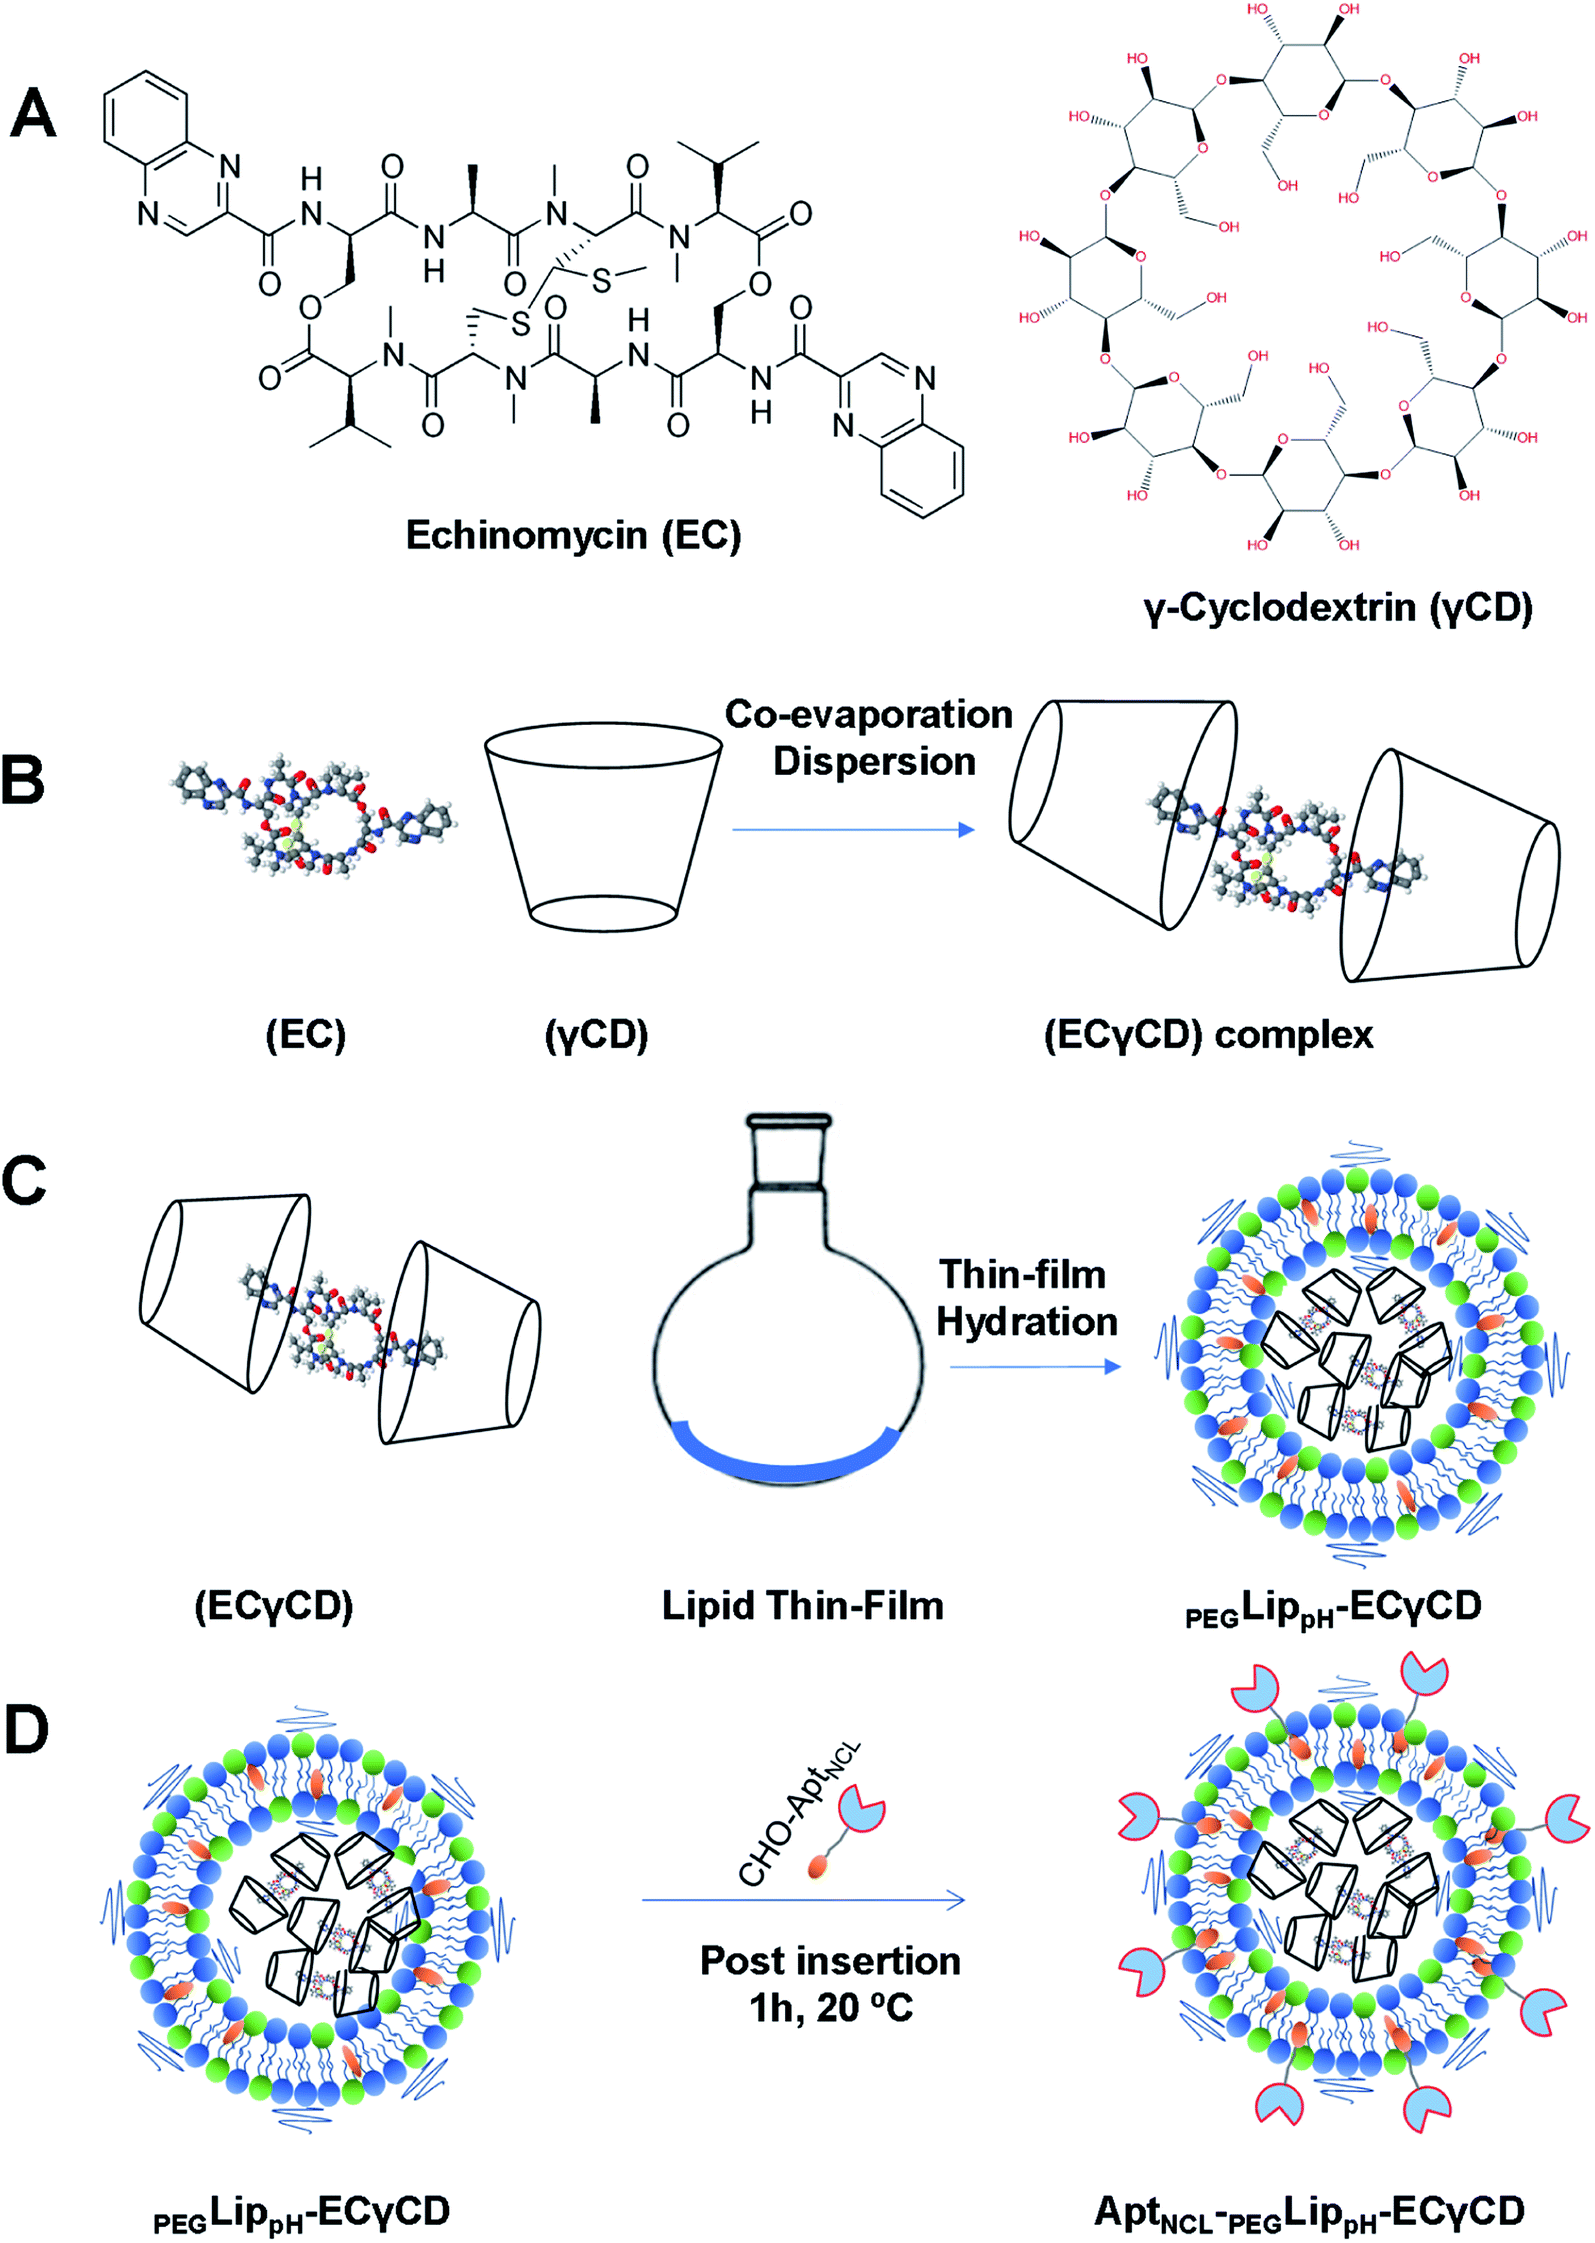 | ||
| Fig. 4 Schematic representation of (A) the chemical structure of echinomycin and γ-cyclodextrin (EC and γCD) (B) formation of ECγCD inclusion complexes (C) encapsulation of ECγCD complex into PEGLipPH nanoparticles (D) decoration of PEGLippH -ECγCD with AptNCL by post-insertion at room temperature for 1 h. | ||
Fig. 5A shows DLS measurements of PEGLippH,PEGLippH-ECγCD, and AptNCL-PEGLippH-ECγCD in addition to encapsulation efficiency. The average size of PEGLippH was 134 ± 10 nm and was 120 ± 16 nm for PEGLippH-ECγCD with no significant differences. Both liposome preparations showed a similar polydispersity index (∼0.1), which demonstrates the presence of a monodisperse distribution. The zeta potential of PEGLippH was −12 ± 2 mV with values similar to the one observed for PEGLippH-ECγCD (−15 ± 2 mV). The encapsulation efficiency of echinomycin was found to be around 6.3 ± 0.4% and a drug loading of 0.03% (wt/wt), which is similar to our previous work (5.1 ± 0.8).9
3.6. In vitro releasing assay of EC from PEGLippH-ECγCD and AptNCL-PEGLippH-ECγCD
The in vitro release of echinomycin from PEGLippH-ECγCD and AptNCL-LippH-ECγCD was assessed in physiological PBS buffer (pH 7.4 and pH 5) at 37 °C over a period of 12 h at different intervals.As illustrated in Fig. 5B, echinomycin release from PEGLippH-ECγCD was higher than AptNCL-PEGLippH-ECγCD at both pHs. This can be explained by the fact that the AptNCL was post inserted and immobilized onto the surface of PEGylated LippH utilizing CHO as anchoring units. Extra CHO molecules increase the rigidity of the vesicles while the presence of DSPE-PEG2000 decreases the release by decreasing the pH sensitivity of DOPE.50 Moreover, the aptamers post-inserted to the surface of liposomes may decrease the pH sensitivity of the PEGLippH-ECγCD. In general, these findings confirm the pH sensitivity for AptNCL-PEGLippH-ECγCD, which might be beneficial for the drug delivery in the tumor microenvironment.
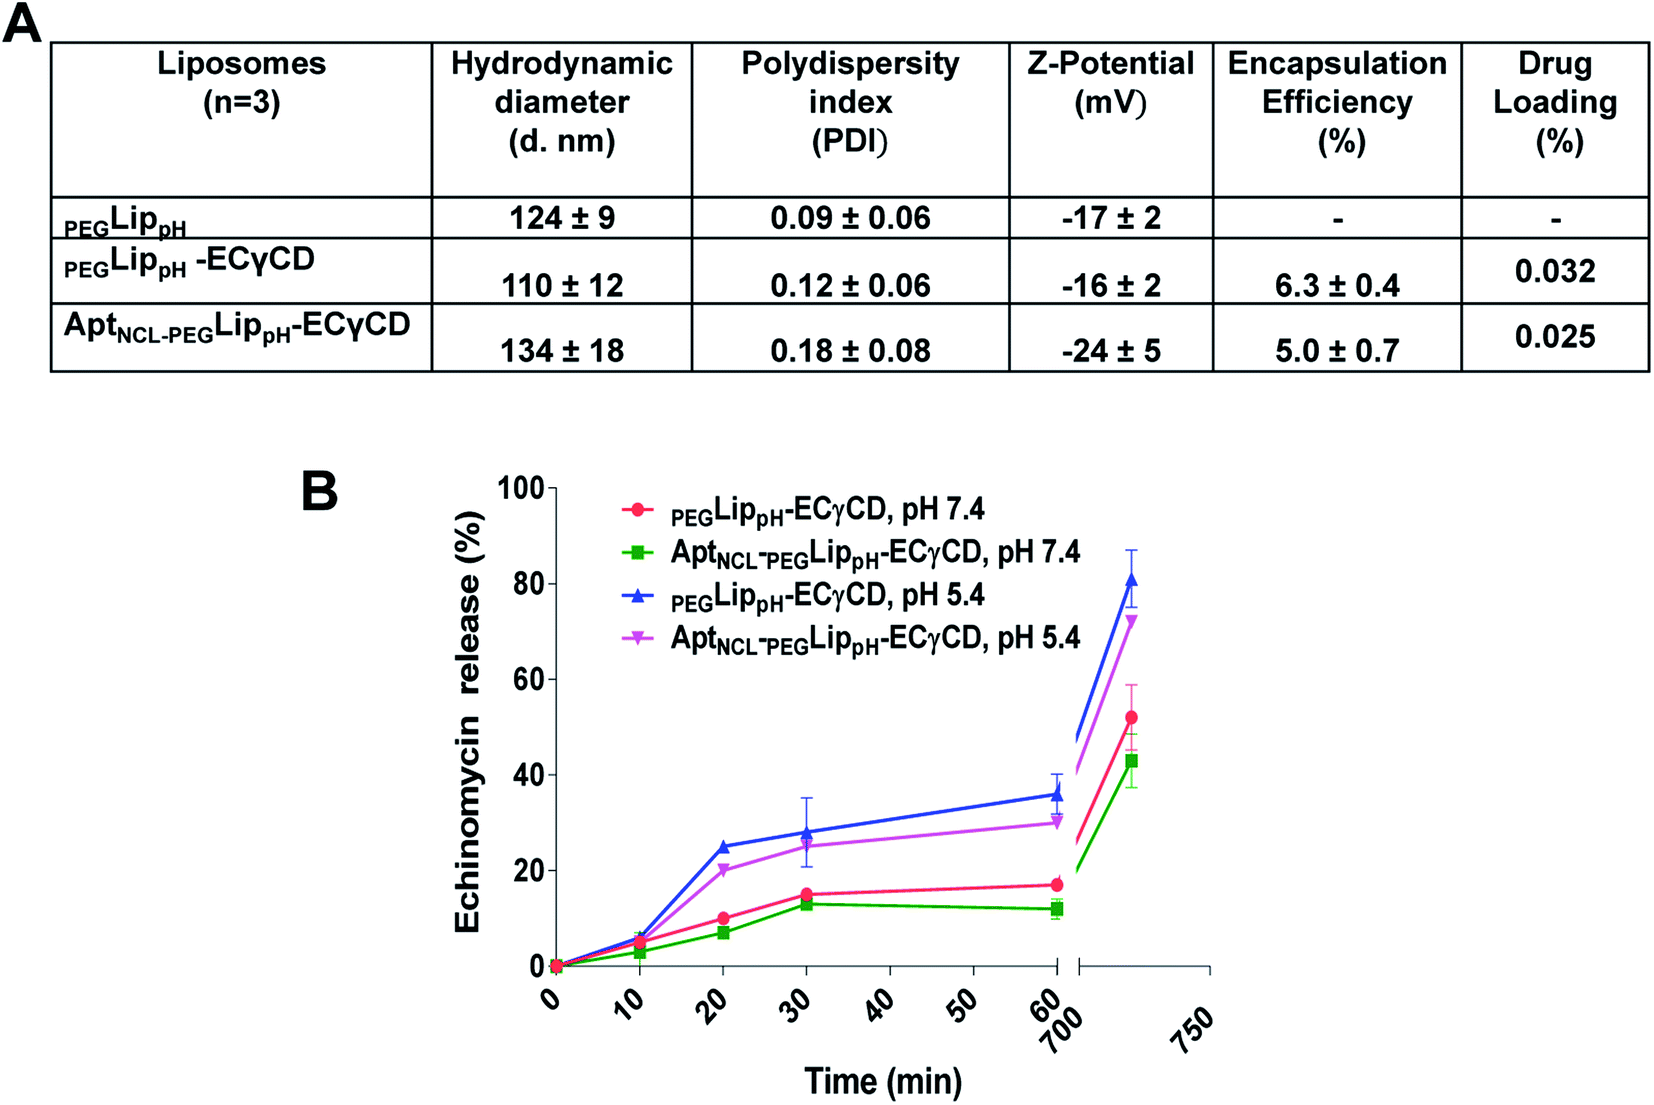 | ||
| Fig. 5 (A) Characterization using DLS measurements, drug loading, and encapsulation efficiency for the PEGLippH, PEGLippH-ECγCD, and AptNCL-PEGLippH-ECγCD liposomes before and after AptNCL post-insertion. (B) Calcein dye releasing assay of LippH formulation before and after CHO-AptNCL post insertion at pH (7.4 and 5.4). | ||
3.7. Colloidal stability for PEGLippH-ECγCD and AptNCL-PEGLippH-ECγCD
The stability of blank PEGLippH, PEGLippH-ECγCD, and AptNCL-PEGLippH-ECγCD was investigated by measuring the changes in the mean size and polydispersity index (PDI) over a period of three days in physiological buffer at 37 °C (physiological temperature) (Fig. 6A–C) and at 4 °C (storage temperature) (Fig. 6D–F).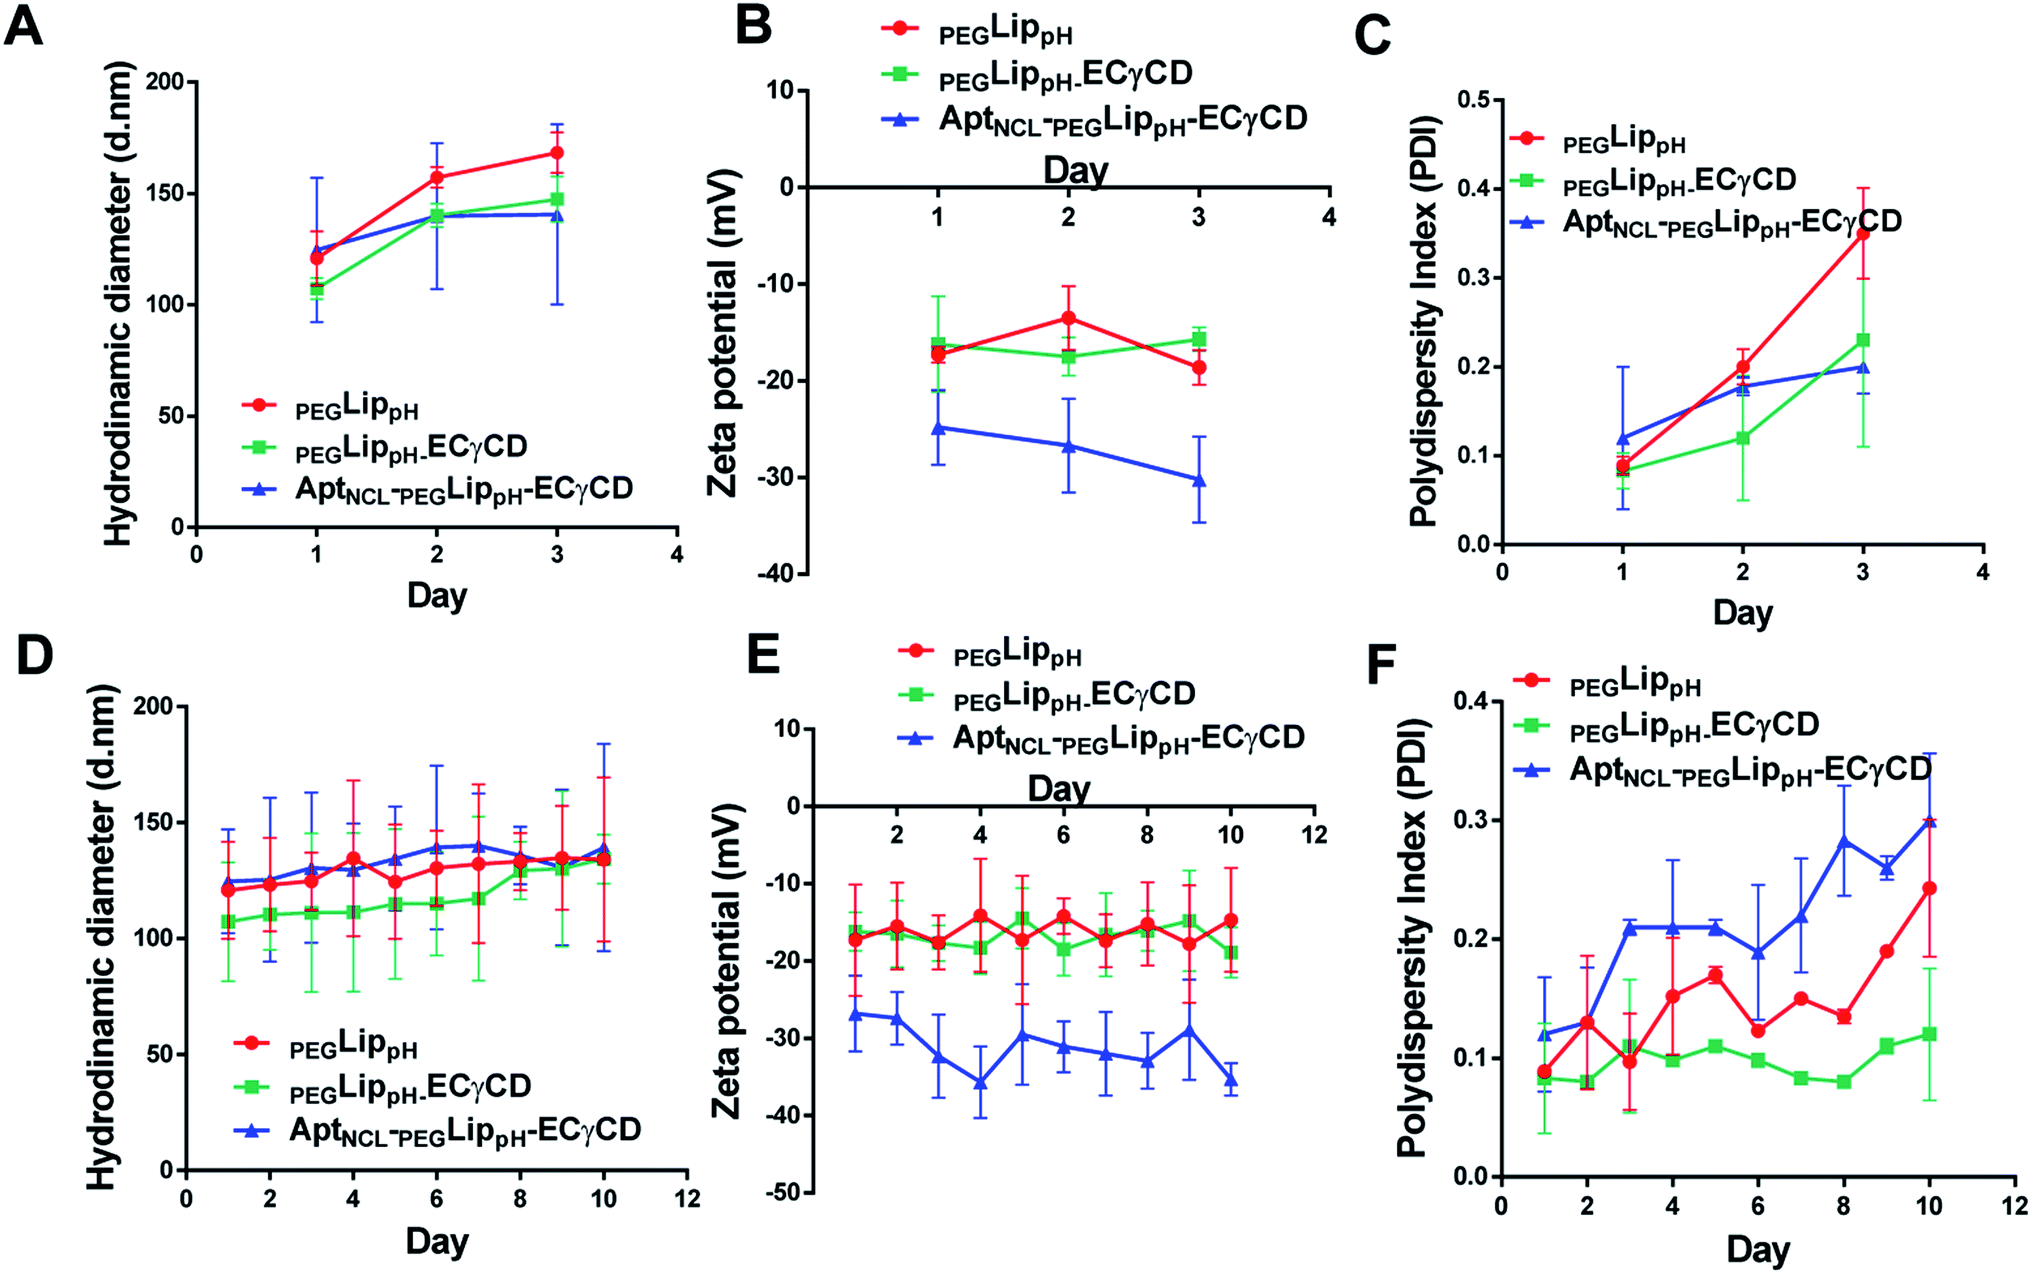 | ||
| Fig. 6 Colloidal stability of blank LippH, LippH-ECγCD and AptNCL-LippH-ECγCD in terms of DLS measurements at 37 °C for three days (A) the hydrodynamic diameter, (B) zeta potential and (C) polydispersity index, and at 4 °C for ten days (D) the hydrodynamic diameter, (E) zeta potential and (F) polydispersity index, (mean ± SD, n = 3). | ||
The results showed acceptable stability of PEGLippH,PEGLippH-ECγCD, and AptNCL-PEGLippH-ECγCD at tested temperatures as indicated by minimal changes in the mean size, zeta potential, and PDI.
The lipid bilayer of liposomes grafted with PEG2000 and AptNCL was simulated to investigate the stability, distribution, and packing of lipids. The top view, side view, and tilt of the bilayer for the primary sheet composed of different types of lipids showed stable and uniform distribution of DPPC, DOPE, cholesterol, DSPE-PEG2000, and CHO-AptNCL (Fig. 7A–C), respectively.
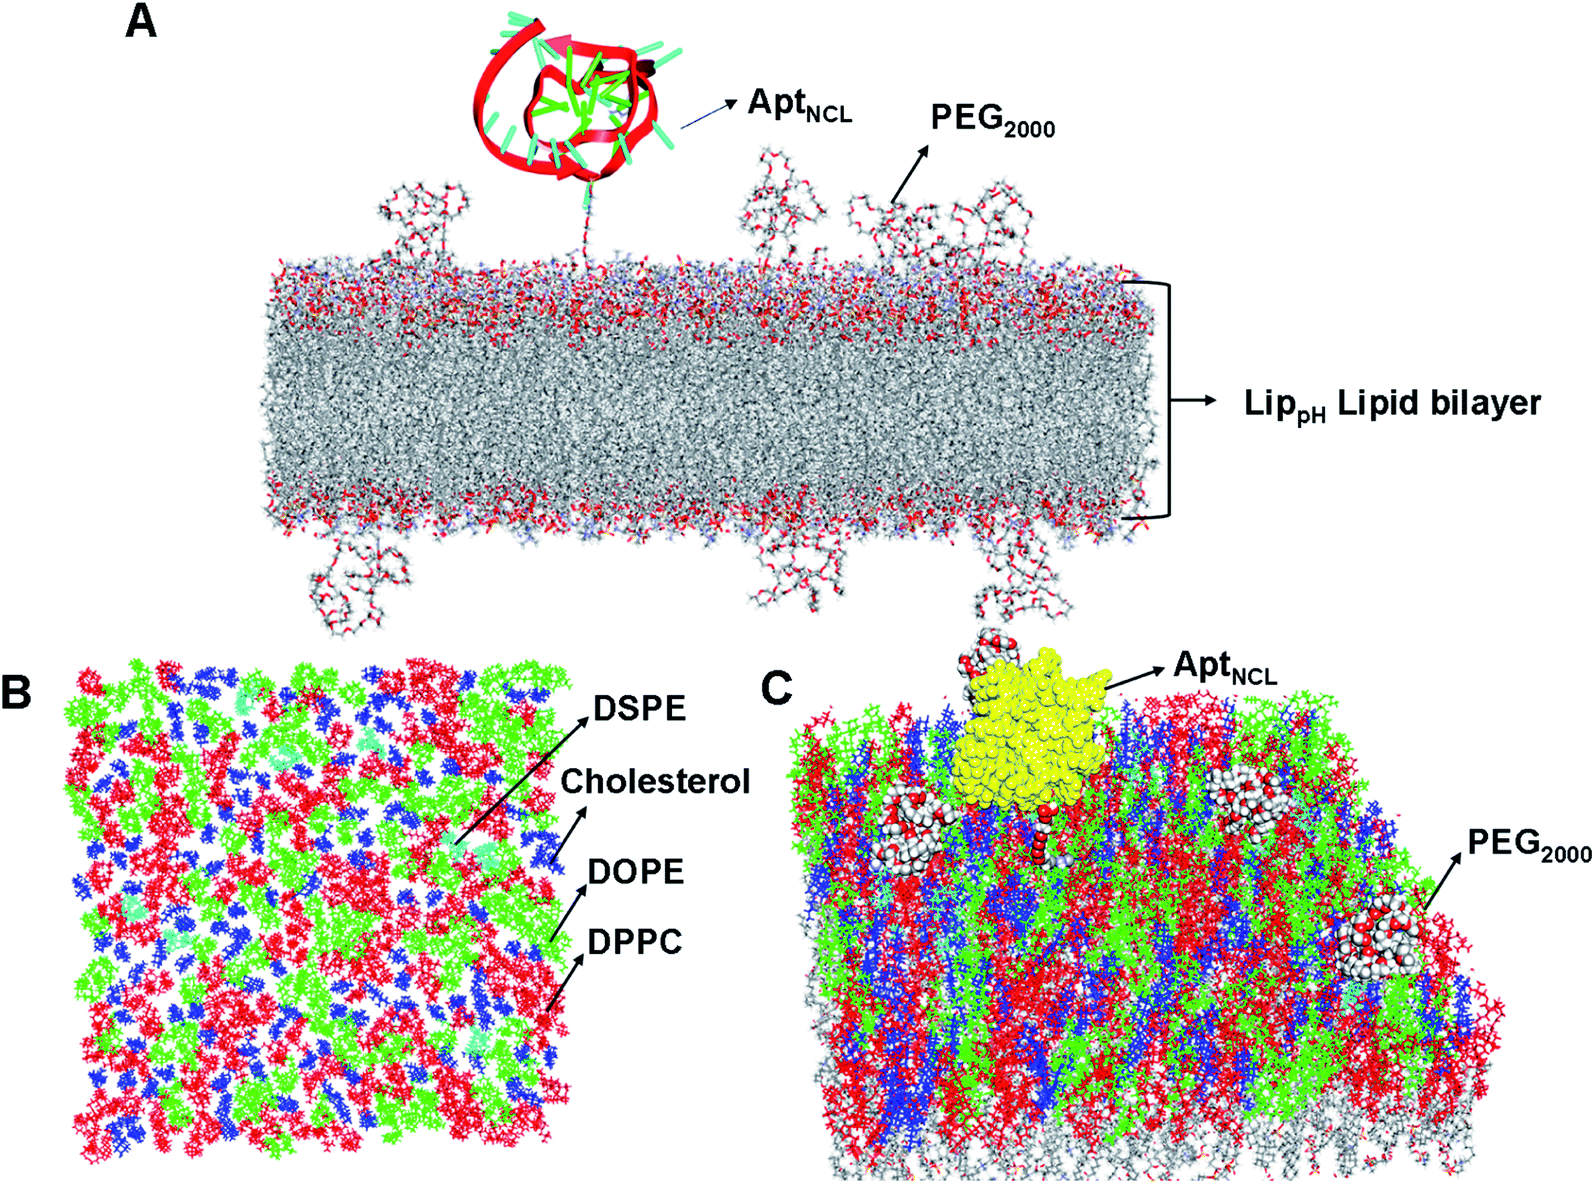 | ||
| Fig. 7 Distribution and packing of different lipids (DDPC, DOPE, DSPE, and CHO), PEG2000, and AptNCL in the computationally designed bilayer. (A) The top view of the bilayer for the primary sheet composed of different types of lipids, DPPC, DOPE, cholesterol, and DSPE are shown in red, green, blue, and cyan, respectively. (B) Side view of the bilayer composed of different lipids, PEG2000, and the aptamer. (C) Tilt view of the bilayer after full minimization for the most stable state, the yellow color is used for the aptamer, other color codes as described before. | ||
3.8. Cytotoxicity study
MTT assay was performed to investigate the cytotoxic effects of free EC, PEGLippH-ECγCD, and AptNCL-PEGLippH-ECγCD in terms of the absolute IC50 after 72 h treatment incubation for MDA-MB-231, MCF7, A549, and normal fibroblast cells.Fig. 8A–D represents the viability dose–response curve and the absolute IC50 of free EC, PEGLippH-ECγCD, and AptNCL-PEGLippH-ECγCD for 72 h treatment incubation of MDA-MB-231, A549, MCF7 cancer cell lines, and fibroblast cells, respectively. The cytotoxicity results showed a higher anti-proliferative effect for AptNCL-PEGLippH-ECγCD compared to PEGLippH-ECγCD and were 1.5, 2, and 5 folds for A549, MCF7, and MDA-MB-231, respectively, after 72 h treatment incubation Fig. 8E.
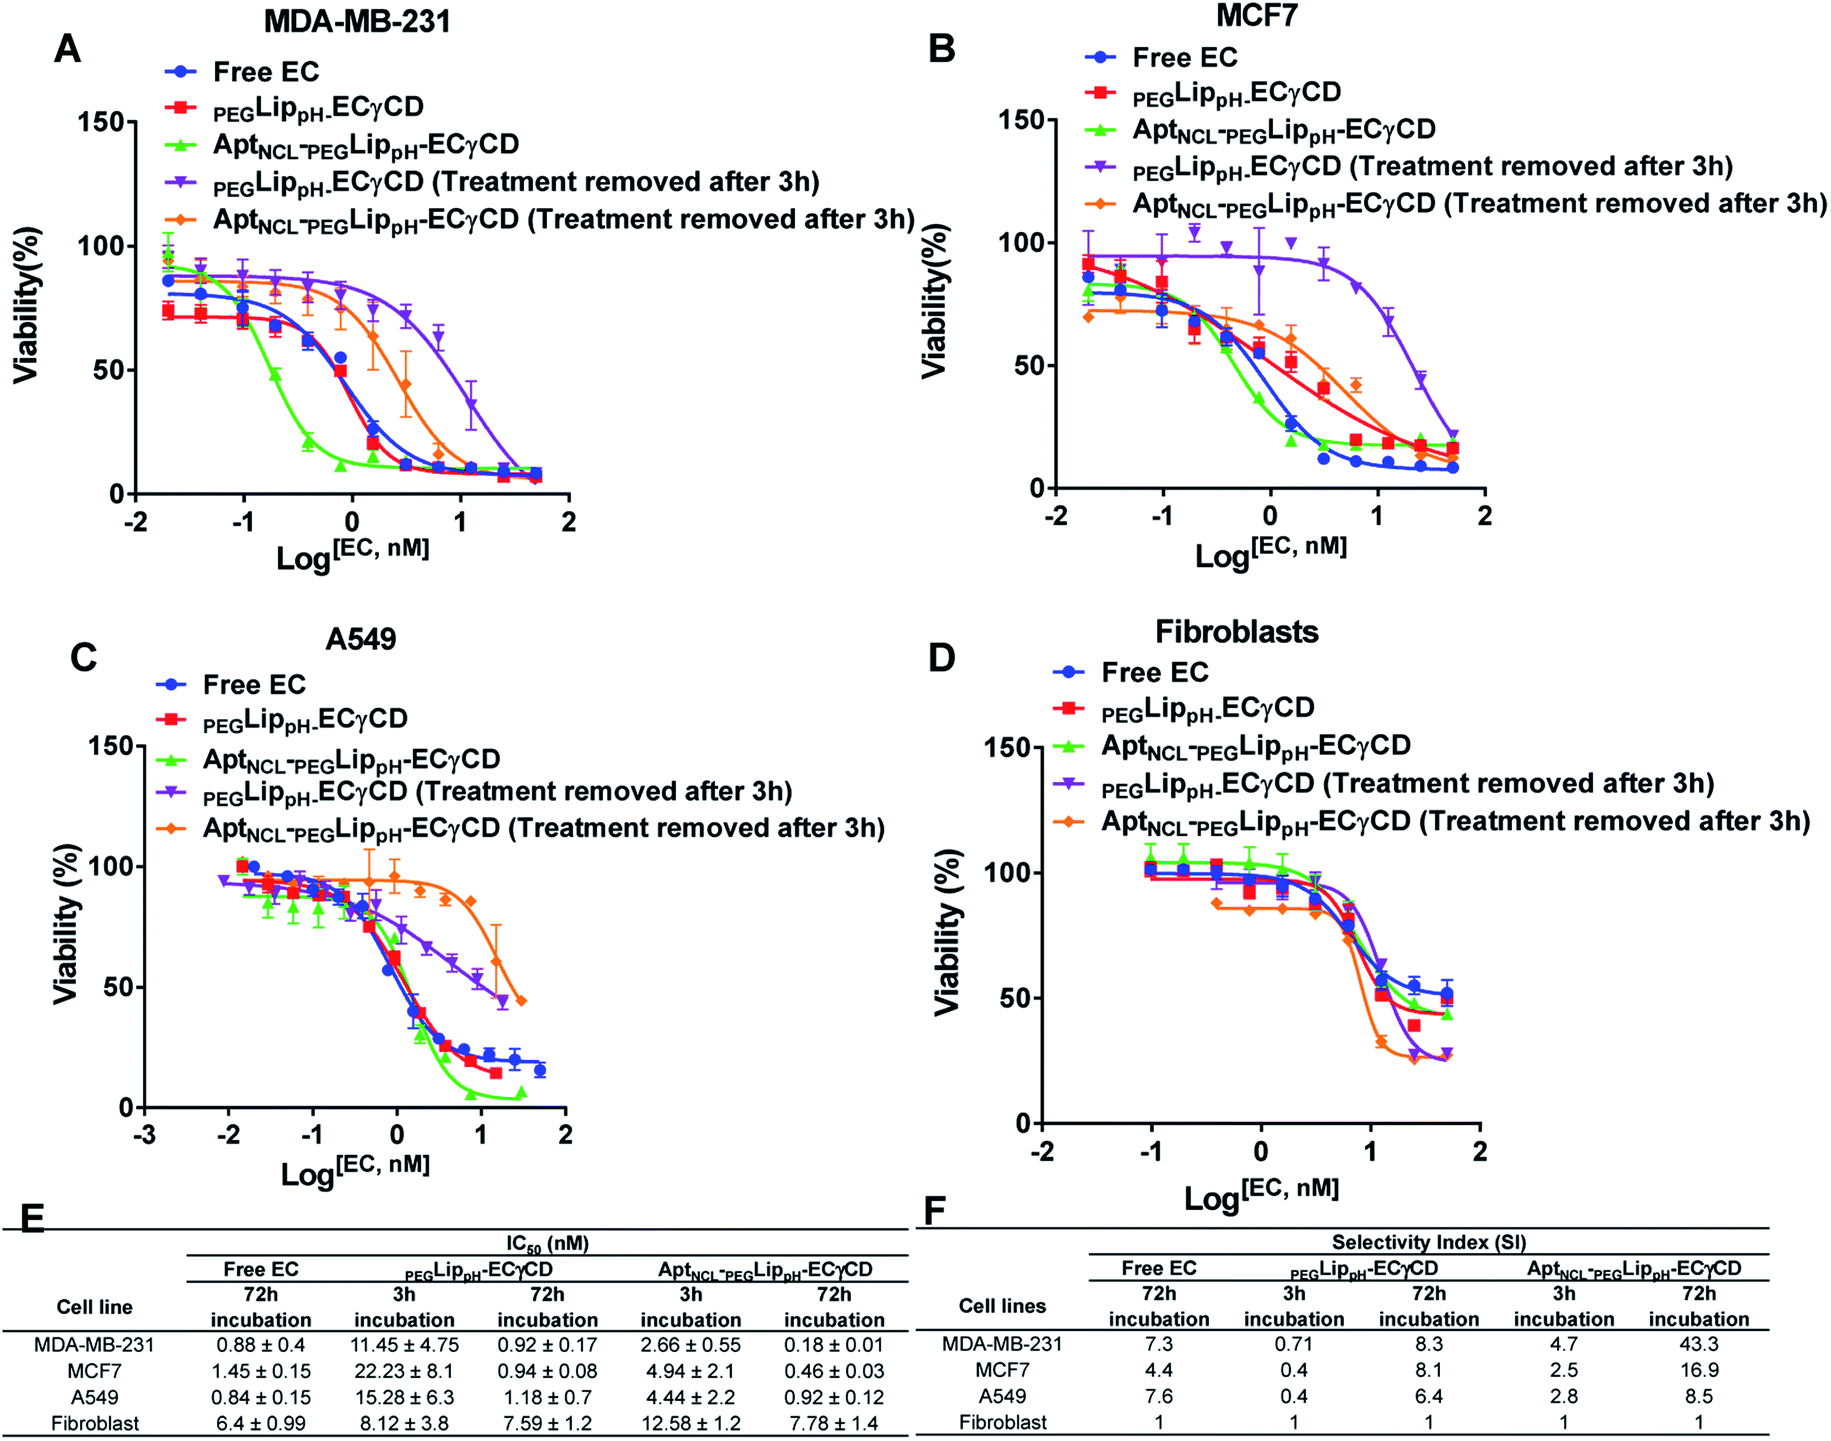 | ||
| Fig. 8 Viability assay of both breast cancer cells, (A) MDA-MB-231 and (B) MCF-7 (C) small cell lung cancer (A549) and (D) normal cell fibroblast when treated with free EC, LippH-ECγCD and AptNCL-LippH -ECγCD at different concentrations of EC range from 0 to 50 nM for 72 h and 3 h. (E) and (F) Table of IC50 and selectivity index for the four cell types. (mean ± SD, n = 3). | ||
Moreover, Fig. 8A–D showed the selective localization of AptNCL-PEGLippH-ECγCD versus PEGLippH-ECγCD after adding the treatment for 3 h to allow binding of EC loaded nanoparticles to the cell surface and to be internalized into the cell cytoplasm. The remaining free treatment was removed, and the cells were incubated for 72 h.
These results were consistent with the previously described cellular uptake study of unloaded AptNCL-PEGLippH and PEGLippH (≥2 folds for all cells) using flow cytometry. However, selectivity values in terms of cell viability were higher, which reflects the high potency of echinomycin drug.
The IC50 values of free EC and PEGLippH-ECγCD were around 1 nM for all investigated cancer cell lines and were around 6 nM for fibroblast cells. The IC50 for PEGLippH-ECγCD and AptNCL-PEGLippH-ECγCD were about 7.5 nM for the fibroblast cells. Furthermore, the IC50 of AptNCL-PEGLippH-ECγCD for fibroblast was higher than PEGLippH-ECγCD IC50 by 1.5 folds (Fig. 8E) when treatment was removed after 3 h incubation. These findings are in favor of echinomycin (either free or formulated) as more cytotoxic for cancer cells than normal cells.
It is revealed from Fig. 8E that the in vitro cytotoxicity of AptNCL-PEGLippH-ECγCD in terms of IC50 against MDA-MB-231, MCF7, A549 were 0.18 ± 0.01, 0.46 ± 0.03 and 0.92 ± 0.12, respectively, compared to PEGLippH-ECγCD, which where 0.92 ± 0.17, 0.94 ± 0.08 and 1.18 ± 0.7, respectively. The viability results provided a promising potential for selectivity and higher toxicity of AptNCL-PEGLippH-EC-γCD over non functionalized formulations into cancer cells.
The cytotoxicity results and conclusions are consistent with previous studies. For example, in vivo and an in vitro study conducted by Xing et al., (2013) showed aptamer-liposomes bind with high affinity and specificity to nucleolin cell surface receptors, which overexpressed on MCF-7.51 Moreover, Liao et al., (2015) conjugated liposomes encouraged the specific binding of liposomes to the nucleolin receptors, improving the affinity and cellular uptake by tumor cells more than plain liposomes.52
The selectivity index (SI) of anticancer drugs, measures the window between toxicity against normal cells and anticancer activity. The higher the SI ratio, the more effective and safer a drug during in vivo treatment for anti-cancer drugs.53 An SI value greater than 2 indicates that the compound is more than twice cytotoxic to the tumor cell line compared to the normal cell line, while SI <2 means that the drug has general toxicity.53
Selectivity indices are shown in Fig. 8F for the tested PEGLippH-ECγCD, and AptNCL-PEGLippH-ECγCD against the cancer cell lines (A549, MDA-MB-231, and MCF7) and normal fibroblast cells. The selectivity index (SI) of AptNCL-PEGLippH-ECγCD for tumor cell lines compared to the normal cell line after 72 h was 43.3 (MDA-MB-23), 16.9 (MCF7) and 8.5 (A549). Furthermore, SI after 3 h were found 4.7, 2.5, 2.8, respectively. These results confirmed the selectivity of aptamer-guided drug delivery systems, especially SI after 3 h. In addition, the selectivity index (SI) of PEGLippH-ECγCD for tumor cell lines compared to the normal cell line after 72 h was 8.3 (MDA-MB-231), 8.1 (MCF7), and 6.4 (A549). Furthermore, SI after 3 h were found to be 0.71, 0.4, 0.4, respectively. Based on the SI of PEGLippH-ECγCD after 72 h, selectivities were comparable for the three cancer cell lines and it is proposed that PEGLippH-ECγCD is more toxic on cancer cells than on normal cells. Whereas, after 3 h, the SI indicated that PEGLippH-ECγCD was retained in the cell and then released in a controlled manner over a longer time. In general, both PEGLippH-ECγCD and AptNCL-PEGLippH-ECγCD showed higher selectivity toward cancer cells than normal cells.
3.9. Lyophilization of the liposomal formulation
Lyophilization of liposomal formulations is a commonly used method to increase liposomal stability and shelf life. Lyoprotectants such as sucrose, maltose, lactose, and trehalose are needed to prevent liposomal collapse during the lyophilization process and vesicle fusion upon rehydration.54 Freshly prepared liposomal suspensions were freeze-dried in the presence of either trehalose or sucrose in ratios; 1%, 2.5%, 5%, and 10%. It is worth mentioning that protected liposomes were significantly lower in size and PDI than unprotected liposomes, which means that both sugars protect liposomes from fusion and become larger in size after rehydration, (Table S1†). Sucrose and trehalose were used as cryoprotectants. Both sugars resulted in stable particle size upon reconstitution. However, sucrose was slightly better than trehalose. This can be explained due to the condition of the freeze dryer, which was used, and the lowest temperature and pressure that can be reached.54Lyophilization of the final formulation was successfully performed using 5% sucrose as a cryoprotectant. This was illustrated in (Fig. 9A and B). The stability of the final lyophilized formulations was investigated by measuring the changes in the mean size, size distribution (PDI), Z-potential, and EE% blank PEGLippH,PEGLippH-ECγCD, and AptNCL-PEGLippH-ECγCD after rehydration (Fig. 9A). Moreover, the results showed acceptable stability of both blank and loaded liposomes indicated by minimal changes in the mean size, PDI, and EE%. In addition, PEGLippH-ECγCD and AptNCL-PEGLippH-ECγCD retained their cytotoxic and targeting functions by measuring their anti-proliferative activity on the MDA-MB-231 breast cancer cell line (Fig. 9C). Indeed, the toxicity of AptNCL-PEGLippH-ECγCD was 2.7 fold higher than that of PEGLippH-ECγCD.
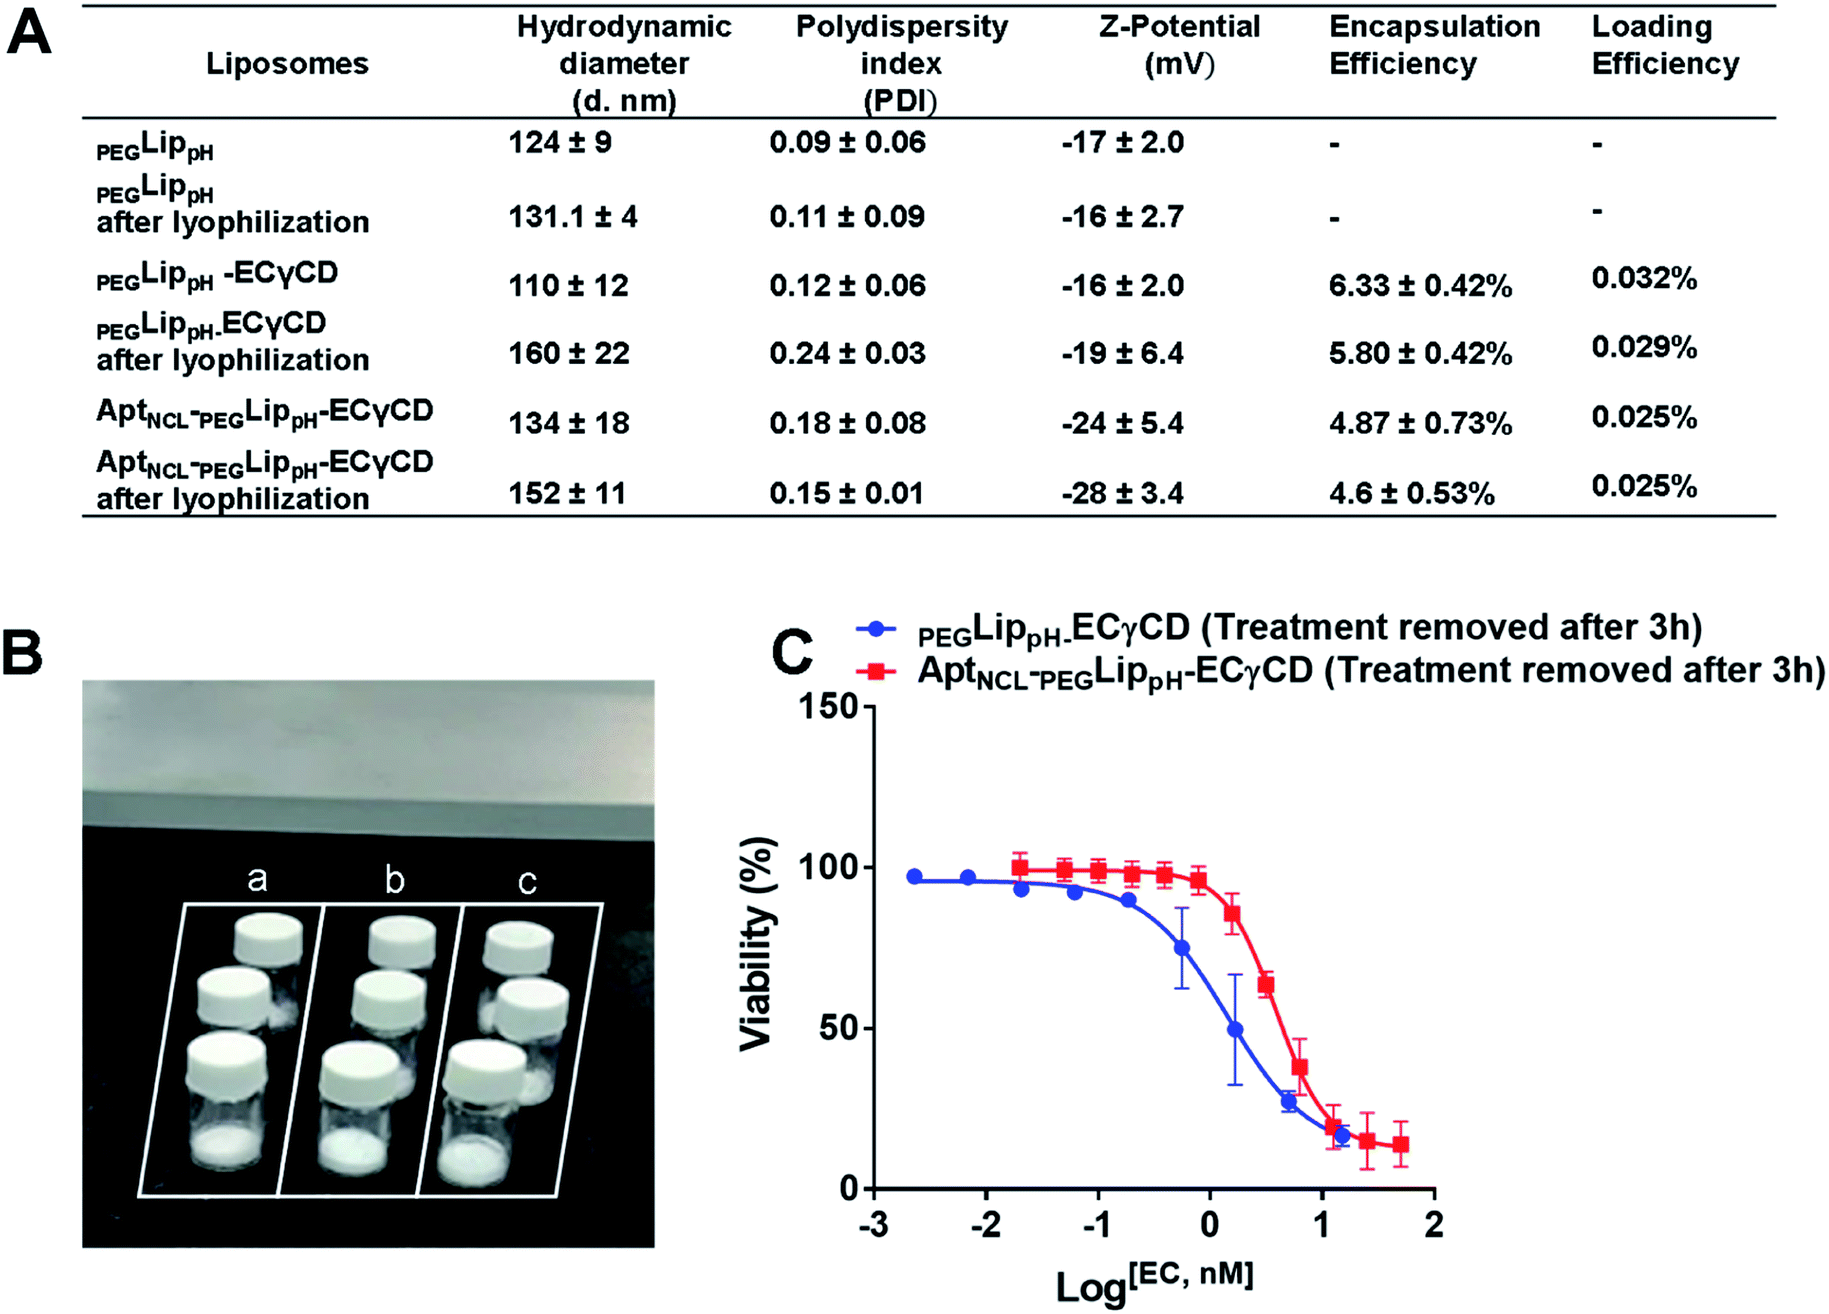 | ||
| Fig. 9 (A) Table showing the effect of lyophilization on the stability of PEGLippH,PEGLippH-ECγCD, and AptNCL-PEGLippH-ECγCD in terms of mean hydrodynamic diameter, PDI, and zeta potential, encapsulation efficiency, and drug loading (B) successfully prepared lyophilized liposomes. Labels: a, PEGLippH; b, PEGLippH-ECγCD; and c, AptNCL-PEGLippH-ECγCD (C) the dose–response curve for MDA-MB-231breast cancer cells treated with lyophilized AptNCL-PEGLippH-ECγCD and PEGLippH-ECγCD (treatment was removed after 3 h). (mean ± SD, n = 3). | ||
4. Conclusions
Smart and multifunctional aptamer-guided and PEGylated pH-sensitive liposomes were designed, formulated, and fully characterized. These liposomes were stable at physiological pH and released their payload at low pH. Particle size, size distribution and charge stability were evaluated at storage and physiological temperatures. These smart-multifunctional liposomes were tested for pH sensitivity and release using calcein dye and echinomycin. Both the dye and the potent anticancer antibiotic drug, echinomycin, were successfully encapsulated inside liposomes. AptNCL-PEGLippH-EC-γCD exhibited excellent selectivity and cytotoxic activity on three cancer cell lines (MCF7, MDA-MB-231, and A549) compared to normal cells. The current aptamer-guided pH-sensitive liposomes can be used as a delivery system for other therapeutic molecules. Moreover, in vivo and mechanistic studies can provide valuable information about the antitumor efficacy and more understanding of the mechanism of selective uptake by cancer cells.Conflicts of interest
The authors declare no conflict of interest.Acknowledgements
The authors would like to the thank Ms Shrouq Alsotari and Ms Rula Buqaien at Cell Therapy Center for support and advice on experiments.References
- K. R. Fox and E. Kentebe, Nucleic Acids Res., 1990, 18, 1957–1963 CrossRef CAS PubMed.
- Y. Wang, Y. Liu, S. N. Malek, P. Zheng and Y. Liu, Cell Stem Cell, 2011, 8, 399–411 CrossRef CAS PubMed.
- Y.-S. Park, W.-S. Shin and S.-K. Kim, J. Antimicrob. Chemother., 2008, 61, 163–168 CrossRef CAS PubMed.
- M. Sato, T. Nakazawa, Y. Tsunematsu, K. Hotta and K. Watanabe, Curr. Opin. Chem. Biol., 2013, 17, 537–545 CrossRef CAS PubMed.
- M. M. Van Dyke and P. B. Dervan, Science, 1984, 225, 1122–1127 CrossRef CAS PubMed.
- W. J. Gradishar, N. J. Vogelzang, L. J. Kilton, S. J. Leibach, A. W. Rademaker, S. French and A. B. Benson, Invest. New Drugs, 1995, 13, 171–174 CrossRef CAS PubMed.
- H. Shelley and R. J. Babu, J. Pharm. Sci, 2018, 107, 1741–1753 CrossRef CAS PubMed.
- T. Loftsson and D. Duchêne, Int. J. Pharm., 2007, 329, 1–11 CrossRef CAS PubMed.
- W. Alshaer, M. Zraikat, A. Amer, H. Nsairat, Z. Lafi, D. A. Alqudah, E. Al Qadi, T. Alsheleh, F. Odeh and A. Alkaraki, RSC Adv., 2019, 9, 30976–30988 RSC.
- I.-Y. Kim, Y.-S. Kang, D. S. Lee, H.-J. Park, E.-K. Choi, Y.-K. Oh, H.-J. Son and J.-S. Kim, J. Controlled Release, 2009, 140, 55–60 CrossRef CAS PubMed.
- Y. Kumar, K. Kuche, R. Swami, S. S. Katiyar, D. Chaudhari, P. B. Katare, S. K. Banerjee and S. Jain, Int. J. Pharm., 2020, 573, 118889 CrossRef CAS PubMed.
- K. Jabin, Z. Husian, M. A. Zahid and P. Kushwaha, World J. Pharm. Pharm. Sci., 2018, 7, 1307–1319 CAS.
- U. Bulbake, S. Doppalapudi, N. Kommineni and W. Khan, Pharmaceutics, 2017, 9, 12 CrossRef PubMed.
- C. Chen, D. Han, C. Cai and X. Tang, J. Controlled Release, 2010, 142, 299–311 CrossRef CAS PubMed.
- M. R. Rao and L. S. Babrekar, Indian J. Pharm. Sci., 2018, 80, 1115–1124 CAS.
- Y. Ito, Photochemistry for Biomedical Applications: From Device Fabrication to Diagnosis and Therapy, Springer, 2018 Search PubMed.
- M. Waring and L. Wakelin, Nature, 1974, 252, 653–657 CrossRef CAS PubMed.
- H. Sun, X. Zhu, P. Y. Lu, R. R. Rosato, W. Tan and Y. Zu, Mol. Ther.--Nucleic Acids, 2014, 3, e182 CrossRef CAS PubMed.
- W. Alshaer, H. Hillaireau and E. Fattal, Adv. Drug Delivery Rev., 2018, 134, 122–137 CrossRef CAS PubMed.
- Y. Lee and D. H. Thompson, Wiley Interdiscip. Rev.: Nanomed. Nanobiotechnol., 2017, 9, e1450 Search PubMed.
- C.-J. Chu and F. C. Szoka, J. Liposome Res., 1994, 4, 361–395 CrossRef.
- D. Collins, Liposomes as tools in basic research and industry, 1995, vol. 13, pp. 201–214 Search PubMed.
- Y. Chen, Q. Du, Y. Zou, Q. Guo, J. Huang, L. Tao, X. Shen and J. Peng, Int. J. Pharm., 2020, 584, 119446 CrossRef CAS PubMed.
- R. M. Sawant, J. Hurley, S. Salmaso, A. Kale, E. Tolcheva, T. Levchenko and V. Torchilin, Bioconjugate Chem., 2006, 17, 943–949 CrossRef CAS PubMed.
- R. R. Sawant and V. P. Torchilin, Soft Matter, 2010, 6, 4026–4044 RSC.
- A. U. Rehman, Z. Omran, H. Anton, Y. Mély, S. Akram, T. F. Vandamme and N. Anton, Eur. J. Pharm. Biopharm., 2018, 133, 331–338 CrossRef CAS PubMed.
- A. Akbarzadeh, R. Rezaei-Sadabady, S. Davaran, S. W. Joo, N. Zarghami, Y. Hanifehpour, M. Samiei, M. Kouhi and K. Nejati-Koshki, Nanoscale Res. Lett., 2013, 8, 1–9 CrossRef PubMed.
- M. S. Franco, C. A. Silva, E. A. Leite, J. N. Silveira, C. S. Teixeira, V. N. Cardoso, E. Ferreira, G. D. Cassali, A. L. B. de Barros and M. C. Oliveira, J. Drug Delivery Sci. Technol., 2021, 102400 CrossRef CAS.
- S. J. Routledge, J. A. Linney and A. D. Goddard, Biochem. Soc. Trans., 2019, 47, 919–932 CrossRef CAS PubMed.
- A. Sharma and U. S. Sharma, Int. J. Pharm., 1997, 154, 123–140 CrossRef CAS.
- T. Ishida, Y. Okada, T. Kobayashi and H. Kiwada, Int. J. Pharm., 2006, 309, 94–100 CrossRef CAS PubMed.
- M. Z. Lai, W. J. Vail and F. C. Szoka, Biochemistry, 1985, 24, 1654–1661 CrossRef CAS PubMed.
- S. Ghanbarzadeh, A. Khorrami, L. Mohamed Khosroshahi and S. Arami, Pharm. Biol., 2014, 52, 848–854 CrossRef CAS PubMed.
- W. Alshaer, H. Hillaireau, J. Vergnaud, S. Ismail and E. Fattal, Bioconjugate Chem., 2015, 26, 1307–1313 CrossRef CAS PubMed.
- A. D. Bangham and R. Horne, J. Mol. Biol., 1964, 8, 660 CrossRef CAS PubMed.
- F. Odeh, S. I. Ismail, R. Abu-Dahab, I. S. Mahmoud and A. Al Bawab, Drug Delivery, 2012, 19, 371–377 CrossRef CAS PubMed.
- A. Laouini, C. Jaafar-Maalej, I. Limayem-Blouza, S. Sfar, C. Charcosset and H. Fessi, J. Colloid Sci. Biotechnol., 2012, 1, 147–168 CrossRef CAS.
- H. Nsairat, I. S. Mahmoud, F. Odeh, D. Abuarqoub, H. Al-Azzawi, R. Zaza, M. I. Qadri, S. Ismail, A. Al Bawab, A. Awidi and W. Alshaer, RSC Adv., 2020, 10, 36219–36229 RSC.
- W. Alshaer, H. Hillaireau, J. Vergnaud, S. Mura, C. Deloménie, F. Sauvage, S. Ismail and E. Fattal, J. Controlled Release, 2018, 271, 98–106 CrossRef CAS PubMed.
- H. Karanth and R. S. Murthy, J. Pharm. Pharmacol., 2007, 59, 469–483 CrossRef CAS PubMed.
- C. Hamai, T. Yang, S. Kataoka, P. S. Cremer and S. M. Musser, Biophys. J., 2006, 90, 1241–1248 CrossRef CAS PubMed.
- I. R. Cooke and M. Deserno, Biophys. J., 2006, 91, 487–495 CrossRef CAS PubMed.
- P. R. Cullis and B. De Kruijff, Biochim. Biophys. Acta, 1978, 507, 207–218 CrossRef CAS.
- M.-L. Briuglia, C. Rotella, A. McFarlane and D. A. Lamprou, Drug Delivery Transl. Res., 2015, 5, 231–242 CrossRef CAS PubMed.
- S. Kaddah, N. Khreich, F. Kaddah, C. Charcosset and H. Greige-Gerges, Food Chem. Toxicol., 2018, 113, 40–48 CrossRef CAS PubMed.
- C. Demetzos, J. Liposome Res., 2008, 18, 159–173 CrossRef CAS PubMed.
- M. L. Immordino, F. Dosio and L. Cattel, Int. J. Nanomed., 2006, 1, 297 CrossRef CAS PubMed.
- E. M. Reyes-Reyes, Y. Teng and P. J. Bates, Cancer Res., 2010, 70, 8617–8629 CrossRef CAS PubMed.
- E. M. Reyes-Reyes, F. R. Salipur, M. Shams, M. K. Forsthoefel and P. J. Bates, Mol. Oncol., 2015, 9, 1392–1405 CrossRef CAS PubMed.
- S. Simoes, J. N. Moreira, C. Fonseca, N. Duzgunes and M. C. de Lima, Adv. Drug Delivery Rev., 2004, 56, 947–965 CrossRef CAS PubMed.
- H. Xing, L. Tang, X. Yang, K. Hwang, W. Wang, Q. Yin, N. Y. Wong, L. W. Dobrucki, N. Yasui, J. A. Katzenellenbogen, W. G. Helferich, J. Cheng and Y. Lu, J. Mater. Chem. B, 2013, 1, 5288–5297 RSC.
- Z. X. Liao, E. Y. Chuang, C. C. Lin, Y. C. Ho, K. J. Lin, P. Y. Cheng, K. J. Chen, H. J. Wei and H. W. Sung, J. Controlled Release, 2015, 208, 42–51 CrossRef CAS PubMed.
- C. Bézivin, S. Tomasi, F. Lohézic-Le Dévéhat and J. Boustie, Phytomedicine, 2003, 10, 499–503 CrossRef PubMed.
- S. Franze, F. Selmin, E. Samaritani, P. Minghetti and F. Cilurzo, Pharmaceutics, 2018, 10, 139 CrossRef CAS PubMed.
Footnote |
| † Electronic supplementary information (ESI) available. See DOI: 10.1039/d1ra05138e |
| This journal is © The Royal Society of Chemistry 2021 |