 Open Access Article
Efficient visible-light photocatalytic H2 evolution with heterostructured Ag2S modified CdS nanowires†
Congrong Lu‡
a,
Shiwen Du‡b,
Yanfei Zhaoa,
Qi Wanga,
Kuankuan Ren a,
Chunhe Li
 *a and
Weidong Dou*a
aLaboratory of Low-dimensional Carbon Materials, Department of Physics, Shaoxing University, Shaoxing 312000, China. E-mail: chunhe@whu.edu.cn; phyth@usx.edu.cn
bDalian Institute of Chemical Physics, Chinese Academy of Sciences, Dalian National Laboratory for Clean Energy, Dalian 116023, China
First published on 20th August 2021
Abstract
The low separation efficiency of photogenerated charges and severe photocorrosion seriously impeded the application of CdS in photocatalytic water splitting. Here we report new routes to improve the photocatalytic performance of CdS nanowires (NWs) by decorating with Ag2S nanoparticles, so Ag2S/CdS heterojunction is constructed. The Ag2S/CdS heterojunction exhibited optimal photocatalytic H2 evolution rate of 777.3 μmol h−1 g−1, which is 12.1 times higher than that of pure CdS. The intrinsic characteristics of Ag2S/CdS nanocomposites, such as structure, optical properties, and surface chemical state are systematically studied by experimental characterizations and theoretical calculations. The comprehensive analysis demonstrates that the heterojunction between Ag2S and CdS accelerates photoinduced electrons transfer from CdS to Ag2S, enhancing their ability for water splitting. Meanwhile, the holes on the valence band of CdS react with the sacrificial agents, thus leading to the efficient separation of photogenerated electron–hole pairs. This work offers a simple route to synthesize one-dimensional CdS-based nanocomposites for efficient energy conversion driven by visible light.
1. Introduction
Water splitting for hydrogen evolution by semiconductor photocatalysts is one of the most promising solutions to alleviate the energy crisis. To improve solar-to-hydrogen energy conversion efficiency, numerous photocatalysts, such as TiO2,1 g-C3N4,2 CdS,3 ZnS,4 SrTiO3,5 and so on, have been intensively studied over the last few decades. Especially, CdS is widely considered to be the most promising candidate in photocatalytic hydrogen evolution reaction (HER) due to its outstanding properties such as the proper band edge locations, moderate bandgap, and strong visible light absorption.However, the high recombination rate of photogenerated charges and severe photocorrosion seriously hinder the application of CdS. Therefore, it is urgent to improve the electron–hole separation rate and enhance the photocatalytic stability for CdS. In recent years, one-dimensional (1D) nanostructured materials are extensively constructed because they have high aspect rations which are beneficial for H2 evolution. It's well-known that 1D nanomaterials can accelerate the long-distance charge transfer velocity since 1D constructure provides a direct charge transport path along the axial direction for direct conduction.6 In addition, the 1D materials can also enhance light-harvesting capacity and scattering properties which are substantially important for hydrogen evolution. As one of the outstanding examples of the 1D catalysts, CdS nanowires (NWs) have been successfully synthesized and used for photocatalytic HER. Nevertheless, the photocatalytic activity of CdS NWs is still unsatisfactory because of their poor reusability and depressed hydrogen production. Recently, it was demonstrated that the photocatalytic performance can be substantially improved by combining CdS with other cocatalysts including metal/alloy, metal phosphides, metal oxide/hydroxide, carbide, perovskite nanocrystals, metal sulfides, metal organic frame and so on. Especially, transition metal sulfides have attracted great attention owing to their unique optical, electrical, electrochemical, and other properties. For instance, 1D/2D CdS/CoSx heterojunction was found to be very efficient for the hydrogen evolution;7 CdS–MnS composite had very high stability which can maintain its catalytic ability for over 42 h of measurement,8 MoS2 NSs–CdS NWs system also possessed high visible-light H2 evolution rate that far exceeded pure CdS NWs.9
As a typical transition metal sulfide, Ag2S, with admirable photosensitive and low bandgap (0.9–1.2 eV),10 was extensively used in binary or ternary photocatalysts, such as rGO/Ag2S/g-C3N4,11 CdS/Ag2S/g-C3N4,12 Ag2S/ZnS,13 and MoS2/Ag2S/Ag.14 In addition, Ag2S/CdS structure was also demonstrated to possess superior photocatalytic degradation performance under visible light irradiation.15 However, there are few reports on studying the influence of Ag2S on CdS NWs in the photocatalytic hydrogen evolution.
In this work, we studied the photocatalytic HER activity of CdS NWs modified by Ag2S nanoparticles (NPs) via a simple in situ ion exchange method. It was found that the 5.0%-Ag2S/CdS exhibited optimal photocatalytic H2 evolution rate of 777.3 μmol h−1 g−1, which was 12.1 times higher than that of pure CdS NWs. The results exhibited that a heterojunction is formed at the interface between Ag2S NPs and CdS NWs, and the co-catalyzed Ag2S NPs provide active sites and trap photogenerated electrons, which results in efficient separation of “electron–hole” pairs. In addition, theoretical calculations based on density functional theory (DFT) were carried out to uncover the behind mechanism for the enhancement of photocatalytic activity. Our work demonstrates that Ag2S NPs can be served as outstanding cocatalysts in the field photocatalytic HER from water splitting.
2. Experimental section
2.1. Chemicals
All chemical reagents are analytical grade and purchased from Aladdin Chemical Reagent Co., Ltd, AR. The ultrapure water (≥18 MΩ cm@25 °C) used in the whole experiment was purified from tap water in the laboratory.2.2. Photocatalyst synthesis
| CdS ⇄ Cd2+ + S2− | (1) |
| 2Ag+ + S2− ⇄ Ag2S | (2) |
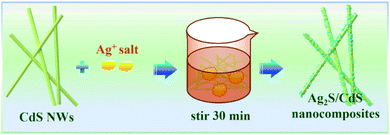
As given in eqn (1), there is a small amount of S2− in the reaction solution around the CdS nanowires, due to the dynamic equilibrium. When AgNO3 was added in the suspension, nanosized Ag2S particles were preferentially formed and deposited on the CdS surface by the heterogeneous nucleation (eqn (2)). The solubility product constant (Ksp) of CdS and Ag2S is 8.0 × 10⁻²⁷ and 6.3 × 10−50, respectively.17 Such large difference in solubility provides the driving force for cation exchange, forming the final Ag2S/CdS composites.
Finally, the products were obtained by centrifugation, alternately rinsed with ultrapure water and ethanol several times, and dried at 60 °C for overnight. For comparison, the Ag2S/CdS nanocomposites with various content of Ag2S NPs were synthesized under the same condition. The ingredient molar rations of Ag2S![[thin space (1/6-em)]](https://www.rsc.org/images/entities/char_2009.gif) :
:![[thin space (1/6-em)]](https://www.rsc.org/images/entities/char_2009.gif) CdS are 0.010, 0.025, 0.050 0.075, 0.100, and donated as 1.0%-Ag2S/CdS, 2.5%-Ag2S/CdS, 5.0%-Ag2S/CdS, 7.5%-Ag2S/CdS, and 10.0%-Ag2S/CdS, respectively.
CdS are 0.010, 0.025, 0.050 0.075, 0.100, and donated as 1.0%-Ag2S/CdS, 2.5%-Ag2S/CdS, 5.0%-Ag2S/CdS, 7.5%-Ag2S/CdS, and 10.0%-Ag2S/CdS, respectively.
Details of characterization methods and parameters, photoelectrochemical parameters, photocatalytic H2 evolution evaluation experiment, and theoretical calculation are available in the ESI.†
3. Results and discussions
3.1. Photocatalytic hydrogen evolution performance
The H2 evolution performances of pure CdS and Ag2S/CdS nanocomposites were evaluated under visible-light irradiation. Fig. 1a presented the cumulative H2 production of the as-prepared samples. Intuitively, bare CdS shows a poor photocatalytic activity, which is attributed to the low separation efficiency of the photogenerated electron–hole pairs and serious photocorrosion. In contrast, the photocatalytic H2 evolution activities of CdS are remarkably improved when composited with Ag2S. It was found that the 5.0%-Ag2S/CdS nanocomposite can produce hydrogen of 117.0 μmol after 3 h of irradiation, which is superior to the other samples. Fig. 1b listed the H2 generation rate of all samples. It is clearly shown that the H2 evolution rate of the Ag2S/CdS nanocomposites gradually increases with the content of Ag2S increasing from 1.0% to 5.0%, and achieves a maximum value of 777.3 μmol h−1 g−1 for the 5.0%-Ag2S/CdS nanocomposite. This value is 12.1 times higher than that of pure CdS. Further increase of the Ag2S content leads to the decrement of H2 generation rate, which indicates that moderate content of Ag2S in Ag2S/CdS is needed for high performance of H2 generation. Although Ag2S NPs offer abundant surface hydrogen evolution active sites, excessive Ag2S cause severe aggregation and shielding effect for light absorption, which may result in the depression of photocatalytic activity.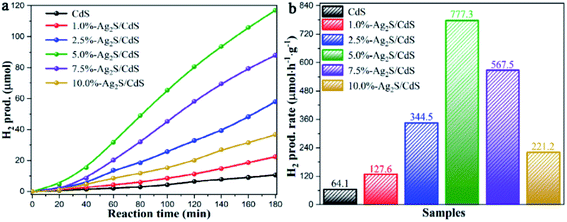 | ||
| Fig. 1 (a) Time courses of photocatalytic H2 production; and (b) comparison of the H2 generation rate of samples over CdS and Ag2S/CdS nanocomposites under visible light irradiation. | ||
3.2. Structural analysis
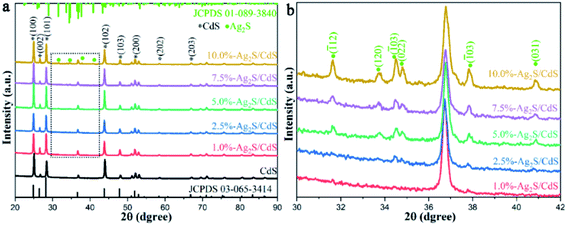
In order to understand the influence of the structure of the catalysts on their photocatalytic HER performance, X-ray diffractometer (XRD) measurements were performed to detect the crystal structures of pure CdS and Ag2S/CdS nanocomposites. As shown in Fig. 2a, it is obvious that the sharp and strong characteristic diffraction peaks located at 24.9°, 26.5°, 28.2°, 36.6°, 47.8°, 51.0°, 58.4°, and 66.8° belong to the (100), (002), (101), (102), (103), (200), (202), and (203) planes of hexagonal CdS with high crystallinity (JCPDS no. 03-065-3414), respectively.18 In addition to the diffraction peaks of pristine CdS, some new peaks at 31.5°, 33.7°, 34.4°, 34.7°, 37.7°, and 40.8° were also observed in the XRD patterns of (2.5%, 5.0%, 7.5%, 10%)-Ag2S/CdS nanocomposites (Fig. 2b). These peaks can be ascribed to the (![[1 with combining macron]](https://www.rsc.org/images/entities/char_0031_0304.gif) 12), (120), (
12), (120), (![[1 with combining macron]](https://www.rsc.org/images/entities/char_0031_0304.gif) 21), (022), (
21), (022), (![[1 with combining macron]](https://www.rsc.org/images/entities/char_0031_0304.gif) 03), and (031) faces of monoclinic Ag2S (JCPDS no. 01-089-3840), respectively.19 This observation demonstrated that Ag2S has been successfully loaded onto CdS. However, the characteristic diffraction peaks of Ag2S are hardly identified in the XRD data of 1.0%-Ag2S/CdS nanocomposite which may due to the low content of Ag2S in the Ag2S/CdS nanocomposites. Therefore, it is necessary to further prove the existence of Ag2S in Ag2S/CdS nanocomposite by other characterization techniques.
03), and (031) faces of monoclinic Ag2S (JCPDS no. 01-089-3840), respectively.19 This observation demonstrated that Ag2S has been successfully loaded onto CdS. However, the characteristic diffraction peaks of Ag2S are hardly identified in the XRD data of 1.0%-Ag2S/CdS nanocomposite which may due to the low content of Ag2S in the Ag2S/CdS nanocomposites. Therefore, it is necessary to further prove the existence of Ag2S in Ag2S/CdS nanocomposite by other characterization techniques.
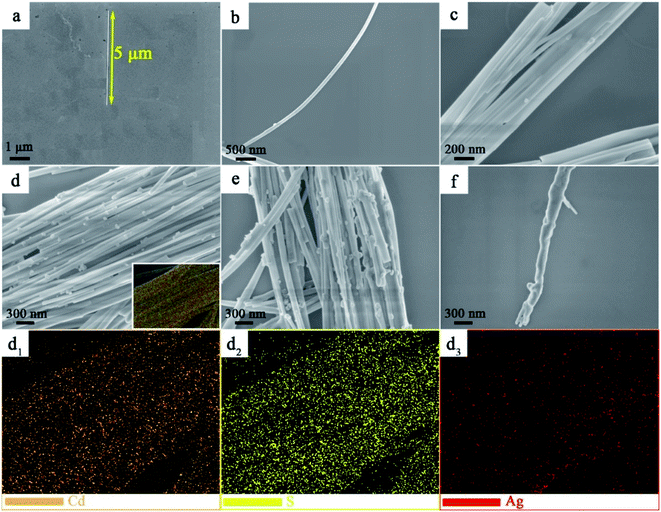
To gain deep insight into the morphology and structure of CdS and Ag2S/CdS nanocomposites, the scanning electron microscopy (SEM) images were obtained. As shown in Fig. 3a, the morphology of a single CdS displays nanowire with approximately 5 μm in length and has a clean and smooth surface. Compared with the smooth surface of CdS NWs, the Ag2S/CdS nanocomposites remain uniform nanowires, except the covering with more and more nano-scaled nanoparticles on their surfaces, as the molar ratio of Ag2S to CdS increasing from 1.0% to 10.0% (Fig. 3a–f). Fig. 3(d1–d3) display the special distribution of Cd, S, and Ag elements for the sample of 5.0%-Ag2S/CdS nanocomposite. The distribution of these elements is quite uniform and agrees with the shape of CdS NW, indicating that Ag2S NPs have well adhered onto the surface of CdS NWs. Simultaneously, the SEM results indicate the in situ ion exchange process of Ag+ is an effective method to construct Ag2S-based cocatalyst.20
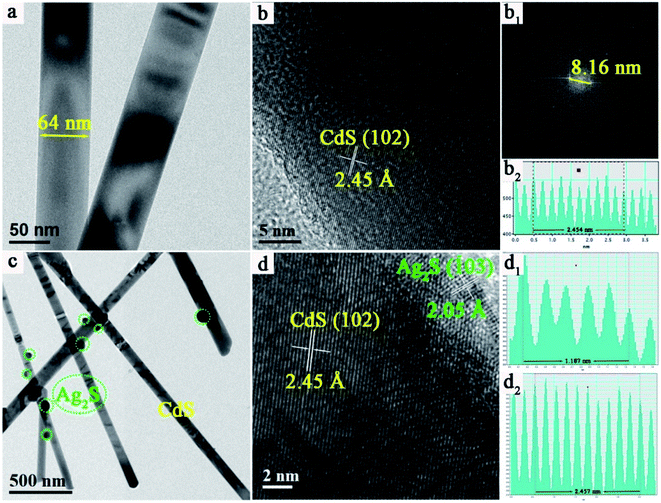
To further demonstrate the existence of Ag2S NPs on the surface of CdS NWs, transmission electron microscopy (TEM) was used to characterize the details of CdS NWs and 5.0%-Ag2S/CdS nanocomposite. As shown in Fig. 4a, pure CdS NWs display a smooth surface with approximately 64 nm in diameter. This indicates that the aspect ratio of CdS NWs is quite high. This observation agrees well with the SEM measurements as mentioned above. And the large aspect ratio of CdS NW provides a high-speed channel for carrier transmission during photocatalytic process. Fig. 4b shows the high-resolution TEM (HRTEM) image of CdS NW. The interplanar distance between two adjacent crystal planes is measured to be 2.45 Å which is agreed well with the interlayer distance of (102) plane of CdS (Fig. 4b, b1 and b2). Fig. 4c shows the low-magnified TEM image of 5.0%-Ag2S/CdS nanocomposite for which the morphology is quite different to that of pure CdS NWs. It clearly shows that some irregular particles with sizes ranging from 20 to 80 nm are randomly located on the surface of CdS NWs for the 5.0%-Ag2S/CdS nanocomposite (Fig. 4c). Fig. 4d shows the HRTEM images of 5.0%-Ag2S/CdS, the d-spacing fringes of 2.45 Å and 2.05 Å are in good agreement with CdS (102) and Ag2S (103) plane, respectively. In addition, the consecutive lattice fringes between CdS NWs, and Ag2S NPs manifest the formation of desirable heterojunction structure at their interfaces.
Fig. 5 shows nitrogen adsorption–desorption isotherms and the corresponding pore-size distribution curves of pure CdS, 5.0%-Ag2S/CdS, and 10.0%-Ag2S/CdS nanocomposites. As shown in Fig. 5a, it can be seen that the nitrogen adsorption–desorption isotherms for these three samples are type IV with hysteresis H3 hysteresis loops at the P/P0 range of 0.7–1.0 according to the IUPAC classification, indicating the existence of mesopores and large macropores.21 The BET specific surface areas, pore volumes, and average pore sizes of all of the samples are summarized in Table 1. The BET specific surface area (SBET) of the pure CdS nanowires is about 60.79 m2 g−1. After 5.0% Ag2S is coated the SBET of 5.0%-Ag2S/CdS increased to 65.15 m2 g−1. This is because the irregular Ag2S nanoparticles grow on the surface of the CdS NWs, resulting in expanded surface area. It was well-recognized that the large surface area contributes to absorbing more active species and reactants on its surface, which is beneficial to effectively promoting the photocatalytic reaction.
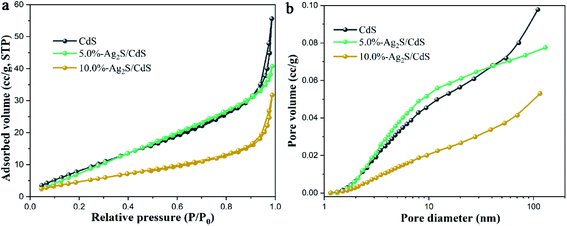 | ||
| Fig. 5 (a) N2 adsorption–desorption isotherms; and (b) the corresponding pore size distribution curves of CdS, 5.0%-Ag2S/CdS, and 10.0%-Ag2S/CdS. | ||
| Sample | SBET (m2 g−1) | Pore volume (cm3 g−1) | Average pore size (nm) |
|---|---|---|---|
| CdS | 60.79 | 0.10 | 2.32 |
| 5.0%-Ag2S/CdS | 65.14 | 0.08 | 2.10 |
| 10.0%-Ag2S/CdS | 27.35 | 0.05 | 2.11 |
As can be seen in the inset of Fig. 5b, the pristine CdS nanowires contain both mesopores (2–50 nm) and macropores (50–100 nm). The presence of small amount of Ag2S (5.0%) can introduce a lot of mesopores (2–50 nm) and thus decrease the pore volumes, and average pore sizes. However, for 10.0%-Ag2S/CdS, the further increase of the Ag2S content (from 5.0% to 10.0%) may lead to the adhesion and aggregation excessively of Ag2S on the CdS surface, which in turn reduces SBET and pore volumes. This analysis is in accordance with the SEM results.
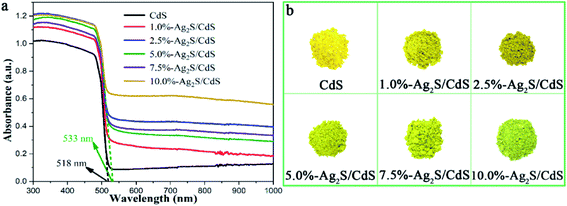
Fig. 6a displayed the UV-vis diffuse reflectance spectrometer (DRS) of CdS NWs and Ag2S/CdS nanocomposites, which has been extensively used to evaluate the optical properties of semiconductor photocatalysts. It is worth noting that the attachment of Ag2S NPs on CdS NW usually causes the narrowing of the band gap. This effect results in the red shift of the cutting edge in UV-vis spectra compared with pure CdS NWs. According to Kubelka–Munk function vs. the band-gap energy, the absorption edge of pure CdS NWs and 5.0%-Ag2S/CdS nanocomposite are located at 518 nm and 533 nm, which corresponds to a bandgap of ca. 2.39 eV and 2.33 eV. Besides, with the increment of Ag2S content, the absorption intensity of the Ag2S/CdS nanocomposites increase simultaneously in visible and near-infrared regions (520–1000 nm). The narrowed band-gap and increased absorption intensity of Ag2S/CdS nanocomposites can be ascribed to the formation of heterojunction and the high absorption cross section of Ag2S NPs (Fig. 6b).22,23 These observations indicate that these nanocomposites can produce photoexcited electron–hole pairs under visible light irradiation, thus triggering consecutive chemical redox reactions.
To further investigate the surface chemical state and bonding configuration of samples, X-ray photoelectron spectroscopy (XPS) analysis was employed. As shown in Fig. 7a, both CdS and 5.0%-Ag2S/CdS nanocomposite contain Cd, S, O and C elements. In addition, the characteristic peak of Ag was also detected, suggesting the existence of Ag2S in the Ag2S/CdS nanocomposite. Fig. 7b denoted the Cd 3d spectra of CdS and 5.0%-Ag2S/CdS nanocomposite, the two main peaks centered at 404.5 eV and 411.3 eV were thoroughly deconvolved into Cd 3d5/2 and Cd 3d3/2 of Cd2+, respectively. In Fig. 7c, the binding energies at 161.0 eV and 162.2 eV for pure CdS, and at 161.6 eV and 162.2 eV for 5.0%-Ag2S/CdS nanocomposite are indexed to S 2p3/2 and S 2p1/2 spin–orbit for S2−, respectively. The corresponding peaks of S 2p for 5.0%-Ag2S/CdS nanocomposite moved slightly toward higher binding energy than those of pure CdS. The shifting of peak positions may origin from the intimate interaction between Ag2S and CdS, which can result in the change in electron concentration on the surface of the photocatalysts. As given in Fig. 7d, two peaks located at 367.8 eV and 373.5 eV of 5.0%-Ag2S/CdS nanocomposite could be ascribed to the Ag 3d5/2 and Ag 3d3/2 of Ag+, respectively.24 The above XPS results further manifest the coexistence of CdS and Ag2S in 5.0%-Ag2S/CdS nanocomposite. Meanwhile, a heterojunction as being demonstrated by the HRTEM images shown in Fig. 5 is formed at the interface of the two components.
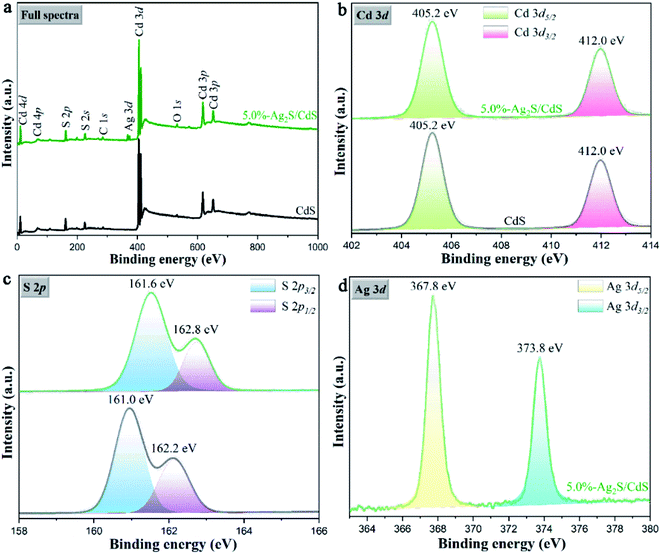 | ||
| Fig. 7 (a) Full XPS survey spectra; and high-resolution XPS spectra of (b) Cd 3d, (c) S 2p and (d) Ag 3d of the CdS and 5.0%-Ag2S/CdS nanocomposite. | ||
3.3. Photoelectric performance characterization
It is well-known that photoluminescence (PL) spectra can provide the information on separation and transfer process of photogenerated charge carriers. We carried out PL measurements to investigate the carrier behavior of CdS and Ag2S/CdS nanocomposites. The low PL intensity indicates a high electron–hole separation rate and excellent photocatalytic performance.25 Fig. 8a is the steady-state PL spectra of all samples using an excitation wavelength of 380 nm, and two obvious emission peaks at about 525 and 570 nm appeared. The emission peak at 525 nm is assigned to the near-band-gap transition in CdS, and the other emission peak at 570 nm is due to the recombination of the electron–hole pairs near the surface of the photocatalysts.26 It is worth noting that the peak intensity at 570 nm is strong. This phenomenon is ascribed to the long wire-like of CdS. Liu et al. discovered that the area of exposed nonpolar surface and degree of surface defects increase with an increase in aspect ratio.27 In our work, the aspect ratio (∼78) of long CdS nanowire is quite high, which means there is abundant surface defects on the surface of CdS. These surface defects can trap photo-induced electrons/holes, and thus decrease their probability of recombination. Meanwhile, compared with pure CdS, the PL spectra of Ag2S/CdS nanocomposites show similar but with weaker intensity, indicating their high-efficiency of photogenerated electron–hole separation. Among them, 5.0%-Ag2S/CdS nanocomposite shows the weakest PL spectral intensity, illustrating that the most efficient separation rate of photogenerated electrons and holes by the heterojunction effect between Ag2S and CdS.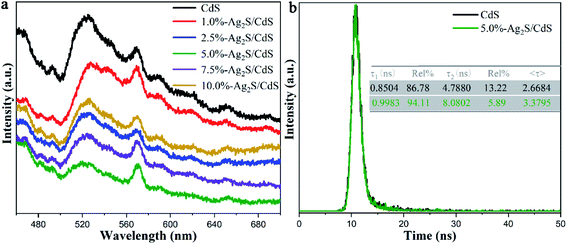 | ||
| Fig. 8 (a) Steady-state PL spectra of CdS and Ag2S/CdS nanocomposites; and (b) TRPL decay of CdS and 5.0%-Ag2S/CdS nanocomposites at an excitation wavelength of 525 nm. | ||
Furthermore, the time-resolved photoluminescence (TRPL) character (Fig. 8b) of pure CdS and 5.0%-Ag2S/CdS nanocomposite were recorded to track the photo-physical behavior of charge carriers. The fluorescent decay profiles of both samples can be well fitted by two exponential terms, and their average lifetime was obtained according to the following equations:28,29
 | (3) |
Electrochemical analysis such as transient photocurrent response, electrochemical impedance spectroscopy (EIS) Nyquist plots, linear sweep voltammetry (LSV), and Mott–Schottky plots were carried out to analyze the photogenerated carriers transfer properties of CdS and Ag2S/CdS nanocomposites. The transient photocurrent–time curves were measured by switching the irradiation light on–off for several runs. As displayed in Fig. 9a, a notable rise in the photoelectric response formed for all samples, indicating the high response of photoinduced electrons under visible-light stimulation. However, pure CdS shows a very weak photocurrent due to the fast electron–hole pairs recombination. And the photocurrent density becomes almost undetectable after several cycles of light stimulation due to the photocorrosion effect. In contrast, Ag2S/CdS samples show much higher photocurrent intensity and more reliable stability than that of pure CdS NW. We found that the sample of 5.0%-Ag2S/CdS nanocomposite shows the strongest photocurrent. This implies that the sample of 5.0%-Ag2S/CdS is most efficient for the photogenerated electron–hole pairs separation. This observation is consistent with PL spectra mentioned above.
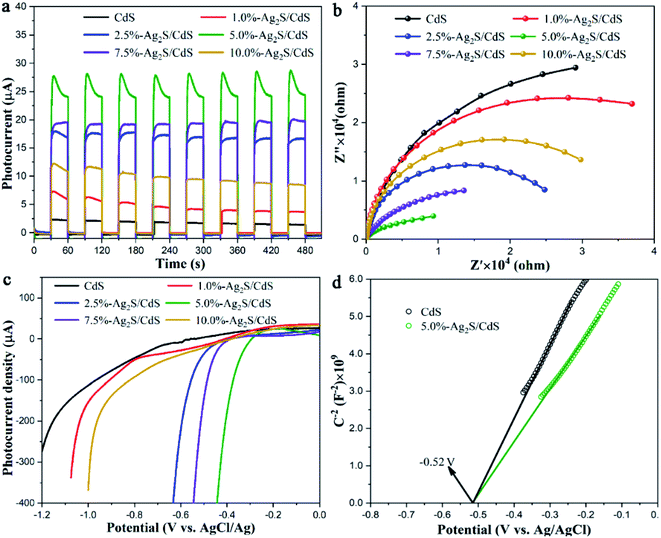 | ||
| Fig. 9 (a) Transient photocurrent response; (b) EIS Nyquist plots; (c) LSV of CdS and Ag2S/CdS nanocomposites; (d) Mott–Schottky plots of CdS and 5.0%-Ag2S/CdS nanocomposites. | ||
To explore the influence of Ag2S on the electronic transport dynamics of CdS, EIS measurements are performed (Fig. 9b). The arc radius of Ag2S/CdS nanocomposites in the Nyquist plots are smaller than that of CdS, which indicates that the charge transfer resistance of Ag2S/CdS nanocomposites is lower than that of CdS, meaning the faster interfacial charge separation for the Ag2S/CdS nanocomposites. Concurrently, the 5.0%-Ag2S/CdS nanocomposite exhibited the smallest semicircle, implying that moderate Ag2S nanoparticles on CdS NWs can effectively enhance the charge separation efficiency.
To identify the key roles of Ag2S in improving the photocatalytic HER process, the polarization curves of CdS and Ag2S/CdS nanocomposites were also investigated. As shown in Fig. 9c, compared to the other samples, 5.0%-Ag2S/CdS nanocomposite had the lowest overpotential. Since the photocatalytic performance is closely related to overpotential,30 the LSV results further support our conclusion that 5.0%-Ag2S/CdS nanocomposite is an excellent photocatalyst for HER. The results are in accordance with the photocatalytic activity and PL analysis.
Mott–Schottky experiment was applied to evaluate the carrier density and band positions of the CdS and 5.0%-Ag2S/CdS nanocomposite. As presented in Fig. 9d, the positive slope of C−2 vs. E plot indicates that both samples are n-type semiconductors.31 And the carrier density can be calculated through taking the slope of the linear part in the Mott–Schottky plots into the following equation:
 | (4) |
3.4. Photocatalytic mechanism
In order to understand the electron transfer between CdS and Ag2S in Ag2S/CdS nanocomposites, the work functions (WF) of CdS and Ag2S were obtained in terms of the UPS spectra. And the work function value was calculated in accordance with the following equation:| WF = hν − Ecut-off | (5) |
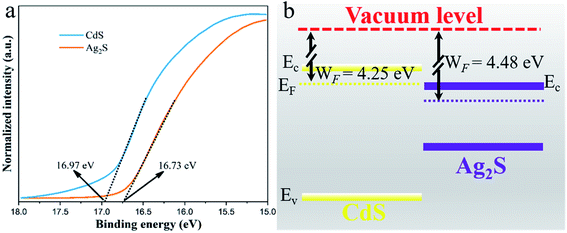 | ||
| Fig. 10 (a) Ultraviolet photoelectron spectroscopy (UPS) spectra; and (b) the schematics of the energy band position of CdS and Ag2S. | ||
In addition, to better understand the charge transfer mechanism between the Ag2S/CdS nanocomposites, some theoretical calculations were carried out.34,35 As shown in Fig. 11a, the potential drop (ΔV) across the Ag2S/CdS interface is 5.76 eV, leading to the formation of a built-in electric field from the Ag2S to the CdS. This built-in electric field is a key factor to enhances the separation of photogenerated electron–hole pairs. Fig. 11b gives the charge density difference of Ag2S/CdS nanocomposites. The cyan region and yellow region stand for charge depletion and accumulation near the heterojunction interface, respectively. It is found that both electrons and holes are located at the interface region of the Ag2S/CdS, forming well-separated electron depletion and accumulation region, which is beneficial for the separation of electron–hole pairs.36,37
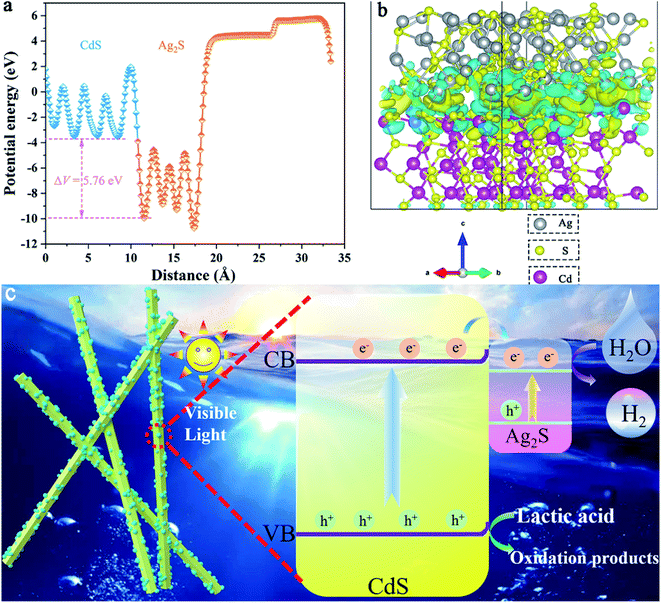 | ||
| Fig. 11 (a) Potential drop across the interface; (b) the charge difference of Ag2S/CdS nanocomposites; (c) photocatalytic mechanism of H2 generation with Ag2S/CdS composites. | ||
The flat-band potential (Vfb) of pure CdS was obtained by extrapolating tangent to the X-intercept in the Mott–Schottky curve (Fig. 9b). It is worth mentioning that the introduction of Ag2S does not alter the band structure of CdS. Both the Vfb of CdS and 5.0%-Ag2S/CdS nanocomposite were about −0.63 V vs. Ag/AgCl. Usually, the bottom of the conduction bands (CB) is more negative than the flat band potential for many n-type semiconductors. According to the transformation relation formula between Ag/AgCl electrode and normal hydrogen electrode (NHE): ENHE = EAg/AgCl + 0.197 and DRS results, the CB and valence band (VB) of CdS were −0.73 V and 1.66 V vs. NHE, respectively. According to the previous reports, the CB and VB of Ag2S are about −0.23 and 0.69 V vs. NHE, respectively. Based on the above analysis, a photocatalytic mechanism of hydrogen generation with Ag2S/CdS composites is proposed (Fig. 11c). Under visible light irradiation, both CdS and Ag2S samples are simultaneously excited to produce photogenerated electrons and holes. Meanwhile, the CB of CdS is more negative than that of Ag2S, the photogenerated electrons in the CB of CdS can be rapidly migrated to the conduction band of Ag2S. Thus, these can participate in HER through the abundant active sites in Ag2S. These results confirm that the fast charge separation and transportation in the hetero-structural nanomaterials can greatly boost photocatalytic H2 production.
4. Conclusion
In summary, Ag2S/CdS nanocomposites with high hydrogen evolution ability are successfully synthesized through a hydrothermal and subsequent in situ ion exchange method. The best photocatalytic activity of H2 production of 777.3 μmol h−1 g−1 in lactic acid solution was achieved for Ag2S/CdS nanocomposite with Ag2S content ratio of 5.0%. The preeminent photocatalytic activity is mainly attributed to the driving force provided by the potential decline at the heterojunction interface, which can promote the photoinduced electrons directionally transfer from CdS NWs to Ag2S NPs to participate in the HER. Meanwhile, benefitting from the narrow band gap of Ag2S, the light absorption of the samples extends from visible light to infrared light, meaning their efficient light utilization efficiency. Furthermore, the photocatalytic mechanism of the Ag2S/CdS nanocomposite is investigated in detail. Thus, this work sheds light on the synthesis of CdS-based nanocomposites for environmental and energetic applications.Author contributions
Congrong Lu: conceptualization, data curation, investigation, formal analysis. Shiwen Du: methodology, data curation, writing-original draft. Yanfei Zhao: supervision, data curation, software. Qi wang: conceptualization, investigation, resources, methodology. Kuankuan Ren: supervision, visualization, software. Chunhe Li: conceptualization, formal analysis, funding acquisition, writing-review & editing. Weidong Dou: validation, resources, funding acquisition, project administration.Conflicts of interest
The authors declare that they have no known competing financial interests or personal relationships that could have appeared to influence the work reported in this paper.Acknowledgements
The authors are thankful for the support of the Natural Science Foundation of Zhejiang Province, China (Grant No. LQ21B030005 and LY19F040005) and Postdoctoral Science Foundation, China (No. 2021M692459).References
- A. Naldoni, M. Altomare, G. Zoppellaro and N. Liu, Photocatalysis with reduced TiO2: From black TiO2 to cocatalyst-free hydrogen production, ACS Catal., 2019, 9, 345–364 CrossRef CAS PubMed.
- W. Xing, W. Tu, Z. Han, Y. Hu, Q. Meng and G. Chen, Template-induced high-crystalline g-C3N4 nanosheets for enhanced photocatalytic H2 evolution, ACS Energy Lett., 2018, 3, 514–519 CrossRef CAS.
- C. Li, H. Wang, S. B. Naghadeh, J. Z. Zhang and P. Fang, Visible light driven hydrogen evolution by photocatalytic reforming of lignin and lactic acid using one-dimensional NiS/CdS nanostructures, Appl. Catal., B, 2018, 227, 229–239 CrossRef CAS.
- S. Xiao, W. Dai, X. Liu, D. Pan, H. Zou and G. Li, Microwave-induced metal dissolution synthesis of core–Shell copper nanowires/ZnS for visible light photocatalytic H2 evolution, Adv. Energy Mater., 2019, 9, 1900775 CrossRef.
- C. Li, S. Yi and D. Chen, Oxygen vacancy engineered SrTiO3 nanofibers for enhanced photocatalytic H2 production, J. Mater. Chem. A, 2019, 7, 17974–17980 RSC.
- Z. Tang, B. Han, C. Han and Y. Xu, One dimensional CdS based materials for artificial photoredox reactions, J. Mater. Chem. A, 2017, 5, 2387–2410 RSC.
- W. Li, K. Fang, Y. Zhang, Z. Chen, L. Wang and Y. Bu, Fabrication of 1D/2D CdS/CoSx direct Z-scheme photocatalyst with enhanced photocatalytic hydrogen evolution performance, Int. J. Hydrogen Energy, 2020, 46, 9351–9359 CrossRef.
- J. Li, X. Liu and J. Zhang, Smart assembly of sulfide heterojunction photocatalysts with well-defined interfaces for direct Z-Scheme water splitting under visible light, ChemSusChem, 2020, 13, 2996–3004 CrossRef CAS PubMed.
- X. L. Yin, L. L. Li, W. J. Jiang, Y. Zhang, X. Zhang, L. J. Wan and J. S. Hu, MoS2/CdS Nanosheets-on-nanorod heterostructure for highly efficient photocatalytic H2 generation under visible light irradiation, ACS Appl. Mater. Interfaces, 2016, 8, 15258–15266 CrossRef CAS PubMed.
- W. Yu, J. Yin, Y. Li, B. Lai, T. Jiang, Y. Li, H. Liu, J. Liu and C. Guo, Ag2S quantum dots as an infrared excited photocatalyst for hydrogen production, ACS Appl. Mater. Interfaces, 2019, 2, 2751–2759 CAS.
- X. Li, D. Shen, C. Liu, J. Li, Y. Zhou, X. Song, P. Huo and H. Wang, Fabricated rGO-modified Ag2S nanoparticles/g-C3N4 nanosheets photocatalyst for enhancing photocatalytic activity, J. Colloid Interface Sci., 2019, 554, 468–478 CrossRef CAS PubMed.
- S. Zhao, J. Wu, Y. Xu, X. Zhang, Y. Han and H. Xing, CdS/Ag2S/g-C3N4 ternary composites with superior photocatalytic performance for hydrogen evolution under visible light irradiation, Dalton Trans., 2021, 50, 3253–3260 RSC.
- L. Zhang, P. Li, L. Feng, X. Chen, J. Jiang and S. Zhang, Synergetic Ag2S and ZnS quantum dots as the sensitizer and recognition probe: A visible light-driven photoelectrochemical sensor for the “signal-on” analysis of mercury (II), J. Hazard. Mater., 2020, 387, 121715 CrossRef CAS PubMed.
- T. Kosmala, D. Mosconi, G. Giallongo, G. A. Rizzi and G. Granozzi, Highly efficient MoS2/Ag2S/Ag photoelectrocatalyst obtained from a recycled DVD surface, ACS Sustainable Chem. Eng., 2018, 6, 7818–7825 CrossRef CAS.
- H. Jia, W. He, W. G. Wamer, X. Han, B. Zhang and S. Zhang, Generation of reactive oxygen species, electrons/holes, and photocatalytic degradation of Rhodamine B by photoexcited CdS and Ag2S micro-nano structures, J. Phys. Chem. C, 2014, 118, 21447–21456 CrossRef CAS.
- H. Wang, S. B. Naghadeh, C. Li, L. Ying, A. Allen and J. Z. Zhang, Enhanced photoelectrochemical and photocatalytic activities of CdS nanowires by surface modification with MoS2 nanosheets, Sci. China Mater., 2018, 602, 1–12 Search PubMed.
- H. Zhang, B. Wei, L. Zhu, J. Yu, W. Sun and L. Xu, Cation exchange synthesis of ZnS-Ag2S microspheric composites with enhanced photocatalytic activity, Appl. Surf. Sci., 2013, 270, 133–138 CrossRef CAS.
- C. Li, S. Du, H. Wang, S. B. Naghadeh, A. L. Allen, X. Lin, G. Li, Y. Liu, H. Xu, C. He, J. Z. Zhang and P. Fang, Enhanced visible-light-driven photocatalytic hydrogen generation using NiCo2S4/CdS nanocomposites, Chem. Eng. J., 2019, 378, 122089 CrossRef CAS.
- B. M. Al-shehri, M. Shkir, T. M. Bawazeer, S. Alfaify and M. S. Hamdy, A rapid microwave synthesis of Ag2S nanoparticles and their photocatalytic performance under UV and visible light illumination for water treatment applications, Phys. E, 2020, 121, 114060 CrossRef CAS.
- T. Di, B. Cheng, W. Ho, J. Yu and H. Tang, Hierarchically CdS–Ag2S nanocomposites for efficient photocatalytic H2 production, Appl. Surf. Sci., 2019, 470, 196–204 CrossRef CAS.
- L. Liu, Y. Qi, J. Hu, Y. Liang and W. Cui, Efficient visible-light photocatalytic hydrogen evolution and enhanced photostability of core@shell Cu2O@g-C3N4 octahedra, Appl. Surf. Sci., 2015, 351, 1146–1154 CrossRef CAS.
- D. H. Ortgies, Á. L. García-villalón, M. Granado, S. Amor, E. M. Rodríguez, D. A. Harrisson, J. Yao, J. Rubio-retama and D. Jaque, Infrared fluorescence imaging of infarcted hearts with Ag2S nanodots, Nano Res., 2019, 12, 749–757 CrossRef CAS.
- B. Shi, Y. Qi and L. Tian, Fabrication of Ag2S quantum dots sensitized CdSe photoelectrodes and its photoelectric performance, Mater. Chem. Phys., 2020, 240, 122177 CrossRef CAS.
- Y. Zhang, X. Li, J. Shen, Z. Chen, S. Cao, T. Li and F. Xu, Rechargeable Mg batteries based on a Ag2S conversion cathode with fast solid-state Mg2+ diffusion kinetics, Dalton Trans., 2019, 48, 14390–14397 RSC.
- W. Zhen, X. Ning, B. Yang, Y. Wu, Z. Li and G. Lu, The enhancement of CdS photocatalytic activity for water splitting via antiphotocorrosion by coating Ni2P shell and removing nascent formed oxygen with artificial gill, Appl. Catal., B, 2017, 221, 243–257 CrossRef.
- S. Du, X. Lin, C. Li, G. Li, B. Zheng, Y. Liu, P. Fang, X. Lin, C. Li, G. Li, B. Zheng, Y. Liu, H. Xu and P. Fang, CoSe2 modified Se-decorated CdS nanowire Schottky heterojunctions, Chem. Eng. J., 2020, 339, 124431 CrossRef.
- Z. Liu, G. Liu and X. Hong, Influence of surface defects and palladium deposition on the activity of CdS nanocrystals for photocatalytic hydrogen production, Wuli Huaxue Xuebao, 2019, 35, 215–222 CAS.
- Z. Shao, X. Meng, H. Lai, D. Zhang, X. Pu, C. Su and H. Li, Coralline-like Ni2P decorated novel tetrapod-bundle Cd0.9Zn0.1S ZB/WZ homojunctions for highly efficient visible-light photocatalytic hydrogen evolution, Chinese, J. Catal., 2021, 42, 439–449 CrossRef CAS.
- Z. Zhang, R. Wang, X. Yue, S. Qiu and S. Yi, A novel architecture of dandelion-like Mo2C/TiO2 heterojunction photocatalysts towards high-performance photocatalytic hydrogen production from water splitting, J. Mater. Chem. A, 2017, 5, 10591–10598 RSC.
- L. Cheng, Y. Wang, Y. Li, Y. Shen, Y. Zhen, Z. Xing and L. Lin, Efficient CO2 electroreduction on Ag2S nanodots modified CdS nanorods as cooperative catalysts, ChemCatChem, 2021, 200237, 1161–1164 CrossRef.
- Y. Xin, Z. Li, W. Wu, B. Fu and Z. Zhang, Pyrite FeS2 sensitized TiO2 nanotube photoanode for boosting near-infrared light photoelectrochemical water splitting, ACS Sustainable Chem. Eng., 2016, 4, 6659–6667 CrossRef CAS.
- B. He, C. Bie, X. Fei, B. Cheng, J. Yu, W. Ho, A. A. Al-Ghamdi and S. Wageh, Enhancement in the photocatalytic H2 production activity of CdS NRs by Ag2S and NiS dual cocatalysts, Appl. Catal., B, 2021, 288, 119994 CrossRef CAS.
- T. Di, B. Cheng, W. Ho, J. Yu and H. Tang, Hierarchically CdS–Ag2S nanocomposites for efficient photocatalytic H2 production, Appl. Surf. Sci., 2019, 470, 196–204 CrossRef CAS.
- S. Wang, C. Ren, H. Tian, J. Yu and M. Sun, MoS2/ZnO van der Waals heterostructure as a high-efficiency water splitting photocatalyst: A first-principles study, Phys. Chem. Chem. Phys., 2018, 20, 13394–13399 RSC.
- K. Ren, J. Yu and W. Tang, Two-dimensional ZnO/BSe van der waals heterostructure used as a promising photocatalyst for water splitting: A DFT study, J. Alloys Compd., 2020, 812, 152049 CrossRef CAS.
- C. Du, J. Tian and X. Liu, Effect of intrinsic vacancy defects on the electronic properties of monoclinic Ag2S, Mater. Chem. Phys., 2020, 249, 122961 CrossRef CAS.
- Y. Luo, S. Wang, K. Ren, J. Chou, J. Yu, Z. Sun and M. Sun, Transition-metal dichalcogenides/Mg(OH)2 van der Waals heterostructures as promising water-splitting photocatalysts: A first-principles study, Phys. Chem. Chem. Phys., 2019, 21, 1791–1796 RSC.
Footnotes |
| † Electronic supplementary information (ESI) available. See DOI: 10.1039/d1ra04823f |
| ‡ These people contribute equally to this work. |
| This journal is © The Royal Society of Chemistry 2021 |

