 Open Access Article
Creative Commons Attribution 3.0 Unported Licence
A three-dimensional nano-network WO3/F-TiO2-{001} heterojunction constructed with OH-TiOF2 as the precursor and its efficient degradation of methylene blue
Chentao Hou * and
Jing Hao
Department of Environmental Engineering, Xi'an University of Science and Technology, Xi'an 710054, China. E-mail: houct@xust.edu.cn
First published on 29th July 2021
Abstract
In this study, three-dimensional nested WO3/F-TiO2-{001} photocatalysts with different WO3 loadings were prepared by a hydrothermal process and used to degrade methylene blue (MB). The photocatalysts with various ratios of WO3 to OH-TiOF2 can be transformed into a three-dimensional network WO3/F-TiO2 hetero-structure with {001} surface exposure. The results showed that the composite catalyst with 5% WO3, denoted as FWT5, had the best comprehensive degradation effect. FWT5 has a limited band gap of 2.9 eV, which can be used as an advanced photocatalyst to respond to sunlight and degrade MB. The average pore diameter of the composite catalyst is 10.3 nm, and the multi-point specific surface area is 56 m2 g−1. Compared with pure TiOF2, the average pore size of the composite catalyst decreased by 8.44 nm and the specific surface area increased by 51.2 m2 g−1, which provides a larger contact space for the catalytic components and pollutants. Moreover, TiO2 on the {001} surface has higher photocatalytic activity and methylene blue can be better degraded. Under the irradiation of 0.03 g FWT5 composite catalyst with a simulated solar light source for 2 h, the degradation rate of 10 mg L−1 methylene blue can reach 82.9%. The trapping experiment showed that photo-generated holes were the principal functional component of WO3/F-TiO2-{001} photo-catalysis, which could capture OH− and form hydroxyl radical (˙OH) and improved the photocatalytic degradation performance. Kinetic studies show that the photocatalytic degradation of MB fits with the quasi-first order kinetic model.
1. Introduction
Over the past decades, with the rapid development of the world's industry and economy, human beings are extremely dependent on various chemicals, which threaten our living environment. The main pollutants in wastewater are organic colored dyes with relatively stable performance and complex molecular structures. Among them, MB is one of the most common dyes in wastewater, which can be harmful to human health, and can lead to eye burning, dyspnea, accelerated heart-rate, emesis, sweatiness, insanity, nausea and methemoglobinemia.1,2 Due to the difficulty of biodegradation, it is very difficult to remove this organic matter from wastewater, which requires enormous resources. The commonly used methods to remove the dye from wastewater include precipitation, ion exchange, solvent extraction, coagulation flocculation, filtration, electrochemistry, and adsorption. However, these methods require high energy consumption, high costs, low concentration, and have insufficient degradation rate.3,4 Among other technologies for the treatment of wastewater, photocatalytic technology has attracted more attention due to its environmental friendliness, mild reaction conditions, low price, clean process and high efficiency, especially in its application to the degradation of MB.5Recently, a variety of photocatalytic materials have been developed to degrade organic pollutants, such as Ag-based nanocomposites, alveolate Cu2−xSe microsheets, MoS nanosheets, MoS2/sepiolite, and MoS2/sepiolite.6–10 In this paper, TiO2 is used, as one of the most common semiconductor photocatalysts, which has the advantages of usability, corrosion resistance, nontoxicity and good chemical stability.11–14 However, TiO2 has a wide band gap of 3.0–3.2 eV, which causes it to respond only under ultraviolet radiation, and its photocarriers recombine rapidly, which seriously hinders its application and development in practice.15,16 In order to solve this problem, many researchers used metal doping,17–19 nonmetal doping,20 precious metal deposition,21,22 etc. The introduction of dopants can effectively reduce the band gap width of TiO2, which makes TiO2 absorb in the visible region, and increases the internal electron acceptor, thus slowing down the carrier recombination rate.
In addition, the surface properties of TiO2 can be greatly enhanced by adding F ions. Tong et al.23 discovered that the photocatalytic performance of powdered TiO2 or TiO2 film doped with F ions was obviously superior to that of pure TiO2, the crystal form of TiO2 is changed by addition of F ions, and the crystallinity of anatase is increased, which led to the formation of the high-energy {001} surface. Therefore, the photocatalytic performance is improved.24 In another study, Han et al.25 developed TiO2 nanosheets with 89% TiO2{001} crystal faces by adding hydrofluoric acid to tetra-butyl titanate under hydrothermal treatment, which showed that the photocatalytic performance of F-TiO2 nanosheets was significantly better than that of P25. It should be noted that TiO2 can form TiOF2 when the F ion concentration is high26 and interestingly, TiOF2 can be converted back to TiO2 under different conditions.27 Zhang et al.28,29 studied the formation process of TiO2-{001} nanosheets by adding different amounts of hydrofluoric acid and controlling different reaction times and temperatures. Shi et al.30 studied the conversion process of cubic TiOF2 to TiO2-{001/101} at different calcination temperatures, and put forward a probable conversion mechanism of TiOF2 to TiO2-{001/101}. Zhang et al.31 found that TiOF2 acts as an unstable intermediate during the transformation of TiO2 nanoparticles into TiO2-{001} nanosheets. TiO2-{001} nanosheets due to their higher hydrogen production,32–35 and photocatalytic reaction can efficiently degrade MB and RhB. The synergistic effect of TiO2 and TiOF2 nano-particles further improves the photocatalytic activity of TiO2-{001} nanosheets. In our pervious study we have found that TiO2-{001/101} nanosheets can be derived from TiOF2 under hydrothermal conditions.
Since TiO2 has a large band gap of 3.2 eV and can only absorb ultraviolet radiation, it is necessary to synthesize a photocatalyst that can absorb visible light. Another type of semiconductor oxidizer is tungsten trioxide (WO3) with a narrow band gap (2.4–2.8 eV), and due to its low energy band gap, it can respond under visible light. Therefore, due to the enhanced ability of visible light photons, WO3 shows significant photocatalytic activity,36 and has attracted more attention since it is non-toxic, economical, and has promising characteristics.37
In order to separate the charges effectively, researchers combined TiO2 with a semiconductor metal oxide with a suitable band gap, which resulted in a reduction of recombination rate of electrons–holes, and improvement of the photocatalytic performance of TiO2. For example, TiO2 is combined with CeOx,38 V2O5 (ref. 39) and WO3 (ref. 40) which effectively separates the charges. Recently, the application of WO3/TiO2 composites and the heterojunction of WO3/TiO2 composites are widely studied by many researchers.41–43 The WO3–TiO2 nanocomposite is an energy storage photocatalyst, which can store electrons generated under light, and release these electrons in the absence of light, which occurs in electron-mediated reactions.44,45 For instance, Yang et al.41 used a WO3−x/TiO2 film as a new photoanode which reduced CO2 to form formic acid through photocatalysis. Wang et al.42 found that the prepared WO3/TiO2 nanotube composite film showed a significant increase in the degradation rate of volatile organic compounds under a photocatalytic degradation process.
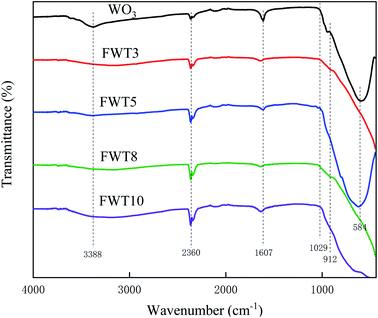
In our previous research, Hou et al.46 washed the prepared TiOF2 with an alkali which significantly improved the catalytic performance of the catalysts, since TiOF2 has more O–H associations on its surface. Therefore, in this paper, we combined WO3 with OH-TiOF2 at high temperature and high pressure. In this research, after one-step hydrothermal treatment, WO3 with different proportions and OH-TiOF2 transformed into a three-dimensional network WO3/F-TiO2-{001} hetero-structure. According to FTIR measurements there were more associated O–H on the surface of TiO2, which could significantly enhance the catalytic activity of TiO2 for MB oxidation under visible light. This catalyst has good photocatalytic activity for methylene blue. In addition, more importantly, the photocatalyst has excellent stability and reusability, which has a good prospect for the practical application of dye wastewater degradation. Interestingly we have found that there are few published research studies using WO3 with OH-TiOF2 as a photocatalyst for degradation of dyes.
2. Experimental
2.1 Synthesis of composite photocatalysts
Preparation of OH-TiOF2: first 34 mL of butyl titanate was magnetically stirred, and 30 mL of glacial acetic acid was added dropwise slowly into butyrate titanate. Then 12.5 mL of hydrofluoric acid (HF) was added to the mixture and continuously stirred at room temperature for 0.5 h. Following that, the obtained mixture was placed in a PTFE lined reactor for 15 h at 160 °C. Next, the reactor was cooled at room temperature, and the solid product was obtained by centrifugation and washed with absolute ethanol and ultrapure water three times respectively. Finally, the product was obtained by drying in an oven at 90 °C. Then, 6 g of the prepared TiOF2 powder was added into a 100 mL glass beaker, 10 mol L−1 sodium hydroxide solution was added over the powder, and then the mixture was stirred at a constant speed at room temperature for 2 h; afterward, the mixture was centrifuged and washed with anhydrous ethanol plus ultrapure water three times respectively. Then the product (OH-TiOF2) was dried at 80 °C in an oven and ground before use.Preparation of the WO3/F-TiO2-{001} composite catalyst: different dosages (0.1056 g; 0.1759 g; 0.2815 g; 0.3519 g; 0.62084 g; 1.5521 g; 3.58 g) of sodium tungstate dihydrate were dissolved in 30 mL ultrapure water, and magnetically stirred for 10 min at low speed until the sodium tungstate completely dissolved. After that, 20 mL of 2 mol L−1 HCl solution was added to the above mixture and stirred at 30 °C for 2 h. Then 1 g of OH-TiOF2 powder was added and continuously stirred for 30 min until the OH-TiOF2 powder entirely dissolved. Next, the solution was transferred to a reactor and placed in a drying oven at 160 °C for 4 h. After the reactor cooled at room temperature, the mixture was centrifuged and the product was obtained by washing the centrifuged sediment with ultrapure water 3 times. The WO3/F-TiO2-{001} composite catalyst was obtained by drying at 100 °C in an oven and then ground and denoted as FWT3, FWT5, FWT8, FWT10, FWT20, FWT50, and FWT100 before use.
2.2 Characterization
An X-ray diffractometer (XRD, p-XD-2, China) was used to observe the crystal characteristics of the catalyst under a 36 kV, 20 mA, Cu-kα X-ray source (λ = 0.15418 nm). The element distribution and surface morphology of the samples were analyzed by EDS and SEM (Japan JSM7500F). A nitrogen adsorption and desorption specific surface area analyzer (BET, micrometrics ASAP2020, USA) was used to determine the specific surface area and porosity of the catalyst using BET and BJH methods. The chemical valence states of the sample were analyzed by X-ray photoelectron spectroscopy (XPS). Absorption characteristics were measured over the 200–800 nm scanning range using a UV-Vis DRS (Shimadzu, UV-2600, Japan). Fluorescence spectrometry (PL, Shimadsu-rf-6000, Japan) was used to measure the electron–hole recombination at an excitation wavelength of 300 nm in a scanning range of 250–650 nm. The measurement range of Fourier transform infrared spectroscopy (FT-IR) is 4000–400 cm−1, and it is carried out in the KBr particles using a Nicolet IS5 spectrometer of the United States to identify the functional groups on the catalyst surface.2.3 Photocatalysis experiment
Herein, photocatalytic degradation of methylene blue was used to evaluate the activity of the catalyst. 100 mL of methylene blue solution with a concentration of 10 mg L−1 was added into a reaction tube and then 30 mg of semiconductor photocatalytic material was added. A 300 W xenon lamp was used to simulate sunlight for the photocatalytic degradation of dye solution. Then the lamp was turned off and kept for 30 min to reach the adsorption equilibrium; next, the light was turned on and 7 mL of the reaction solution was taken out every 15 min to measure the simulated pollutants. The supernatant was centrifuged at a high speed (10![[thin space (1/6-em)]](https://www.rsc.org/images/entities/char_2009.gif) 000 rpm), and then measured using a UV-Vis spectrophotometer with a wavelength of 662 nm. The absorbance of the dye solution was measured before and after the reaction, and the concentration of pollutants before and after the reaction was determined by the standard curve, and the dye removal rate was calculated according to the change of the concentration. The photocatalytic degradation of dye solution and antibiotic solution was investigated. Methylene blue was used as the simulated degradation product to investigate the active substances which play a major role in the WO3/F-TiO2-{001} photocatalytic reaction. For degradation of MB, 30 mg of WO3/F-TiO2-{001} composite catalyst with the optimal photocatalytic performance ratio of 5%, and 100 mL of methylene blue solution with a concentration of 10 mg L−1 were studied under simulated sunlight and the experiment was repeated three times.
000 rpm), and then measured using a UV-Vis spectrophotometer with a wavelength of 662 nm. The absorbance of the dye solution was measured before and after the reaction, and the concentration of pollutants before and after the reaction was determined by the standard curve, and the dye removal rate was calculated according to the change of the concentration. The photocatalytic degradation of dye solution and antibiotic solution was investigated. Methylene blue was used as the simulated degradation product to investigate the active substances which play a major role in the WO3/F-TiO2-{001} photocatalytic reaction. For degradation of MB, 30 mg of WO3/F-TiO2-{001} composite catalyst with the optimal photocatalytic performance ratio of 5%, and 100 mL of methylene blue solution with a concentration of 10 mg L−1 were studied under simulated sunlight and the experiment was repeated three times.
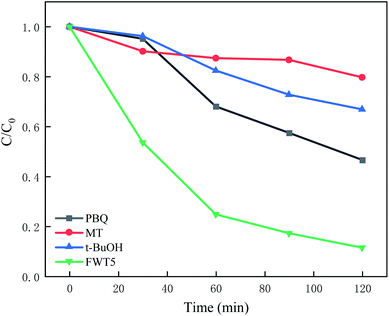
The three active substances (hydroxyl radicals, holes, and superoxide radicals) were captured in degradation processes. For this purpose, 0.3 mmol of tert-butanol (t-BuOH) was used to take hydroxyl radicals, following that, 0.3 mmol of methanol (MT) was applied to capture holes and in the third step, 0.1 mmol of benzoquinone was added to catch the superoxide radicals. The rest of the condition was kept unchanged through the entire experiment. Consequently, the photocatalyst was separated from the dye solution in order to study its durability and reusability.
3. Experimental results and discussion
3.1 Characterization of the catalyst
![[thin space (1/6-em)]](https://www.rsc.org/images/entities/char_2009.gif) :
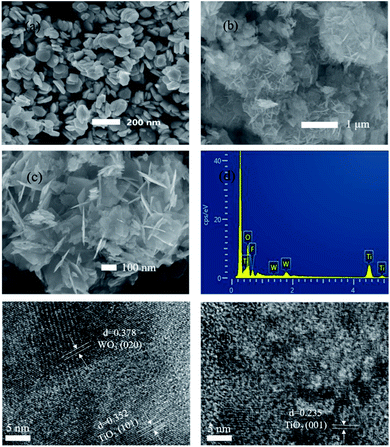
:![[thin space (1/6-em)]](https://www.rsc.org/images/entities/char_2009.gif) Ti = 5% composites (c) were analyzed by SEM. The sizes of the composite catalyst and alkali-washed TiOF2 are 100 nm and 1 μm, respectively, the scale of WO3 is 200 nm, and the space between grains is 200–400 nm, with a uniform size and good dispersion. From the comparison of (a)–(c), the large sheet should be TiO2, and the small sheet is WO3. In Fig. 1b, the alkali washed TiOF2 shows a more complex network shape, and the alkali washed TiOF2 shows phase assembly along a certain direction. The net structure makes the photocatalytic surface area larger. From the FWT5 (c) diagram, WO3 and TiO2 are mutually doped and finally present a three-dimensional net-like structure. Due to the relatively low proportion of doped WO3, we can observe the scaly shape of TiO2 with a non-uniform surface size and the lamellar WO3 hidden under the TiO2 surface. The network structure formed in this way provides a more catalytic area for photocatalysis. Fig. 1d shows the EDS spectrum of the WO3/F-TiO2 composite catalyst. Samples containing mainly O, F, W and Ti show four characteristic peaks, and their contents (weight percentage) are 41.64%, 11.21%, 5.67% and 41.48%, respectively. Furthermore, no excess impurity peak was seen, and the morphology of the prepared sample was analyzed using a high resolution transmission electron microscope (HRTEM), as shown in (e) and (f). The lattice fringes are 0.352 nm and 0.235 nm respectively, corresponding to the lattice distances of the anatase type TiO2(101) plane and (001) plane.47,48 It can be seen that the (001) crystal is exposed on the surface of F-TiO2.
Ti = 5% composites (c) were analyzed by SEM. The sizes of the composite catalyst and alkali-washed TiOF2 are 100 nm and 1 μm, respectively, the scale of WO3 is 200 nm, and the space between grains is 200–400 nm, with a uniform size and good dispersion. From the comparison of (a)–(c), the large sheet should be TiO2, and the small sheet is WO3. In Fig. 1b, the alkali washed TiOF2 shows a more complex network shape, and the alkali washed TiOF2 shows phase assembly along a certain direction. The net structure makes the photocatalytic surface area larger. From the FWT5 (c) diagram, WO3 and TiO2 are mutually doped and finally present a three-dimensional net-like structure. Due to the relatively low proportion of doped WO3, we can observe the scaly shape of TiO2 with a non-uniform surface size and the lamellar WO3 hidden under the TiO2 surface. The network structure formed in this way provides a more catalytic area for photocatalysis. Fig. 1d shows the EDS spectrum of the WO3/F-TiO2 composite catalyst. Samples containing mainly O, F, W and Ti show four characteristic peaks, and their contents (weight percentage) are 41.64%, 11.21%, 5.67% and 41.48%, respectively. Furthermore, no excess impurity peak was seen, and the morphology of the prepared sample was analyzed using a high resolution transmission electron microscope (HRTEM), as shown in (e) and (f). The lattice fringes are 0.352 nm and 0.235 nm respectively, corresponding to the lattice distances of the anatase type TiO2(101) plane and (001) plane.47,48 It can be seen that the (001) crystal is exposed on the surface of F-TiO2.
![[thin space (1/6-em)]](https://www.rsc.org/images/entities/char_2009.gif) :
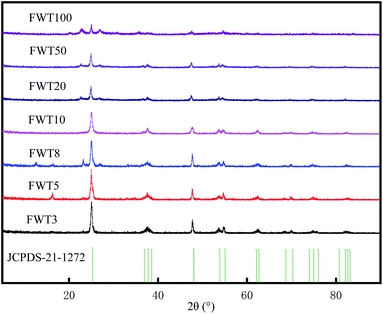
:![[thin space (1/6-em)]](https://www.rsc.org/images/entities/char_2009.gif) TiO2 = 100%, 50% and 20% composite catalysts shows that the peak at 23.1° is enhanced and expanded, which corresponds to the main peak of WO3 in the standard card of XRD (no. 321395). However, with the increase of WO3 content, when the 2θ values are 25.32°, 38°, 47.96°, 53.98° and 62.9°, the characteristic peak intensity of TiO2 gradually weakens.
TiO2 = 100%, 50% and 20% composite catalysts shows that the peak at 23.1° is enhanced and expanded, which corresponds to the main peak of WO3 in the standard card of XRD (no. 321395). However, with the increase of WO3 content, when the 2θ values are 25.32°, 38°, 47.96°, 53.98° and 62.9°, the characteristic peak intensity of TiO2 gradually weakens.
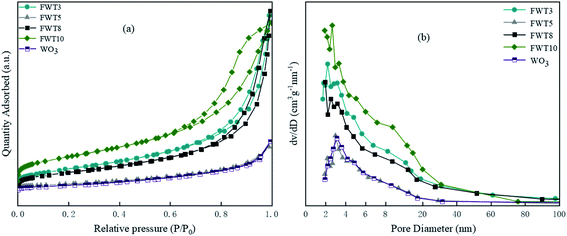 | ||
| Fig. 3 (a) Nitrogen adsorption/desorption isotherm of FWT3, FWT5, FWT8, FWT10 and WO3. (b) The pore size distribution corresponding to each catalyst. | ||
| Sample | Specific surface area (m2 g−1) | Pore volume (cm3 (STP) g−1) | Average pore size (nm) |
|---|---|---|---|
| WO3 | 12.06 | 0.056 | 15.81 |
| TiOF2 | 4.80 | 0.02 | 18.74 |
| FWT3 | 49.21 | 0.17 | 14.00 |
| FWT5 | 56.00 | 0.16 | 10.30 |
| FWT8 | 41.06 | 0.18 | 17.23 |
| FWT10 | 75.04 | 0.17 | 8.80 |
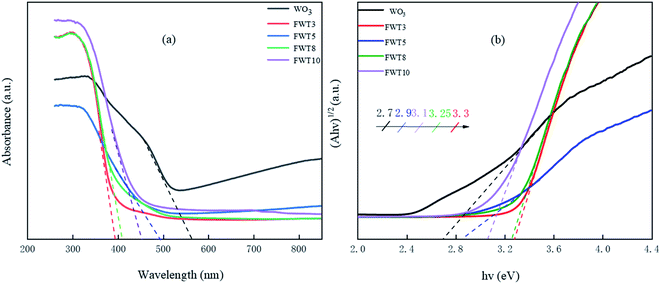 | ||
| Fig. 4 (a) UV-Vis absorption spectroscopy and (b) the corresponding band gap energy of WO3 and FWTX (X = 3, 5, 8, and 10). | ||
3.2 Degradation effect on dye wastewater
![[thin space (1/6-em)]](https://www.rsc.org/images/entities/char_2009.gif) :
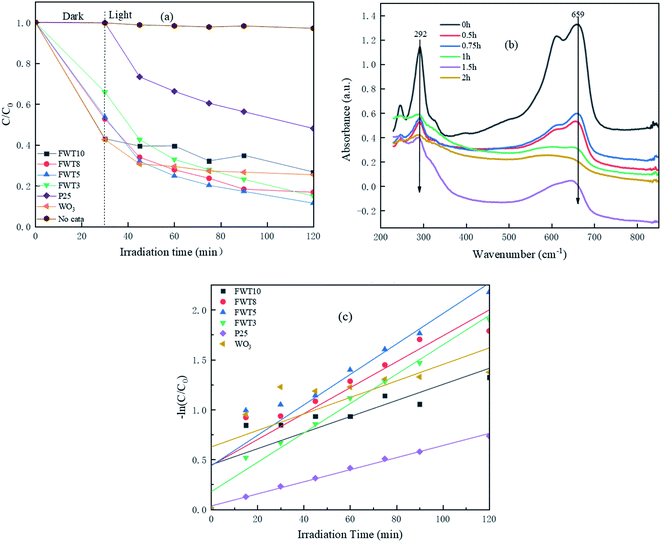
:![[thin space (1/6-em)]](https://www.rsc.org/images/entities/char_2009.gif) Ti. This is due to the irregular accumulation of WO3 particles on the surface of TiO2, resulting in an increase in specific surface area and porosity, and the highly exposed {001} surface, making the FWT10 sample have the strongest MB adsorption capacity. This is also consistent with the obtained BET characterization results. Although the adsorption capacity of FWT3 for MB is weaker than that of FWT10, its total removal rate (78.4%) is higher than that of FWT10 (70.6%). This phenomenon shows that the photocatalyst's ability to adsorb MB cannot determine its ability to degrade MB. The total degradation rate of FWT5 to MB reached 82.9% within two hours under simulated sunlight, which was higher than the 74% of WO3 and 62.2% of commercially available P25.
Ti. This is due to the irregular accumulation of WO3 particles on the surface of TiO2, resulting in an increase in specific surface area and porosity, and the highly exposed {001} surface, making the FWT10 sample have the strongest MB adsorption capacity. This is also consistent with the obtained BET characterization results. Although the adsorption capacity of FWT3 for MB is weaker than that of FWT10, its total removal rate (78.4%) is higher than that of FWT10 (70.6%). This phenomenon shows that the photocatalyst's ability to adsorb MB cannot determine its ability to degrade MB. The total degradation rate of FWT5 to MB reached 82.9% within two hours under simulated sunlight, which was higher than the 74% of WO3 and 62.2% of commercially available P25.
Fig. 8b shows the variation of the MB absorption spectrum with light time in the presence of WO3/F-TiO2-{001} under visible light irradiation. At 664 nm (the characteristic absorption peak of MB), the peak intensity of MB showed an obvious decreasing trend, indicating that MB was photodegraded under visible light irradiation. Moreover, the photocatalytic degradation effect of the catalyst with the best composite ratio (FWT5) on MB at a wavelength of 664 nm almost completely disappeared after 2 h of irradiation. At the same time, no new absorption bands were observed during the photodegradation process, which confirms the complete photodegradation of the MB aqueous solution.
By studying the kinetic model of WO3/F-TiO2-{001} photocatalytic degradation of MB, the photocatalytic performance of the sample was further evaluated. It can be seen from Fig. 8c and Table 2 that the R2 of the composite photocatalyst is close to 1, which indicates that the process of degrading methylene blue meets the first-order reaction kinetic model, and the reaction constant K value (0.0126) of the 5% composite catalyst is slightly higher than that of the others. The K value of the composite catalyst is twice that of the single catalyst (0.0054), indicating that the degradation rate of the 5% composite catalyst has increased.
| FWT3 | FWT5 | FWT8 | FWT10 | P25 | WO3 | |
|---|---|---|---|---|---|---|
| First order dynamics R2 | 0.9856 | 0.9983 | 0.987 | 0.9518 | 0.9955 | 0.9752 |
| First order kinetic constant K | 0.0124 | 0.0126 | 0.0111 | 0.0051 | 0.0064 | 0.0054 |
Adding tert-butanol and methanol has little effect on the photocatalytic degradation of MB solution, and the degradation rate decreased by 60% and 70% respectively. The results showed that holes and hydroxyl radicals determined the catalytic degradation activity of WO3/F-TiO2-{001} for MB, while the photocatalytic activity of benzoquinone decreased slightly, indicating that hydroxyl radical, photo generated holes and superoxide radical all participated in the photo-catalytic degradation of MB. However, photo-generated holes had more effect. According to the literature reports, the hole recombination rate of TiO2 is high, while the composite WO3/F-TiO2-{001} catalyst prepared in this paper hinders the recombination of more holes and photo-generated electrons.
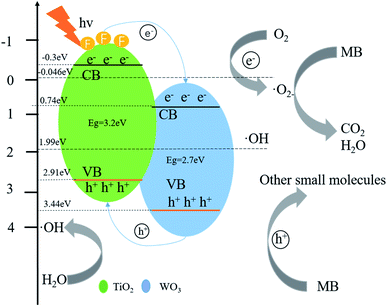
Based on the experimental results and the position of the band gap, we propose a possible mechanism for the better activity of WO3/F-TiO2-{001} photocatalytic materials. First of all, due to its unique network structure, the specific surface area of the catalyst is greatly increased. The large specific surface area is conducive to the adsorption of reactants and can provide more active sites for the photocatalytic reaction.72 In addition, the heterojunction formed by WO3 and F-TiO2 is a type II heterojunction,73 which effectively reduces the recombination efficiency of electrons and holes, and hence electrons and holes have more opportunities to react with O2 and H2O and generate active materials that can degrade MB. It can be seen from Fig. 10 that the CB potential (−0.3 eV) of anatase TiO2 is more negative than the CB potential (0.74 eV) of WO3. A strong driving force is generated between the tight non-uniform interfaces, which promotes the transfer of electrons from the CB of TiO2 to the CB of WO3. Since there are some oxygen vacancies in the material, part of the electrons can be captured. Obviously, the directional transfer of electrons and the trapping of electrons by oxygen vacancies effectively reduce the recombination rate of electron–hole pairs, which is also the main reason for the excellent photocatalytic performance of the photocatalyst. Whereas the CB potential of TiO2 (−0.3 eV) is more negative than the potential of O2/˙O (−0.046 eV), O2 adsorbed on the surface of the photocatalyst is easier to capture electrons on the TiO2 CB to form ˙O2. This O2 can highly oxidize MB and other pollutants. In addition, since the material has some oxygen vacancies, these oxygen vacancies can better adsorb water and play a vital role in the formation of hydroxyl radicals (˙OH). As long as the VB potential of WO3 (3.44 eV) is higher than the VB potential of TiO2 (2.91 eV), the h+ on the WO3 VB is easier to transfer to the VB of TiO2, and the VB potential of the two photocatalysts is higher than the standard redox potential (1.99 eV) of ˙OH/OH−, which makes it easy for the adsorbed water on the surface of the photocatalyst to form strong oxidizing ˙OH. When the active factors such as ˙O2− and ˙OH attack, the aromatic ring will be hydroxylated to produce phenolic metabolites. The cationic functional groups of MB molecules may be vertically adsorbed to the surface and eventually produce CO2, SO42−, NH4+ and NO3−. Degradation intermediates originated from the initial opening of the central aromatic ring, and the formation of their subsequent metabolites was consistent with the general law of degradation of other complex molecules in water. In addition, it is not negligible that the composite photocatalytic material adsorbs pollutants and the synergy of photocatalysis. The effect makes it have a better degradation effect on MB.
4. Conclusion
In this paper, a new type of WO3/F-TiO2-{001} heterostructure semiconductor material with a three-dimensional network structure was successfully prepared by the hydrothermal method. Compared with WO3 and P25, the WO3/F-TiO2-{001} heterojunction constructed with OH-TiOF2 as the precursor exhibits superior photocatalytic performance for the removal of MB induced by visible light. Among them, the FWT5 heterojunction showed higher photocatalytic degradation efficiency. The significant improvement in photocatalytic performance is due to the combination of OH-TiOF2 and WO3 to form a complex network structure, which provides more photocatalytic area. Meanwhile, the formation of a type II heterojunction enhances the photo-induced charge separation. Therefore, WO3/F-TiO2-{001} with high photocatalytic efficiency has potential application prospects in the removal of organic pollutants.Conflicts of interest
There are no conflicts to declare.Acknowledgements
This work was supported by the Shaanxi Land Engineering Construction Group Co. Ltd. (Grant No. DJNY2021-13) and Shandong Provincial Department of Science and Technology (Grant No. 2019JZZY010343).References
- N. Popa and M. Visa, Adv. Powder Technol., 2017, 28, 1866–1876 CrossRef CAS.
- S. Zhang, H. Li and Z. Yang, J. Alloys Compd., 2017, 722, 555–563 CrossRef CAS.
- W. Han, Y. Wang and Y. Zheng, Adv. Mater. Res., 2008, 47, 1438–1441 Search PubMed.
- Y. Fu, Z. Jin, Y. Ni, H. Du and T. Wang, Thin Solid Films, 2009, 517, 5634–5640 CrossRef CAS.
- A. Sandoval, C. H. Ventura and T. E. Klimova, Fuel, 2017, 198, 22–30 CrossRef CAS.
- G. Liao, J. Fang, Q. Li, S. Li, Z. Xu and B. Fang, Nanoscale, 2019, 11, 7062–7096 RSC.
- W. Zhong, S. Shen, S. Feng, Z. Lin, Z. Wang and B. Fang, CrystEngComm, 2018, 20, 7851–7856 RSC.
- M. Hao, H. Li, L. Cui, W. Liu, B. Fang, J. Liang, X. Xie, D. Wang and F. Wang, Environ. Chem. Lett., 2021, 1–10 Search PubMed.
- L. Cui, M. Hao, F. Wang, B. Fang and X. Xie, Int. J. Photoenergy, 2020, 1–7 CrossRef.
- F. Wang, M. Hao, W. Liu, P. Yan, B. Fang, S. Li, J. Liang, M. Zhu and L. Cui, Nano Mater. Sci., 2020 DOI:10.1016/j.nanoms.2020.10.007.
- C. Lv, X. Lan, L. Wang, X. Dai, M. Zhang, J. Cui, S. Yuan, S. Yuan and J. Shi, Environ. Technol., 2021, 42, 377–387 CrossRef CAS PubMed.
- H. Liu, Y. Wang, J. Lv, G. Xu, X. Zhang and Y. Wu, Nano, 2019, 14, 1950111 CrossRef CAS.
- C. Hou, H. Liu and Y. Li, RSC Adv., 2021, 11, 14957–14969 RSC.
- C. Hou, H. Liu and F. Bakhtari Mohammad, J. Solid State Chem., 2021, 300, 122288 CrossRef CAS.
- Y. Wang, R. Lei, P. Wang, Z. Shi and L. Zhang, Appl. Catal., B, 2020, 262, 118308 CrossRef CAS.
- C. Hou and W. Liu, R. Soc. Open Sci., 2018, 5, 172005 CrossRef PubMed.
- X. Wei, H. Cai, Q. Feng, Z. Liu, D. Ma, K. Chen and Y. Huang, Mater. Lett., 2018, 228, 379–383 CrossRef CAS.
- M. Malakootian, N. Olama, M. Malakootian and A. Nasiri, Int. J. Environ. Sci. Technol., 2019, 16, 4275–4284 CrossRef CAS.
- W. Zhong, B. Xiao, Z. Lin, Z. Wang, L. Huang, S. Shen, Q. Zhang and L. Gu, Adv. Mater., 2021, 33, 2007894 CrossRef CAS PubMed.
- H. L. Shindume, Z. Zhao, N. Wang, H. Liu, A. Umar, J. Zhang, T. Wu and Z. Guo, J. Nanosci. Nanotechnol., 2019, 19, 839–849 CrossRef CAS PubMed.
- T. Li, Z. Wang, C. Liu, C. Tang, X. Wang, G. Ding, Y. Ding and L. Yang, Nanomaterials, 2018, 8, 666 CrossRef PubMed.
- J. Zhang, X. Li, M. Peng, Y. Tang, A. Ke, W. Gan, X. Fu and H. Hao, Mater. Res. Express, 2018, 5, 065008 CrossRef.
- H. Tong, S. Ouyang, Y. Bi, N. Umezawa, M. Oshikiri and J. Ye, Adv. Mater., 2012, 24, 229–251 CrossRef CAS.
- C. P. Sajan, S. Wageh, A. A. Al-Ghamdi, J. Yu and S. Cao, Nano Res., 2016, 9, 3–27 CrossRef CAS.
- X. Han, Q. Kuang, M. Jin, Z. Xie and L. Zheng, J. Am. Chem. Soc., 2009, 131, 3152–3153 CrossRef CAS PubMed.
- M. Jung, Y. Kim and Y. Lee, J. Ind. Eng. Chem., 2017, 47, 187–193 CrossRef CAS.
- K. Lv, J. Yu, L. Cui, S. Chen and M. Li, J. Alloys Compd., 2011, 509, 4557–4562 CrossRef CAS.
- Y. Zhang, M. Shang, Y. Mi, T. Xia, P. Wallenmeyer, J. Murowchick, L. Dong, Q. Zhang and X. Chen, ChemPlusChem, 2014, 79, 1159–1166 CrossRef CAS.
- X. Chen, Y. Zhang, Q. Zhang, T. Xia, Y. Chen and D. Zhu, ChemNanoMat, 2015, 1, 270–275 CrossRef.
- T. Shi, Y. Duan, K. Lv, Z. Hu, Q. Li, M. Li and X. Li, Front. Chem., 2018, 6, 175 CrossRef.
- Y. Zhang, T. Xia, M. Shang, P. Wallenmeyer, D. Katelyn, A. Peterson, J. Murowchick, L. Dong and X. Chen, RSC Adv., 2014, 4, 16146–16152 RSC.
- W. Zhong, Z. Wang, N. Gao, L. Huang, Z. Lin, Y. Liu, F. Meng, J. Deng, S. Jin, Q. Zhang and L. Gu, Angew. Chem., Int. Ed., 2020, 59, 22743–22748 CrossRef CAS.
- S. Shen, Z. Lin, K. Song, Z. Wang, L. Huang, L. Yan, F. Meng, Q. Zhang, L. Gu and W. Zhong, Angew. Chem., Int. Ed., 2021, 60, 12360–12365 CrossRef CAS PubMed.
- Z. Lin, S. Shen, Z. Wang and W. Zhong, iScience, 2021, 24, 102469 CrossRef PubMed.
- Z. Lin, B. Xiao, Z. Wang, S. Shen, L. Huang, J. Zhang, F. Meng, Q. Zhang, L. Gu and W. Zhong, Adv. Funct. Mater., 2021, 2102321 CrossRef.
- M. Miyauchi, A. Nakajima, T. Watanabe and K. Hashimoto, Chem. Mater., 2002, 14, 4714–4720 CrossRef CAS.
- M. B. Tahir, G. Nabi, N. R. Khalid and W. S. Khan, J. Inorg. Organomet. Polym., 2017, 28, 777–782 CrossRef.
- H. Yang, K. Zhang, R. Shi and A. Tang, J. Am. Ceram. Soc., 2007, 90, 1370–1374 CrossRef CAS.
- M. A. Rauf, S. B. Bukallah, A. Hamadi, A. Sulaiman and F. Hammadi, Chem. Eng. J., 2007, 129, 167–172 CrossRef CAS.
- S. Stojadinović, N. Radić, R. Vasilić, M. Petković, P. Stefanov, Lj. Zeković and B. Grbić, Appl. Catal., B, 2012, 126, 334–341 CrossRef.
- Y. Yang, R. Xie, H. Li, C. Liu, W. Liu and F. Zhan, Trans. Nonferrous Met. Soc. China, 2016, 26, 2390–2396 CrossRef CAS.
- X. Wang, M. Sun, M. Murugananthan and Y. Zhang, Appl. Catal., B, 2020, 260, 118205 CrossRef CAS.
- A. S. Martins, L. Nuñez and M. Lanza, J. Electroanal. Chem., 2017, 802, 33–39 CrossRef CAS.
- M. M. Momeni, Appl. Phys. A: Mater. Sci. Process., 2015, 119, 1413–1422 CrossRef CAS.
- D. Huang, S. Wan, L. Wang and Q. Xue, Surf. Interface Anal., 2011, 43, 1064–1068 CrossRef CAS.
- C. Hou, W. Liu and J. Zhu, Catalysts, 2017, 7, 243 CrossRef.
- W. Zhao, N. Liu, H. Wang and L. Mao, Ceram. Int., 2017, 43, 4807–4813 CrossRef CAS.
- M. Zou, H. Liu, L. Feng, F. Xiong, T. Thoma and M. Yang, Microporous Mesoporous Mater., 2017, 240, 137–144 CrossRef CAS.
- D. C. T. Nguyen, K. Y. Cho and W. C. Oh, RSC Adv., 2017, 7, 29284–29294 RSC.
- B. Fang, A. Bonakdarpour, K. Reilly, Y. Xing, F. Taghipour and D. Wilkinson, ACS Appl. Mater. Interfaces, 2014, 6, 15488–15498 CrossRef CAS PubMed.
- B. Fang, Y. Xing, A. Bonakdarpour, S. Zhang and D. P. Wilkinson, ACS Sustainable Chem. Eng., 2015, 3, 2381–2388 CrossRef CAS.
- B. Fang, J. H. Kim, M. S. Kim and J. S. Yu, Acc. Chem. Res., 2013, 46, 1397–1406 CrossRef CAS.
- Y. Xing, Y. Wang, C. Zhou, S. Zhang and B. Fang, ACS Appl. Mater. Interfaces, 2014, 6, 2561–2567 CrossRef CAS.
- B. Fang, S. Qiang, F. Jung, H. Kim and M. S. Kim, Langmuir, 2010, 26, 11238–11243 CrossRef CAS.
- B. Fang, L. Daniel and A. Bonakdarpour, Small, 2021, 2102288 CrossRef.
- L. Rekeb, L. Hamadou, A. Kadri, N. Benbrahim and E. Chainet, Int. J. Hydrogen Energy, 2019, 44, 10541–10553 CrossRef CAS.
- Z. Wang, Z. Lin, J. Deng, S. Shen, F. Meng, J. Zhang, Q. Zhang, W. Zhong and L. Gu, Adv. Energy Mater., 2021, 11, 2003023 CrossRef CAS.
- J. Zheng, L. Yanhong, R. Wang, X. Chao, H. Zhou, J. Ping and S. Wang, Nat. Commun., 2018, 9, 3572 CrossRef PubMed.
- P. Jia and I. Wan, Chem. Mater., 2006, 18, 847–853 CrossRef.
- H. K. Yong, Y. L. Su, H. N. Umh, H. D. Song and J. Yi, ACS Appl. Mater. Interfaces, 2020, 6, 28–33 Search PubMed.
- B. Zhang, K. Jiang, H. Zhang and S. Hu, Nano Lett., 2019, 19, 530–537 CrossRef CAS PubMed.
- A. Fujishima, T. Rao and D. Tryk, Photochem. Photobiol. Sci., 2000, 1, 1–21 CrossRef CAS.
- X. Bian and J. Yang, Sci. Bull., 2001, 46, 265–273 CrossRef.
- M. Hu, Y. Cao, Z. Li, S. Yang and Z. Xing, Appl. Surf. Sci., 2017, 426, 734–744 CrossRef CAS.
- Z. Gao, J. Liu, X. Fang, D. Wu, Z. Wu and J. Kai, Solid State Sci., 2012, 14, 276–280 CrossRef CAS.
- P. Wang, C. Qi, L. Hao, P. Wen and X. Xu, J. Mater. Sci. Technol., 2019, 35, 285–291 CrossRef.
- X. Zhao, G. Wei, J. Liu, Z. Wang, C. An and J. Zhang, Mater. Res. Bull., 2016, 80, 337–343 CrossRef CAS.
- Y. Bai, Z. Li, B. Cheng, M. Zhang and K. Su, RSC Adv., 2017, 7, 21758–21767 RSC.
- T. Takirawa, T. Watanabe and K. Honda, J. Phys. Chem., 1978, 82, 1391–1396 CrossRef.
- D. Wang, F. Jia, H. Wang, F. Chen, Y. Fang, W. Dong, G. Zeng, X. Li, Q. Yang and Z. Yuan, J. Colloid Interface Sci., 2018, 519, 273–284 CrossRef CAS PubMed.
- C. Wang, X. Zhang, H. Qiu, G. Huang and H. Yu, Appl. Catal., B, 2017, 205, 615–623 CrossRef CAS.
- C. Hou, J. Xie, H. Yang, S. Chen and H. Liu, RSC Adv., 2019, 9, 37911–37918 RSC.
- A. Xu, W. Tu, S. Shen, Z. Lin, N. Gao and W. Zhong, Appl. Surf. Sci., 2020, 528, 146949 CrossRef CAS.
| This journal is © The Royal Society of Chemistry 2021 |

