 Open Access Article
Fluorescent films based on PVDF doped with carbon dots for evaluation of UVA protection of sunscreens and fabrication of cool white LEDs†
Daniel Hernández-Rivera*,
Simei Darinel Torres-Landa ,
Miriam Rangel-Ayala
 and
Vivechana Agarwal
 *
*
Centro de Investigación en Ingeniería y Ciencias Aplicadas, UAEM, Av. Universidad 1001, Col. Chamilpa, Cuernavaca, Morelos 62209, Mexico. E-mail: danrn482@gmail.com; vagarwal@uaem.mx
First published on 5th October 2021
Abstract
The ultraviolet-A (UVA) radiation from sunlight that reaches the earth's surface can induce premature aging, immunosuppression, and skin cancer. Commercial sunscreen products offer limited information regarding protection against UVA light. Therefore, proposing new and practical alternatives to evaluate the UVA protection capacity of commercial sunscreens is highly imperative. This work presents a novel methodology for evaluating the quality of sunscreens using polyvinylidene fluoride (PVDF) based films doped with plant derived photoluminescent carbon dots (CDs). The bluish white light emitting (under UVA exposure) PVDF/CD films were used to evaluate the UVA protection capacity of 8 different commercial sunscreens. The evaluation of UVA protection is based on the fluorescence attenuation observed with the films coated with sunscreens. In addition, visual evaluation of the UVA protection capacity of the sunscreens and commercial glasses, using the same films and a commercial UV lamp at 365 nm, has also been demonstrated. Two sunscreens with limited UVA protection were identified using the proposed simple evaluation mechanisms without conventionally used expensive instruments and complex methodologies. Additionally, the capacity of PVDF/CD material has been explored for the possible fabrication of WLEDs with cool light emission.
Introduction
The solar radiation reaching the earth's surface includes ultraviolet radiation (UVR). The UVR is composed of three wavelength ranges, i.e. UVC (200–290 nm), UVB (290–320 nm), and UVA (320–400 nm). The earth's atmosphere absorbs most of the UVC radiation, but the UVB and UVA radiation reach the surface causing adverse health impacts on human beings. For instance, erythema (skin burn) and skin cancer1–3 are caused by UVB light. According to the world health organization (WHO), worldwide there are 2–3 million new cases of skin cancer each year.4 The UVA radiation is not as harmful as UVB radiation, but it can induce premature ageing and immunosuppression.5,6 In addition, studies indicate that UVA radiation also contributes to the development of skin cancer.6 The adverse effects of UV radiation on humans have been increasing due to the constant deterioration/depletion of the ozone layer, which reduces the earth's natural protection from UV radiation. In order to reduce the adverse effects of UV radiation, the WHO strongly recommends the use of sunscreens, UV-protected clothes and to avoid prolonged exposure to the sunlight.7Since commercial sunscreen products are evaluated by the sun protection factor (SPF), they usually offer good protection from UVB radiation.8 The SPF of sunscreens is calculated from the UV intensity required to produce sunburn on protected skin (using sunscreen) divided by the UV intensity required to produce sunburn on unprotected skin. This factor mainly focuses on the effects of UVB radiation on human skin and offers limited information regarding protection against UVA light.9 It is important to mention that the quantity of UVA radiation reaching the earth is more than 20 times than that of the UVB radiation.10
The effects of UVA radiation are not noticeable in the short term, so users of these types of sunscreen products cannot be sure whether it is protecting them against the UVA rays. Some parameters have been proposed to test if sunscreens offer good protection in the UVA range. The critical wavelength (CW) is the wavelength at which 90% of the total area of the absorbance curve of the sunscreen is found.8,9 The UVA/UVB8 coefficient and the spectral uniformity index (SUI)11 indicate the uniformity of the absorbance spectrum of sunscreens in the UVA and UVB ranges. In general, the methods for analyzing the UVA protection of sunscreens are not well-established and there are discrepancies among the different protocols reported in the literature.10,12 Due to discrepancies in UVA protection and SPF measurements, there is a need to find better substrates that allow more reliable measurements. Roughness and UV transparency are elements to be taken into consideration when choosing a substrate for in vitro measurements of SPF.13,14 Therefore, it is necessary to propose new measurement techniques that facilitate the evaluation of the protection capacity of sunscreens in the UVA range.
The recent advances in materials science have allowed in-depth investigations on different types of materials that absorb UV radiation. The materials like titanium dioxide,15 dopamine-melanin dense nanoparticles,16 ZnO nanoparticles,17 can serve as UV shields due to their high UV absorbance. It is also reported that carbon dots (CDs)18–21 can be used in UV shields due to their strong absorption in the UV range.21 CDs can also interact with UV radiation producing fluorescence.
In the past couple of decades, carbon dots have attracted the attention of the scientific community due to their fluorescence properties, biocompatibility, low cost, and the wide range of methods for their fabrication.15 Carbon dots have been used in bio-imaging16 and white LED (WLED)17 applications, and for the identification/detection of metal ions,18,19 adulterants,20 contaminants,21 bacteria,22 and other microorganisms. Additionally, these nanostructures have also been incorporated into different polymers such as poly(methyl methacrylate) (PMMA) and polystyrene (PS),23 polyvinyl alcohol (PVA),24–28 and polyvinylidene fluoride (PVDF)29–33 to create films and membranes for different applications.
Among the polymers studied, PVDF has emerged as a potential material for multiple practical applications due to its ferroelectric properties,34 thermal stability, chemical resistance, mechanical strength, and good resistance to UV radiation.29,35 This polymer has been mixed with different nanostructures to improve their piezoelectric properties,30,36 hydrophobicity,37 and absorption capacity in the UV range.29 PVDF has recently been mixed with carbon dots to obtain membranes with good fluorescence properties and use them in fluorescence detection; however, the incorporation of carbon dots is at surface level.33,38
This work primarily focuses on the fabrication of PVDF/CDs films with stable fluorescence to evaluate the UVA protection of sunscreens. The evaluation mechanism is based on the change in fluorescence intensity observed with the films covered with a specific amount of sunscreen. Additionally, the fabrication of WLEDs using the PVDF/CDs photoluminescent films is proposed in this manuscript.
Experimental
Materials
PVDF powder and N,N-dimethylformamide (anhydrous, 99.8%; DMF) were purchased from Sigma-Aldrich and used as received. Pithecellobium dulce leaves were collected from Cuernavaca, Mexico. Eight commercially available sunscreens (lotions) of different sun protection factor (SPF) were acquired from the local stores in Mexico City. Additionally, three commercial glasses with UV protection were acquired from Mexico City stores.Synthesis of carbon dots
The CDs were prepared by the carbonization method using Pithecellobium dulce leaves as precursor. The procedure was as follows. Firstly, 5 g of leaves were washed with water and then crushed. This material was heated to be converted at 400 °C in a muffle furnace for 2 h. Then, the carbonized material was mechanically grounded to get fine powders.The as-prepared powdered material (80 mg) was mixed with 8 mL DMF to obtain a solution of 10 mg mL−1 concentration. The solution was then stirred at room temperature for 15 min, sonicated for 4 h, and finally centrifuged at 13![[thin space (1/6-em)]](https://www.rsc.org/images/entities/char_2009.gif) 000 rpm for 20 minutes to remove the large particles. Finally, the supernatant (CDs/DMF) was collected and used to make polymer–CDs composites.
000 rpm for 20 minutes to remove the large particles. Finally, the supernatant (CDs/DMF) was collected and used to make polymer–CDs composites.
Preparation of PVDF/CDs films
PVDF/CDs films were prepared by solution-casting method. A PVDF/DMF solution with a 20 wt% composition was prepared by dissolving PVDF powder in DMF at 60 °C with continuous stirring. After that, different amounts of the CDs/DMF solution (150, 300, 750, and 1200 μl) were added to the PVDF/DMF solution to get films with different content of CDs. The resulting PVDF/CDs/DMF solutions were stirred for 2 hours at 65 °C for proper mixing. Finally, fluorescent films (shown in Fig. 1) of PVDF/CDs (PVDF/CDs-150, PVDF/CDs-300, PVDF/CDs-750, and PVDF/CDs-1200) were successfully fabricated by solution casting in glass plates at 65 °C. Additionally, the PVDF/DMF solution was also used to fabricate films which were utilized as a reference. Finally, samples of 1.5 × 1.5 cm, obtained from the fabricated films, were used for UVA protection evaluation of sunscreen and more characterization. | ||
| Fig. 1 A solution of PVDF/DMF and CDs/DMF is used to fabricate films with different CD contents. The differences in fluorescence intensity for each film can be observed under 365 nm UV light. | ||
Material characterization
The absorption spectra of the CDs, PVDF/CDs films, and the commercial sunscreens were obtained in a dual-beam PerkinElmer Lambda 950 spectrophotometer. The photoluminescent characteristics of the CDs and PVDF/CDs films were carried out with Cary Eclipse Fluorescence Spectrophotometer. The morphology of the PVDF/CDs films was analyzed in Hitachi FESEM. The surface characteristics of the CDs and the semi-crystalline properties of the PVDF/CDs films were studied using Fourier transform infrared (FTIR) spectra-Varian 660-IR FTIR spectrophotometer.Characterization of sunscreens
The absorption spectra (in a range of 290 nm to 400 nm) of the eight samples were obtained using UV-Vis spectrophotometry. For this, the same quantity of each sunscreen (1.2 g cm−2) was uniformly applied to PMMA based composite substrates, as suggested by the protocols for measuring SPF.39,40 The absorption spectra were used to obtain the following parameters: SPF, CW, SUI, percentage of UVA protection, and UVA/UVB coefficient. These parameters allow the evaluation of the level of UV protection of the sunscreen samples. The abbreviations (CB 50+, HT 50+, HTSH 50+, BBT 50, AS 30+, BBT 30, CB 30, LD 15) used to identify the samples were chosen according to the product name and their SPF.Evaluation of UVA protection of sunscreens
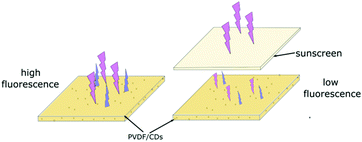
The evaluation of the UV protection proposed in this work is based on the fluorescence of PVDF/CDs films when they are excited with UV radiation. The sunscreens spread on the surface of the films, block the excitation wavelengths, causing a decrease in the fluorescence of the films, as observed in the scheme of Fig. 2.With the aim of testing the level of sun protection of the sunscreens, two different tests were carried out. In the first case, the photoluminescence of PVDF/CDs films, coated with sunscreens, was measured in the Cary Eclipse Fluorescence Spectrophotometer. The tests were performed with excitation wavelengths from 290 nm to 400 nm in 10 nm steps. The intensity of the fluorescence of the sunscreens coated CDs/PVDF films indicates the level of protection of the sunscreens for each excitation wavelength.
For the second test, photographs of the PVDF/CDs films coated with 1.8 g cm−2 of sunscreen were taken when excited with a commercial 365 nm lamp. This qualitative test was complemented quantitatively with photoluminescence intensity measurements of the films at 370 nm excitation. This excitation wavelength was selected because this is used as a parameter of reference in the CW.
Evaluation of UVA protection in glasses
In this case, a luminescent PVDF/CDs film was used to qualitatively evaluate the UVA protection of commercial glasses with protection against this type of radiation. A 365 nm lamp was used to excite a PVDF/CDs film coated with UVA-protected lenses. The fluorescence intensity of the films indicated the level of UVA protection of the products.Fabrication of WLEDs
UV chips with an emission wavelength centered at 365 nm were selected to fabricate white LEDs. The prepared PVDF/DMF-CDs 1200 solution was used to cover the UV chip in two ways. Firstly, a UV chip was covered with a PVDF/CDs film dried at room temperature (PVDF/CDs-W). Secondly, a UV chip was covered with a PVDF/CDs film dried at 65 °C (PVDF/CDs-T). The film dried at room temperature had a white coloration, while the film dried at 65 °C was transparent.Results and discussion
CDs/DMF solution
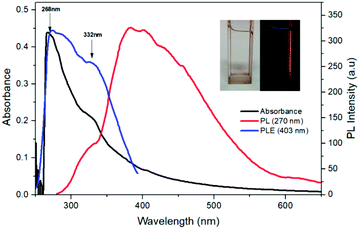
Fig. 3 shows the absorption spectrum and photoluminescence characteristics of the CDs/DMF. The absorbance spectrum shows an intense peak at 268 nm attributed to a π–π* transition41 and another peak at 332 nm attributed to an n–π* transition.23 These absorbance peaks are similar to those reported in the literature for CDs prepared in DMF.42 The sample exhibits strong luminescence peaked at 403 nm when excited with a wavelength of 270 nm. The diluted CD/DMF solution, inset in Fig. 3, exhibits a slight yellowish coloration under daylight and bluish-white coloration under 365 nm excitation. Additionally, Fig. S1† shows the photoluminescence properties of the CDs/DMF at different excitation wavelengths. There is a red shift in the emission peak as the excitation wavelength increase.The fluorescence stability of the CD/DMF solution is shown in Fig. 4. After a 30 days follow-up, there is no apparent decrease in PL intensity, so the CDs are highly stable under ambient conditions for at least 30 days.
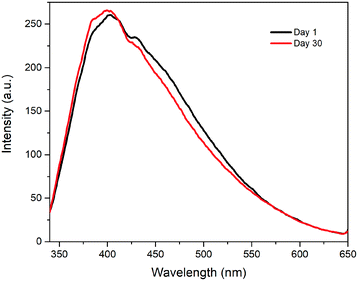 | ||
| Fig. 4 PL signal intensity of the CDs/DMF solution after a 30 days under ambient conditions. No decrease in photoluminescence intensity is observed, which is evidence of its stability. | ||
PVDF/CDs films
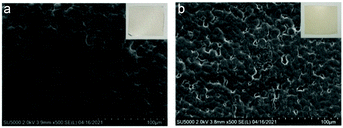
Fig. 5 shows the morphology of the PVDF and PVDF/CDs-1200 films. It is possible to appreciate that there are no apparent changes in the surface of the films. This behavior indicates no significant effects on the morphology of the films by adding the CDs to the PVDF polymer matrix. The rough surface of the films is a desirable feature for substrates used for in vitro SPF measurements, as indicated in several articles.13,43 Insets of Fig. 5 reveals PVDF (a) and PVDF/CDs-1200 (b) films under daylight. The addition of carbon dots to the PVDF polymer matrix resulted in a yellowish coloration.Fig. 6 depicts the absorbance spectra of the PVDF/CDs films. The absorption band located at 275 nm is due to the carbon dots. There is a slight shift of this peak to the peak located at 268 nm obtained for the CDs in DMF. This shift could be due to the interaction of the CDs with the PVDF structure. It is also visible the absorption band located at 332 nm, which coincides with the absorption band of the CD/DMF sample. It is important to note that the two absorption bands (275 nm and 332 nm) in the PVDF/CDs films increase in intensity as the amount of CDs/DMF solution added to the polymer increase. The PVDF/CD-150, PVDF/CD-300, and PVDF/CD-750 films show similar absorbance at wavelengths of the visible spectrum; however, the PVDF/CDs-1200 sample exhibits an increase in absorption at the same wavelengths.
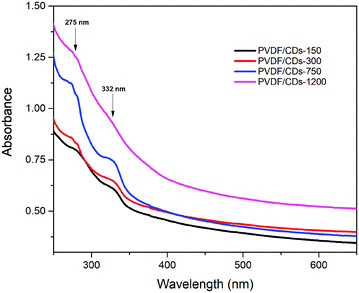 | ||
| Fig. 6 Absorbance spectra of the PVDF films with different content of CDs. An increase in absorption at 275 nm and 332 nm wavelengths can be seen as the content of CDs in the films increases. | ||
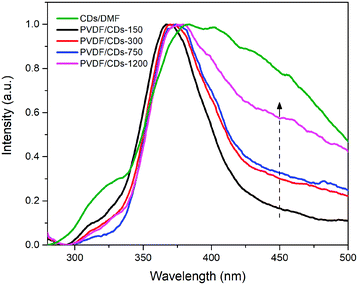
The photoluminescence spectra of PVDF films with different content of CDs are shown in Fig. 7. All films have a maximum emission peak around 400 nm when excited at 270 nm. Nevertheless, it is possible to notice an increase in the visible wavelength emission (around 450 nm) of the PVDF/CDs films as CDs increase. In the graph of Fig. S2,† it is possible to see that the emission is shifted towards the visible spectrum as the excitation wavelength increases, similarly to the PL spectra of the CD/DMF solution. The intensity of the photoluminescence at 456 nm for different excitation wavelengths is shown in Fig. S3.† This wavelength emission was used to evaluate the changes in fluorescence of the films coated with sunscreen products.
FTIR study
The FTIR study was performed in two ways. Firstly, the analysis focused on knowing the influence of CDs in the PVDF/CDs films. The FTIR spectrum of PVDF films shown in Fig. 8 reveals a vibrational band at 1168 cm−1 which is characteristic of the asymmetrical stretching from CF2; also, the C–H bond from the PVDF structure is revealed at 1410 cm−1 with a vibration bending of CH2 groups.44 In the other hand, the CDs spectrum (considered without solvent influence) shows the main vibrational bands at: 3630 cm−1 associated with the stretching of O–H bond, 2901 cm−1 referred to the stretching of C–H,45,46 1650 cm−1 of C![[double bond, length as m-dash]](https://www.rsc.org/images/entities/char_e001.gif) O stretching band,45 1550 cm−1 of a medium bending band vibration of N–H bond corresponding to the scissoring of NH2, 1415 cm−1 of C–O–H in plane bending band,47 1066 cm−1 stretching band of C–O,48 and finally, at 880 cm−1 probably related to the bending vibration of C–H.49 Spectra of mixed PVDF/CDs clearly present the influence of both compounds' vibration bands.
O stretching band,45 1550 cm−1 of a medium bending band vibration of N–H bond corresponding to the scissoring of NH2, 1415 cm−1 of C–O–H in plane bending band,47 1066 cm−1 stretching band of C–O,48 and finally, at 880 cm−1 probably related to the bending vibration of C–H.49 Spectra of mixed PVDF/CDs clearly present the influence of both compounds' vibration bands.
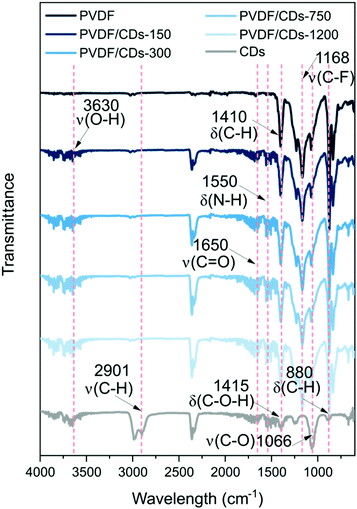 | ||
| Fig. 8 FTIR spectra for the PVDF and PVDF/CDs films indicating the influence of the CDs in the PVDF structure. | ||
Secondly, the analysis focused on identifying the vibrational bands corresponding to the crystalline phases of the PVDF. The FTIR spectra of Fig. 9 show the characteristic bands at 1232 cm−1, 1275 cm−1, and 763 cm−1 associated with the presence of γ, β, and α phases, respectively.50,51 Additionally, the FTIR spectra exhibit a band at 836.9 cm−1 which is a contribution of both the γ (833 cm−1) and β (840 cm−1) phases of PVDF50 γ and β phases coexist in the films. Notably, the addition of CDs does not appear to adversely affect the crystalline properties of the PVDF films, as can be seen from the bands at 1275 cm−1, 1232 cm−1, 836.9 cm−1, and 763 cm−1 which are similar between pure PVDF and PVDF/CDs films.
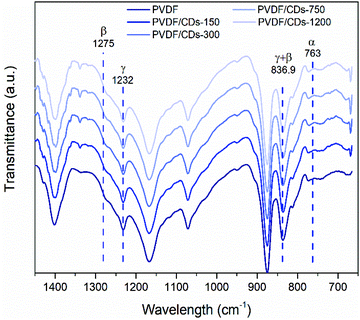 | ||
| Fig. 9 FTIR spectra for the PVDF and PVDF/CDs films (lines indicate the characteristic absorption bands of the α, β, and γ phases). | ||
Characterization of sunscreens
Fig. 10 shows the absorbance spectra of eight sunscreen products of different SPF (enlisted in the inserted table). It is possible to appreciate the level of protection of the sunscreens across the UV spectrum from 290 nm to 400 nm. The CB30 and AS30+ samples have a decreased absorption at wavelengths corresponding to UVA. This behavior is not observed for the rest of the sunscreen products.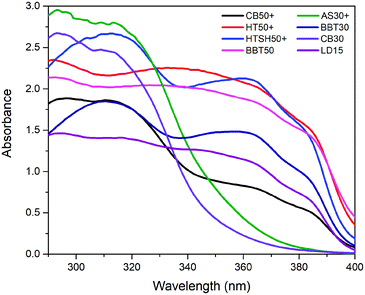 | ||
| Fig. 10 Absorbance spectra of the sunscreen samples, AS30+ and CB30 show low absorption in the UVA range, which indicates poor UVA radiation protection of these samples. | ||
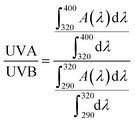
Absorbance spectra make it possible to obtain specific parameters that indicate the level of UV and UVA protection of sunscreens. The parameters SPF, CW, SUI, UVA blocking, and UVA/UVB shown in Table 1 were calculated according to the literature8,52 with the eqn (1)–(5), respectively. E(λ) is the relative erythema action spectrum, S(λ) is the spectral irradiance (Wm−2 nm−1), A(λ) is the spectral absorbance on the sunscreens, Ā is the average spectral absorbance of the sunscreens from 290 nm to 380 nm, and T(λ) is the spectral transmittance of the sunscreens. The obtained information was used as a reference for this work. The CW must be equal to or greater than 370 nm for that a product has good UVA protection9 (broad-spectrum protection), so it is possible to see that the CB30 and AS30+ samples do not meet this requirement. The SUI should be evaluated as follows:11 low, <2; intermediate, 2–4; high, 5–11; very high, >12. Therefore, most of the samples satisfy this requirement, except samples CB30 and AS30+ , which have a low SUI. CB30 and AS30+ samples have a UVA/UVB ratio lower than 0.2. Sunscreen products with UVA/UVB ratio ranging from 0.21 to 0.4 present minimal UVA protection.8
| Sample | Labelled SPF | In vitro SPF | CW (nm) | SUI | UVA blocking (%) | UVA/UVB |
|---|---|---|---|---|---|---|
| CB 50+ | 50+ | 21.78 | 371 | 2.83 | 78.07 | 0.449 |
| HT 50+ | 50+ | 95.02 | 380 | 17.92 | 95.9 | 0.826 |
| HTSH 50+ | 50+ | 106.67 | 377 | 8.7 | 93.42 | 0.69 |
| BBT 50 | 50 | 78.4 | 380 | 16.61 | 95.9 | 0.819 |
| AS 30+ | 30+ | 15.07 | 345 | 1.61 | 56.67 | 0.277 |
| BBT 30 | 30 | 34.64 | 376 | 9.1 | 87.7 | 0.688 |
| CB 30 | 30 | 11.07 | 340 | 1.38 | 47.18 | 0.22 |
| LD 15 | 15 | 17.84 | 374 | 8.39 | 82.49 | 0.681 |
The decreased UVA protection of the CB30 and AS30+ samples is also evident considering the percentage of UVA blocking. This protection is around 50% for both cases, compared to 80% or more for the other samples. Finally, the SPF obtained for the CB50+, CB30, and AS30+ products is lower than the SPF labeled by the manufacturers.
 | (1) |
 | (2) |
 | (3) |
 | (4) |
 | (5) |
Evaluation of UVA protection of sunscreens
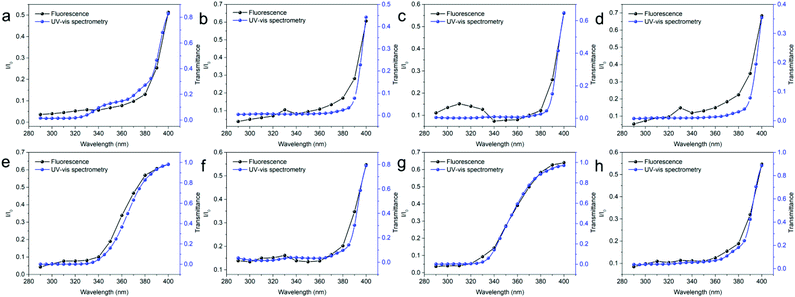
The film PVDF/CDs-1200 was used to evaluate the UVA protection of the sunscreen products, as this film has a higher PL emission in the visible spectrum than those of the rest of the films with lower content of CDs. The blue curves in Fig. 11 show a ratio between fluorescence intensity (I0) of the PVDF/CDs films without sunscreen (blank) and the fluorescence intensity (I) of the films coated with the different sunscreens. The wavelength emission used to calculate the I/I0 ratio was 456 nm. This wavelength was used because the emission peak of the films shifts towards blue as the excitation wavelength increases. Moreover, this wavelength can be used to visually assess UVA protection, as in the application reported in a later section.A decrease in the fluorescence intensity of the coated films indicates a higher level of UV protection of the sunscreens. In other words, the higher the I/I0 ratio, the lower the protection of the sunscreen for a specific wavelength. The blue curves reveal how the level of protection decreases as the excitation wavelength is closer to 400 nm. This behavior is similar to that of the black curves (transmittance curves obtained from the absorbance measurements reported above) shown in the same figure. The I/I0 curves of the AS30+ and CB30+ samples reveal poor protection in the UVA range. This behavior is in agreement with the data in Table 1.
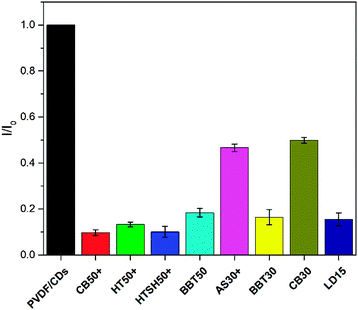
The 370 nm wavelength is a reference to identify the level of UVA protection as indicated by the CW parameter. Therefore, this wavelength was used to estimate the UVA protection level of the sunscreen samples. The graph in Fig. 12 shows the I/I0 ratio for 370 nm excitation. The PVDF/CDs film without cream was used as a blank. The films coated with the AS30+ and CB30 samples show higher I/I0 than those coated with the other sunscreen products. This fact indicates that the AS30+ and CB30 do not have low protection in the UVA range.
Considering that I/I0 = 1 indicates 0% protection (PVDF/CDs without sunscreen), percentages of UVA protection were calculated for each sample. In Fig. 13, it can be seen an estimation of the UVA protection percentage obtained through the proposed evaluation mechanism. For comparison, the graph also shows the UVA blocking percentages presented in Table 1. There is a similar trend in the percentages of UVA protection calculated by the proposed method to those obtained by UV-vis spectrometry (in vitro technique).
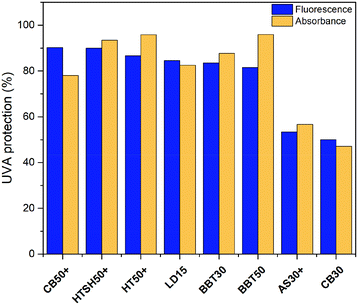 | ||
| Fig. 13 Comparative of UVA protection percentage obtained through the proposed evaluation mechanism (fluorescence) and the absorbance measurements (UV-vis). | ||
It is necessary to mention the different sources of error that should be considered in future research to evaluate the accuracy of the proposed method. Most in vitro techniques to evaluate SPF and UVA protection are based on the absorbance of sunscreens deposited on substrates of different materials.14,53–55 Therefore, there are different sources of error caused by human error. The weighing of the sunscreen and applying the sunscreens on the substrates are the primary error sources identified in the literature.56,57 Although the method for applying the creams used in this work is based on the protocols reported in the literature,39 it is necessary to propose new techniques of sunscreen deposition to achieve a uniform application of the sunscreen on the substrates.56
Sunscreens have a certain degree of fluorescence58,59 that may alter the measurements of the proposed method to evaluate UVA protection. However, considering the results obtained in this work, the fluorescence of the sunscreens was not an impediment to identify samples with poor UVA protection. Additionally, the effects of sunscreen fluorescence can be minimized by reducing the amount of sunscreen and incorporating CDs with higher levels of photoluminescence. In previous research, fluorescence spectrometry was attempted to measure the UV protection of sunscreens, but the technique was discarded because of the poor fluorescence of the sunscreens.60 This proposed method allows identifying products with inadequate UVA protection by using fluorescence properties of the PVDF/CDs films.
Finally, a visual evaluation of the UVA protection can be performed using a 365 nm commercial lamp. This wavelength was selected because this wavelength is very close to the CW. As shown in Fig. 14 photographs, the intensity of the luminescence of the sunscreen coated films is also indicative of the level of UVA protection of the samples. As in the previous tests, the poor UVA protection level of the AS30+ and CB30 samples is easily identifiable. This proposed application can be an alternative to identify the level of UVA protection of sunscreens products rapidly. The quality control of sunscreen products can take advantage of this proposed method to identify visually inferior quality products. It is interesting to mention that machine vision is a technology that has been recently used to provide image-based inspection in quality control, allowing accurate and precise measurements.61–63 This proposed method could complement machine vision to create an automated method to verify the UV protection of sunscreen products.
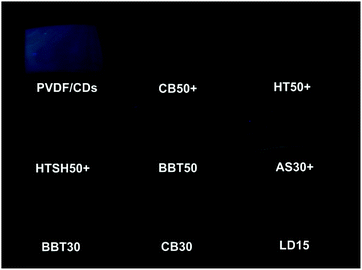 | ||
| Fig. 14 Visual evaluation of the UVA protection of sunscreen products, the higher the fluorescence, the lower the UVA protection of the sunscreen. | ||
Resistance of CDs and PVDF/CDs films
Fig. 15 shows the photoluminescence behavior of PVDF/CDs films in 8 cycles of applying sunscreen and cleaning with ethanol. As seen in the graph, there is no degradation of the fluorescent films when cleaned with ethanol, which indicates the good chemical resistance of PVDF/CDs films. Furthermore, since the fluorescence of the sunscreen coated films is fully recovered after cleaning with ethanol, they can be reused in the UV protection evaluation tests.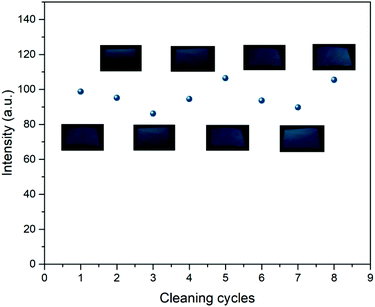 | ||
| Fig. 15 Photoluminescence intensity of PVDF/CDs films in 8 cycles of applying sunscreen and cleaning with ethanol. The photoluminescence remains stable in each cleaning cycle. | ||
Resistance of PVDF/CD films to direct sunlight exposure
The graph in Fig. S4,† shows a 19.5% decrease in the photoluminescence intensity of the films after 6 hours of continuous exposure to sunlight. The duration of the proposed UVA evaluation mechanism does not exceed 10 minutes. Moreover, the intensities of UV radiation applied to the films are lower than those generated by the sun, then the PVDF/CDs films can be used in the proposed tests without problems of photoluminescence degradation.Additionally, the photostability of CDs for a time much longer than 30 days has been reported for similar CDs,21 which is evidence of the potential of CDs for optical applications.
Evaluation of the UVA protection capacity of UV protective glasses
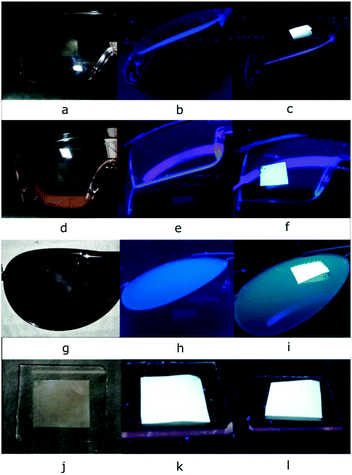
Three commercial UV protective glasses of different brands were visually evaluated to know their UVA protection capability. As shown in Fig. 16b, e, and h, the samples present a certain level of protection against UVA radiation. For comparison, the same test was performed with a standard glass substrate, which offers no protection against UVA radiation. As shown in Fig. 16, the fluorescence of the PVDF/CDs film is evident even when the sample is covered with glass. The quality control of UV protective glasses is of great interest because UVA radiation can promote retinal UV damage.64 The proposed application can also be used in machine vision for quality control purposes.WLED application
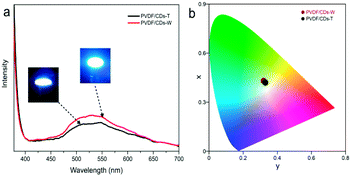
The electroluminescent emission spectra (Fig. 17) of the WLEDS are composed of two bands. The first peak, around 365 nm is originated from the UV chip. The emission peak around 530 nm is mainly derived from the photoluminescence of the PVDF/CDs films. The CIE coordinates of the PVDF/CDs-W (0.32, 0.43) and PVDF/CDs-T (0.33, 0.42) show white emission tending slightly to green. The correlated colour temperatures of the prepared PVDF/CDs-W and PVDF/CDs-T WLEDs are 5863 K and 5576 K, respectively. Therefore, the fabricated WLEDs emit cool white light,17 which can be very useful for office and outdoor illumination.65 The differences observed between the emission peak of this WLED (530 nm) and the emission peak of CDs (430 nm) attributed to some form of energy transfer between CDs and PVDF. WLEDs fabricated with PVDF/CDs solution dried at RT and dried at 65 °C show similar emissions. As PVDF has good chemical and UV degradation resistance, the proposed composite (PVDF-CDs) can be a good candidate to fabricate WLEDs for outdoor illumination after sufficient optimization of UV component elimination.Conclusions
This work offers an alternative way to quantify the UVA protection capability of sunscreens using reusable polymeric films, which could also allow measuring the UV protection given from commercially available glasses (eyeglasses/window-panes etc), clothing, and other UV protective elements. Additionally, the image-based evaluation of the UVA protection of sunscreens and glasses can be exploited for machine vision-based quality control applications to create automated verification systems. Finally, due to the fluorescent characteristics of the proposed PVDF/CD films, the proposed composite films can have great potential for fluorescence sensing and WLED illumination applications.Author contributions
D. H. R. carried out the main experiments related to the composite formation, characterization, and application along with the preparation of the manuscript; S. D. T. L. synthesized and characterized the carbon nanoparticles; M. R. A. performed the F. T. I. R. analysis; V. A. participated in conceptualization, fund acquisition, coordination and helped draft the manuscript. All the authors read and approved the final manuscript.Conflicts of interest
There are no conflicts to declare.Acknowledgements
VA acknowledges the financial grant from CONACyT Basic Sciences project A1-S-30393. DHR acknowledges the postdoctoral fellowship received from CONACYT.References
- M. Watson, D. M. Holman and M. Maguire-Eisen, Semin. Oncol. Nurs., 2016, 32, 241–254, DOI:10.1016/j.soncn.2016.05.005.
- D. L. Narayanan, R. N. Saladi and J. L. Fox, Int. J. Dermatol., 2010, 49, 978–986, DOI:10.1111/j.1365-4632.2010.04474.x.
- A. R. Young, J. Claveau and A. B. Rossi, J. Am. Acad. Dermatol., 2017, 76, S100–S109, DOI:10.1016/j.jaad.2016.09.038.
- World Health Organization, Radiation: Ultraviolet (UV) radiation and skin cancer, https://www.who.int/news-room/q-a-detail/radiation-ultraviolet-(uv)-radiation-and-skin-cancer Search PubMed.
- I. Serre, J. P. Cano, M. C. Picot, J. Meynadier and L. Meunier, J. Am. Acad. Dermatol., 1997, 37, 187–194, DOI:10.1016/S0190-9622(97)80123-5.
- A. Amaro-Ortiz, B. Yan and J. A. D’Orazio, Molecules, 2014, 19, 6202–6219, DOI:10.3390/molecules19056202.
- World health organization, Radiation: Sun protection, https://www.who.int/news-room/q-a-detail/radiation-sun-protection Search PubMed.
- J. P. Castanedo-Cázares, K. Martínez-Rosales, D. Hernández-Blanco, G. Valdés-Rodríguez and B. Torres-Álvarez, Invest. Clin., 2014, 55, 142–154 Search PubMed.
- S. Q. Wang, H. Xu, J. W. Stanfield, U. Osterwalder and B. Herzog, J. Am. Acad. Dermatol., 2017, 77, 42–47, DOI:10.1016/j.jaad.2017.01.017.
- K. Hedayat, S. A. Nasrollahi, A. Firooz, H. Rastegar and M. Dadgarnejad, Clin. Cosmet. Investig. Dermatol., 2020, 13, 351–358, DOI:10.2147/CCID.S244898.
- B. Diffey, Int. J. Cosmet. Sci., 2009, 31, 63–68, DOI:10.1111/j.1468-2494.2008.00471.x.
- S. Bielfeldt, E. Klette, M. Rohr, B. Herzog, J. Grumelard, C. Hanay, U. Heinrich, P. Hansen, D. Kockott, J. Lademann, C. Mendrok-Edinger, S. Peters, T. Rudolph, T. Schläger, H. Tronnier, S. Wiechers, L. Zastrow and F. Pflücker, J. Photochem. Photobiol., B, 2018, 189, 185–192, DOI:10.1016/j.jphotobiol.2018.10.018.
- M. Sohn, C. Malburet, L. Baptiste and Y. Prigl, Skin Pharmacol. Physiol., 2017, 30, 159–170, DOI:10.1159/000464471.
- D. Garoli, M. G. Pelizzo, P. Nicolosi, A. Peserico, E. Tonin and M. Alaibac, J. Dermatol. Sci., 2009, 56, 89–98, DOI:10.1016/j.jdermsci.2009.07.015.
- M. L. Liu, B. Bin Chen, C. M. Li and C. Z. Huang, Green Chem., 2019, 21, 449–471, 10.1039/C8GC02736F.
- H. Li, X. Yan, D. Kong, R. Jin, C. Sun, D. Du, Y. Lin and G. Lu, Nanoscale Horiz., 2020, 5, 218–234, 10.1039/c9nh00476a.
- Q. Du, J. Zheng, J. Wang, Y. Yang and X. Liu, RSC Adv., 2018, 8, 19585–19595, 10.1039/c8ra02226g.
- F. Yarur, J. R. Macairan and R. Naccache, Environ. Sci.: Nano, 2019, 6, 1121–1130, 10.1039/c8en01418c.
- H. Sha, Q. Xin, X. Jia and J. R. Gong, Arabian J. Chem., 2019, 12, 1083–1091, DOI:10.1016/j.arabjc.2019.06.004.
- M. Latha, R. Aruna-Devi, N. K. R. Bogireddy, S. E. S. Rios, W. L. Mochan, J. Castrellon-Uribe and V. Agarwal, RSC Adv., 2020, 10, 22522–22532, 10.1039/d0ra02694h.
- N. K. R. Bogireddy, J. Lara, L. R. Fragoso and V. Agarwal, Chem. Eng. J., 2020, 401, 126097, DOI:10.1016/j.cej.2020.126097.
- S. Chandra, T. K. Mahto, A. R. Chowdhuri, B. Das and S. kumar Sahu, Sens. Actuators, B, 2017, 245, 835–844, DOI:10.1016/j.snb.2017.02.017.
- J. Gu, X. Li, D. Hu, Y. Liu, G. Zhang, X. Jia, W. Huang and K. Xi, RSC Adv., 2018, 8, 12556–12561, 10.1039/c8ra01085d.
- S. C. Hess, F. A. Permatasari, H. Fukazawa, E. M. Schneider, R. Balgis, T. Ogi, K. Okuyama and W. J. Stark, J. Mater. Chem. A, 2017, 5, 5187–5194, 10.1039/c7ta00397h.
- S. Wu, W. Li, W. Zhou, Y. Zhan, C. Hu, J. Zhuang, H. Zhang, X. Zhang, B. Lei and Y. Liu, Adv. Opt. Mater., 2018, 1701150, DOI:10.1002/adom.201701150.
- B. Kumar Barman, T. Nagao and K. K. Nanda, Appl. Surf. Sci., 2020, 510, 145405, DOI:10.1016/j.apsusc.2020.145405.
- Y. C. Hu, W. L. Hsu, Y. T. Wang, C. T. Ho and P. Z. Chang, Sensors, 2014, 14, 6877–6890, DOI:10.3390/s140406877.
- Y. Liu, P. Wang, K. A. Shiral Fernando, G. E. Lecroy, H. Maimaiti, B. A. Harruff-Miller, W. K. Lewis, C. E. Bunker, Z. L. Hou and Y. P. Sun, J. Mater. Chem. C, 2016, 4, 6967–6974, 10.1039/c6tc01932c.
- L. Dong, Z. Xiong, X. Liu, D. Sheng, Y. Zhou and Y. Yang, J. Appl. Polym. Sci., 2019, 136, 47555, DOI:10.1002/app.47555.
- G. J. Choi, S. H. Baek, S. S. Lee, F. Khan, J. H. Kim and I. K. Park, J. Alloys Compd., 2019, 797, 945–951, DOI:10.1016/j.jallcom.2019.05.202.
- A. Jafari, M. R. S. Kebria, A. Rahimpour and G. Bakeri, Chem. Eng. Process. – Process Intensif., 2018, 126, 222–231, DOI:10.1016/j.cep.2018.03.010.
- A. Badawi, S. S. Alharthi, N. Y. Mostafa, M. G. Althobaiti and T. Altalhi, Appl. Phys. A Mater. Sci. Process., 2019, 125, 858, DOI:10.1007/s00339-019-3160-1.
- D. Zhang, W. Jiang, Y. Zhao, Y. Dong, X. Feng and L. Chen, Appl. Surf. Sci., 2019, 494, 635–643, DOI:10.1016/j.apsusc.2019.07.141.
- E. Suaste-Gómez, G. Rodríguez-Roldán, H. Reyes-Cruz and O. Terán-Jiménez, Sensors, 2016, 16, 332, DOI:10.3390/s16030332.
- F. Liu, N. A. Hashim, Y. Liu, M. R. M. Abed and K. Li, J. Memb. Sci., 2011, 375, 1–27, DOI:10.1016/j.memsci.2011.03.014.
- M. Kushwah, R. Sagar, A. A. Rogachev and M. S. Gaur, Vacuum, 2019, 166, 298–306, DOI:10.1016/j.vacuum.2019.05.010.
- D. Hernández-Rivera, G. Rodríguez-Roldán, R. Mora-Martínez and E. Suaste-Gómez, Sensors, 2017, 17, 1009, DOI:10.3390/s17051009.
- J. Li, Z. Ji, H. Sun, D. Zhang, Y. Zhao and L. Chen, Environ. Technol., 2020 DOI:10.1080/09593330.2020.1845820.
- M. Pissavini, L. Ferrero, V. Alard, U. Heinrich, H. Tronnier, D. Kockott, D. Lutz, V. Tournier, M. Zambonin and M. Meloni, Cosmet. Toilet., 2003, 118, 65–70 Search PubMed.
- S. L. Oliveira, A. M. Mansanares, E. C. da Silva and P. R. Barja, Eur. Phys. J.: Spec. Top., 2008, 153, 475–478 Search PubMed.
- S. Sarkar, D. Gandla, Y. Venkatesh, P. R. Bangal, S. Ghosh, Y. Yang and S. Misra, Phys. Chem. Chem. Phys., 2016, 18, 21278–21287, 10.1039/c6cp01528j.
- M. Yang, B. Li, K. Zhong and Y. Lu, J. Mater. Sci., 2018, 53, 2424–2433, DOI:10.1007/s10853-017-1700-7.
- L. Fageon, D. Moyal, J. Coutet and D. Candau, Int. J. Cosmet. Sci., 2009, 31, 405–417, DOI:10.1111/j.1468-2494.2009.00524.x.
- X. Lu, Y. Peng, H. Qiu, X. Liu and L. Ge, Desalination, 2017, 413, 127–135, DOI:10.1016/j.desal.2017.02.022.
- A. Kurdekar, L. A. A. Chunduri, E. P. Bulagonda, M. K. Haleyurgirisetty, V. Kamisetti and I. K. Hewlett, Microfluid. Nanofluidics, 2016, 20, 99, DOI:10.1007/s10404-016-1763-9.
- M. Thakur, S. Pandey, A. Mewada, V. Patil, M. Khade, E. Goshi and M. Sharon, J. Drug Deliv., 2014, 2014, 282193, DOI:10.1155/2014/282193.
- T. Kondratenko, O. Ovchinnikov, I. Grevtseva, M. Smirnov, O. Erina, V. Khokhlov, B. Darinsky and E. Tatianina, Mater, 2020, 13, 909, DOI:10.3390/ma13040909.
- A. Başoğlu, Ü. Ocak and A. Gümrükçüoğlu, J. Fluoresc., 2020, 30, 515–526, DOI:10.1007/s10895-019-02428-7.
- Y. Li, X. Zhong, A. E. Rider, S. A. Furman and K. Ostrikov, Green Chem., 2014, 16, 2566–2570, 10.1039/c3gc42562b.
- S. Barrau, A. Ferri, A. Da Costa, J. Defebvin, S. Leroy, R. Desfeux and J. M. Lefebvre, ACS Appl. Mater. Interfaces, 2018, 10, 13092–13099, DOI:10.1021/acsami.8b02172.
- A. Salimi and A. A. Yousefi, Polym. Test., 2003, 22, 699–704, DOI:10.1016/S0142-9418(03)00003-5.
- Y. Wang, J. Su, T. Li, P. Ma, H. Bai, Y. Xie, M. Chen and W. Dong, ACS Appl. Mater. Interfaces, 2017, 9, 36281–36289, DOI:10.1021/acsami.7b08763.
- S. Scalia, M. Mezzena and A. Bianchi, Int. J. Cosmet. Sci., 2010, 32, 55–64, DOI:10.1111/j.1468-2494.2009.00536.x.
- M. D. Bleasel and S. Aldous, Int. J. Cosmet. Sci., 2008, 30, 259–270, DOI:10.1111/j.1468-2494.2008.00453.x.
- H. Bendová, J. Akrman, A. Krejčí, L. Kubáč, D. Jírová, K. Kejlová, H. Kolářová, M. Brabec and M. Malý, Toxicol. Vitr., 2007, 21, 1268–1275, DOI:10.1016/j.tiv.2007.08.022.
- D. L. Lott, J. Stanfield, R. M. Sayre and J. C. Dowdy, Photodermatol., Photoimmunol. Photomed., 2003, 19, 17–20, DOI:10.1034/j.1600-0781.2003.00007.x.
- M. Sohn, B. Herzog, U. Osterwalder and G. Imanidis, J. Photochem. Photobiol., B, 2016, 159, 74–81, DOI:10.1016/j.jphotobiol.2016.02.038.
- R. Krishnan and T. M. Nordlund, J. Fluoresc., 2008, 18, 203–217, DOI:10.1007/s10895-007-0264-3.
- R. Krishnan, C. A. Elmets and T. M. Nordlund, in Photonic Therapeutics and Diagnostics IV, Proc. SPIE, 2008, vol. 6842, p.684208 Search PubMed.
- R. P. Stokes and B. L. Diffey, J. Photochem. Photobiol., B, 1999, 50, 137–143, DOI:10.1016/S1011-1344(99)00084-6.
- D. K. Moru and D. Borro, Int. J. Adv. Manuf. Technol., 2020, 106, 105–123, DOI:10.1007/s00170-019-04426-2.
- K. K. Patel, A. Kar, S. N. Jha and M. A. Khan, J. Food Sci. Technol., 2012, 49, 123–141, DOI:10.1007/s13197-011-0321-4.
- L. Louw and M. Droomer, Procedia Manufacturing, 2019, 31, 264–269 CrossRef.
- R. D. Glickman, Eye Contact Lens, 2011, 37, 196–205, DOI:10.1097/ICL.0b013e31821e45a9.
- X. Feng, F. Zhang, Y. Wang, Y. Zhang, Y. Yang and X. Liu, J. Electron. Mater., 2016, 45, 2784–2788, DOI:10.1007/s11664-016-4407-7.
Footnote |
| † Electronic supplementary information (ESI) available. See DOI: 10.1039/d1ra04746a |
| This journal is © The Royal Society of Chemistry 2021 |

