 Open Access Article
Explosive vapour/particles detection using SERS substrates and a hand-held Raman detector†
Vered Heleg-Shabtai *a,
Amalia Zaltsmana,
Mali Sharona,
Hagai Sharabia,
Ido Nira,
Dana Marderb,
Guy Cohenc,
Izhar Rona and
Alexander Pevzner
 *a
*a
aDepartment of Physical Chemistry, Israel Institute for Biological Research, P.O. Box 19, Ness-Ziona 74100, Israel. E-mail: veredhs@iibr.gov.il; alexanderp@iibr.gov.il; Fax: +972 89381743; Tel: +972 89381457
bDepartment of Analytical Chemistry, Israel Institute for Biological Research, P.O. Box 19, Ness-Ziona 74100, Israel
cEnvironmental Physics Department, Israel Institute for Biological Research, P.O. Box 19, Ness-Ziona 74100, Israel
First published on 28th July 2021
Abstract
We developed and optimized surface-enhanced Raman spectrometry (SERS) methods for trace analysis of explosive vapour and particles using a hand-held Raman spectrometer in the field. At first, limits of detection (LODs) using SERS methods based on a colloidal suspension of gold nanoparticles were measured under alkaline conditions and are as follows: pentaerythritol tetranitrate (PETN) (1.5 × 10⁻⁶ M, 6.9 ng), 1,3,5,7-tetranitro-1,3,5,7-tetrazoctane (HMX), 8.1 × 10⁻⁶ M, 35 ng; urea nitrate (UN), 9.2 × 10⁻⁴ M, 165 ng; 2,4,6-trinitrotoluene (TNT), 1.1 × 10⁻⁷ M, 0.35 ng. We developed SERS substrates that demonstrate the wide applicability of this technique for use in the field for explosive vapour and particles adsorbed on a surface based on Au nanoparticles that were optimal for the detection of the target materials in solution. Au nanoparticles were modified onto quartz fibres or a polyurethane sponge for vapour/particles detection. SERS detection of vapours of 2,4-dinitrotoluene (2,4-DNT) and 1,3-dinitrobenzene (1,3-DNB) was shown by sampling vapours onto Au-modified quartz fibres followed by hand-held Raman analysis with estimated minimum detection levels of 3.6 ng and 54 ng, respectively. The detection of 2,4-DNT using sponge-based SERS decorated with Au nanoparticles was also demonstrated; however, the sensitivity was lower than that observed using quartz fibres. The detection of TNT on a surface was performed by utilizing quartz-fibres precoated with alumina and modified with Au nanoparticles, and the detection of 10 μg (0.53 μg cm−2) of TNT was demonstrated.
1. Introduction
Trace detection of explosives is a particularly challenging task owing to the diverse characteristics of explosive materials, such as a wide variety of materials that can be used as explosives, the low vapour pressure of common explosives (approximately 10 ppb for 2,4,6-trinitrotoluene (TNT) and 10 ppt for cyclotrimethylenetrinitramine (RDX) and pentaerythritol tetranitrate (PETN)),1 and the presence of improvised explosives. Sampling techniques for the trace detection of explosives typically involve collecting vapours or particulate samples and analyzing them using a sensitive sensor-based system. Currently, many different techniques exist for the detection of trace amounts of explosives; the most common include ion mobility spectrometry (IMS) and mass spectrometry (MS).2,3 Furthermore, colorimetric kits are also in comprehensive use. Surface-enhanced Raman spectrometry (SERS) has become an increasingly useful technique in homeland security applications (chemical and biological threats, and explosive materials).4,5 Raman spectroscopy provides unique structural information regarding the vibrational spectrum of diverse species.6 Using an appropriate database and algorithm, this information can be used to identify the contents of a sample. The utilization of Raman spectroscopy with SERS can increase the Raman signal of the target molecule by 6–10 orders of magnitude and therefore significantly increases the sensitivity, allowing the analysis of materials at low concentrations.7,8Hand-held/portable Raman detectors enable on-site detection of solid and liquid samples for homeland security purposes. Using SERS expands the capabilities of gas-phase analysis by initially adsorbing the vapours of the target materials onto a SERS substrate followed by analysis using a hand-held Raman detector.9–11
Hakonen et al.12 demonstrated ultra-sensitive detection of RDX and picric acid in the range of 0.8–4 pg using commercially available SERS substrates and a hand-held Raman spectrometer. Jankiewicz et al.13 investigated the detection of trace amounts of selected explosive materials on various commercial and non-commercial SERS substrates using portable Raman instruments. Detection ranged from single to hundreds of μg cm−2 was demonstrated, depending on the type of explosive (ammonium nitrate, RDX and TNT) and Raman spectrometer (portable/hand-held). Soma et al.14 demonstrated the capability to detect explosives (picric acid, 3-nitro-1,2,4- triazol-5-one and 2,4-dinitrotoluene) in various mixtures with dyes and other explosives using fabricated SERS substrates and a portable Raman spectrometer. The detection limits obtained in the case of explosive mixtures was in the range of micromolars.
Herein, we demonstrate the detection and identification of various explosive materials using a variety of sampling techniques including swab and gas-phase sampling. Firstly, SERS methods for the detection of PETN, urea nitrate (UN), 1,3,5,7-tetranitro-1,3,5,7-tetrazoctane (HMX), TNT and TNT precursors (Fig. S1†) were developed in a Au colloidal nanoparticle suspension. Secondly, optimized nanoparticles for SERS detection in solution were adsorbed onto quartz fibres or a polyurethane sponge, which were used for wiping surfaces or gas-phase sampling and were then analyzed using a hand-held Raman spectrometer.
2. Experimental
2.1 Chemicals
Hydroxylamine hydrochloride, trisodium citrate, ascorbic acid, hydrogen tetrachloroaurate trihydrate (HAuCl4·3H2O), alumina, sodium hydroxide, pentaerythritol, acetonitrile (AcCN), and methanol (MeOH) were purchased from Sigma-Aldrich. 2,4-dinitrotoluene (2,4-DNT) in MeOH![[thin space (1/6-em)]](https://www.rsc.org/images/entities/char_2009.gif) :
:![[thin space (1/6-em)]](https://www.rsc.org/images/entities/char_2009.gif) AcCN (1
AcCN (1![[thin space (1/6-em)]](https://www.rsc.org/images/entities/char_2009.gif) :
:![[thin space (1/6-em)]](https://www.rsc.org/images/entities/char_2009.gif) 1) 1 mg mL−1, 1,3-dinitrobenzene (1,3-DNB) in MeOH
1) 1 mg mL−1, 1,3-dinitrobenzene (1,3-DNB) in MeOH![[thin space (1/6-em)]](https://www.rsc.org/images/entities/char_2009.gif) :
:![[thin space (1/6-em)]](https://www.rsc.org/images/entities/char_2009.gif) AcCN (1
AcCN (1![[thin space (1/6-em)]](https://www.rsc.org/images/entities/char_2009.gif) :
:![[thin space (1/6-em)]](https://www.rsc.org/images/entities/char_2009.gif) 1) 1 mg mL−1, 2,6-dinitrotoluene, (2,6-DNT) in MeOH
1) 1 mg mL−1, 2,6-dinitrotoluene, (2,6-DNT) in MeOH![[thin space (1/6-em)]](https://www.rsc.org/images/entities/char_2009.gif) :
:![[thin space (1/6-em)]](https://www.rsc.org/images/entities/char_2009.gif) AcCN (1
AcCN (1![[thin space (1/6-em)]](https://www.rsc.org/images/entities/char_2009.gif) :
:![[thin space (1/6-em)]](https://www.rsc.org/images/entities/char_2009.gif) 1) 1 mg mL−1, TNT in MeOH
1) 1 mg mL−1, TNT in MeOH![[thin space (1/6-em)]](https://www.rsc.org/images/entities/char_2009.gif) :
:![[thin space (1/6-em)]](https://www.rsc.org/images/entities/char_2009.gif) AcCN (1
AcCN (1![[thin space (1/6-em)]](https://www.rsc.org/images/entities/char_2009.gif) :
:![[thin space (1/6-em)]](https://www.rsc.org/images/entities/char_2009.gif) 1) 1 mg mL−1, HMX in MeOH
1) 1 mg mL−1, HMX in MeOH![[thin space (1/6-em)]](https://www.rsc.org/images/entities/char_2009.gif) :
:![[thin space (1/6-em)]](https://www.rsc.org/images/entities/char_2009.gif) AcCN (1
AcCN (1![[thin space (1/6-em)]](https://www.rsc.org/images/entities/char_2009.gif) :
:![[thin space (1/6-em)]](https://www.rsc.org/images/entities/char_2009.gif) 1) 1 mg mL−1, PETN in MeOH 1 mg mL−1, and urea nitrate (UN) in MeOH
1) 1 mg mL−1, PETN in MeOH 1 mg mL−1, and urea nitrate (UN) in MeOH![[thin space (1/6-em)]](https://www.rsc.org/images/entities/char_2009.gif) :
:![[thin space (1/6-em)]](https://www.rsc.org/images/entities/char_2009.gif) AcCN (1
AcCN (1![[thin space (1/6-em)]](https://www.rsc.org/images/entities/char_2009.gif) :
:![[thin space (1/6-em)]](https://www.rsc.org/images/entities/char_2009.gif) 1) 1 mg mL−1 were purchased from AccuStandard® (New Haven, CT, USA). Ultrapure deionized water (Barnstead Nanopure system, Dubuque, IA, USA) was used throughout the experiments. Lower concentration solutions of the explosives were prepared by serial dilution in MeOH or MeOH
1) 1 mg mL−1 were purchased from AccuStandard® (New Haven, CT, USA). Ultrapure deionized water (Barnstead Nanopure system, Dubuque, IA, USA) was used throughout the experiments. Lower concentration solutions of the explosives were prepared by serial dilution in MeOH or MeOH![[thin space (1/6-em)]](https://www.rsc.org/images/entities/char_2009.gif) :
:![[thin space (1/6-em)]](https://www.rsc.org/images/entities/char_2009.gif) AcCN (1
AcCN (1![[thin space (1/6-em)]](https://www.rsc.org/images/entities/char_2009.gif) :
:![[thin space (1/6-em)]](https://www.rsc.org/images/entities/char_2009.gif) 1) and were stored at 4 °C prior to use.
1) and were stored at 4 °C prior to use.
2.2 Synthesis of colloidal Au nanoparticle suspensions
Colloidal Au nanoparticle suspensions were synthesized via the iterative hydroxylamine seeding method previously described by Brown et al.15 Briefly, the initial colloidal batch (∼12 nm Au colloid nanoparticles) was prepared using the Frens method,16 via the addition of 38.8 mM of sodium citrate to a stirred solution of boiling 0.01% w/w HAuCl4·3H2O. This mixture was boiled for 15 min and then stirred for an additional 10 min as it cooled. All subsequent colloid suspensions (Au(B–E), Table S1†) were produced by mixing reagent α (0.2 M hydroxylamine hydrochloride) with the diluted colloidal suspension in water and then adding reagent β (1.0% w/w HAuCl4·3H2O solution) to initiate the reaction. After adding reagent β, the colloidal suspension was stirred vigorously for 10 min at room temperature. The quantities of the reagents used for subsequent growth of the colloidal suspensions are summarized in Table S1.† After preparation, all colloidal suspensions were stored at 4 °C until further use.Colloidal Au nanoparticle suspensions for UN detection were synthesized using the method previously described by Murphy et al. with some modifications.17 The initial colloidal batch (∼12 nm Au colloid nanoparticles) was prepared as described above. 150 μL of 12 nm Au seeds with 2.5 mL HAuCl4⋅3H2O 10 mM were diluted up to 150 mL with deionized water. Under continuous stirring of the solution, 100 mL of freshly prepared ascorbic acid 4 × 10⁻⁴ M was added slowly at a flow rate of 10 mL min−1. After preparation, the colloidal suspensions (Au–Asc) were stored at 4 °C.
2.3 Fibre/sponge-based SERS substrates
Quartz fibre-based SERS substrates were prepared using a simple drop casting method. Initially, Whatman® quartz filters (CAT no. 1851-047) were cut into pieces approximately 1.0 × 1.5 cm2 in size. Then an approximately 200 μL Au colloidal nanoparticle suspension was uniformly added dropwise onto two layers of the cut filters.18,19 After air drying the filters (approximately 10 min), the coating procedure was repeated a further nine times. For wiping surface purposes, the quartz filter pieces were dipped into an alumina suspension in water (1% w/w) for 1 min prior to the deposition of the Au nanoparticles.20The sponge-based SERS substrates were prepared using the immersion deposition method. The polyurethane soft foam (SF) sponge was cut into 10 × 8 mm pieces. The pieces of polyurethane SF sponge were immersed for several hours in the Au–E colloidal nanoparticle suspension and the suspension was replaced twice.
After preparation the fibre/sponge-based SERS substrates were dried and stored at 4 °C until further use.
2.4 SERS substrate (suspension and fibres/sponge-based) characterization
The size and shape of the colloidal Au nanoparticle suspensions were characterized using UV-vis spectroscopy and scanning/transmission electron microscopy (SEM/TEM) analyses. UV-vis spectra of the Au suspensions were acquired using a Shimadzu UV-2401 dual-beam spectrophotometer equipped with halogen and deuterium lamps (190–900 nm range), and a resolution of 0.1 nm. For the TEM analysis, the Au suspensions were applied to 400 mesh formvar/carbon-coated copper grids. The samples were incubated for 0.5 min and the excess liquid was carefully blotted with Kimwipe® paper. After air drying, the samples were imaged using an FEI Tecnai T-12 transmission electron microscope operated at 120 kV and equipped with a Gatan ES500 W Erlangshen camera.Analysis of the Au colloids modified onto quartz fibres and the polyurethane SF sponge were performed using an FEI Quanta 200 field emission gun (FEG) environmental scanning electron microscope (ESEM). Images of the quartz fibre-based SERS substrates were obtained at 20 kV under low vacuum conditions. Images of the polyurethane SF sponge were obtained at 10 kV after 5 nm iridium sputter coating. The sputter coating was performed using a Q150T Quorum sputter coater.
2.5 Raman measurements using the nanoparticle suspension
Raman spectra were collected using a FirstDefender™ hand-held Raman spectrometer (ThermoFisher Scientific, Inc.). Excitation was provided by a 785 nm diode laser with an output power of 300 mW. The Raman measurements of the samples using the nanoparticle suspension were performed in glass vials that were 1.46 cm in diameter using the FirstDefender vial holder. The accumulation time ranged from 0.25 to 10 s. Explosives with defined concentrations were added to 1 mL of the Au colloidal suspension, followed by the addition of NaOH solution. Alkaline conditions produce a significant enhancement in the SERS signal strength.21,22 Prior to the Raman measurements the samples were vortexed. The optimized procedure and method for the detection of various explosive materials is summarized in Fig. S2(A)† and Table 1. The optimized SERS methods in the nanoparticle suspension served as a basis for the on-site sampling and SERS detection.| Target material | Colloidal suspension | Alkaline condition | Notes |
|---|---|---|---|
| PETN | Au–E | NaOH 10 mM | Prior to NaOH addition, 20 μL of MeOH was added |
| HMX | Au–D | NaOH 200 mM | |
| TNT/2,4-DNT/2,6-DNT/1,3-DNB | Au–D | NaOH 36 mM | |
| UN | Au–Asc | NaOH 28 mM |
2.6 SERS measurements from wiped surfaces
Explosive at known concentrations were dropped onto glass slides (2.5 × 7.5 cm2) and air-dried. Afterwards, the slides were wiped with quartz fibre-based SERS substrates (alumina-coated) that had been previously wetted with a solution of AcCN![[thin space (1/6-em)]](https://www.rsc.org/images/entities/char_2009.gif) :
:![[thin space (1/6-em)]](https://www.rsc.org/images/entities/char_2009.gif) MeOH (1
MeOH (1![[thin space (1/6-em)]](https://www.rsc.org/images/entities/char_2009.gif) :
:![[thin space (1/6-em)]](https://www.rsc.org/images/entities/char_2009.gif) 1). After sampling, 40 μL NaOH 0.5 M was dropped onto the SERS substrates and Raman measurements were performed in the shoot mode by focusing the laser beam at an approximate distance of 3 mm (using the position cone) from the surface, Fig. S2(B).†
1). After sampling, 40 μL NaOH 0.5 M was dropped onto the SERS substrates and Raman measurements were performed in the shoot mode by focusing the laser beam at an approximate distance of 3 mm (using the position cone) from the surface, Fig. S2(B).†
2.7 Experimental setup for gas-phase measurements
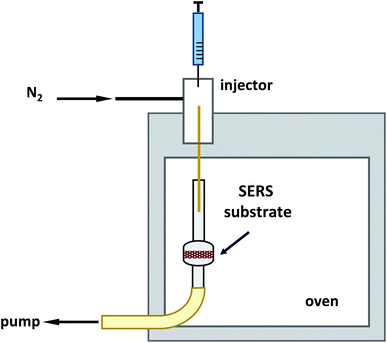
Exposure of the quartz/sponge-based SERS substrate to 2,4-DNT and 1,3-DNB (volatile TNT precursors) was performed using a homemade gas-phase flow system that has been previously described by Gura et al.23 An inert HP-6890 GC split/splitless injector was equipped with a homemade liner packed with Carbofrit and a 10 cm interface DB5-MS column with a 0.25 mm internal diameter and a 0.1 μm film thickness (cut from a 15 m column, CAT no. 122.5511, Agilent). The injector temperature was maintained at 225 °C with an N2 flow rate of 4 mL min−1. To generate a known vapour concentration, 2 μL of TNT precursors of known concentrations were injected into the pre-heated injection port for complete and efficient evaporation. The injections were performed while the short-interface DB5-MS column was inserted 1 cm inside the sampling tube and pumping at a constant flow rate of 200 mL min−1 for 5 min, see Fig. 1. Prior to vapour exposure, the quartz/sponge-based SERS substrates were wetted using a few drops of NaOH 1 M. For the quartz-based substrates, the Raman measurements were performed in the shoot mode by focusing the laser beam at an approximate distance of 3 mm (using the position cone) from the surface, Fig. S2(C).† Raman measurements using the sponge-based SERS substrates were performed in vials filled with water, in order to prevent localized heating of the sponge by the laser beam, which can produce smoke, Fig. S2(D).†3. Results and discussion
3.1 Characterization of the colloidal suspension and quartz/sponge-based substrates
Colloidal Au nanoparticle suspensions were synthesized using the iterative hydroxylamine seeding method15,16 and characterized using UV-vis and electron microscopy. The wavelength λmax (maximum absorbance) was red-shifted from 519 to 530 nm for Au–D nanoparticles and to 536 nm for Au–E nanoparticles as a result of the increase in the size of the nanoparticles, Fig. S3.†24 TEM images of the Au–D and Au–E nanoparticles, which have an almost spherical shape and an average diameter of 44 ± 8 and 60 ± 5 nm, respectively, are shown in Fig. S4.† An SEM image of the Au–Asc nanoparticles with an average diameter of 75 ± 10 is shown in Fig. S5.†From the preliminary studies used to analyze the dependence of the SERS intensity on the nanoparticle properties (including type of metal, surface coverage and size) in suspension, it was found that the above-mentioned nanoparticles provide a relatively high performances.
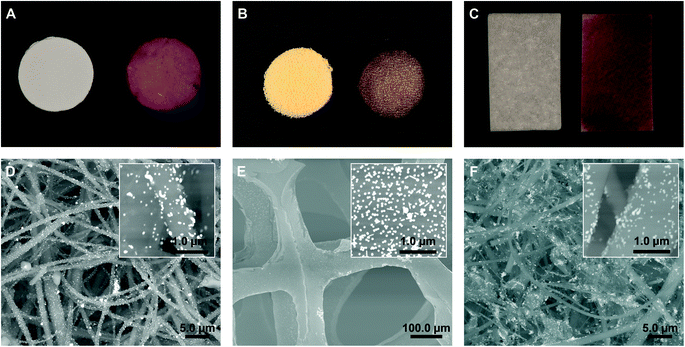
Fig. 2A and B show photographs of the quartz fibre filter and polyurethane SF sponge decorated with Au nanoparticles, which were utilized as a SERS substrate for vapour analysis of TNT precursors. For particulate analysis on a surface, quartz fibres precoated with alumina were modified with Au nanoparticles and used for wiping the surfaces, see Fig. 2C. The SEM back scattered electron (BSE) images of the decorated typical quartz fibres (without and with alumina) and a polyurethane SF sponge are shown in Fig. 2D–F. The Au nanoparticle clusters decorating the quartz fibres and polyurethane SF sponge can be clearly observed. These clusters provide the localized surface plasmon resonance that leads to a large SERS enhancement owing to the formation of hot spots.25
3.2 SERS detection of explosives in nanoparticle suspension
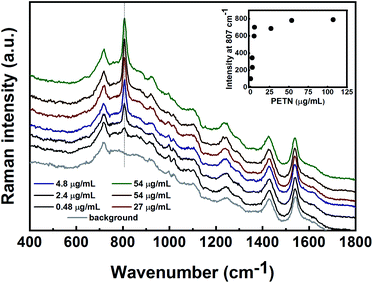
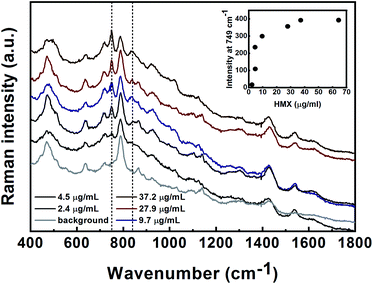
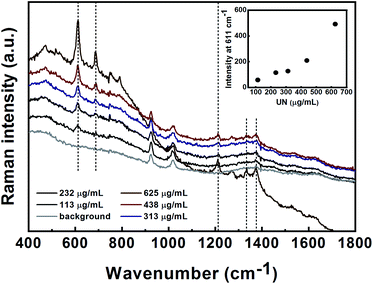
The initial SERS methods used for the detection of PETN, UN, HMX, TNT and TNT precursors were developed in nanoparticle suspension. These methods served as a basis for the follow-up stage for the analysis of gas-phase and surface-deposited particles. For suspension-based detection, all Raman measurements were performed in glass vials. The limits of detection (LODs) of the target materials and the minimal detectable masses in suspension were determined. The LOD was defined as the concentration at which the signal level of the substance reached a level that was at least three times the signal noise of the baseline.![[double bond, length as m-dash]](https://www.rsc.org/images/entities/char_e001.gif) O bond in the primary amides.34,35 The bands at 685 and 1373 cm−1 are assigned to the COO− deformation and symmetrical stretching, respectively.36 The LOD for UN detection in solution was found to be 113 μg mL−1 (9.2 × 10⁻⁴ M). The intensity of the peak at 611 cm−1 was plotted versus the UN concentration and is shown in the inset of Fig. 5. As can be seen, the SERS intensity at 611 cm−1 increases with the increasing analyte concentration. The estimated minimum detectable mass of UN is 165 ng (calculated using the method described above for PETN and HMX).
O bond in the primary amides.34,35 The bands at 685 and 1373 cm−1 are assigned to the COO− deformation and symmetrical stretching, respectively.36 The LOD for UN detection in solution was found to be 113 μg mL−1 (9.2 × 10⁻⁴ M). The intensity of the peak at 611 cm−1 was plotted versus the UN concentration and is shown in the inset of Fig. 5. As can be seen, the SERS intensity at 611 cm−1 increases with the increasing analyte concentration. The estimated minimum detectable mass of UN is 165 ng (calculated using the method described above for PETN and HMX).
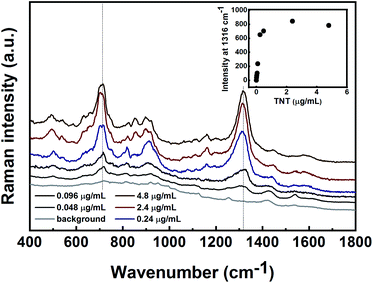
TNT can be indirectly detected by analyzing its volatile impurities.39 The SERS spectra of 2,4-DNT, 1,3-DNB and, 2,6-DNT in nanoparticle suspension are presented in Fig. S9.† All of the spectra were characterized by the symmetric vibration of the NO2 group in the range of 1316 to 1334 cm−1 and the typical vibration of the CNO in the range of 712 to 733 cm−1. For the 1,3-DNB SERS spectrum, a unique aromatic ring breathing mode occurs in the 1000 cm−1 region.40
3.3 SERS detection of explosives in the field
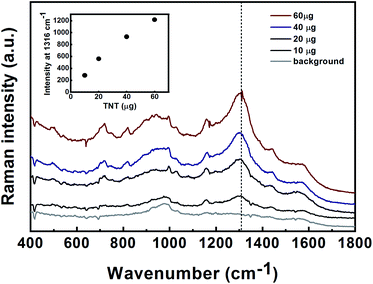
Detection of hazardous materials using hand-held/portable detectors should be capable of handling a wide variety of matrices and sampling techniques, including swab and gas-phase sampling. SERS was proved to have the potential to serve as a “sniffer” for several target materials including explosives and their precursors, as well as swabs for the detection of adsorbed materials on a surface.40 To simulate the real-world and to demonstrate the capabilities of the SERS technique for the detection of explosives in the field, we developed a SERS substrate for various applications in field detection.9 Quartz fibres precoated with alumina and gold nanoparticles served as swabs for the detection of TNT from a surface. For the detection of the volatile precursors of TNT, 2,4-DNT and 1,3-DNB in the gas-phase, quartz fibres and a polyurethane SF sponge decorated with gold nanoparticles were used.Quartz fibres/sponge-based SERS substrates were exposed to vapours of 2,4-DNT or 1,3-DNB in a homemade gas-phase flow system, followed by Raman measurements. Prior to gas-phase exposure, the substrates were slightly wetted using 1 M NaOH.
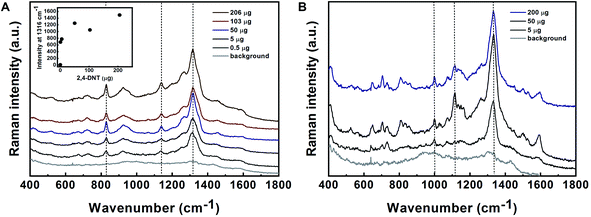
The SERS spectra of 2,4-DNT and 1,3-DNB obtained using Au decorated quartz fibres are shown in Fig. 8A and B. The spectra of 2,4-DNT and 1,3-DNB are characterized by strong bands at 1316 and 1336 cm−1, respectively, that are assigned to the NO2 symmetric stretching mode. Two other bands at 829 and 1141 cm−1 in 2,4-DNT spectra are assigned to the out of plane NO2 mode and the methyl HCH asymmetric band, respectively.38 In the inset in Fig. 8A the intensity of 1316 cm−1 was plotted versus the quantity of 2,4-DNT in the sample. A typical profile for the saturation behavior was observed. The SERS spectra of 1,3-DNB are characterized by a unique aromatic ring breathing mode at 1000 cm−1.40 The estimated minimal detectable masses of 2,4-DNT and 1,3-DNB in the gas-phase, defined as the concentration at which the signal level of the substance reaches at least three times the signal noise of the baseline, are 0.1 μg and 1.5 μg, respectively. Taking into consideration the effective exposure area (A) of the SERS substrate, the 100% vapour adsorption efficiency, and the laser spot size (diameter of 1.8 mm), the minimum detectable masses are estimated to be approximately 3.6 ng and 54 ng for 2,4-DNT and 1,3-DNB, respectively. We assume that the adsorption efficiency is much lower than 100%, therefore the calculated minimum detectable masses are even lower.
We further characterized the vapour detection of 2,4-DNT using sponge-based SERS decorated by Au nanoparticles. The SERS spectra are shown in Fig. S10.† The spectra are characterized by a typical strong band at 1316 cm−1 that is assigned to the NO2 symmetric stretching mode. The sensitivity obtained using a sponge was much lower (∼2.5 orders of magnitude) than that obtained using the quartz fibres owing to the large surface area of the sponge and the low localized concentration of the adsorbed target materials upon the surface as a result.
4. Conclusions
The development of SERS methods (types of nanoparticles and different conditions) in nanoparticle suspension and the modification of these nanoparticles onto quartz fibres or a polyurethane sponge as a sample collector can enable trace particle and vapour detection for homeland security applications. We developed an optimized SERS method for the detection of several explosive materials in solution using a suspension of nanoparticles as a SERS substrate, and achieved the following LODs: PETN, 1.5 × 10⁻⁶ M, 6.9 ng; HMX, 8.1 × 10⁻⁶ M, 35 ng; UN 9.2 × 10⁻⁴ M, 165 ng; TNT, 1.1 × 10⁻⁷ M, 0.35 ng, Table S2.† The applicability of the SERS substrates in field detection (vapours and particulate materials) was demonstrated for the detection of TNT and its precursors (2,4-DNT and 1,3-DNB). SERS detection of the vapours of 2,4-DNT and 1,3-DNB was shown by sampling vapours using Au-modified quartz fibres and performing direct analysis of the target materials with estimated minimum detected levels of 3.6 ng and 54 ng, respectively. Detection of 2,4-DNT using sponge-based SERS decorated with Au nanoparticles was also demonstrated; however, the sensitivity was lower than that obtained using quartz fibres. Detection of TNT on a surface was demonstrated by utilizing quartz-fibres precoated with alumina and modified using Au nanoparticles. The detection of 10 μg (0.53 μg cm−2) of TNT was demonstrated. This study shows the development of a SERS technique using sponge/quartz-based SERS substrate that enabled the use of Raman technology for on-site detection of explosives for diverse applications as previously demonstrated for the detection of chemical warfare agents.9Conflicts of interest
There are no conflicts to declare.Acknowledgements
This project was supported by the MAF'AT and CBRN Defense Division, Israeli Ministry of Defense.References
- R. G. Ewing, M. J. Waltman, D. A. Atkinson, J. W. Grate and P. J. Hotchkiss, TrAC, Trends Anal. Chem., 2013, 42, 35–48 CrossRef CAS.
- J. S. Caygill, F. Davis and S. P. J. Higson, Talanta, 2012, 88, 14–29 CrossRef CAS PubMed.
- K. C. To, S. Ben-Jaber and I. P. Parkin, ACS Nano, 2020, 14, 10804–10833 CrossRef CAS PubMed.
- A. Hakonen, P. O. Andersson, M. Stenbæk Schmidt, T. Rindzevicius and M. Käll, Anal. Chim. Acta, 2015, 893, 1–13 CrossRef CAS PubMed.
- F. Yan and T. Vo-Dinh, Sens. Actuators, B, 2007, 121, 61–66 CrossRef CAS.
- R. S. Das and Y. K. Agrawal, Vib. Spectrosc., 2011, 57, 163–176 CrossRef CAS.
- A. I. Pérez-Jiménez, D. Lyu, Z. Lu, G. Liu and B. Ren, Chem. Sci., 2020, 11, 4563–4577 RSC.
- E. L. Izake, Forensic Sci. Int., 2010, 202, 1–8 CrossRef CAS PubMed.
- V. Heleg-Shabtai, H. Sharabi, A. Zaltsman, I. Ron and A. Pevzner, Analyst, 2020, 145, 6334–6341 RSC.
- K. B. Biggs, J. P. Camden, J. N. Anker and R. P. V. Duyne, J. Phys. Chem. A, 2009, 113, 4581–4586 CrossRef CAS PubMed.
- M. Lafuente, D. Sanz, M. Urbiztondo, J. Santamaría, M. P. Pina and R. Mallada, J. Hazard. Mater., 2020, 384, 121279 CrossRef CAS PubMed.
- A. Hakonen, K. Wu, M. Stenbæk Schmidt, P. O. Andersson, A. Boisen and T. Rindzevicius, Talanta, 2018, 189, 649–652 CrossRef CAS PubMed.
- M. Liszewska, B. Bartosewicz, B. Budner, B. Nasiłowska, M. Szala, J. L. Weyher, I. Dzięcielewski, Z. Mierczyk and B. J. Jankiewicz, Vib. Spectrosc., 2019, 100, 79–85 CrossRef CAS.
- C. Byram, S. S. B. Moram and V. R. Soma, Analyst, 2019, 144, 2327–2336 RSC.
- K. R. Brown, D. G. Walter and M. J. Natan, Chem. Mater., 2000, 12, 306–313 CrossRef CAS.
- G. FRENS, Nat. Phys. Sci., 1973, 241, 20–22 CrossRef CAS.
- N. R. Jana, L. Gearheart and C. J. Murphy, Chem. Mater., 2001, 13, 2313–2322 CrossRef CAS.
- W. Ma and Y. Fang, J. Colloid Interface Sci., 2006, 303, 1–8 CrossRef CAS PubMed.
- D. Wu and Y. Fang, J. Colloid Interface Sci., 2003, 265, 234–238 CrossRef CAS PubMed.
- A. S. L. Lee and Y.-S. Li, J. Raman Spectrosc., 1994, 25, 209–214 CrossRef CAS.
- J. I. Jerez-Rozo, O. M. Primera-Pedrozo, M. A. Barreto-Cabán and S. P. Hernández-Rivera, IEEE Sens. J., 2008, 8, 974–982 CAS.
- J. M. Sylvia, J. A. Janni, J. D. Klein and K. M. Spencer, Anal. Chem., 2000, 72, 5834–5840 CrossRef CAS PubMed.
- S. Gura, M. Madmon, N. Tzanani, R. Barak, I. Shacht and S. Dagan, Anal. Methods, 2017, 9, 393–401 RSC.
- V. Heleg-Shabtai, H. Sharabi, A. Zaltsman, I. Ron and A. Pevzner, Analyst, 2020, 145, 6334–6341 RSC.
- A. Shiohara, Y. Wang and L. M. Liz-Marzán, J. Photochem. Photobiol., C, 2014, 21, 2–25 CrossRef CAS.
- B. Stuart, Forensic Analytical Techniques, John Wiley & Sons, Ltd, Chichester, UK, 2012 Search PubMed.
- D. Chambers, C. Brackett and D. O. Sparkman, Perspectives on Pentaerythritol Tetranitrate (PETN) Decomposition, Livermore, CA (United States), 2002 Search PubMed.
- S. E. J. Bell and N. M. S. Sirimuthu, Chem. Soc. Rev., 2008, 37, 1012–1024 RSC.
- L. Wang, M. Ghosh and S. A. Asher, Appl. Spectrosc., 2012, 66(9), 1013–1021 CrossRef.
- L. Nagli, M. Gaft, Y. Fleger and M. Rosenbluh, Opt. Mater., 2008, 30, 1747–1754 CrossRef CAS.
- S. Li, Q. Li, K. Wang, M. Zhou, X. Huang, J. Liu, K. Yang, B. Liu, T. Cui, G. Zou and B. Zou, J. Phys. Chem. C, 2013, 117, 152–159 CrossRef CAS.
- J. Almog, G. Burda, Y. Shloosh, S. Abramovich-Bar, E. Wolf and T. Tamiri, J. Forensic Sci., 2007, 52, 1284–1290 CrossRef CAS PubMed.
- K. R. Lynn, J. Phys. Chem., 1965, 69, 687–689 CrossRef CAS.
- A. Sumayya, C. Y. Panicker, H. Varghese and B. Harikumar, Rasayan J. Chem., 2008, 1, 548–555 CAS.
- J. De Gelder, K. De Gussem, P. Vandenabeele and L. Moens, J. Raman Spectrosc., 2007, 38, 1133–1147 CrossRef CAS.
- A. Parameswari, S. Premkumar, R. Premkumar and A. Milton Franklin Benial, J. Mol. Struct., 2016, 1116, 180–187 CrossRef CAS.
- F. Zapata, M. López-López and C. García-Ruiz, Appl. Spectrosc. Rev., 2016, 51, 227–262 CrossRef CAS.
- P. M. Fierro-Mercado and S. P. Hernández-Rivera, Int. J. Spectrosc., 2012, 2012, 1–7 CrossRef.
- M. E. Walsh, T. F. Jenkins and P. G. Thorne, J. Energ. Mater., 1995, 13, 357–383 CrossRef CAS.
- K. M. Spencer, J. M. Sylvia, J. A. Janni and J. D. Klein, in Detection and Remediation Technologies for Mines and Minelike Targets IV, ed. A. C. Dubey, J. F. Harvey, J. T. Broach and R. E. Dugan, SPIE, 1999, vol. 3710, p. 373 Search PubMed.
- R. Ravikrishna, K. T. Valsaraj, C. B. Price, J. M. Brannon, C. A. Hayes and S. L. Yost, J. Air Waste Manage. Assoc., 2004, 54, 1525–1533 CrossRef CAS PubMed.
- H. Östmark, S. Wallin and H. G. Ang, Propellants, Explos., Pyrotech., 2012, 37, 12–23 CrossRef.
Footnote |
| † Electronic supplementary information (ESI) available. See DOI: 10.1039/d1ra04637c |
| This journal is © The Royal Society of Chemistry 2021 |

