 Open Access Article
Molecular dynamics insight into viscosity reduction of hydrolysed polyacrylamide by using carbon quantum dots†
Guice Yao a,
Jin Zhao*b,
Maje Alhaji Harunac and
Dongsheng Wen*abc
aSchool of Aeronautic Science and Engineering, Beihang University, Beijing, 100191, China
bSchool of General Engineering, Beihang University, Beijing, 100191, China. E-mail: Jin.Zhao@buaa.edu.cn; d.wen@buaa.edu.cn
cSchool of Chemical and Process Engineering, University of Leeds, Leeds, LS2 9JT, UK. E-mail: d.wen@leeds.ac.uk
First published on 28th July 2021
Abstract
Hydrolysed polyacrylamide (HPAM) is widely used in many industrial fields where its rheological properties play a leading role. Recent discovery of the reduction of HPAM's viscosity by adding carbon quantum dots (CQDs), however, is controversial to the established theories. By using all atom molecular dynamics simulation with an OPLS-AA force field, this study aims to provide detailed molecular insight into such an uncommon phenomenon. The dynamic structures of the HPAM chain in the presence or absence of CQDs were clearly captured from the molecular aspect. The results reveal that the adsorption of CQD reduces the gyration radius of the HPAM chain, and it is the corresponding hydration effect that leads to the reduction of the viscosity. The amide rather than the carboxylate group along the HPAM chain is dominant in terms of the interaction with the CQDs, and the driven atoms depend on the surface where the polymer is adsorbed.
1 Introduction
Nanoparticles and polymer composites are widely used in various fields, such as medicine, textiles, food packaging, paints and catalysis.1 Such composites consisting of different types of nanoparticles and polymers could exhibit improved performance in thermal,2–6 medical,7,8 rheological,9,10 electrical or optical properties.11–14 Therefore, many investigations were conducted to search for more efficient polymer nanocomposites by adopting various mixtures of polymers and nanoparticles. The properties of those commonly used polymers, such as hydrolysed polyacrylamide (HPAM), mixed with many nanoparticles, e.g., SiO2 and TiO2, were well interpreted, especially in terms of their rheological behaviour.15,16 Generally speaking, when adding nanoparticles inside a polymer solution, nanoparticles could act as bridges connecting the neighbouring polymers even in the dilute regime, which results in the increase of the viscosity. Novel nanoparticles such as carbon quantum dots (CQDs)17 has also been employed to combine with HPAM in bio-imaging and drug delivery applications.18–22 The rheological properties of such polymer nanocomposites, however, from our previous experiments,23 show an inverse trend. The addition of CQDs reduces the viscosity of the polymer solution, which contradicts directly the theory developed by Einstein.24A few other studies also showed the polymer viscosity reduction phenomenon by using nanoparticles.25–27 The degradation of the polymer, the adsorption of polymers with high molecular weight, the constraint release of the entangled polymer chain, and the changes in the conformation distribution of polymer chains are possible mechanisms. However, there is still no convincible evidence to prove which mechanism is the main leading factor and many controversial results have been reported. It is clear, though, that the polymer conformation due to its interaction with nanoparticles plays a dominant role in determining the effective viscosity. Based on our previous experimental results,23 two possible reasons are proposed: one is that the long chain polymer interacts with CQDs and forms smaller coils conformation; the other is the breakage of long chains into pieces of smaller chains. However, both are speculated, without direct experimental observation of microscopic polymer morphological variations. Although some experimental techniques such as dynamics light scattering (DLS) and small-angle neutron scattering (SANS) are capable of capturing the hydraulic radius of a polymer molecule, the diameter of CQDs is too small compared with that and the concomitant experimental study is hard to achieve. Molecular insight on the morphology of polymer chains and physical interactions between nanoparticles are difficult to be interpreted by experimental techniques.
Molecular dynamics (MD) simulation, on the other hand, has proven to be a valuable tool to study the self-assembly of polymers at the microscopic level, which could reveal detailed three dimensional conformational and structural behaviour.28–31 By adopting a coarse-grained model or all atom force fields, e.g., Gromos53a6 and OPLS-AA, the polymer (including HPAM) conformation behaviours under the influences of pH value, salinity and even the solvent quality were obtained and the results were well supported by DLS data.32–39 The MD simulation is also available for the complex polymer and nanoparticle composites.40 With proper potential force field, MD simulation could capture the adsorption, wrapping and coating process of a polymer with metal nanoparticles.41,42 In addition, the effects of size of polymer oligomers on the interplay were revealed.43 From the molecular radial distribution, the electrostatics are suggested to be one of the central factors for the interaction between nanoparticles and polymers. Besides the metallic nanoparticles, others like TiO2, SiO2 and graphene, the mechanical and tribological properties of which were also investigated by MD simulations.44–48 The detailed interaction or adsorption between specific functional groups or atoms was clearly captured. In fact, given reasonable potential force field on the polymer nanocomposites system, the interaction between polymers and nanoparticles is achievable.
Very recently, by means of VMD packages, the structure dynamics of CQDs in both water and organic solvent with different sizes, compositions and curvatures were successfully investigated,49,50 which provides solid platform for us to probe the morphology of HPAM solution in the presence of CQD. Therefore, aiming to provide molecular insight into the viscosity reduction phenomenon, an all atom MD simulation was conducted in this work and dynamic morphological variation of HPAM in the presence and absence of CQD was obtained. The simulation was performed in an 8 nm cubic simulation box including a single HPAM chain and one CQD, which represents a typical dilute regime. The adsorption process, the radius of gyration, the hydration effects and the interaction preference were quantitatively and qualitatively calculated and analysed, which provides molecular insight into why HPAM's viscosity reduces in the presence of CQDs.
2 Computational details
2.1 Model
Fig. 1 shows the simulation system for the investigation of the interaction between the HPAM chain and the CQD nanoparticle. It consists of a single polymer chain with one CQD, indicating the solution applied in our simulation is in a dilute regime, which is analogous to our previous experimental conditions.23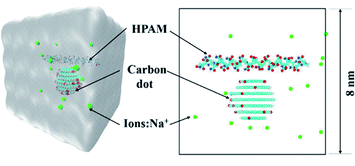 | ||
| Fig. 1 The initial configuration of the HPAM40_dot system (blue: nitrogen atoms; red and white: oxygen and hydrogen atoms, respectively; cyan: carbon; green: Na+ ions, water is not plotted in). | ||
An atactic HPAM chain was first polymerized by numbers of acrylamide and acrylic acid monomers, Namide and Nacrylic, respectively, with random dihedral angle values. The carboxyl hydrogen was then deprotonated to make the HPAM chain charged. Two different length of HPAM chains, Nm = 30 and 40, respectively, where the Nm is the total numbers of monomers, were adopted to get a better visualization of the HPAM conformational variations.37 The degree of hydrolysis, f, of both HPAM chains, defined as the ratio between the number of charged acrylic monomers, Nacrylic, and the total number of monomers along the chain, Nm are kept at same value of 0.4.
The CQD was built up by a VMD builder.50 A hexagonal graphene-like sheet was regarded as a basic shape and the edge size was set by numbers of benzene rings. By combing layers of sheet with the size of the layers decreasing gradually, one can obtain a spherical CQD. In this study, a seven layers CQD with diameter of gyration around 2 nm was conducted. To reveal the effect of functional group of the CQD, 10% hydroxyl groups were converged randomly at the edge. Due to the destabilizing effect of the carbonyl groups and negatively charged carboxylates, these two functional groups are not considered.48
The length of simulation box was set as 8 nm × 8 nm × 8 nm to avoid edge effects. The HPAM chain and the CQD were placed in the center of the box with the central distance between each other of 2 nm by the Packmol package. Appropriate numbers of water molecules were put into cubic boxes to keep the water density around 9.8 kg m−3 and the Na+ counter-ions were added into simulation boxes for the neutrality of the system.
To reflect the effects of the addition of CQD in HPAM solution, a simulation box only seeded with a single HPAM chain was also conducted. Therefore, the effects of CQD on the HPAM morphology could be implied by the comparison between cases with and without adding nanoparticle. To summarize, four cases were included in our work. Two HPAM and CQD water solutions with the length of HPAM is 30 and 40 monomers, respectively and another two pure HPAM water solutions without the existence of CQD. These four cases are named after HPAM30_dot, HPAM40_dot, HPAM30_solo and HPAM40_solo, respectively, for convenience.
2.2 Potential parameters
All MD simulations were conducted by GROMACS simulation package (version of 2019.03).51 The OPLS-AA force field parameters52 were used to describe the properties of HPAM chains, Na+ and Cl− ions, including the potential of bonds, angles, dihedrals and non-bond interactions. There are many available potential parameters for benzene graphite, here, the OPLS-AA force field with refinements on carbon nonbonded Lennard–Jones parameters proposed by Cheng and Steele53 was utilized, which have been achieved to characterize the adsorption behaviour of small graphene molecules. The simple point charge (SPC) model was conducted to characterise water molecules. The non-bond interactions were represented by a short-range 12–6 Lennard–Jones (LJ) potential and a long-range coulombic potential, expressed in a form of pairwise interacting atomic charges. The LJ potential between two atoms can be written as follow:
 | (1) |
The parameters σ and ε represent energy constant and diameter of one of the atoms, which depend on atom types. The Lorentz–Berthelot combining rules were used to describe LJ potential between different atom types. Detailed parameters are listed in Table S1 in the ESI.†
2.3 Simulation details
The leapfrog algorithm was used to integrate the motion of atoms with a time step of 2 fs. The coulombic electrostatic interactions were calculated by using the particle mesh Ewald (PME) method with a cut-off distance of 1.0 nm and Fourier spacing of 1.2 nm. The cut-off distance for short-range van der Waals interaction was 1.0 nm. To remove initial strain, the initial configuration was conducted by energy minimization using the steepest descent method. This was followed by 500 ps NVT and 500 ps NPT simulations with position restraints on HPAM chains and not on water molecules to achieve a well equilibrated system. A V-rescale thermostat and a Berendsen barostat were used to control the temperature and pressure at 300 K and 1 bar during the calculation with relaxation time of 0.1 ps and 0.5 ps, respectively. After full relaxation, a further 280 ns NPT simulation was performed with the water molecules fixed with SETTLE algorithm and all bonds constrained by using SHAKE procedure. The last 100 ns were conducted for the sampling and analysis.3 Results and discussion
In this section, the morphological interaction between the HPAM and the CQD is introduced. Particularly, how the addition of the CQD affects the HPAM conformation is discussed by calculating the radius of gyration, free energy, radial distribution functions (RDFs) and hydration effect. Before the analysis, the reliability of the results is discussed first.Based on our previous work,39 the conformation of polyacrylic acid (PAA) with different ionization could be successfully captured by Gromos53a6 force field54 and the concomitant results are agreed well with others'.38 The only difference between HPAM and PAA is that the carboxyl groups are replaced by amide groups, which are both non-charged that show slight effects on the intra-repulsion along polymer chain. When the charge density, here indicating ionization for PAA and hydrolysis for HPAM, and the number of monomers is the same, the structure of HPAM and PAA in an aqueous water should be similar. Therefore, we compared the structure of HPAM30_solo and HPAM40_solo with our previous work to validate the force field and MD calculation set-up adopted in our simulation, as shown in Fig. 2. An additional case involving a single 20 monomers HPAM chain with different hydrolysis by OPLS-AA force field were also conducted to support the validation. The sequence of the carboxylate groups along the polymer chain is the same for the HPAM and the PAA with 20 monomers.
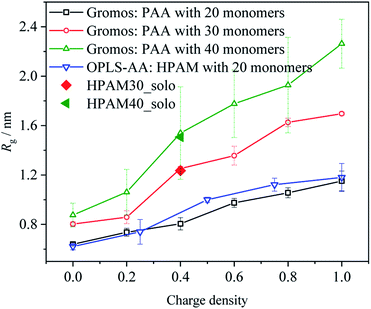 | ||
| Fig. 2 The comparison of average radius of gyration of HPAM and PAA chains simulated by OPLA-AA and Gromos53a6 force field, respectively. | ||
As the hydrolysis increases, the average radius of gyration of HPAM increases, which shows a similar trend with that of PAA and indicates the OPLS-AA is capable of capturing the variation of HPAM in an aqueous water. What's more, the degree of structure variations is quite close to each other, implying the reasonable comparison between HPAM and PAA. As expectedly, the average radius of gyration of HPAM30_solo and HPAM40_solo agree very well with previous results, which shows the reliability of our simulation methodology.
3.1 Morphology of HPAM and carbon dot
The time dependent conformational variations of the HPAM and CQD for all four cases are discussed in this section. The full evolution of the conformation of the HPAM chain could be interpreted by the snapshots captured with different time ranging from 20 ns to 240 ns, respectively. Here, representative snapshots of HPAM40_dot around t = 20 ns and 240 ns, respectively, are shown in Fig. 3 and 4. The intermediate series are illustrated in the ESI as shown in Fig. S1–S5.† To have a better visualization, the water molecules and ions are not displayed. For the HPAM water solution, the polymer chain first bends and becomes partially coiled state as the time evolves. This is attributed to the non-charged amide group along the polymer chain. Based on our previous studies,39 the charged carboxylate functional group results in the electronic repulsions within the polymer backbone. Therefore, for a HPAM molecule with 40% hydrolysis, the polymer chain exhibits partially coiled state. Even in the production regime, the polymer chain does not show a stable morphology other than a very flexible backbone and a high conformation diversity is observed.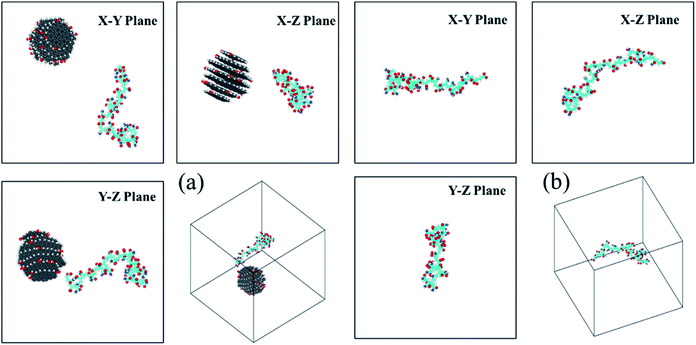 | ||
| Fig. 3 The three-views snapshots of HPAM40_dot and HPAM40_solo around t = 20 ns. (a) HPAM40_dot; (b) HPAM40_solo. | ||
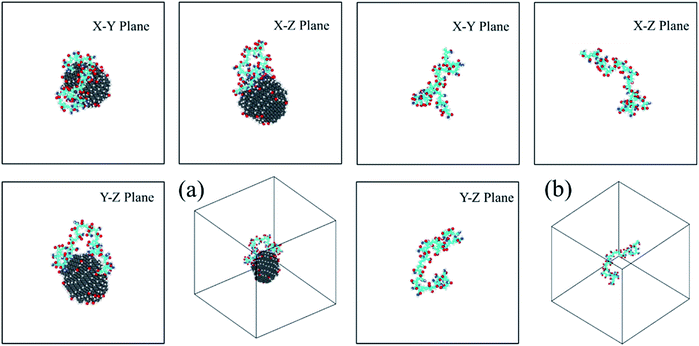 | ||
| Fig. 4 The three-views snapshots of HPAM40_dot and HPAM40_solo around t = 240 ns. (a) HPAM40_dot; (b) HPAM40_solo. | ||
For HPAM and CQD system, the HPAM behaves similar trends at the beginning when the HPAM chain and the CQD are separate. These two molecules are regarded as individuals and no interaction occurs between them. Such condition is different when the HPAM chain is absorbed by the CQD. It is surprisingly that one of the ends of HPAM is first interactive with the side surface of the CQD, which expands the HPAM chain from coiled state to stretching state accordingly. With the evolution of time, the other end of the HPAM chain is gradually attaching to the CQD as well, leads to the collapse of the polymer chain. Unlike the pure HPAM water solutions, the HPAM in the equilibrated regime seems to be constrained by the CQD. The degree of flexibility of the HPAM backbone becomes weak.
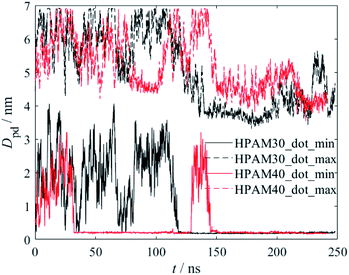
The interaction between HPAM and CQD could be quantitatively characterized by the distance between the HPAM chain and the CQD, as shown in Fig. 5. Both the minimum and maximum distance are calculated. The distance significantly fluctuates at the beginning of the simulation due to the HPAM flexible dynamics. However, a steep reduction of both maximum and minimum distance occurs at around 120 ns and 150 ns for HPAM30_dot and HPAM40_dot, respectively. Based on the snapshot analyses discussed above, this decrease is mainly due to the fully absorption of HPAM chain on CQD (both ends of HPAM are attached to the particle). It can be obviously observed that the fluctuation of the distance becomes moderate, which indicates the inefficient molecular motion.
The variations of the interaction energy between the HPAM chain and the CQD are demonstrated in Fig. 6. As expected, there is no interaction forces between the polymer chain and the nanoparticle. When they are getting closer, both the short-range coulombic interaction energy and the Lennard–Jones energy are increasing. The latter seems to be in domain control of the absorption of the HPAM chain on the CQD since it dynamically saturates in a relevant high level after 150 ns while the coulombic energy still fluctuates dramatically and the increasing trends for both HPAM30_dot and HPAM40_dot cases are not obvious. The strong Lennard–Jones forces make the HPAM and the CQD attach to each other, which limits the molecular motions of the HPAM chain.
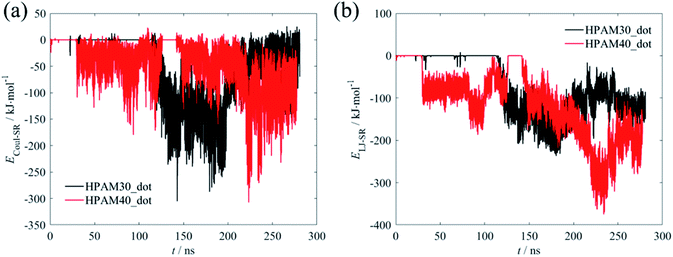 | ||
| Fig. 6 The variations of interaction energy between the HPAM chain and the CQD as a function of time (a): short-range coulombic energy; (b) short-range Lennard–Johns energy. | ||
3.2 Polymer dynamics
As mentioned in the introduction section, the reduction of the viscosity of the HPAM-CQD composites solution is mainly attributed to the conformational changes of the HPAM chain. From our simulation result, the HPAM does collapse into coiled state due to the absorption. To quantitatively characterize the effects of CQD on the conformation of the HPAM, the probability distribution functions (PDFs) of the radius of gyration of the HPAM chain and the free energy are performed in this section.The efficient properties to characterise the conformation of a single polymer is the radius of gyration, Rg and the end to end distance, DETE. In the context of these simulations, the gyrate radius is defined as:
 | (2) |
Fig. 7 shows the time dependent radius of gyration of the HPAMs in all four cases. The dramatic oscillation of the gyrate radius indicates the HPAM chain is flexible in an aqueous solution and exhibits dynamic equilibrium. Compared with the 30 monomers chain, the HPAM with 40 monomers demonstrates a sharp reduction after 150 ns, which is ascribed to the attachment between the HPAM and the CQD particles. Such phenomenon is not obvious for the HPAM with 30 monomers due to the relative shorter chain length. This is also consistent well with the profiles of probability distribution functions (PDFs), as shown in Fig. 8. The peak for any histogram indicates the most favourite configuration that a HPAM chain prefers to stay. In comparison with the curves for pure HPAM water solutions, the peaks of the HPAM-CQD composite solutions are much higher and the distributions of the Rg are much narrow, which demonstrates the HPAM chain occupies a small range of polymer configuration. For the pure HPAM water, a relative lower peak and a wide distribution are obtained, which implies a more flexible and freedom polymer motion. These trends indirectly prove the absorption effect of the adding CQD on the HPAM chain, constraining the polymer free movement.
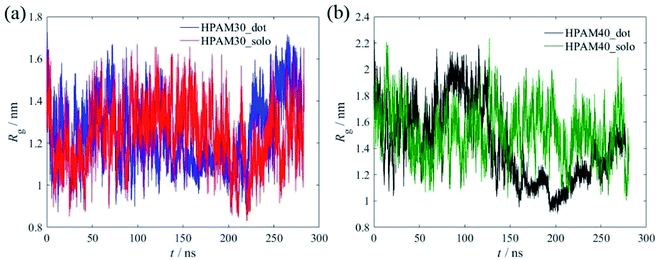 | ||
| Fig. 7 The time dependent radius of gyration of the HPAMs, (a) with 30 monomers; (b) with 40 monomers. | ||
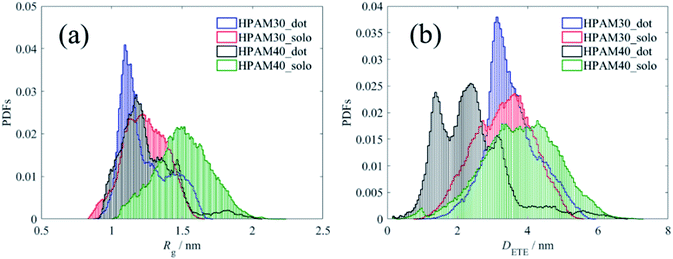 | ||
| Fig. 8 Probability distribution functions of radius of gyration and end-to-end distance of the HPAM chain. (a) Profiles of Rg; (b) profiles of DETE. | ||
Regardless of the polymer length, the peak of the HPAM chain with the existence of CQD occurs at smaller Rg value while that without CQD addition appears in a larger Rg. The chain length also affects the result. The gyrate radius of the HPAM chain with 30 monomers is mainly distributed around value of 1.1 nm and 1.25 nm for the case with and without CQD, respectively. When enlarging the total length to 40 monomers, the distribution is focused on 1.2 nm and 1.5 nm, respectively. Compared with the short chain, the effects of CQD on the morphology of the HPAM chain with more numbers of monomers are more dramatic. The HPAM chain with 40 monomers this is quite similar with our previous investigations.39 Although the small oligomers could reflect properties of long chain polymer and the interaction between molecules are quite similar (this could also be implied from the RDFs of pure HPAM water shown later), the long chain polymer owns more clear trends of the macro physical properties such as the radius of gyration. Another reason could be ascribed to that compared with the 2 nm CQD, the full length of the HPAM chain with 30 monomers is too short. As shown in previous section, the HPAM tends to interact with the CQD with their ends. From the PDFs of DETE, one can see the end-to-end distance does not show significant differences. Due to the repulsion, torsion and dihedral forces it is difficult to bend over a short chain. Therefore, even the polymer attaches well with the nanoparticle, the radius of gyration is still large and only slight changes of conformation are under consideration in comparison with that of the flexible chain. However, this is not accessible for the HPAM chain with more monomers. The HPAM chain with 40 monomers exhibits large radius of gyration with their ends expand. The end-to-end distance could reach even longer than 4 nm. The existence of CQD destroys the equilibrated state of the HPAM chain, absorbing the ends of the chain in a short distance and shirking the total polymer conformation, reducing the radius of gyration. Such interpretation gives a reasonable explanation of why the addition of CQDs can decrease the viscosity of HPAM solution. In practical, the size of CQDs compared with the length of high-molecular-weight HPAM polymers is small enough, where the HPAM could easily collapse by the absorption of CQDs, contributing to the viscosity reduction of the solution.
Indeed, it is possible for a polymer to have a compact conformation and relatively large end-to-end distance simultaneously.55 Therefore, to estimate the morphology of the polymer chain more accurately, the free energy profiles rely on both radius of gyration and the end-to-end distance are introduced. The free energy landscape is constructed on the basis of Boltzmann probability, G(r):
G(r) = −kBT[ln![[thin space (1/6-em)]](https://www.rsc.org/images/entities/char_2009.gif) P(r) − ln P(r) − ln![[thin space (1/6-em)]](https://www.rsc.org/images/entities/char_2009.gif) Pmax(r)] Pmax(r)]
| (3) |
The free energy reflects the degree of a polymer chain away from its equilibrated conformation. A small free energy means this polymer conformation is stable and close to equilibrated state. In contrast, the polymer configuration with high free energy indicates such morphology cannot stay longer and it could be just a transitional state due to the molecules Brown motion. Here, we regard those polymer conformations in the free energy regime under 5 kJ mol−1 as relax state, which means the motion of polymer chain is dynamically equilibrated and the variations in such regime are attributed to Brown motion. When the free energy is larger than that, we consider the polymer chain is in a constrain state, where the polymer structure is not stable and tends back to relax state spontaneously.
From the Fig. 9, in terms of pure HPAM water solution, the relax state of the HPAM chain occupies a wide range of Rg and DETE. The molecular motion is relative free and even at Rg = 1.4 nm and DETE = 4 nm, the HPAM chain is still in relax state. However, for the HPAM and the CQD composite solution, due to the absorption between the HPAM and the CQD, the relax regime moves to small Rg and DETE. Particularly, although the most relax region of the HPAM chain with 30 monomers is quite smaller compared with that in pure HPAM water solution, there are also many regions where the free energy is still below 5 kJ mol−1, which means the polymer chain still achieves in such region with high probability. This is also consistent well with the previous discussion that the conformation of the HPAM chain with 30 monomers does not significantly influenced by the CQD. From the free energy profiles of the HPAM chain with 40 monomers, the relax regime is obviously allocated to small values. For those polymer conformations which are still stable in pure HPAM water solution, such as Rg = 1.6 nm with DETE = 3 nm, the concomitant free energy in the HPAM and CQD composite solution is high enough. Such conformation could not stable any longer and would transit to more stable structure within the relax regime.
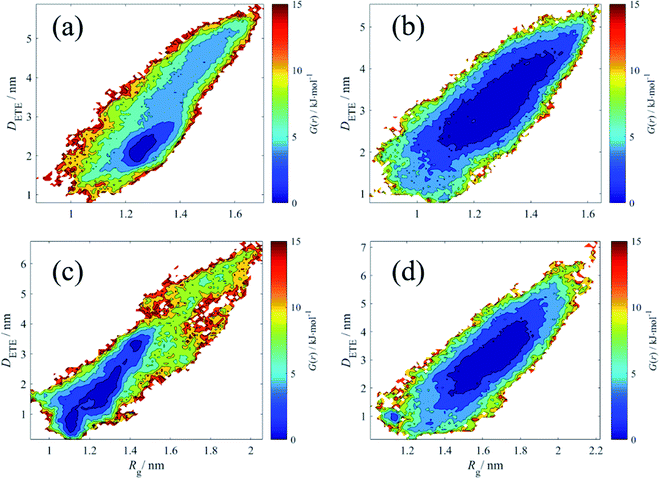 | ||
| Fig. 9 The free energy (in kJ mol−1) contour explored in the radius of gyration and end-to-end distance. (a) HPAM30_dot; (b) HPAM30_solo; (c) HPAM40_dot; (d) HPAM40_solo. | ||
Another important information that can be interpreted from the contours is that even within the relax regime, the polymer conformation of pure HPAM water solution shows high diversity, while that of HPAM and CQD composite solution is in relatively high ordered. In macro scale, when shearing the solution, the former would exhibit dramatic shear-thinning behaviours due to the reassignment of the polymer molecules. However, since the polymer molecules are in order, the reassignment is weak and the shear-thinning phenomenon of the HPAM and CQD composite solution would not be obvious, which is consistent well with our previous experimental results.23
3.3 Hydration effect
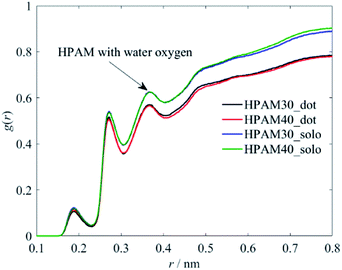
The influence of the polymer conformation on the viscosity of the solution is ultimately attributed to the hydration effect between the macro polymer molecules and the water molecules. Therefore, we further analyse the radius distribution functions (RDFs) of the HPAM and its functional groups along the backbone with the water molecules to characterize the hydration effects.Fig. 10 demonstrates the interaction between the whole HPAM chain and the water molecules. The first three peaks are controlled by H, O and N atoms, respectively, based on the RDFs shown later. With adding the CQD into the HPAM solution, the hydrogen effect of the whole HPAM chain decreases. The number of monomers show slight effects on the molecular interaction, which has also ready fully illustrated in our previous study.36
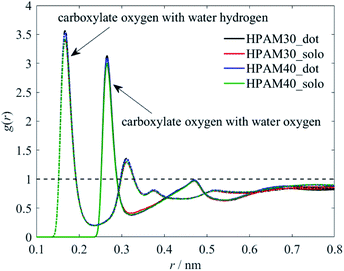
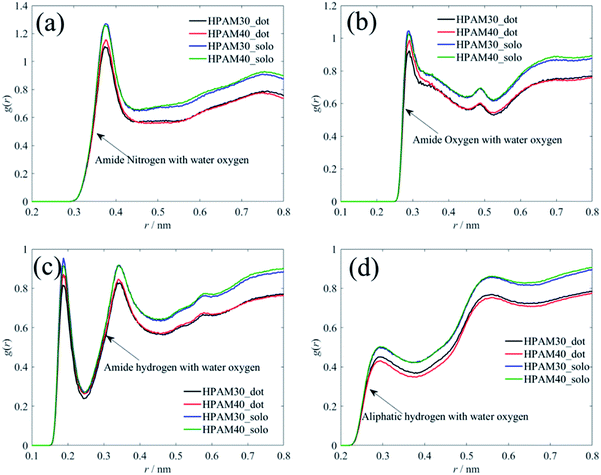
To clarity which functional group or atom causes the reduction of the hydration effect, we perform the RDFs of representative atoms along the backbone with water molecules separately, as shown in Fig. 11 and 12. The existence of CQD slightly contributes to the interaction between carboxylate groups and water. This is in contrast to the trends of the whole HPAM chain. As discussed later, the amide groups are more prefer to interact with the CQD, weakening the hydration effect. Those released water tends to be gathering around carboxylate group instead, which intensify the interaction between carboxylate groups and water molecules. Similarly, it is the strong hydration effect persists the interaction between carboxylate groups and the CQD.
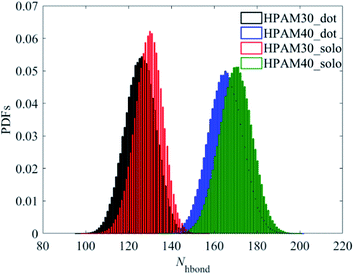
Unlike with the carboxylate groups, the atoms in amide group and aliphatic hydrogens exhibit same trends with the whole HPAM chain. The hydration effect of has an obvious reduction because of the addition of the CQD. It seems the amide group and the aliphatic hydrogen are the two key parameters in domain to decide the hydrogen effects of the whole macro HPAM chain. The hydrogen bond between the HPAM chain and water molecules were calculated every timestep in the production regime and the PDFs of that are displayed in Fig. 13. The distribution of the hydrogen bond fits well with the Gaussian equation and all histograms are quite similar. The mainly difference is the hydrogen bong in HPAM and CQD composite solution is less than that in the pure HPAM water solution. The peaks are allocated around at values of 125 and 130 for the HPAM chain with 30 monomers, and 165 and 170 for that with 40 monomers, respectively. The hydrogen bond between the polymer and water does decrease due to the existence of the CQD.
As discussed above, the CQD tends to have an interaction with the amide groups and the aliphatic hydrogens to reduce the hydration effect of the HPAM chain. Such preference can also be approved by Fig. 14, where the amide group and the aliphatic hydrogen are much closer to the CQD surface compared with the carboxylate group no matter it is in the stage when one of the ends of the HPAM just attaches to the CQD or both of the ends have already fully been absorbed. It should be noted that such interaction is highly dependent on the surficial atoms of the CQD. If the HPAM is absorbed by the side of the CQD, since there are many hydrogens allocated, thereby the carbonyl oxygen will lead to the attachment. When the interactive surface is the graphene sheet, the carbon atoms are directly interacted with the hydrogen atoms both in amide groups and along backbone. Indeed, there are many remaining questions concerning the interaction between the HPAM and the CQD. For example, which surface of the CQD is the primary preference for a HPAM chain to absorbed and how this interaction varies if the CQD is built with mixed functional groups consist of charge carboxylate. These assignments are under consideration and will be discussed in our future work.
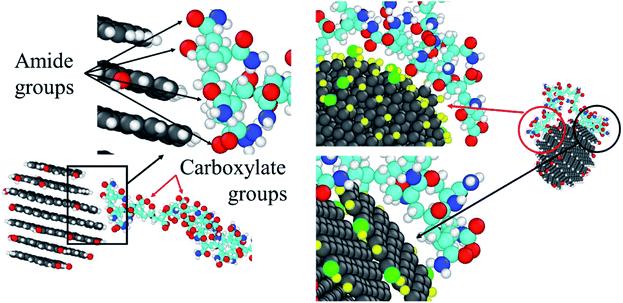 | ||
| Fig. 14 Schematic views of the interaction preferences between the HPAM chain and the surface of the CQD. | ||
4 Conclusions
To provide molecular insight into the reported unconventional viscosity reduction of HPAM in the presence of CQD, the conformational behaviour of a single hydrolysed polyacrylamide (HPAM) chain in the presence of a CQD representing a typical dilute solution, was investigated by atomistic molecular dynamics simulations. Their interaction performance and the effects of the CQD on the morphology of HPAM chain can be concluded as below:The HPAM chain tends to be adsorbed by the surface of the CQD, which starts from one end of the polymer chain and eventually both ends will be attached to the CQD.
The interaction between the HPAM and the CQD results in the reduction of the radius of gyration and hydration effects of the HPAM, which as a result would cause the decrease of the effective viscosity.
The adsorption is mainly ascribed to the amide functional groups and hydrogen atoms along the backbone, rather than the charged carboxylate functional groups. The dominant atoms leading to the adsorption rely on the surface of the CQD since the side is occupied by hydrogen atoms, while the top/bottom are controlled by the carbon atoms. The former surface would attract oxygen atoms while the latter prefers to interact with hydrogen atoms.
Author contributions
Guice Yao: conceptualization, methodology, validation, formal analysis, investigation, data curation, writing-original draft, writing-review & editing. Jin Zhao: conceptualization, methodology, writing-review & editing, supervision. Maje Alhaji Haruna: formal analysis, investigation. Dongsheng Wen: conceptualization, writing-review & editing, supervision, project administration, funding acquisition.Conflicts of interest
There are no conflicts to declare.Acknowledgements
This work was supported by European Research Council consolidator grant (grant number: 648375), National Science Foundation of China Grant No. 51876006 & No. 52006004 and China Postdoctoral Science Foundation Grant no. 2021M690286.Notes and references
- S. Kango, S. Kalia, A. Celli, J. Njuguna, Y. Habibi and R. Kumar, Surface modification of inorganic nanoparticles for development of organic–inorganic nanocomposites—A review, Prog. Polym. Sci., 2013, 38(8), 1232–1261 CrossRef CAS.
- A. Laachachi, E. Leroy, M. Cochez, M. Ferriol and J. L. Cuesta, Use of oxide nanoparticles and organoclays to improve thermal stability and fire retardancy of poly (methyl methacrylate), Polym. Degrad. Stab., 2005, 89(2), 344–352 CrossRef CAS.
- M. I. Sarwar, S. Zulfiqar and Z. Ahmad, Polyamide–silica nanocomposites: mechanical, morphological and thermomechanical investigations, Polym. Int., 2008, 57(2), 292–296 CrossRef CAS.
- H. Wang, P. Xu, W. Zhong, L. Shen and Q. Du, Transparent poly (methyl methacrylate)/silica/zirconia nanocomposites with excellent thermal stabilities, Polym. Degrad. Stab., 2005, 87(2), 319–327 CrossRef CAS.
- C. Aymonier, D. Bortzmeyer, R. Thomann and R. Mülhaupt, Poly (methyl methacrylate)/palladium nanocomposites: synthesis and characterization of the morphological, thermomechanical, and thermal properties, Chem. Mater., 2003, 15(25), 4874–4878 CrossRef CAS.
- M. A. Haruna and D. Wen, Stabilization of Polymer Nanocomposites in High-Temperature and High-Salinity Brines, ACS Omega, 2019, 4(7), 11631–11641 CrossRef CAS PubMed.
- M. Giovino, J. Pribyl, B. Benicewicz, R. Bucinell and L. Schadler, Mechanical properties of polymer grafted nanoparticle composites, Nanocomposites, 2018, 4(4), 244–252 CrossRef.
- W. E. van Zyl, M. García, B. A. Schrauwen, B. J. Kooi, J. T. M. De Hosson and H. Verweij, Hybrid polyamide/silica nanocomposites: synthesis and mechanical testing, Macromol. Mater. Eng., 2002, 287(2), 106–110 CrossRef CAS.
- M. A. Haruna, S. Pervaiz, Z. Hu, E. Nourafkan and D. Wen, Improved rheology and high-temperature stability of hydrolyzed polyacrylamide using graphene oxide nanosheet, J. Appl. Polym. Sci., 2019, 136(22), 47582 CrossRef.
- Z. Hu, M. Haruna, H. Gao, E. Nourafkan and D. Wen, Rheological properties of partially hydrolyzed polyacrylamide seeded by nanoparticles, Ind. Eng. Chem. Res., 2017, 56(12), 3456–3463 CrossRef CAS.
- D. Jayoti, P. Malik and A. Singh, Analysis of morphological behaviour and electro-optical properties of silica nanoparticles doped polymer dispersed liquid crystal composites, J. Mol. Liq., 2017, 225, 456–461 CrossRef CAS.
- O. S. Ahmad, T. S. Bedwell, C. Esen, A. Garcia-Cruz and S. A. Piletsky, Molecularly imprinted polymers in electrochemical and optical sensors, Trends Biotechnol., 2019, 37(3), 294–309 CrossRef CAS PubMed.
- H. Ragab and A. Rajeh, Structural, thermal, optical and conductive properties of PAM/PVA polymer composite doped with Ag nanoparticles for electrochemical application, J. Mater. Sci.: Mater. Electron., 2020, 31(19), 16780–16792 CrossRef CAS.
- V. Satulu, B. Mitu, V. Ion, V. Marascu, E. Matei, C. Stancu and G. Dinescu, Combining fluorinated polymers with Ag nanoparticles as a route to enhance optical properties of composite materials, Polymers, 2020, 12(8), 1640 CrossRef CAS PubMed.
- A. Maghzi, R. Kharrat, A. Mohebbi and M. H. Ghazanfari, The impact of silica nanoparticles on the performance of polymer solution in presence of salts in polymer flooding for heavy oil recovery, Fuel, 2014, 123, 123–132 CrossRef CAS.
- P. Bhardwaj, S. Singh, V. Singh, S. Aggarwal and U. Mandal, Nanosize polyacrylamide/SiO2 composites by inverse microemulsion polymerization, Int. J. Polym. Mater., 2008, 57(4), 404–416 CrossRef CAS.
- S. Ganguly, P. Das, S. Banerjee and N. C. Das, Advancement in science and technology of carbon dot-polymer hybrid composites: a review, Funct. Compos. Struct., 2019, 1(2), 022001 CrossRef CAS.
- N. Tomczak, R. Liu and J. G. Vancso, Polymer-coated quantum dots, Nanoscale, 2013, 5(24), 12018–12032 RSC.
- Y. Zhou, S. K. Sharma, Z. Peng and R. M. Leblanc, Polymers in carbon dots: a review, Polymers, 2017, 9(2), 67 CrossRef PubMed.
- Y. Wang and A. Hu, Carbon quantum dots: synthesis, properties and applications, J. Mater. Chem. C, 2014, 2(34), 6921–6939 RSC.
- S. Azizighannad, Z. Wang, Z. Siddiqui, V. Kumar and S. Mitra, Nano Carbon Doped Polyacrylamide Gel Electrolytes for High Performance Supercapacitors, Molecules, 2021, 26, 2631 CrossRef CAS PubMed.
- B. Vercelli, R. Donnini, F. Ghezzi, A. Sansonetti, U. Giovanella and B. Ferla, Nitrogen-doped carbon quantum dots obtained hydrothermally from citric acid and urea: The role of the specific nitrogen centers in their electrochemical and optical responses, Electrochim. Acta, 2021, 387, 138557 CrossRef CAS.
- M. A. Haruna, Z. Hu, H. Gao, J. Gardy, S. M. Magami and D. Wen, Influence of carbon quantum dots on the viscosity reduction of polyacrylamide solution, Fuel, 2019, 248, 205–214 CrossRef.
- A. Einstein, On the motion of small particles suspended in liquids at rest required by the molecular-kinetic theory of heat, Ann. Phys., 1905, 17(549–560), 208 Search PubMed.
- R. G. Schmidt, G. V. Gordon, C. A. Dreiss, T. Cosgrove, V. J. Krukonis, K. Williams and P. M. Wetmore, A critical size ratio for viscosity reduction in poly (dimethylsiloxane)–polysilicate nanocomposites, Macromolecules, 2010, 43(23), 10143–10151 CrossRef CAS.
- H. Tan, J. Zheng, D. Xu, D. Wan, J. Qiu and T. Tang, Dependence of melt behavior of star polystyrene/POSS composites on the molecular weight of arm chains, J. Phys. Chem. B, 2014, 118(19), 5229–5239 CrossRef CAS PubMed.
- K. Nusser, G. J. Schneider, W. Pyckhout-Hintzen and D. Richter, Viscosity decrease and reinforcement in polymer–silsesquioxane composites, Macromolecules, 2011, 44(19), 7820–7830 CrossRef CAS.
- H. Wang, H. Zhang, C. Liu and S. Yuan, Coarse-grained molecular dynamics simulation of self-assembly of polyacrylamide and sodium dodecylsulfate in aqueous solution, J. Colloid Interface Sci., 2012, 386(1), 205–211 CrossRef CAS PubMed.
- B. Z. Shang, Z. Wang and R. G. Larson, Molecular dynamics simulation of interactions between a sodium dodecyl sulfate micelle and a poly (ethylene oxide) polymer, J. Phys. Chem. B, 2008, 112(10), 2888–2900 CrossRef CAS PubMed.
- Q. Cao, C. Zuo, L. Li and H. He, Self-assembled nanostructures of bottle-brush polyelectrolytes with oppositely charged surfactants: a computational simulation study, Soft Matter, 2011, 7(14), 6522–6528 RSC.
- S.-M. Yuan, H. Yan, K. Lv, C.-B. Liu and S.-L. Yuan, Surface behavior of a model surfactant: A theoretical simulation study, J. Colloid Interface Sci., 2010, 348(1), 159–166 CrossRef CAS PubMed.
- A. Laguecir, S. Ulrich, J. Labille, N. Fatin-Rouge, S. Stoll and J. Buffle, Size and pH effect on electrical and conformational behavior of poly (acrylic acid): simulation and experiment, Eur. Polym. J., 2006, 42(5), 1135–1144 CrossRef CAS.
- D. A. Pantano, M. L. Klein, D. E. Discher and P. B. Moore, Morphologies of charged diblock copolymers simulated with a neutral coarse-grained model, J. Phys. Chem. B, 2011, 115(16), 4689–4695 CrossRef CAS PubMed.
- S. Mantha and A. Yethiraj, Conformational properties of sodium polystyrenesulfonate in water: Insights from a coarse-grained model with explicit solvent, J. Phys. Chem. B, 2015, 119(34), 11010–11018 CrossRef CAS PubMed.
- J.-M. Y. Carrillo and A. V. Dobrynin, Salt effect on osmotic pressure of polyelectrolyte solutions: simulation study, Polymers, 2014, 6(7), 1897–1913 CrossRef.
- Z. Zhou and P. J. Daivis, Molecular dynamics study of polymer conformation as a function of concentration and solvent quality, J. Chem. Phys., 2009, 130(22), 224904 CrossRef PubMed.
- M. S. Sulatha and U. Natarajan, Origin of the difference in structural behavior of poly (acrylic acid) and poly (methacrylic acid) in aqueous solution discerned by explicit-solvent explicit-ion MD simulations, Ind. Eng. Chem. Res., 2011, 50(21), 11785–11796 CrossRef CAS.
- M. S. Sulatha and U. Natarajan, Molecular dynamics simulations of PAA–PMA polyelectrolyte copolymers in dilute aqueous solution: chain conformations and hydration properties, Ind. Eng. Chem. Res., 2012, 51(33), 10833–10839 CrossRef CAS.
- G. Yao, J. Zhao, S. B. Ramisetti and D. Wen, Atomistic Molecular Dynamic Simulation of Dilute Poly(acrylic acid) Solution: Effects of Simulation Size Sensitivity and Ionic Strength, Ind. Eng. Chem. Res., 2018, 57(50), 17129–17141 CrossRef CAS.
- J. S. Smith, D. Bedrov and G. D. Smith, A molecular dynamics simulation study of nanoparticle interactions in a model polymer-nanoparticle composite, Compos. Sci. Technol., 2003, 63(11), 1599–1605 CrossRef CAS.
- A. Kyrychenko, O. M. Korsun, I. I. Gubin, S. M. Kovalenko and O. N. Kalugin, Atomistic simulations of coating of silver nanoparticles with poly (vinylpyrrolidone) oligomers: Effect of oligomer chain length, J. Phys. Chem. C, 2015, 119(14), 7888–7899 CrossRef CAS.
- O. D. Villarreal, R. A. Rodriguez, L. Yu and T. O. Wambo, Molecular dynamics simulations on the effect of size and shape on the interactions between negative Au18 (SR) 14, Au102 (SR) 44 and Au144 (SR) 60 nanoparticles in physiological saline, Colloids Surf., A, 2016, 503, 70–78 CrossRef CAS PubMed.
- A. Kyrychenko, M. M. Blazhynska, M. V. Slavgorodska and O. N. Kalugin, Stimuli-responsive adsorption of poly (acrylic acid) onto silver nanoparticles: Role of polymer chain length and degree of ionization, J. Mol. Liq., 2019, 276, 243–254 CrossRef CAS.
- F. Liu, N. Hu, H. Ning, Y. Liu, Y. Li and L. Wu, Molecular dynamics simulation on interfacial mechanical properties of polymer nanocomposites with wrinkled graphene, Comput. Mater. Sci., 2015, 108, 160–167 CrossRef CAS.
- Y. Li, S. Wang and Q. Wang, A molecular dynamics simulation study on enhancement of mechanical and tribological properties of polymer composites by introduction of graphene, Carbon, 2017, 111, 538–545 CrossRef CAS.
- E. He, S. Wang, Y. Li and Q. Wang, Enhanced tribological properties of polymer composites by incorporation of nano-SiO2 particles: A molecular dynamics simulation study, Comput. Mater. Sci., 2017, 134, 93–99 CrossRef CAS.
- S. Liu, X.-Y. Meng, J. M. Perez-Aguilar and R. Zhou, An In Silico study of TiO 2 nanoparticles interaction with twenty standard amino acids in aqueous solution, Sci. Rep., 2016, 6, 37761 CrossRef CAS PubMed.
- F. Lin, Y. Xiang and H.-S. Shen, Temperature dependent mechanical properties of graphene reinforced polymer nanocomposites–a molecular dynamics simulation, Composites, Part B, 2017, 111, 261–269 CrossRef CAS.
- P. Elvati, E. Baumeister and A. Violi, Graphene quantum dots: effect of size, composition and curvature on their assembly, RSC Adv., 2017, 7(29), 17704–17710 RSC.
- M. t. Paloncýová, M. Langer and M. Otyepka, Structural dynamics of carbon dots in water and n, n-dimethylformamide probed by all-atom molecular dynamics simulations, J. Chem. Theory Comput., 2018, 14(4), 2076–2083 CrossRef PubMed.
- B. Hess, C. Kutzner, D. Van Der Spoel and E. Lindahl, GROMACS 4: algorithms for highly efficient, load-balanced, and scalable molecular simulation, J. Chem. Theory Comput., 2008, 4(3), 435–447 CrossRef CAS PubMed.
- W. L. Jorgensen, D. S. Maxwell and J. Tirado-Rives, Development and Testing of the OLPS All-Atom Force Field on Conformational Energetics and Properties of Organic Liquids, J. Am. Chem. Soc., 1996, 118(15), 11225–11236 CrossRef CAS.
- A. Cheng and W. Steele, Computer simulation of ammonia on graphite. I. Low temperature structure of monolayer and bilayer films, J. Chem. Phys., 1990, 92(6), 3858–3866 CrossRef CAS.
- C. Oostenbrink, A. Villa, A. E. Mark and W. F. Van Gunsteren, A biomolecular force field based on the free enthalpy of hydration and solvation: the GROMOS force-field parameter sets 53A5 and 53A6, J. Comput. Chem., 2004, 25(13), 1656–1676 CrossRef CAS PubMed.
- S. Abdel-Azeim and M. Y. Kanj, Dynamics, aggregation, and interfacial properties of the partially hydrolyzed polyacrylamide polymer for enhanced oil recovery applications: insights from molecular dynamics simulations, Energy Fuels, 2018, 32(3), 3335–3343 CrossRef CAS.
- S. Abdel-Azeim, R. Oliva, E. Chermak, R. De Cristofaro and L. Cavallo, Molecular dynamics characterization of five pathogenic Factor X mutants associated with decreased catalytic activity, Biochemistry, 2014, 53(44), 6992–7001 CrossRef CAS PubMed.
- A. Altis, M. Otten, P. H. Nguyen, R. Hegger and G. Stock, Construction of the free energy landscape of biomolecules via dihedral angle principal component analysis, J. Chem. Phys., 2008, 128(24), 06B620 CrossRef PubMed.
Footnote |
| † Electronic supplementary information (ESI) available. See DOI: 10.1039/d1ra03935k |
| This journal is © The Royal Society of Chemistry 2021 |

