 Open Access Article
Creative Commons Attribution 3.0 Unported Licence
Retracted Article: Promising antimicrobial and antibiofilm activities of reduced graphene oxide-metal oxide (RGO-NiO, RGO-AgO, and RGO-ZnO) nanocomposites
Sherif Elbasuneyab,
Gharieb S. El-Sayyad *bc,
Hesham Tantawyb and
Amr H. Hashem
 *d
*d
aHead of Nanotechnology Research Center, Military Technical College (MTC), Egyptian Armed Forces, Kobry Elkobbah, Cairo 262-111, Egypt
bChemical Engineering Department, Military Technical College (MTC), Egyptian Armed Forces, Kobry Elkobbah, Cairo 262-111, Egypt
cDrug Radiation Research Department, National Center for Radiation Research and Technology (NCRRT), Egyptian Atomic Energy Authority (EAEA), Nasr City, Cairo 11787, Egypt. E-mail: Gharieb.Elsayaad@eaea.org.eg
dBotany and Microbiology Department, Faculty of Science, Al-Azhar University, Cairo 11884, Egypt. E-mail: amr.hosny86@azhar.edu.eg
First published on 28th July 2021
Abstract
Microbial infections are considered one of the most dangerous infections in humans due to their resistance to most antimicrobial agents. In this study, nanocomposites based on reduced graphene oxide (RGO) and metal oxides (NiO, AgO, and ZnO) were fabricated. The graphite precursor and RGO were characterized by XRD, Raman spectroscopy, SEM, and HRTEM, while SEM, XRD, and EDX mapping analysis validated the synthesized nanocomposites. In addition, ZOI and MIC were employed to test the antimicrobial potential, while their antibiofilm activity and the effect of UV illumination were also investigated. Finally, reaction mechanism determination was performed using SEM analysis. The results revealed that all the synthesized nanocomposites (RGO-NiO, RGO-AgO, and RGO-ZnO) had outstanding antimicrobial activity against Gram-negative bacteria (Escherichia coli and Pseudomonas aeruginosa), Gram-positive bacteria (Staphylococcus aureus and Bacillus subtilis), unicellular fungi (Candida albicans and Cryptococcus neoformans) and multicellular fungi (Aspergillus niger, A. terreus, A. flavus and A. fumigatus). Moreover, the synthesized RGO-NiO nanocomposite exhibited antibiofilm activity (following 10.0 µg mL−1 RGO-NiO), with an inhibition percentage of 94.60% for B. subtilis, 91.74% for P. aeruginosa, and 98.03% for C. neoformans. The maximum percentage inhibition under UV illumination toward P. aeruginosa, B. subtilis and C. neoformans at the end of the experiment using RGO-NiO were 83.21%, 88.54%, and 91.15%, respectively, while the values of RGO-AgO were 64.85%, 68.0%, and 80.15%, respectively, and those of RGO-ZnO were 72.95%, 82.15%, and 79.25%, respectively. The SEM analysis of C. neoformans in the absence of the RGO-NiO nanocomposite showed the development of unicellular fungal cells by regular budding. In contrast, after RGO-NiO treatment, noticeable morphological differences were identified in C. neoformans, including the lysis of the outer surface with deformations of the fungal cells. In conclusion, the prepared nanocomposites are promising antimicrobial and antibiofilm agents and can be used to treat the pathogenic microbes at low concentrations and represent a new strategy for managing infectious diseases caused by pathogenic microorganisms.
Introduction
Pathogenic microbes have the ability to invade the human body and cause bacterial and fungal infections, consequently affecting human health. Bacterial infectious diseases, such as typhoid fever, syphilis, Streptococcal impetigo (skin-to-skin), tuberculosis, Q fever, legionellosis, have a sizeable harmful impact on public health.1 On the other hand, the incidence of fungal infections has significantly increased in the last decade in immunodeficient patients.2 Across the world, pathogenic fungi have invaded more than 1.2 billion individuals causing at least 1.7 million deaths per year.2–4 Candidiasis, aspergillosis, and mucormycosis are invasive fungal infections in humans.5 The recent annual incidence of invasive candidiasis, aspergillosis, and mucormycosis are over 750![[thin space (1/6-em)]](https://www.rsc.org/images/entities/char_2009.gif) 000, 300
000, 300![[thin space (1/6-em)]](https://www.rsc.org/images/entities/char_2009.gif) 000 and 10
000 and 10![[thin space (1/6-em)]](https://www.rsc.org/images/entities/char_2009.gif) 000 cases, respectively.6 Therefore, antimicrobial agents such as antibiotics and antifungals, are widely used to treat these diseases; however, the abuse of these antimicrobials leads to resistance development in microbes. Antimicrobial resistance (AR) is considered one of the most serious public health problems because the resistance of microbes to antimicrobial agents is increasing day by day.7 The emergence and spread of drug-resistant microbes occur due to the microbes acquiring new mechanisms to resist antimicrobial agents.8,9 Therefore, the discovery or synthesis of new antimicrobial agents is required. Recently, graphene-based materials (such as graphene, graphene oxide (GO), and reduced GO (RGO)) have attracted a lot of research attention.10–12 Graphene oxide (GO) is the oxidized derivative of graphene obtained by the acid oxidation of graphite, and its chemical or thermal reduction results in a spin-off of GO denoted as RGO.13,14 Previous studies have reported that RGO has antimicrobial activity,15–17 and GO when conjugated with active ingredients exhibits antimicrobial and antinematodal activities.18,19 Furthermore, metal and metal oxide nanoparticles, such as silver,20–22 zinc oxide,23–25 and nickel oxide,26,27 are widely used as antimicrobials, and a silver boron nano-formulation is a potential nematicide.28
000 cases, respectively.6 Therefore, antimicrobial agents such as antibiotics and antifungals, are widely used to treat these diseases; however, the abuse of these antimicrobials leads to resistance development in microbes. Antimicrobial resistance (AR) is considered one of the most serious public health problems because the resistance of microbes to antimicrobial agents is increasing day by day.7 The emergence and spread of drug-resistant microbes occur due to the microbes acquiring new mechanisms to resist antimicrobial agents.8,9 Therefore, the discovery or synthesis of new antimicrobial agents is required. Recently, graphene-based materials (such as graphene, graphene oxide (GO), and reduced GO (RGO)) have attracted a lot of research attention.10–12 Graphene oxide (GO) is the oxidized derivative of graphene obtained by the acid oxidation of graphite, and its chemical or thermal reduction results in a spin-off of GO denoted as RGO.13,14 Previous studies have reported that RGO has antimicrobial activity,15–17 and GO when conjugated with active ingredients exhibits antimicrobial and antinematodal activities.18,19 Furthermore, metal and metal oxide nanoparticles, such as silver,20–22 zinc oxide,23–25 and nickel oxide,26,27 are widely used as antimicrobials, and a silver boron nano-formulation is a potential nematicide.28
Furthermore, RGO-based metal oxide nanocomposites have garnered much attention as antimicrobials in the last few years.29–32 Therefore, this study aims to synthesize and characterize the RGO-AgO, RGO-ZnO and RGO-NiO nanocomposites, in addition to evaluate their antimicrobial and antibiofilm activities and the effect of UV illumination, as well as to determine the exact antimicrobial reaction mechanism. The synthesized nanocomposites may find potential applications in industries and medical surgeries as effective materials to eliminate or reduce the dangerous and fetal effects produced by the pathogenic microbes.
Experimental methods
Materials
The chemicals employed were of analytical grade. They were obtained from Sigma-Aldrich and used without further purification. Natural graphite flakes (99% carbon basis purity) were employed as the precursor for the development of reduced graphene oxide (RGO). Potassium permanganate (99%) was utilized as an oxidizing agent, also sulfuric acid (98%) and phosphoric acid (85%) were used in our synthetic methods. Ascorbic acid (99%) was used as the reducing agent. Ethanol (96%) and acetone (≥99%) were used in all the washing steps until the final RGO powder was obtained. Silver nitrate, zinc nitrate, and nickel nitrate (Aldrich, 99%) were employed as the precursors for metal deposition on the RGO surface. The deposited metal particles were quantitatively converted to the corresponding metal oxides via the calcination process.Synthesis of reduced graphene oxide (RGO)
RGO was developed from graphite via two main steps.33–35 The first step included the oxidation and exfoliation of the graphite precursor to produce graphene oxide (GO) using a modified Hummers method.36–38 In this method, 120 mL of concentrated sulfuric acid (H2SO4) and 13 mL of concentrated phosphoric acid (H3PO4) (volume ratio ∼9![[thin space (1/6-em)]](https://www.rsc.org/images/entities/char_2009.gif) :
:![[thin space (1/6-em)]](https://www.rsc.org/images/entities/char_2009.gif) 1) were mixed. Then 1 g of graphite was added into the mixed solution under stirring. Potassium permanganate (KMnO4) was added dropwise. The dark violet suspension was treated with 30% H2O2 (50 mL). Upon H2O2 addition, GO evolved to a bright orange color, as schematically presented in Fig. 1. The synthesized GO suspension was washed with de-ionized water. The second step concerned the reduction of GO to RGO. Ascorbic acid was employed as the reducing agent;39,40 it was added gradually to the heated GO suspension under vigorous agitation until a dark black color was achieved. The isolated RGO powder was dried at room temperature for 24 h followed by oven-drying at 45 °C for 24 h.
1) were mixed. Then 1 g of graphite was added into the mixed solution under stirring. Potassium permanganate (KMnO4) was added dropwise. The dark violet suspension was treated with 30% H2O2 (50 mL). Upon H2O2 addition, GO evolved to a bright orange color, as schematically presented in Fig. 1. The synthesized GO suspension was washed with de-ionized water. The second step concerned the reduction of GO to RGO. Ascorbic acid was employed as the reducing agent;39,40 it was added gradually to the heated GO suspension under vigorous agitation until a dark black color was achieved. The isolated RGO powder was dried at room temperature for 24 h followed by oven-drying at 45 °C for 24 h.
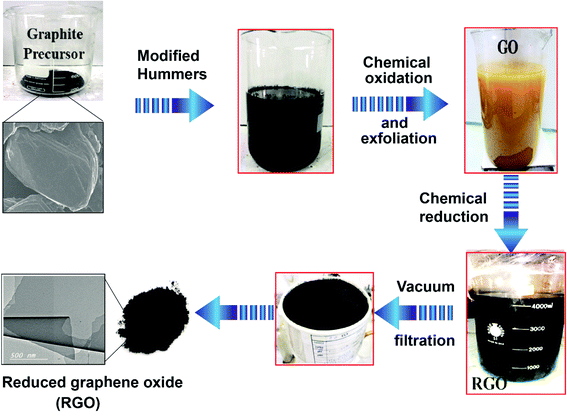 | ||
| Fig. 1 Step-by-step method of reduced graphene oxide (RGO) preparation using the modified Hummers method. | ||
Synthesis of the metal oxide-RGO nanocomposites
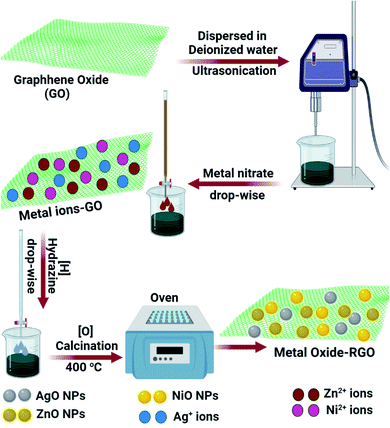
The RGO-metal oxide hybrid materials were prepared by a solution co-precipitation method.41 Ten milligrams of GO was dispersed in de-ionized water via sonication. The metal nitrate solution was added dropwise to the GO colloid. Hydrazine, the reducing agent, was added dropwise to the solution using a batch hydrothermal reactor. The RGO-metal residue was washed with distilled water, centrifuged, and dried. The RGO-metal composites were quantitatively converted to RGO-metal oxide nanocomposites via calcination at 400 °C. The schematic of RGO-metal oxide nanocomposite preparation is represented in Fig. 2.Characterization methods
The crystallite sizes and crystalline structure of the graphite precursor, the developed RGO, and RGO-metal oxides were determined using the XRD-6000 apparatus from Shimadzu, SSI, Japan. The strength of X-ray diffraction was recognized from the peaks at the diffracted angles 2θ. Moreover, Raman spectroscopic measurements of the graphite precursor and RGO powder samples were performed using a dispersive Raman microscope (Senterra II, Bruker, Germany) and the data were continuously collected with a spectral resolution of 4 cm−1. A Nikon 20× objective was used to focus the Raman excitation source (10 mW, 532 nm neodymium-doped yttrium aluminum garnet (Nd:YAG) laser- Bruker, Germany). The morphology of the developed RGO was determined by using a High-Resolution Transmission Electron Microscope (HRTEM, JEM2100, JEOL, Japan) and a Scanning Electron Microscope (SEM, ZEISS, EVO-MA10, Germany). The surface and morphological features of the graphite precursor and RGO-metal oxide nanocomposites were examined with a Scanning Electron Microscope (SEM, ZEISS, EVO-MA10, Germany). Further, EDX spectral examination (BRUKER, Nano GmbH, D-12489, 410-M, Germany) was used to estimate the elemental composition, purity and interactions of each metal.Antimicrobial activity
The antimicrobial activity of the synthesized RGO-metal oxide-based nanocomposites (RGO-NiO, RGO-AgO, and RGO-ZnO) was tested using the agar well diffusion method towards ten microorganisms, including Gram-negative bacteria (Escherichia coli ATCC 25922 and Pseudomonas aeruginosa ATCC 27853), Gram-positive bacteria (Staphylococcus aureus ATCC 25923 and Bacillus subtilis ATCC 6051), unicellular fungi (Candida albicans ATCC 90028 and Cryptococcus neoformans ATCC 14116) and multicellular fungi (Aspergillus niger RCMB 02724, A. terreus RCMB 02574, A. flavus RCMB 02782 and A. fumigatus RCMB 02568). The tested bacteria were inoculated on nutrient agar and grown for one day at 37 °C, while the fungal strains were inoculated in malt extract agar (MEA) plates, then incubated for 3–5 days at 28 ± 2 °C and kept at 4 °C until further use.42 Additionally, the minimum inhibitory concentrations (MIC) of the synthesized RGO-NiO, RGO-AgO, and RGO-ZnO nanocomposites were determined according to the microdilution method and agar diffusion. Different concentrations of each compound (1000–0.5 µg mL−1) were tested to determine the MIC. The obtained results were statistically examined by ONE WAY ANOVA, Duncan's multiple series, and the least significant difference (LSD) using specific software (SPSS version 15).Antibiofilm potential
Furthermore, a qualitative analysis of the restraint biofilm was performed as described by Christensen et al.43 The definitive biofilm study was conducted at the tube wall in the lack and presence of the integrated RGO-NiO, RGO-AgO, and RGO-ZnO nanocomposites. The antibiofilm activity of the synthesized RGO-NiO, RGO-AgO, and RGO-ZnO nanocomposites (at 10.0 µg mL−1) was measured against the chosen microbes and correlated with that of the control (non-treated sample). Briefly, 5 mL of the nutrient broth medium was used inside all tubes, and the tested bacteria and yeast were inoculated and subsequently adjusted 0.5 McFarland to be 1–3.5 × 10⁸ CFU mL−1. After that, they were incubated at 37.0 ± 0.5 °C for 24 h. The media from the control and treated tubes were removed, mixed with Phosphate Buffer Saline (PBS; pH 7.0), and ultimately preserved. Next, the bacterial and yeast cells adhered to the tube walls were incubated with 5 mL sodium acetate (3.5%) for approximately 20 min. Finally, they were cleaned with de-ionized water. Biofilms formed inside the tubes were stained with 20 mL Crystal Violet (CV; 0.15%) and washed with de-ionized water to eliminate excess CV. For the semi-quantitative antibiofilm calculation, 5 mL of absolute ethanol was added to separate the stained bacterial and yeast biofilms.44 A UV-Vis spectrophotometer was used to measure the O.D. of the stained bacterial and yeast biofilms at 570.0 nm.45 The bacterial and yeast biofilm inhibition percentage was determined by using the following relationship (eqn (1)):46| Biofilm inhibition% = [(O.D.control sample − O.D.treated sample)/O.D.control sample] × 100 | (1) |
Effect of UV irradiation on the antimicrobial activity
The examined microbes were inoculated in a nutrient broth and incubated at 37 °C for 24 h. About 0.5 mL of the incubated microbial culture was inoculated into tubes with 5 mL nutrient broth that was set to the standard 0.5 McFarland concentration (1.5 × 10⁸ CFU of bacteria, and 1 × 10⁷ CFU of C. neoformans) and grown for 2 h.47 After that, 100 µL of the synthesized RGO-NiO, RGO-AgO, and RGO-ZnO nanocomposites were added to the tubes and incubated again for 60 min at 36.5 °C. Tubes without the RGO-NiO, RGO-AgO, and RGO-ZnO nanocomposites and inoculated with the bacteria and unicellular yeast were considered as the positive controls, which were also subjected to UV illumination; the tubes without applying UV illumination were applied as the negative control, tubes with RGO-metal oxide nanocomposites, and tubes with RGO-NiO, RGO-AgO, and RGO-ZnO nanocomposites and UV-illumination. Standley, a 10 W low-pressure mercury lamp, was horizontally placed and used as the UV source, and 90% of the transmitted irradiation was at the particular wavelength. Lastly, the test tubes were subjected to UV irradiation for 1 h to a length of approximately 60 cm. After incubation, the turbidity of the culture media was assessed at a λmax of 630 nm for the unicellular fungi and 600 nm for the tested bacteria.Reaction mechanism using SEM analysis of RGO-metal oxide nanocomposites-treated microbial cells
The sensitive microbial cells (from the antibiofilm analysis) were washed with PBS three times and eventually fixed with 4.0% glutaraldehyde solution.48 The preserved microbial cells were regularly cleaned with PBS and repeatedly drained with ethanol of increasing concentrations (30, 50, 70, 90, and 100%) for 15 min each at 28 ± 2 °C.49 Next, the fixed samples were fixed on an aluminum stub for SEM analysis. The morphological characteristics of the controls (non-treated microbial cells) and the RGO-NiO, RGO-AgO, and RGO-ZnO nanocomposite-treated microbes were observed by SEM examination.Results and discussion
Characterization of graphite and reduced graphene oxide
The graphite precursor was characterized by scanning electron microscopy (SEM). The observed morphological profile of graphite confirmed its flake nature with the lateral dimension in the order of 40–80 µm, as shown in Fig. 3a. In addition, the SEM micrographs demonstrated a multiple-layered structure of about 2–4 µm thickness (Fig. 3b).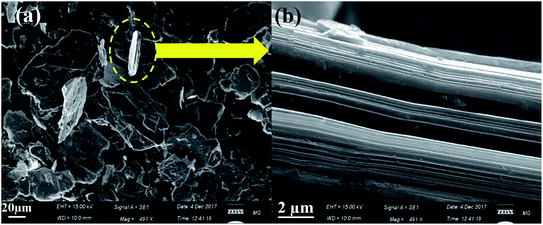 | ||
| Fig. 3 SEM micrographs of the (a) starting graphite precursor and (b) the magnified image of the marked part. | ||
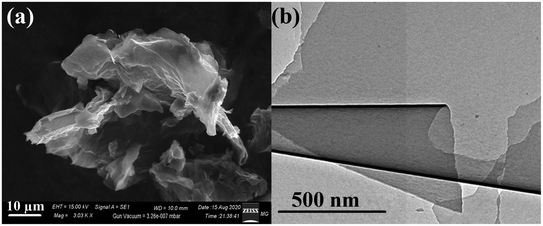
Moreover, the SEM micrographs of the synthesized RGO demonstrated the successful exfoliation of graphite to RGO, as presented in Fig. 4a. The obtained RGO sheets appeared as randomly aggregated thin sheets, with distinct edges, wrinkled surfaces, and folding. Moreover, the HRTEM micrograph of RGO (Fig. 4b) confirmed the apparently effective exfoliation and that the RGO sheets may have consisted of a few layers stacked on top of each other with fewer wrinkles and folding. Both SEM and TEM showed no residual reactants or byproducts on the RGO surface.
The XRD diffractogram of developed RGO in comparison with the starting graphite precursor is shown in Fig. 5a. The appearance of a broad and low-intensity XRD peak centered at 2θ ≈ 26.5° (with a d-spacing of 3.380 Å) representing the (002) plane verified the successful formation of fragile RGO layers due to a high degree of exfoliation few-layer RGO.50,51
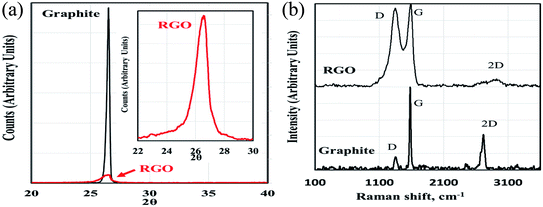 | ||
| Fig. 5 (a) XRD diffractogram of the developed RGO with respect to the starting graphite precursor, and (b) Raman spectra of RGO and the starting graphite precursor. | ||
Fig. 5b represents the acquired Raman spectrum of developed RGO with respect to the graphite precursor. The Raman spectrum of RGO exhibited a G band at 1582 cm−1 (typical also for graphite), and a broad D band (characteristic for RGO) appeared at 1350 cm−1; this characteristic peak confirmed the formation of RGO.52–56
According to the results obtained from SEM, HRTEM, Raman spectroscopy, and XRD, it is evident that RGO had lost the original graphite structure.54 The reduction of GO generated aggregated and randomly packed RGO sheets. The obtained Raman spectra confirmed the successful preparation of few-layered reduced graphene oxide with the typical thickness <10 nm.52,55,56
Characterization of RGO-metal oxide nanocomposites
XRD was applied to investigate the crystal composition and the usual crystal size of the metal oxide NPs integrated across RGO as it outlines the state of the identified crystals.57,58 The XRD crystalline structure of the synthesized RGO-metal oxide nanocomposites are presented in Fig. 6. The lattice structure and the diffraction showed the crystalline composition of the loaded metal oxides (NiO, AgO, and ZnO NPs), which were clear of defects and other interfering materials.59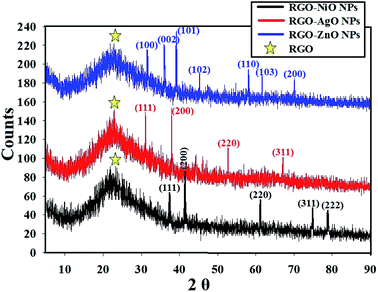 | ||
| Fig. 6 XRD analysis of the RGO-metal oxide nanocomposites (RGO-AgO, RGO-ZnO, and RGO-NiO nanocomposites); yellow stars mark the RGO peaks. | ||
The synthesized RGO-metal oxide nanocomposites were prepared as thin films over glass slides for XRD, and so a peak representing the amorphous nature of glass was detected at 2θ = 22.35° 60 in addition to the RGO peaks at 2θ ≈26.5°. The XRD diffractograms proved the formation of crystalline NiO, AgO, and ZnO NPs with distinctive peaks that matched the card numbers JCPDS 22-1189 (for NiO NPs),60 JCPDS 76-1393 (for AgO NPs),61 and JCPDS 43-0002 (for ZnO NPs), respectively.62
The XRD data of the RGO-NiO nanocomposite confirmed that the composition of the 2θ diffraction characteristics dominates NiO NPs, with the corresponding Bragg's reflections at 37.21° (111) 41.50° (200), 62.61° (311), 75.31° (311), and 78.92° (222).63 On the other hand, the XRD data of the RGO-AgO nanocomposites confirmed that the composition of the 2θ diffraction characteristics dominates AgO NPs with the corresponding Bragg's reflections at 32.61° (111), 38.72° (200), 52.81° (220), and 68.71° (311).64 Finally, the XRD data of the RGO-ZnO nanocomposites confirmed that the composition of the 2θ diffraction characteristics dominates ZnO NPs, with the corresponding Bragg's reflections at 32.60° (100), 36.81° (002), 39.25° (101), 46.37° (102), 58.91° (110), 61.8° (103), and 71.3° (200).65 The integrated metal oxides showed a large crystalline property, and the XRD results matched with the recently published articles.66–68
Typical SEM was used to determine the appearance of the prepared nanocomposites and their external morphology.69,70 The SEM micrographs demonstrated the uniform distribution of metal oxides on the RGO surface, as seen in Fig. 7. As shown, the AgO NPs appeared as bright spherical particles on the surface of the synthesized RGO sheets, as exhibited in Fig. 7a and the corresponding magnified image (Fig. 7d), which confirmed the uniform distribution of AgO on the outside of the produced RGO layers. The same state of distribution outside the RGO surface was noted in the case of ZnO NPs (Fig. 7b and e) and NiO NPs (Fig. 7c and f). Notably, the deposition of the synthesized metal oxides (AgO, ZnO, and NiO) on the surface of RGO would facilitate the outstanding potential in applications, especially in the biomedical field.
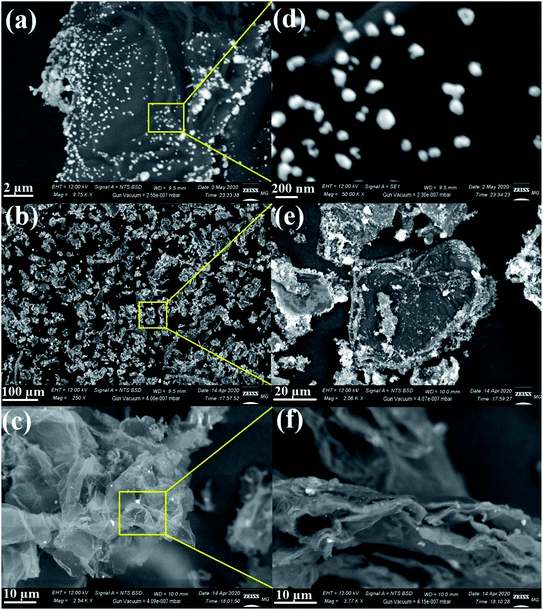 | ||
| Fig. 7 SEM images of the RGO-metal oxide nanocomposites and the corresponding magnified areas: (a & d) RGO-AgO, (b & e) RGO-ZnO, and (c & f) RGO-NiO. | ||
The EDX analysis was applied for the elemental study and the chemical characterization of the fabricated samples.57,71–73 The EDX elemental analysis of the synthesized RGO-metal oxide nanocomposites is exhibited in Fig. 8. In the synthesized RGO-AgO nanocomposite (Fig. 8a), the EDX spectrum recorded that the incorporated RGO-AgO nanocomposite is stoichiometric and similar to normal composition. The characteristic X-ray peaks of the C (61.97 at%), O (20.20 at%) and Ag (17.83 at%) atoms were apparent in the EDX spectrum of the RGO-AgO nanocomposite. On the other hand, the EDX spectrum for the synthesized RGO-ZnO nanocomposite (Fig. 8b) showed the X-ray peaks of C (50.87 at%), O (20.75 at%), and Zn (28.38 at%). Moreover, the EDX spectrum of the synthesized RGO-NiO nanocomposite (Fig. 8c) displayed the X-ray peaks of C (52.95 at%), O (33.85 at%), and Ni (13.20 at%). Finally, both C and O atoms corresponded with the RGO composition in all the prepared samples. The presence of the known atoms without any unpredicted ones indicated the purity of the synthesized samples.
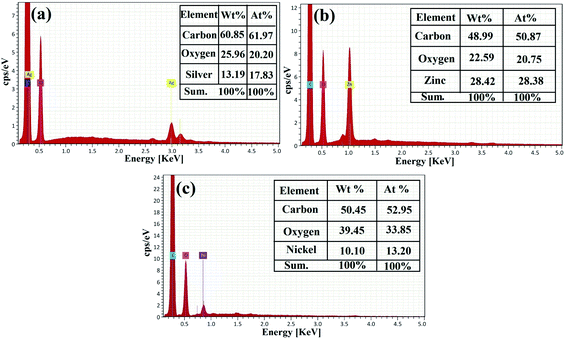 | ||
| Fig. 8 Elemental analysis of the RGO-metal oxide nanocomposites by EDX: (a) RGO-AgO, (b) RGO-ZnO, and (c) RGO-NiO. | ||
The elemental mapping analysis of the synthesized RGO-metal oxide nanocomposites is displayed in Fig. 9. The images of each element are marked separately by color: as Ag (yellow color), C (green color), and O (orange color) for the synthesized RGO-AgO nanocomposite (Fig. 9a); as Zn (yellow color), C (turquoise color), and O (pink color) for the synthesized RGO-ZnO nanocomposite (Fig. 9b); and finally, as Ni (yellow color), C (blue color), and O (green color) for the synthesized RGO-NiO nanocomposite (Fig. 9c).
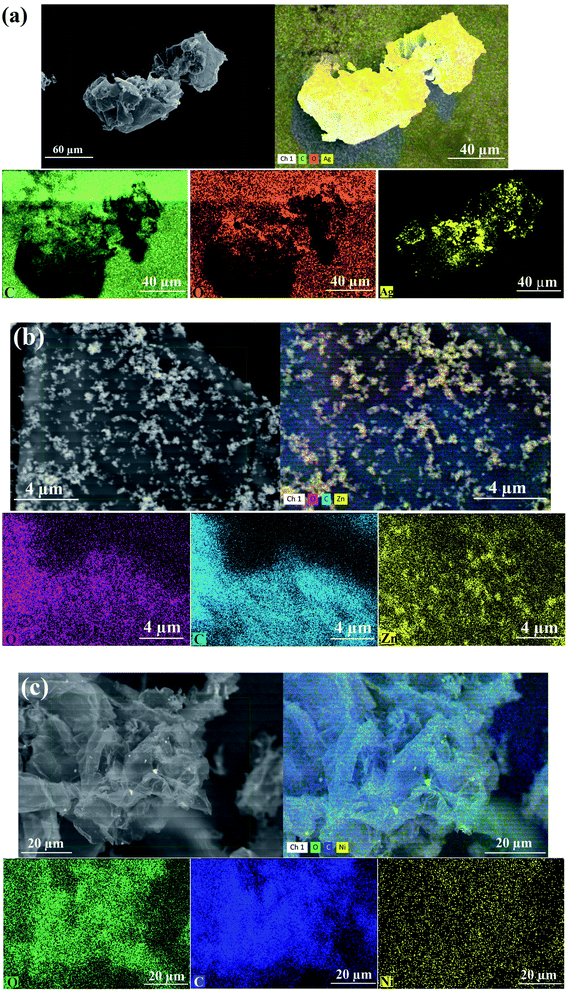 | ||
| Fig. 9 Elemental mapping (SEM/EDX detector) images of the RGO-metal oxide nanocomposites: (a) RGO-AgO, (b) RGO-ZnO, and (c) RGO-NiO. | ||
Fig. 9 validates the synthesized nanocomposite in terms of the appearance of the detected atoms (Ag, Zn, Ni, C, and O). On the other hand, the elemental mapping images demonstrated the uniform elemental distribution, remarkable purity, and the absence of interfering elements.35
Antimicrobial activity of the synthesized RGO-metal oxide nanocomposites
Recently, nanocomposites are widely used for treating resistant microbes, which produce slim biofilms.74,75 Previous studies have reported that RGO nanosheets, RGO nanofilms and RGO paper have potential antibacterial activity against spherical and rod-shaped bacteria with low cytotoxicity.76,77 Therefore, the RGO-NiO, RGO-AgO, and RGO-ZnO nanocomposites were synthesized in this study. The antimicrobial activity of the synthesized RGO-NiO, RGO-AgO, and RGO-ZnO nanocomposites against different bacterial and fungal strains was evaluated, and the results are shown in Table 1 and Fig. 10.| Test organism | RGO-NiO | RGO-AgO | RGO-ZnO | AMC/nystatin | ||||
|---|---|---|---|---|---|---|---|---|
| IZ (mm) | MIC µg ml−1 | IZ (mm) | MIC µg ml−1 | IZ (mm) | MIC µg ml−1 | IZ (mm) | MIC µg ml−1 | |
| a IZ: inhibition zone, MIC: minimum inhibition concentration, AMC: amoxicillin/clavulanic acid. Values are presented as mean ± SD (n = 3). Data within the groups are analyzed using one-way analysis of variance (ANOVA) followed by a, b, c, d, e, f Duncan's multiple range test (DMRT). | ||||||||
| E. coli | 21.7 ± 0.58f | 250 | 20.8 ± 0.76e | 250 | 19.0 ± 0.55e | 125 | 15.3 ± 0.46d | 250 |
| P. aeruginosa | 32.3 ± 1.53b,c,d | 500 | 25.7 ± 0.58d | 125 | 29.1 ± 0.40b | 250 | 21.0 ± 1.00c | 500 |
| S. aureus | 30.2 ± 0.76d,e | 125 | 26.4 ± 0.53d | 250 | 25.2 ± 0.85d | 125 | 29.5 ± 0.50b | 250 |
| B. subtilis | 38.5 ± 0.50a | 3.9 | 30.5 ± 0.87b,c | 15.62 | 28.8 ± 0.98b,c | 7.81 | 26.0 ± 1.00a | 31.25 |
| C. albicans | 19.3 ± 0.58f | 62.5 | 17.0 ± 0.45f | 125 | 16.8 ± 0.72f | 15.62 | 11.3 ± 0.58f | 125 |
| C. neoformans | 30.7 ± 1.15c,d,e | 31.25 | 29.6 ± 0.69c | 62.5 | 27.2 ± 0.68b,c,d | 125 | 19.8 ± 0.68c | 250 |
| A. terreus | 29.3 ± 0.64e | 7.81 | 31.7 ± 0.58b | 3.9 | 29.2 ± 0.76b | 7.81 | 12.3 ± 0.61f | 125 |
| A. niger | 32.7 ± 0.52b,c | 0.97 | 34.2 ± 0.72a | 1.95 | 28.8 ± 0.72b,c | 1.95 | 14.6 ± 0.66d,e | 62.5 |
| A. fumigatus | 31.3 ± 0.58b,c,d,e | 0.97 | 29.5 ± 0.50c | 3.9 | 26.9 ± 0.85c,d | 1.95 | 12.0 ± 0.70f | 62.5 |
| A. flavus | 33.4 ± 0.66b | 1.95 | 35.2 ± 0.68a | 15.62 | 31.7 ± 0.46a | 0.97 | 12.7 ± 0.52e,f | 125 |
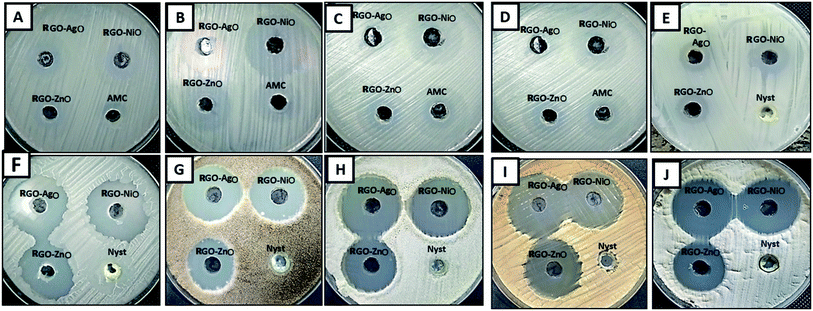
Overall, all the designed composites (RGO-NiO, RGO-AgO, and RGO-ZnO nanocomposites) exhibited promising antimicrobial activity against all tested bacterial and fungal strains; compared with conventional antimicrobial agents AMC and Nyst, the RGO-NiO and RGO-AgO nanocomposites were significantly better. The results revealed that RGO-NiO had the highest effect on most of the tested bacterial and fungal strains among the three nanocomposites. Table 1 illustrates that the RGO-NiO nanocomposite (1 mg mL−1) had the highest impact on B. subtilis among all the tested bacterial strains. The inhibition zone was 38.5 ± 0.50 mm; additionally, it had the greatest effect on A. flavus among all tested fungal strains, with an inhibition zone of 33.4 ± 0.66 mm. Moreover, the RGO-AgO nanocomposite at concentration 1 mg mL−1 had a promising antimicrobial activity against E. coli, P. aeruginosa, S. aureus, B. subtilis, C. albicans, C. neoformans, A. terreus, A. niger, A. fumigatus and A. flavus, with the inhibition zones of 20.8 ± 0.76, 25.7 ± 0.58, 26.4 ± 0.53, 30.5 ± 0.87, 17.0 ± 0.45, 29.6 ± 0.69, 31.7 ± 0.58, 34.2 ± 0.72, 29.5 ± 0.50 and 35.2 ± 0.68 mm, respectively.
Furthermore, the RGO-AgO nanocomposite had antimicrobial activity lower than those of the RGO-NiO and RGO-AgO nanocomposites; its highest effect was against A. flavus and P. aeruginosa among the fungal and bacterial strains with inhibition zones 31.7 ± 0.46 and 29.1 ± 0.40 mm, respectively. On the other hand, the lowest influence was towards C. albicans and E. coli with inhibition zones measuring 16.8 ± 0.72, and 19.0 ± 0.5, respectively, as shown in Table 1 and Fig. 10.
The incorporation of RGO with metal oxide nanoparticles prevents aggregation, leading to nanocomposites with high stability and better antibacterial activity than those of each component alone.78,79 Sadhukhan et al.,79 reported that RGO/NiO NCs might be used as antibiotics in the future as they are non-toxic, cheap, eco-friendly and highly effective against pathogenic microorganisms. Moreover, Hsueh et al.,31 found that Ag/RGO, ZnO/RGO and Ag/ZnO/RGO had potential antibacterial activity against E. coli K12. Furthermore, Rajapaksha et al.,80 reported that GO-CuONPs exhibited promising antibacterial activity toward pathogenic E. coli ATCC 8739 and Salmonella typhimurium ATCC 14028.
Moreover, MIC of all tested samples (RGO-NiO, RGO-AgO, and RGO-ZnO nanocomposites) were determined, as shown in Table 1. The results revealed that the MICs of the RGO-NiO, RGO-AgO, and RGO-ZnO nanocomposites toward the tested filamentous fungi (A. terreus, A. niger, A. fumigatus and A. flavus) were the best among the tested microbial strains, and they were in the range 0.97–15.62 µg mL−1.
Likewise, all composites exhibited promising MIC results against tested unicellular fungi (C. albicans & C. neoformans) in the range 15.62–125 µg mL−1, which is higher than that against the filamentous fungi. Moreover, based on the MIC of all the composites towards the tested bacteria, B. subtilis was the most sensitive, and the corresponding MIC of the RGO-NiO, RGO-AgO, and RGO-ZnO nanocomposites were 3.9, 15.62 and 7.81 µg mL−1, respectively. On the other hand, the MIC values of all composites against E. coli, P. aeruginosa and S. aureus were poorer than those against B. subtilis in the range 125–500 µg mL−1. In summary, the designed RGO-NiO, RGO-AgO, and RGO-ZnO nanocomposites possessed better antimicrobial activity against bacteria, unicellular and multicellular fungi than traditional antimicrobial agents (AMC/Nyst.).
Antibiofilm potential of the synthesized RGO-metal oxide nanocomposites
The development of biofilm by pathogenic bacteria is promoted by exo-polysaccharide production.45 The tube design was used to define the antibiofilm behavior of the integrated RGO-NiO nanocomposite toward some pathogenic bacteria and unicellular fungi.81Fig. 11a indicates the antibiofilm activity of the RGO-NiO nanocomposite (the most efficient RGO-metal oxide nanocomposite) toward B. subtilis (representative of the sensitive pathogenic bacteria). The complete steps were: (I) the regular microbial growth and reproduction of the distinguished ring in the absence of the synthesized RGO-NiO nanocomposite, and the inhibition of microbial growth in the presence of the synthesized RGO-NiO nanocomposite, (II) the possibility of staining the established biofilm with Crystal Violet (CV), which is a qualitative measurement system, and (III) removal and separation of the adhered microbial cells following ethanol treatment for the semi-quantitative evaluation of biofilm inhibition (Table 2).
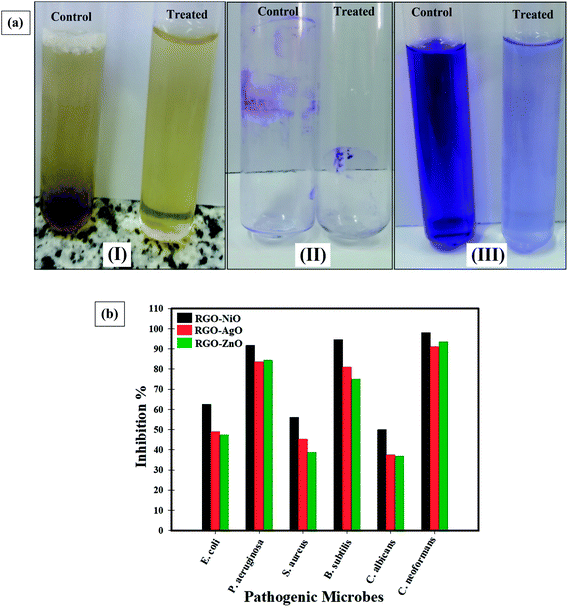 | ||
| Fig. 11 (a) Antibiofilm activity of the synthesized RGO-NiO nanocomposite against Bacillus subtilis determined using the test tube method. The steps were reported as (I) growth of the bacterial cells and biofilm formation (rings) without the synthesized RGO-NiO nanocomposite treatment and the inhibition of bacterial growth after treatment with RGO-NiO nanocomposite, (II) staining of the adherent bacterial cells with crystal violet and (III) removing and dissolving the adherent bacterial cells using ethanol for semi-quantitative biofilm inhibition (%) determination (as shown in Table 2), and (b) antibiofilm potential of the synthesized RGO-NiO, RGO-AgO, and RGO-ZnO nanocomposites against different pathogenic microbes (inhibition%). | ||
| Test organism | O.D. of crystal violet stain at 570.0 nm | Inhibition% | |||||
|---|---|---|---|---|---|---|---|
| Control | RGO-NiO | RGO-AgO | RGO-ZnO | RGO-NiO | RGO-AgO | RGO-ZnO | |
| a Values are presented as mean ± SD (n = 3). Data within the groups are analyzed using one-way analysis of variance (ANOVA) followed by a, b, c, d, e, f Duncan's multiple range test (DMRT). | |||||||
| E. coli | 0.808d ± 0.0080 | 0.399c ± 0.0021 | 0.488c ± 0.0062 | 0.499b ± 0.0080 | 62.64 | 49.01 | 47.32 |
| P. aeruginosa | 0.950a ± 0.0062 | 0.122e ± 0.0047 | 0.195e ± 0.0047 | 0.189d ± 0.0046 | 91.74 | 83.65 | 84.32 |
| S. aureus | 0.945b ± 0.0070 | 0.445b ± 0.0053 | 0.541b ± 0.0036 | 0.599a ± 0.0025 | 55.98 | 45.23 | 38.74 |
| B. subtilis | 0.454f ± 0.0025 | 0.259d ± 0.0062 | 0.287d ± 0.0053 | 0.299c ± 0.0025 | 94.60 | 81.02 | 75.20 |
| C. albicans | 0.789e ± 0.0046 | 0.478a ± 0.0036 | 0.555a ± 0.0062 | 0.559a ± 0.0080 | 49.95 | 37.58 | 36.94 |
| C. neoformans | 0.845 c,d ± 0.0046 | 0.145e ± 0.0036 | 0.195e ± 0.0047 | 0.178e ± 0.0021 | 98.03 | 91.03 | 93.41 |
Fig. 11a shows that in the tube experiment to determine the antibiofilm potential of the RGO-NiO nanocomposite against B. subtilis, a thick whitish-yellow layer was formed in the air-liquid interface in the absence of RGO-NiO (control). The produced matt layers had fully adhered across the walls of the designed tubes and developed a blue color following CV staining. Next, a dark blue color was created in the resulting solution after removing and subsequent dissolving the cells in CV with absolute ethanol, as presented in Fig. 11a.
On the other side, in the tubes containing B. subtilis cells and the RGO-NiO nanocomposite (10 µg mL−1), a remarkable negative impact was seen as the cells did not produce biofilm layers, and the ring construction was blocked. Moreover, the adherent cell color was soft, and only a faint blue color developed following ethanol addition, as illustrated in Fig. 11a.
A UV-visible spectrophotometer was used for the semi-quantitative measurement of the inhibition percentage (%). The optical density (O.D.) was measured at 570 nm following the termination of the CV-stained biofilms, and this was recognised as a measure of their production.81
Table 2 illustrates the inhibition % after the addition of 10.0 µg mL−1 RGO-NiO nanocomposite, showing that the highest percentage toward B. subtilis was 94.60%, P. aeruginosa was 91.74%, and C. neoformans was 98.03%. Notably, the RGO-NiO nanocomposite was capable of managing the biofilm growth at its adhesion strength, which is the initial start process in the antimicrobial activity.82 The difference in the hindrance percentage may be linked to several reasons, such as the great potential of the antimicrobial agent to be connected to the surface due to the enhanced surface area of the integrated RGO-NiO nanocomposite and the particle size, as well as the attack mode and various chemical properties affecting the association and interactions of the RGO-NiO nanocomposite with the biofilm-producing bacteria.81,83,84 Fig. 11b presents an overview of the antibiofilm activity of the RGO-metal oxide nanocomposites (as inhibition %) toward various pathogenic microbes.
Antimicrobial effect of the synthesized RGO-NiO, RGO-AgO, and RGO-ZnO nanocomposites in liquid media under UV illumination
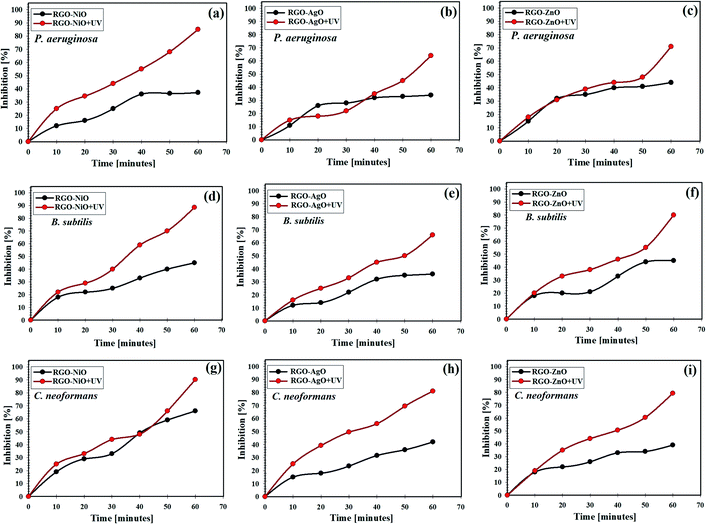
The comparison of the inhibition of P. aeruginosa, B. subtilis, and C. neoformans by the application of the RGO-NiO, RGO-AgO, and RGO-ZnO nanocomposites with and without UV illumination is shown in Fig. 12. Notably, the RGO-NiO nanocomposite exhibited the most significant antimicrobial action on P. aeruginosa, B. subtilis, and C. neoformans colonies. Fig. 12a–c show the synergistic action of NiO doping and RGO against P. aeruginosa, B. subtilis, and C. neoformans, respectively. Moreover, upon UV illumination, the RGO-NiO nanocomposite showed even higher antimicrobial activities than those in the dark.The highest inhibition percentages of the RGO-NiO nanocomposite under UV illumination against P. aeruginosa B. subtilis, and C. neoformans at the end of the experiment were 83.21%, 88.54%, 91.15%, respectively (Fig. 12a, d and g), while the values for RGO-AgO were 64.85%, 68.0%, and 80.15% toward P. aeruginosa B. subtilis, and C. neoformans, respectively (Fig. 12b, e and h), and those of RGO-ZnO were 72.95%, 82.15%, and 79.25% against P. aeruginosa B. subtilis, and C. neoformans, respectively (Fig. 12c, f and i).
The detected potential following UV irradiation may be associated with the production of oxygen species, such as OH free radicals, which cause the disruption of microbial coenzymes and decrease their content.47 The significant consequences include the production of holes in the microbial cell wall, which eventually change cell permeability and finally lead to cell death.48
Reaction mechanism determination by SEM imaging
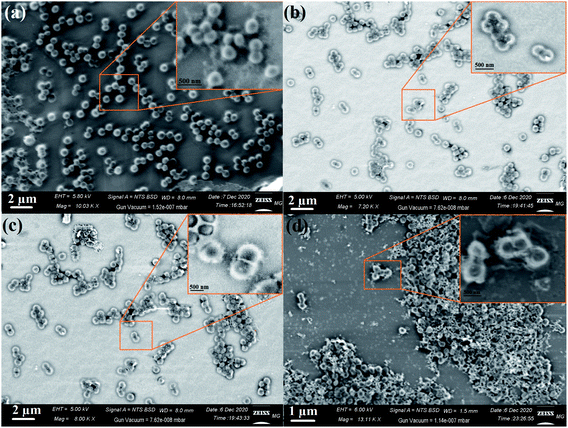
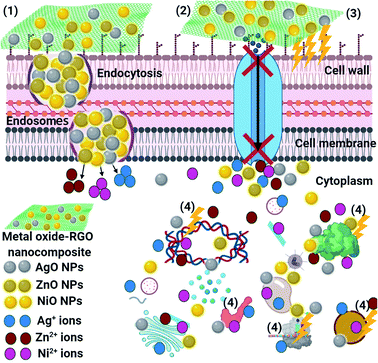
SEM imaging analysis was conducted to explain the potential antimicrobial mechanism against the unicellular fungus C. neoformans, see Fig. 13. The SEM examination of the control fungus in the absence of RGO-NiO nanocomposite (as an example of RGO-metal oxide nanocomposites) revealed unicellular fungal colonies growing regularly with normal budding surface and semi-formed biofilms, as shown in Fig. 13a. Upon RGO-NiO nanocomposite treatment, remarkable morphological abnormalities were recognized in C. neoformans (Fig. 13b), including the total lysis of the exterior surface, as evidenced by the deformation of the C. neoformans cells. Additionally, the RGO-AgO nanocomposite caused the complete lysis of the fungal cells and cell distortion, reducing the total viable number. Further, the biofilm growth was limited (Fig. 13c). Eventually, the RGO-ZnO nanocomposite led to the lysis of fungal cells and cell deformity, with a drop in the complete viable count and finally, the biofilm mass was controlled (Fig. 13d).The schematic illustration in Fig. 14 shows the potential antimicrobial mechanisms. Superior mechanisms like reactive oxygen species (ROS) distribution (superoxide anion; O2−),85 the activity of metal-oxide NPs (NiO, AgO, and ZnO after their release from the RGO surface) inside the pathogenic microbes, and an alkaline tendency showed the antimicrobial action mechanism. It is believed that the metal-oxide NPs could change the microbial morphology and their biofilm formation, reduce the microbial membrane permeability and provide oxidative stress on genes, affecting their responses, because of H2O2 generation.85 We understand that the RGO-metal oxide nanocomposites begin their activity by wrapping and adhering at the exterior surface of the microbial cells, causing membrane destruction and changing the transport potential.86 Then, the distribution of the metal oxide NPs (NiO, AgO, and ZnO) inside the microbial cell divides all intracellular structures, including plasmid, DNA, and other essential organelles. Ultimately, cellular toxicity happens due to the oxidative stress created by the generation of ROS. Lastly, in the acidic medium, ionic species are created (Ni, Ag, and Zn ions), resulting in cellular and genotoxicity due to the interactions among the negatively charged vital organelles.86,87
Conclusion
RGO and its nanocomposites with metal-oxide (NiO, AgO, and ZnO) NPs were designed and fabricated in this work. The SEM/EDX mapping technique distinguished the effect of the hybridization of the metal oxide NPs on the external shape of the prepared RGO. Notably, the deposition of the different synthesized metal-oxide NPs on the surface of RGO facilitates their application in the biomedical field. Then, the antimicrobial capabilities of the prepared RGO-metal oxides nanocomposites were investigated. The RGO-NiO nanocomposite was more potent in terms of its antimicrobial capabilities than RGO-AgO and RGO-ZnO. It was active even at low concentrations (0.97 µg mL−1) against some of the examined pathogenic microbes. The results confirmed that the RGO-metal oxides nanocomposites were functional against all the tested pathogenic microbes as they interrupt the external membrane. The reaction mechanism was studied by SEM analysis and was found to be because of the oxidative and membrane stress, as well as wrapping by the RGO sheets (Fig. 13 and 14). The in vitro ZOI results proved that the RGO-NiO nanocomposite showed activity against E. coli, P. aeruginosa, S. aureus, B. subtilis, C. albicans, C. neoformans, A. terreus, A. niger, A. fumigatus and A. flavus, with inhibition zones measuring 20.8 ± 0.76, 25.7 ± 0.58, 26.4 ± 0.53, 30.5 ± 0.87, 17.0 ± 0.45, 29.6 ± 0.69, 31.7 ± 0.58, 34.2 ± 0.72, 29.5 ± 0.50 and 35.2 ± 0.68 mm, respectively. Regarding the antibiofilm property, after the addition of 10.0 µg mL−1 RGO-NiO nanocomposite, the highest inhibition percentage toward B. subtilis was 94.60%, while that against P. aeruginosa was 91.74% and that for C. neoformans was 98.03%. The synthesized RGO-NiO nanocomposite was capable of managing the biofilm extension at its adhesion strength, which is the initial start in the antimicrobial means. The highest inhibition percentage of the RGO-NiO nanocomposite under UV illumination toward P. aeruginosa B. subtilis, and C. neoformans at the end of the experiment were 83.21%, 88.54%, 91.15%, respectively, while the values for RGO-AgO were 64.85%, 68.0%, and 80.15% against P. aeruginosa B. subtilis, and C. neoformans, respectively, and those for RGO-ZnO were 72.95%, 82.15%, and 79.25% toward P. aeruginosa B. subtilis, and C. neoformans, respectively (Fig. 12). In summary, our results suggest that the synthesized RGO-metal oxide nanocomposites can be applied as an encouraging antimicrobial agents in the biomedical treatment due to a high antimicrobial activity but only for limited purposes (the toxicity level must be examined), such as in paints for the operation rooms, face masks, cosmetics, and dressing.Author contribution
Sherif Elbasuney: conceptualization, data curation, formal analysis, Investigation, methodology, resources, software, validation, writing-original draft. Gharieb S. El-Sayyad: conceptualization, data curation, formal analysis, investigation, methodology, resources, software, validation, visualization, writing-original draft, writing-review & editing. Hesham Tantawy: conceptualization, data curation, formal analysis, investigation, methodology, resources, software, validation, writing-original draft. Amr H. Hashem: conceptualization, data curation, formal analysis, investigation, methodology, resources, software, validation, visualization, writing-original draft, writing-review & editing.Conflicts of interest
The authors declare that they have no conflict of interest.Acknowledgements
Authors acknowledge Prof. Mohamed Gobara (Military Technical College), and Zeiss microscope team in Cairo for their invaluable advice during this study, Fig. 2, and 14 had been created by BioRender.com.References
- S. Doron and S. L. Gorbach, International Encyclopedia of Public Health, 2008, 273–282, DOI:10.1016/B978-012373960-5.00596-7.
- Y.-L. Chang, S.-J. Yu, J. Heitman, M. Wellington and Y.-L. Chen, Virulence, 2017, 8, 222–236 CrossRef CAS PubMed.
- S. Campoy and J. L. Adrio, Biochem. Pharmacol., 2017, 133, 86–96 CrossRef CAS PubMed.
- G. P. GAFFI, How 150 people die every hour from fungal infection while the world turns a blind eye, Global Action Fund for Fungal Infections (GAFFI), 2013 Search PubMed.
- Y. Schmiedel and S. Zimmerli, Swiss Med. Wkly., 2016, 146, w14281 Search PubMed.
- F. Bongomin, S. Gago, R. O. Oladele and D. W. Denning, J. Fungi, 2017, 3, 57 CrossRef PubMed.
- M. Abd Elkodous, G. S. El-Sayyad, I. Y. Abdelrahman, H. S. El-Bastawisy, F. M. Mosallam, H. A. Nasser, M. Gobara, A. Baraka, M. A. Elsayed and A. I. El-Batal, Colloids Surf., B, 2019, 180, 411–428 CrossRef CAS PubMed.
- R. S. Hendriksen, P. Munk, P. Njage, B. Van Bunnik, L. McNally, O. Lukjancenko, T. Röder, D. Nieuwenhuijse, S. K. Pedersen and J. Kjeldgaard, Nat. Commun., 2019, 10, 1–12 CrossRef CAS PubMed.
- F. Prestinaci, P. Pezzotti and A. Pantosti, Pathog. Global Health, 2015, 109, 309–318 CrossRef PubMed.
- C. Chen, Z. Gan, K. Zhou, Z. Ma, Y. Liu and Y. Gao, Electrochim. Acta, 2018, 283, 1649–1659 CrossRef CAS.
- Y. Liu, N. Song, Z. Ma, K. Zhou, Z. Gan, Y. Gao, S. Tang and C. Chen, Mater. Chem. Phys., 2019, 223, 548–556 CrossRef CAS.
- S. Liu, T. H. Zeng, M. Hofmann, E. Burcombe, J. Wei, R. Jiang, J. Kong and Y. Chen, ACS Nano, 2011, 5, 6971–6980 CrossRef CAS PubMed.
- W. Gao, Graphene Oxide, 2015, 61–95 CAS.
- D. F. Báez, H. Pardo, I. Laborda, J. F. Marco, C. Yáñez and S. Bollo, Nanomaterials, 2017, 7, 168 CrossRef PubMed.
- M. Navya Rani, S. Ananda and D. Rangappa, Mater. Today, 2017, 4, 12300–12305 Search PubMed.
- R. Mann, D. Mitsidis, Z. Xie, O. McNeilly, Y. H. Ng, R. Amal and C. Gunawan, J. Nanomater., 2021, 2021, 9941577 Search PubMed.
- A. B. Alayande, M. Obaid and I. S. Kim, Mater. Sci. Eng., C, 2020, 109, 110596 CrossRef CAS PubMed.
- W. F. Khalil, G. S. El-Sayyad, W. M. A. El Rouby, M. A. Sadek, A. A. Farghali and A. I. El-Batal, Int. J. Biol. Macromol., 2020, 164, 1370–1383 CrossRef CAS PubMed.
- M. S. Attia, G. S. El-Sayyad, M. Abd Elkodous, W. F. Khalil, M. M. Nofel, A. M. Abdelaziz, A. A. Farghali, A. I. El-Batal and W. M. A. El Rouby, Int. J. Biol. Macromol., 2021, 179, 333–344 CrossRef CAS PubMed.
- M. A. Elbahnasawy, A. M. Shehabeldine, A. M. Khattab, B. H. Amin and A. H. Hashem, J. Drug Delivery Sci. Technol., 2021, 102401 CrossRef CAS.
- I. X. Yin, J. Zhang, I. S. Zhao, M. L. Mei, Q. Li and C. H. Chu, Int. J. Nanomed., 2020, 15, 2555–2562 CrossRef CAS PubMed.
- A. I. El-Batal, M. Abd Elkodous, G. S. El-Sayyad, N. E. Al-Hazmi, M. Gobara and A. Baraka, Int. J. Biol. Macromol., 2020, 165, 169–186 CrossRef CAS PubMed.
- S. Gharpure and B. Ankamwar, J. Nanosci. Nanotechnol., 2020, 20, 5977–5996 CrossRef CAS PubMed.
- D. Jain, A. A. B. Shivani, H. Singh, H. K. Daima, M. Singh, S. R. Mohanty, B. J. Stephen and A. Singh, Front. Chem., 2020, 8, 1–11 CrossRef PubMed.
- M. Abd Elkodous, G. S. El-Sayyad, M. I. A. Abdel Maksoud, I. Y. Abdelrahman, F. M. Mosallam, M. Gobara and A. I. El-Batal, Biol. Trace Elem. Res., 2020, 196, 297–317 CrossRef CAS PubMed.
- Z. Sabouri, A. Akbari, H. A. Hosseini, M. Khatami and M. Darroudi, Green Chem. Lett. Rev., 2021, 14, 402–412 Search PubMed.
- S. Uddin, L. B. Safdar and J. Iqbal, Microsc. Res. Tech., 2021, 1–13 Search PubMed.
- A. I. El-Batal, M. S. Attia, M. M. Nofel and G. S. El-Sayyad, J. Cluster Sci., 2019, 30, 687–705 CrossRef CAS.
- P. P. A. Jose, M. S. Kala, A. V. Joseph, N. Kalarikkal and S. Thomas, Appl. Phys. A: Mater. Sci. Process., 2019, 126, 58 CrossRef.
- K. Prasad, G. S. Lekshmi, K. Ostrikov, V. Lussini, J. Blinco, M. Mohandas, K. Vasilev, S. Bottle, K. Bazaka and K. Ostrikov, Sci. Rep., 2017, 7, 1591 CrossRef PubMed.
- Y.-H. Hsueh, C.-T. Hsieh, S.-T. Chiu, P.-H. Tsai, C.-Y. Liu and W.-J. Ke, Int. J. Mol. Sci., 2019, 20, 5394 CrossRef CAS PubMed.
- R. S. Rajaura, V. Sharma, R. S. Ronin, D. K. Gupta, S. Srivastava, K. Agrawal and Y. Vijay, Mater. Res. Express, 2017, 4, 025401 CrossRef.
- A. A. Nada, H. R. Tantawy, M. A. Elsayed, M. Bechelany and M. E. Elmowafy, Solid State Sci., 2018, 78, 116–125 CrossRef CAS.
- S. Elbasuney, G. S. El-Sayyad, A. A. Elmotaz, M. Sadek and H. Tantawy, J. Mater. Sci.: Mater. Electron., 2020, 31, 11520–11526 CrossRef CAS.
- S. Elbasuney, A. A. Elmotaz, M. Sadek, H. Tantawy, M. Yehia and G. S. El-Sayyad, J. Energ. Mater., 2021, 39, 100–112 CrossRef CAS.
- L. Shahriary and A. A. Athawale, Int. J. Renew. Energy Environ. Eng., 2014, 2, 58–63 Search PubMed.
- N. I. Zaaba, K. L. Foo, U. Hashim, S. J. Tan, W.-W. Liu and C. H. Voon, Procedia Eng., 2017, 184, 469–477 CrossRef CAS.
- R. Muzyka, M. Kwoka, Ł. Smędowski, N. Díez and G. Gryglewicz, New Carbon Materials, 2017, 32, 15–20 CrossRef CAS.
- J. Zhang, H. Yang, G. Shen, P. Cheng, J. Zhang and S. Guo, Chem. Commun., 2010, 46, 1112–1114 RSC.
- K. K. H. De Silva, H.-H. Huang and M. Yoshimura, Appl. Surf. Sci., 2018, 447, 338–346 CrossRef CAS.
- M. Zong, Y. Huang, Y. Zhao, L. Wang, P. Liu, Y. Wang and Q. Wang, Mater. Lett., 2013, 106, 22–25 CrossRef CAS.
- A. H. Hashem, A. M. A. Khalil, A. M. Reyad and S. S. Salem, Biol. Trace Elem. Res., 2021, 1–11 Search PubMed.
- G. D. Christensen, W. A. Simpson, A. L. Bisno and E. H. Beachey, Infect. Immun., 1982, 37, 318–326 CrossRef CAS PubMed.
- N. Narisawa, S. Furukawa, H. Ogihara and M. Yamasaki, J. Biosci. Bioeng., 2005, 99, 78–80 CrossRef CAS PubMed.
- A. I. El-Batal, G. S. El-Sayyad, N. E. Al-Hazmi and M. Gobara, J. Cluster Sci., 2019, 30, 947–964 CrossRef CAS.
- M. A. Ansari, H. M. Khan, A. A. Khan, S. S. Cameotra and R. Pal, Appl. Nanosci., 2014, 4, 859–868 CrossRef CAS.
- K. F. El-Nemr, H. R. Mohamed, M. A. Ali, R. M. Fathy and A. S. Dhmees, Int. J. Environ. Anal. Chem., 2020, 100, 1578–1602 CrossRef CAS.
- A. N. El-Shazly, G. S. El-Sayyad, A. H. Hegazy, M. A. Hamza, R. M. Fathy, E. El Shenawy and N. K. Allam, Sci. Rep., 2021, 11, 1–14 CrossRef PubMed.
- A. M. El-Khawaga, A. A. Farrag, M. A. Elsayed, G. S. El-Sayyad and A. I. El-Batal, J. Cluster Sci., 2020, 1–13 Search PubMed.
- S. Abdolhosseinzadeh, H. Asgharzadeh and H. S. Kim, Sci. Rep., 2015, 5, 10160 CrossRef CAS PubMed.
- A. Shalaby, D. Nihtianova, P. Markov, A. Staneva, R. Iordanova and Y. Dimitriev, Bulg. Chem. Commun., 2015, 47, 291–295 Search PubMed.
- D. C. Marcano, D. V. Kosynkin, J. M. Berlin, A. Sinitskii, Z. Sun, A. Slesarev, L. B. Alemany, W. Lu and J. M. Tour, ACS Nano, 2010, 4, 4806–4814 CrossRef CAS PubMed.
- Z. Ni, Y. Wang, T. Yu and Z. Shen, Nano Res., 2008, 1, 273–291 CrossRef CAS.
- M. Sarno, A. Senatore, C. Cirillo, V. Petrone and P. Ciambelli, J. Nanosci. Nanotechnol., 2014, 14, 4960–4968 CrossRef CAS PubMed.
- J. H. Warner, F. Schaffel, M. Rummeli and A. Bachmatiuk, Graphene: fundamentals and emergent applications, Newnes, 2012 Search PubMed.
- H. Zhang and P. X. Feng, Carbon, 2010, 48, 359–364 CrossRef CAS.
- M. A. Maksoud, G. S. El-Sayyad, A. Ashour, A. I. El-Batal, M. S. Abd-Elmonem, H. A. Hendawy, E. Abdel-Khalek, S. Labib, E. Abdeltwab and M. El-Okr, Mater. Sci. Eng., C, 2018, 92, 644–656 CrossRef PubMed.
- M. A. Maksoud, A. El-ghandour, G. S. El-Sayyad, A. Awed, R. A. Fahim, M. Atta, A. Ashour, A. I. El-Batal, M. Gobara and E. Abdel-Khalek, J. Mater. Sci.: Mater. Electron., 2019, 1–12 Search PubMed.
- R. J. Gohari, E. Halakoo, N. Nazri, W. Lau, T. Matsuura and A. Ismail, Desalination, 2014, 335, 87–95 CrossRef.
- T. Wang, J. Chang, C. Wu, Y. Fu and Y. Chen, Biomass Bioenergy, 2005, 28, 508–514 CrossRef CAS.
- Z. H. Dhoondia and H. Chakraborty, Nanomater. Nanotechnol., 2012, 2, 15 CrossRef.
- M. Shatnawi, A. Alsmadi, I. Bsoul, B. Salameh, M. Mathai, G. Alnawashi, G. M. Alzoubi, F. Al-Dweri and M. Bawa’aneh, Results Phys., 2016, 6, 1064–1071 CrossRef.
- M. Rashad, A. Darwish, S. I. Qashou and K. Abd El-Rahman, Appl. Phys. A: Mater. Sci. Process., 2020, 126, 1–9 CrossRef.
- A. Rita, A. Sivakumar, S. S. J. Dhas and S. M. B. Dhas, J. Nanostruct. Chem., 2020, 10, 309–316 CrossRef.
- S. A. Ayon, M. M. Billah, S. S. Nishat and A. Kabir, J. Alloys Compd., 2021, 856, 158217 CrossRef CAS.
- H. Mohammed, A. Kumar, E. Bekyarova, Y. Al-Hadeethi, X. Zhang, M. Chen, M. S. Ansari, A. Cochis and L. Rimondini, Front. Bioeng. Biotechnol., 2020, 8, 465 CrossRef PubMed.
- R. P. Gandhiraman, D. Nordlund, C. Javier, J. E. Koehne, B. Chen and M. Meyyappan, J. Phys. Chem. C, 2014, 118, 18706–18712 CrossRef CAS PubMed.
- M. Aleksandrzak, W. Kukulka and E. Mijowska, Appl. Surf. Sci., 2017, 398, 56–62 CrossRef CAS.
- S. Elbasuney, G. S. El-Sayyad, M. Yehia and S. K. A. Aal, J. Mater. Sci.: Mater. Electron., 2020, 31, 20805–20815 CrossRef CAS.
- K. Pal, A. Si, G. S. El-Sayyad, M. A. Elkodous, R. Kumar, A. I. El-Batal, S. Kralj and S. Thomas, Crit. Rev. Solid State Mater. Sci., 2020, 1–65 Search PubMed.
- A. Baraka, S. Dickson, M. Gobara, G. S. El-Sayyad, M. Zorainy, M. I. Awaad, H. Hatem, M. M. Kotb and A. Tawfic, Chem. Pap., 2017, 71, 2271–2281 CrossRef CAS.
- F. M. Mosallam, G. S. El-Sayyad, R. M. Fathy and A. I. El-Batal, Microb. Pathog., 2018, 122, 108–116 CrossRef CAS PubMed.
- M. A. Elkodous, G. S. El-Sayyad, A. E. Mohamed, K. Pal, N. Asthana, F. G. de Souza Junior, F. M. Mosallam, M. Gobara and A. I. El-Batal, J. Mater. Sci.: Mater. Electron., 2019, 30(9), 8312–8328 CrossRef CAS.
- M. Abu-Elghait, M. Hasanin, A. H. Hashem and S. S. Salem, Int. J. Biol. Macromol., 2021, 175, 294–303 CrossRef CAS PubMed.
- G. S. El-Sayyad, M. Abd Elkodous, A. M. El-Khawaga, M. A. Elsayed, A. I. El-Batal and M. Gobara, RSC Adv., 2020, 10, 5241–5259 RSC.
- W. Hu, C. Peng, W. Luo, M. Lv, X. Li, D. Li, Q. Huang and C. Fan, ACS Nano, 2010, 4, 4317–4323 CrossRef CAS PubMed.
- V. T. Pham, V. K. Truong, M. D. Quinn, S. M. Notley, Y. Guo, V. A. Baulin, M. Al Kobaisi, R. J. Crawford and E. P. Ivanova, ACS Nano, 2015, 9, 8458–8467 CrossRef CAS PubMed.
- L. Zhong and K. Yun, Int. J. Nanomed., 2015, 10, 79 CAS.
- S. Sadhukhan, A. Bhattacharyya, D. Rana, T. K. Ghosh, J. T. Orasugh, S. Khatua, K. Acharya and D. Chattopadhyay, Mater. Chem. Phys., 2020, 247, 122906 CrossRef CAS.
- P. Rajapaksha, S. Cheeseman, S. Hombsch, B. J. Murdoch, S. Gangadoo, E. W. Blanch, Y. Truong, D. Cozzolino, C. F. McConville, R. J. Crawford, V. K. Truong, A. Elbourne and J. Chapman, ACS Appl. Bio Mater., 2019, 2, 5687–5696 CrossRef CAS.
- A. I. El-Batal, H. G. Nada, R. R. El-Behery, M. Gobara and G. S. El-Sayyad, RSC Adv., 2020, 10, 9274–9289 RSC.
- A. F. de Faria, D. S. T. Martinez, S. M. M. Meira, A. C. M. de Moraes, A. Brandelli, A. G. Souza Filho and O. L. Alves, Colloids Surf., B, 2014, 113, 115–124 CrossRef PubMed.
- F. Martinez-Gutierrez, L. Boegli, A. Agostinho, E. M. Sánchez, H. Bach, F. Ruiz and G. James, Biofouling, 2013, 29, 651–660 CrossRef CAS PubMed.
- P. P. Mahamuni, P. M. Patil, M. J. Dhanavade, M. V. Badiger, P. G. Shadija, A. C. Lokhande and R. A. Bohara, Biochem. Biophys. Rep., 2019, 17, 71–80 Search PubMed.
- A. I. El-Batal, F. M. Mosallam and G. S. El-Sayyad, J. Cluster Sci., 2018, 29, 1003–1015 CrossRef CAS.
- M. A. Maksoud, G. S. El-Sayyad, A. M. El-Khawaga, M. Abd Elkodous, A. Abokhadra, M. A. Elsayed, M. Gobara, L. Soliman, H. El-Bahnasawy and A. Ashour, J. Hazard. Mater., 2020, 399, 123000 CrossRef PubMed.
- A. H. Ashour, A. I. El-Batal, M. I. A. A. Maksoud, G. S. El-Sayyad, S. Labib, E. Abdeltwab and M. M. El-Okr, Particuology, 2018, 40, 141–151 CrossRef CAS.
| This journal is © The Royal Society of Chemistry 2021 |

