 Open Access Article
Development of a gold-nanorod-based lateral flow immunoassay for a fast and dual-modal detection of C-reactive protein in clinical plasma samples†
Renzhu Panga,
Qunyan Zhu*b,
Jia Weia,
Yaoqi Wanga,
Fengqin Xubc,
Xianying Meng*a and
Zhenxin Wang *bc
*bc
aDepartment of Thyroid Surgery, The First Hospital of Jilin University, Changchun, 130021, P. R. China. E-mail: mengxiany@mail.jlu.edu.cn
bState Key Laboratory of Electroanalytical Chemistry, Changchun Institute of Applied Chemistry, Chinese Academy of Sciences, Changchun, 130022, P. R. China. E-mail: wangzx@ciac.ac.cn; zhuqy@ciac.ac.cn
cSchool of Applied Chemical Engineering, University of Science and Technology of China, Road Baohe District, Hefei, 230026, P. R. China
First published on 23rd August 2021
Abstract
Fast and simple detection of C-reactive protein (CRP) is highly significant for the diagnosis and prognosis of inflammatory or infectious diseases. Lateral flow immunoassay has the advantages of rapid detection, simple operation and low cost, but it is usually limited by the quantitative ability and speed of data extraction. Herein, a gold-nanorod-based lateral flow immunoassay was developed to rapidly detect CRP by simultaneously monitoring the colorimetric and temperature signals. In this method, anti-CRP antibody-modified gold nanorods (GNRs) were designed as colorimetric and photothermal conversion probes. A mouse anti-CRP monoclonal antibody and goat anti-mouse IgG were used as test and control lines, respectively. Then, a lateral flow immunochromatographic strip was constructed by a sandwich-type method for detecting CRP by introducing antibody-modified GNRs, and this procedure needed less than 15 min. Finally, the detection signals can be directly observed by eyes and directly read using a thermal imager. The as-synthesized GNR showed high photothermal conversion efficiency (η = 39%) and strong localized surface plasmon resonance (LSPR) absorption. For CRP detection, the proposed immunochromatographic strip exhibited good specificity, high sensitivity, good linearity within the range of 50–10![[thin space (1/6-em)]](https://www.rsc.org/images/entities/char_2009.gif) 000 ng mL−1 and a low limit of detection (LOD, 1.3 ng mL−1). This method was successfully applied for CRP detection in clinical plasma samples, and it correlated very well with the diagnostic kit of immunoturbidimetry (r = 0.96). The results indicated that the developed GNR-based immunochromatographic strip has immense potential for use as a rapid and cost-effective in vitro diagnostic kit.
000 ng mL−1 and a low limit of detection (LOD, 1.3 ng mL−1). This method was successfully applied for CRP detection in clinical plasma samples, and it correlated very well with the diagnostic kit of immunoturbidimetry (r = 0.96). The results indicated that the developed GNR-based immunochromatographic strip has immense potential for use as a rapid and cost-effective in vitro diagnostic kit.
1 Introduction
Inflammatory and infectious diseases are serious causes that pose a threat to human health. C-reactive protein (CRP), which is well known as an acute-phase biomarker, is a pentamer formed by five identical subunits through non-covalent bonds and mainly synthesized by the liver.1,2 CRP is often used for early diagnosis of inflammatory and infectious diseases, as many of these diseases are mainly caused by the increasing CRP level in blood.3–6 Generally, the normal concentration of CRP in blood is below 5 μg mL−1, and it could increase to 10–40 μg mL−1 during mild inflammation or viral infection in patients.7 Recently, many researchers reported that higher values of high-sensitivity CRP (hs-CRP, 0.1–3.0 μg mL−1) are highly related to cardiovascular diseases.5,8 Therefore, sensitive monitoring of the concentration of CRP in human blood is of high clinical value. Currently, routine CRP checks in clinical analyses are mainly performed by chemiluminescence, immunoturbidimetry and enzyme-linked immunoassay (ELISA).9–13 Unfortunately, all of these methods require expensive instruments, which greatly limit their popularizing in resource-poor regions; in addition, their operation processes are complicated, time-consuming and need highly trained personnel, which make them not suitable for postoperative monitoring and point-of-care testing (POCT).14 Therefore, it is necessary to establish an analytical technique for fast, simple, specific, and accurate quantification and user-friendly detection of CRP in clinical diagnosis.The lateral flow immunoassay (LFIA) is a immunochromatography technology, which is based on specific conjugation of antigen–antibody and chromatography.4,15,16 After dropping the sample solution, the labeled probes will rapidly and specifically conjugate with the target protein, and then, they are captured by antibodies on the test line (T line) and the unconjugated probes are captured by secondary antibodies on the control line (C line) under capillary action.17 Paper-based lateral flow immunochromatographic strips with the advantages of rapid detection, simple operation and low cost have been widely used for POCT in food, environmental and clinical fields.18–21 Colloidal gold nanoparticles (GNPs), with diameters between 20 and 60 nm, have a maximum absorption peak at around 525 nm, which turns GNPs red in color and the colorimetric signal can be read by naked eyes.22 In addition, proteins can easily combine with GNPs via hydrophobic and electrostatic interactions or covalent bonds. Due to the advantages of visibility, high stability and large surface area for conjugating biomolecules, GNPs have been widely used for LFIA.23–25 However, GNP-based LFIA often suffers from the limitations of detection sensitivity and quantitative ability. To solve these problems, several other nanomaterials including gold nanorods (GNRs), quantum dots and up-conversion nanoparticles have been used as labeled probes in LFIA to obtain the fluorescence or Raman signals, respectively.4,7,22,26 However, the speed of data extraction is still an issue. Among these nanomaterials, GNRs demonstrate unique optical properties, good stability, excellent biocompatibility and higher extinction coefficient than spherical GNPs. As GNRs have anisotropic shapes, they exhibit two absorption peaks of localized surface plasmon resonance (LSPR), which are generated by electron oscillations along the horizontal and longitudinal axes of the GNR, respectively.27 The longitudinal absorption peak can be adjusted to the visible and near-infrared region by controlling the aspect ratio of GNRs, which makes it more sensitive to the changes in dielectric properties in the surrounding environment. Furthermore, GNRs can provide excellent photothermal properties, making it possible to simultaneously obtain colorimetric and temperature signals.28 Compared with the fluorescence or Raman signals, the monitoring of the temperature signal is more fast, intuitive and cost-effective for LFIA. Therefore, using GNRs as labeled probes in LFIA, colorimetric and temperature analyses can be concurrently conducted. It enables us to directly observe and read the detection signals and shows great potential for achieving POCT.
In this work, a dual-modal LFIA method based on GNRs and papers was proposed for highly rapid and quantitative detection of CRP in plasma. Given the advantages of strong LSPR absorption and excellent photothermal properties, a GNR was designed as a label probe in LFIA, and therefore, the CRP concentration can be measured by simultaneously monitoring the colorimetric and temperature signals. The colorimetric signal is suitable for on-site qualitative analysis under lack of equipment, while the temperature signal can be used for quantitative analysis with simple equipment. The fabricated immunochromatographic strip exhibited the advantages of timesaving, cost-effective, and user-friendly nature with high accuracy. In addition, it can be used for the sensitive and quantitative detection of CRP in plasma and clinical plasma samples. Therefore, the proposed dual-modal test strip could be a promising tool for POCT applications.
2. Materials and methods
2.1. Materials and reagents
Hexadecyltrimethylammonium bromide (CTAB), bovine serum albumin (BSA), 2-(N-morpholine)ethanesulfonic acid (MES), Tween 20 (T-20) and sucrose were purchased from Dingguo Changsheng Biotechnology Co, Ltd (Beijing, China). HAuCl4·3H2O, sodium polyacrylate (PAA), N-hydroxysuccinimide (NHS), 1-ethyl-3-(3-dimethylaminopropyl)carbodiimide hydrochloride (EDC), tris(hydroxymethyl)methyl aminomethane (Tris), polyvinyl pyrrolidone (PVP, MW = 8000), and trehalose were purchased from Aladdin Bio-Chem Technology Co. Ltd (Shanghai, China). NaBH4, AgNO3 and ascorbic acid (AA) were purchased from Beijing Chemical Works. The human CRP antigen (11250-HNAH) was obtained from Sino Biological Inc. (Beijing, China). Mouse anti-human CRP monoclonal antibody (MC15, dAb) and mouse anti-human CRP monoclonal antibody (MC18, cAb) were purchased from Kitten Biotechnology Co, Ltd (Hangzhou, China), goat anti-mouse secondary antibody (L1I00501, 2ndAb), prostate specific antigen (PSA), interleukin-2 (IL-2) and carcinoembryonic antigen (CEA) were purchased from Linc-Bio Science Co. Ltd (Shanghai, China), and fetal bovine serum (FBS) was obtained from Zhejiang Tianhang Biotechnology Co, Ltd. The healthy and clinical human plasma samples were provided by the First Hospital of Jilin University. Deionized water (18.2 MΩ cm at 20 °C) was obtained using a Millipore system (Marlborough, USA). All the reagents were of analytic grade. The sample pad (CFSP001700), conjugate pad (GFDX203000), nitrocellulose (NC) membrane, absorbent pad (CFSP223000) and PVC backing card (HF000MC100) were purchased from Millipore of USA. This study was conducted according to the guidelines of the Declaration of Helsinki, and approved by the Ethics Committee of the First Hospital of Jilin University (protocol code 2020-665).2.2. Instruments
The high-speed refrigerated centrifuge (5415R, Eppendorf Company, Germany), transmission electron microscope (TEM) (H-600, Hitachi Corporation, Japan), UV-vis spectrophotometer (UVmini-1240, Shimadzu Corporation, Japan), vacuum oven (SG-ZKX250, Shanghai Daheng Optics and Precision Machinery Co, Ltd, China), 650 nm laser (Ningbo Yuanming Laser Technology Co, Ltd, China) and thermal imager (Fluke, USA) were used in this study. The rolling manual paper cutter (GD300), microcomputer cutting machine (ZQ2002) and three-dimensional scribing instrument (HM3030) were obtained from Kinbio Tech Co, Ltd (Shanghai, China).2.3. Synthesis of GNR
The seed growth method was used for the synthesis of GNRs.29 More specifically, 0.6 mL of NaBH4 (0.01 mol L−1) solution at 0 °C was rapidly added to the mixed solution with 5 mL of HAuCl4 (0.5 mmol L−1) and 5 mL of CTAB (0.2 mol L−1). The seed solution was obtained after the solution was vigorously stirred for 2 min and then allowed to stand at 25 °C for 2 h. Subsequently, 3 mL of AgNO3 (4 mmol L−1) was added to the mixed solution with 50 mL of HAuCl4 (1 mmol L−1) and 50 mL of CTAB (0.2 mol L−1) at room temperature. After mixing thoroughly, 0.7 mL of AA (0.1 mol L) was added. Then, 0.24 mL of seed solution was added to the mixed solution and allowed to standing at 30 °C for 24 h. Finally, the solution was centrifuged (13![[thin space (1/6-em)]](https://www.rsc.org/images/entities/char_2009.gif) 000 rpm, 25 °C, 5 min) and washed 3 times with water, and then the precipitation was dispersed into water to obtain the GNR solution.
000 rpm, 25 °C, 5 min) and washed 3 times with water, and then the precipitation was dispersed into water to obtain the GNR solution.
2.4. Synthesis of antibody-modified GNRs (GNR-dAb)
The GNR-dAb was prepared based on the reported method.30 Specifically, PAA was coated onto the surface of the GNR by mixing 1 mL of the GNR solution with 100 μL of 1% PAA and stirring for 2 h at room temperature. The solution was centrifuged at a speed of 9000 rpm at 25 °C for 5 min and dispersed in 1 mL of the MES buffer solution (10 mmol L−1, pH = 7.0), and then, 10 μL of EDC (100 mmol L−1) and 10 μL of NHS (100 mmol L−1) were added. After stirring for 30 min, 10 μg of dAb was added and the reaction was continued for 3 h. Finally, 10 μL of BSA (10 mg mL−1) was added to block for 30 min. After that, the reaction solution was centrifuged 3 times at a speed of 8000 rpm at 25 °C for 5 min, and then redispersed in Tris–HCl (20 mmol L−1, pH = 8.0, containing 1% BSA, 20% sucrose and 5% trehalose) to obtain the GNR-dAb solution.2.5. Processes of fabrication of lateral flow immunochromatographic strips and dual-modal detection of CRP
The preparation process of lateral flow immunochromatographic strips is shown in Scheme 1. First, an NC membrane was pasted onto the corresponding area of the PVC backing card, and then, the scribing instrument was used for spraying cAb and 2ndAb onto the NC membrane at 1 μL cm−1 as the test line (T line) and control line (C line), respectively. After drying at 37 °C, the conjugate pad, sample pad and absorbent pad were successively assembled on the corresponding area. Before use, the sample pad was completely immersed in a Tris–HCl solution (20 mmol L−1, pH = 8.0, containing 0.1% T-20 and 0.5% PVP) and then dried at 37 °C for 2 h. Finally, the assembled PVC backing card was cut into test strips with a width of 3 mm using a cutting machine and stored at 4 °C.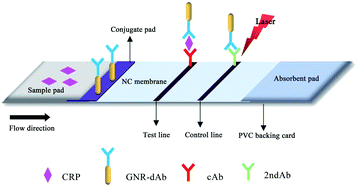 | ||
| Scheme 1 Schematic of the fabrication of the GNR-based dual-modal lateral flow immunochromatographic strip. | ||
Before detecting CRP, 4 μL of GNR-dAb solution was added onto the conjugate pad and then the sample was dropped onto the sample pad, and the reaction was completed within 15 minutes. After the reaction was complete, the colorimetric signals of C and T lines were obtained from the pictures of test strips, and their temperature signals were obtained under the irradiation of a 650 nm laser (0.084 W) for 45 s, respectively. The colorimetric signal values were collected using ImageJ, and the temperature values can be read directly using a thermal imager. The same samples were tested 3 times to calculate the averages and standard deviations.
2.6. Cross-reaction (CR) study
In this study, the specificity of the developed test strip was expressed as CR. It was determined by assessing the recognition of CEA, PSA and IL-2. CR (%) = (valueT/C of analogues/valueT/C of CRP) × 100%.312.7. Analysis of CRP in plasma samples
For establishing the calibration equation, the standard CRP antigens were added into the plasma obtained from a healthy human to obtain a series of concentrations (0, 50, 100, 200, 500, 1000, 2000, 5000, 10![[thin space (1/6-em)]](https://www.rsc.org/images/entities/char_2009.gif) 000, and 20
000, and 20![[thin space (1/6-em)]](https://www.rsc.org/images/entities/char_2009.gif) 000 ng mL−1). For sample analysis, 2 μL of the sample was directly added onto the sample pad, and then, 60 μL of the PBS solution (0.01 mol L−1, pH = 7.4) was dropped for immunochromatography. The limit of detection (LOD) was calculated as LOD = 3 × (S/T), where S refers to the standard deviation of blank controls and T refers to the slope of the fitting curve.
000 ng mL−1). For sample analysis, 2 μL of the sample was directly added onto the sample pad, and then, 60 μL of the PBS solution (0.01 mol L−1, pH = 7.4) was dropped for immunochromatography. The limit of detection (LOD) was calculated as LOD = 3 × (S/T), where S refers to the standard deviation of blank controls and T refers to the slope of the fitting curve.
2.8. Analysis of clinical plasma samples
To evaluate the applicability of the proposed dual-modal immunochromatographic strip, a total of 34 human clinical plasma samples of thyroid patients were detected. For analysis of CRP in clinical plasma samples, 2 μL of the samples were directly added onto the sample pad, and then, 60 μL of the PBS solution (0.01 mol L−1, pH = 7.4) was dropped for immunochromatography. All of the clinical samples were first detected using a diagnostic kit of immunoturbidimetry.3. Results and discussion
3.1. Characterization of GNR and GNR-dAb
The GNR was synthesized by the seed growth method,29 and the GNR-dAb was prepared by modifying an anti-CRP antibody on the surface of the GNR. The TEM images and absorption spectra of GNR before and after modification of the antibody are shown in Fig. 1a–c. The average length of the GNR was 44.2 ± 2.3 nm, and the length-diameter ratio (the aspect ratio) was 2.49 ± 0.29. After antibody modification, the morphology and length-diameter ratio of GNR show a negligible change. As shown in Fig. 1c, the maximum LSPR band of the GNR changed from 659 nm to 664 nm, which was caused by the change in the dielectric properties after modification of the surface of the GNR. As the exposed groups in the electrical double layer of GNR and GNR-dAb surfaces were different, the zeta potential of the GNR was changed from 25.4 mV to 0.8 mV after the antibody modification, as shown in Fig. 1d. The results indicated that the GNR-dAb was successfully synthesized.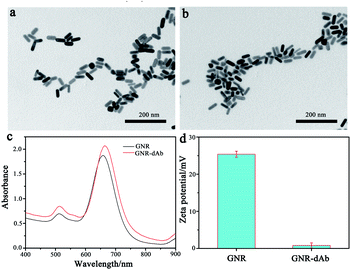 | ||
| Fig. 1 TEM images of (a) GNR and (b) GNR-dAb. (c) Absorption spectra and (d) zeta potentials of the GNR and GNR-dAb, respectively. | ||
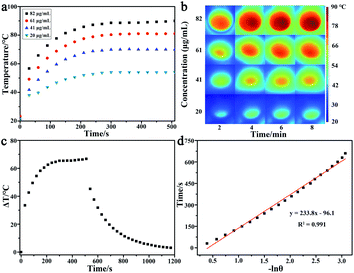
To evaluate the photothermal conversion capability of the GNR, GNR solutions with different concentrations were irradiated using a 650 nm laser for 510 s, because the GNR has strong LSPR absorption around 659 nm. As shown in Fig. 2a and b, the temperatures of GNR solutions were increased with the increase in concentration and irradiation time, and the temperature was increased by 66.8 °C at a concentration of 82 μg mL−1. The temperature of pure water only increased 1.6 °C under the same condition of irradiation. Fig. 2c shows that the temperature of the GNR solution can gradually drop down to room temperature after turning off the laser, and the calibration curve of time versus −ln![[thin space (1/6-em)]](https://www.rsc.org/images/entities/char_2009.gif) θ during the cooling period is shown in Fig. 2d. The photothermal conversion efficiency of GNR was calculated to be 39% according a method reported previously,32 which indicate that the synthesized GNR has great potential for use as a photothermal conversion probe.
θ during the cooling period is shown in Fig. 2d. The photothermal conversion efficiency of GNR was calculated to be 39% according a method reported previously,32 which indicate that the synthesized GNR has great potential for use as a photothermal conversion probe.
3.2. Optimization of the amount of GNR-dAb and sample volume
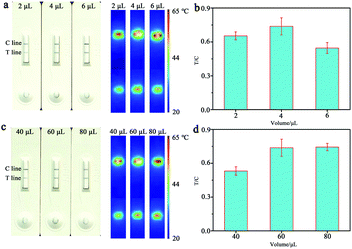
By the LFIA method, the amount of the labeling probe and the volume of the sample are the key factors that could influence the final performance and sensitivity of CRP analysis. Herein, 2 μL, 4 μL and 6 μL of GNR-dAb was added on the conjugate pad, and 60 μL of 1 μg mL−1 CRP was dropped onto the sample pad for detection. The results are shown in Fig. 3a and b, and the signal values of the T line and C line gradually increase with the increase in the amounts of GNR-dAb conjugates, and the maximum value of T/C (the signal ratio of T line to C line) was obtained at 4 μL of GNR-dAb. In addition, the effect of the aspect ratio of the GNR on detection performance was studied (as shown in Fig. S1†). Although the GNR with a large aspect ratio has high photothermal conversion efficiency, the background signal increased by increasing the aspect ratio of the GNR, resulting in a poor T/C value. Therefore, the GNR with an aspect ratio of 2.49 was used in our experiment.For optimizing the sample volume, 40 μL, 60 μL and 80 μL of CRP solutions were dropped onto the sample pad, and the results are shown in Fig. 3c and d. When 40 μL of the sample solution was added, weaker signals were obtained on the T line and C line due to the incomplete release of conjugate. When 60 μL and 80 μL of the sample solution were added, the conjugate was well released and smoothly migrated to the absorbent pad, and the stronger signals were obtained on the T line and C line. Consequently, the 60 μL of sample solution was used in this study considering sample consumption.
3.3. Cross-reaction (CR) study
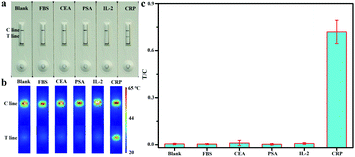
To evaluate the specificity of the immunochromatographic strip, CEA, PSA and IL-2 were utilized for the CR study, and the PBS solution was used as the blank control. As shown in Fig. 4a and b, the test strip showed obvious T line and C line for detecting CRP, while only C line could be observed on the test strips for the detection of other proteins, and the CR values are <2%. The results indicated that the fabricated immunochromatographic strip has insignificant CR with other proteins and has good specificity for CRP detection. In addition, the anti-interference property of the constructed strip was investigated by detecting FBS. It showed that the T line cannot be observed and the CR was 0.6%, which indicated that the components in FBS have no effect on the results of detection. The binding affinity of GNR-dAb was examined by a competitive experiment of the free detection antibody (dAb) with GNR-dAb on the detection of 1 μg mL−1 CRP. The half maximal inhibitory concentration (IC50) value of dAb is 30 μg mL−1 (as shown in the Fig. S2†), indicating that GNR-dAb has high binding affinity. All of the above-mentioned results indicated that the proposed immunochromatographic strip can be used as a powerful tool for detecting CRP.3.4. Dual-modal lateral flow immunochromatographic strips for analysis of CRP
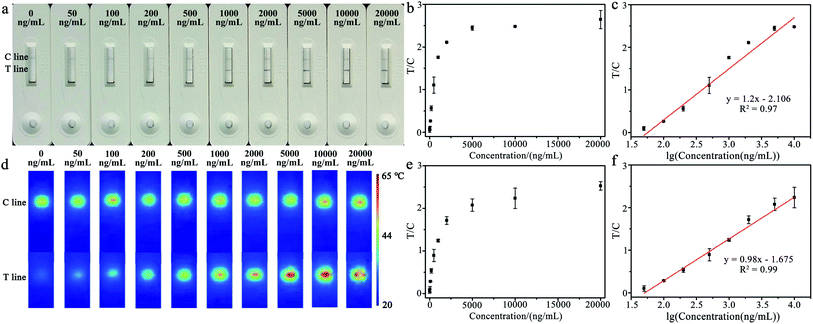
The different concentrations of CRP in plasma were measured for exploring the analytical performances of the constructed immunochromatographic strip. Under optimized conditions, 2 μL of sample solution was directly added onto the sample pad, and then 60 μL of the PBS solution was dropped for detection; the colorimetric and temperature signals were collected after the reaction was completed. As shown in Fig. 5a, the color of the T line gradually darkens with the increase in CRP concentration, and the T/C values of the colorimetric signal also increased with the increase in concentration (as shown in Fig. 5b). In Fig. 5c, it can be seen that there was a good linearity relationship between the T/C value of the colorimetric signal and the logarithm of the CRP concentration in the range of 50–10![[thin space (1/6-em)]](https://www.rsc.org/images/entities/char_2009.gif) 000 ng mL−1. The correlation equation is y = 1.2x −2.106 (R2 = 0.97), and the calculated LOD is 1.3 ng mL−1. The temperature signals were also collected using a thermal imager, and the corresponding photothermal images of CRP with different concentrations are shown in Fig. 5d. Under the irradiation of 650 nm laser, the temperature signal of the T line gradually rises with the increase in CRP concentration. With the increase in CRP concentration, the T/C values of the temperature signal exhibit the same increasing trend as the colorimetric signal (as shown in Fig. 5e). In addition, a good linearity relationship between the T/C value and the logarithm of the CRP concentration in the range of 50–10
000 ng mL−1. The correlation equation is y = 1.2x −2.106 (R2 = 0.97), and the calculated LOD is 1.3 ng mL−1. The temperature signals were also collected using a thermal imager, and the corresponding photothermal images of CRP with different concentrations are shown in Fig. 5d. Under the irradiation of 650 nm laser, the temperature signal of the T line gradually rises with the increase in CRP concentration. With the increase in CRP concentration, the T/C values of the temperature signal exhibit the same increasing trend as the colorimetric signal (as shown in Fig. 5e). In addition, a good linearity relationship between the T/C value and the logarithm of the CRP concentration in the range of 50–10![[thin space (1/6-em)]](https://www.rsc.org/images/entities/char_2009.gif) 000 ng mL−1 was also obtained by recording the temperature signals. The correlation equation is y = 0.98x −1.675 (R2 = 0.99), and the calculated LOD is 1.4 ng mL−1. The results indicate that the proposed GNR-based immunochromatographic strip can be used for dual-modal detection of CRP with a low detection limit and a wide linear range. In addition, compared with other methods,13,33–35 the GNR-based LFIA method was cost-effective, user-friendly and timesaving for detecting CRP.
000 ng mL−1 was also obtained by recording the temperature signals. The correlation equation is y = 0.98x −1.675 (R2 = 0.99), and the calculated LOD is 1.4 ng mL−1. The results indicate that the proposed GNR-based immunochromatographic strip can be used for dual-modal detection of CRP with a low detection limit and a wide linear range. In addition, compared with other methods,13,33–35 the GNR-based LFIA method was cost-effective, user-friendly and timesaving for detecting CRP.
3.5. Analysis of CRP in clinical plasma samples
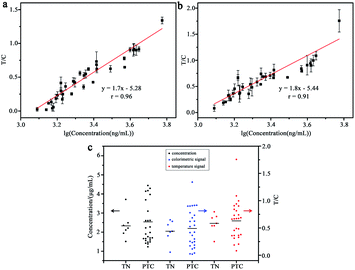
For assessing the feasibility of the dual-modal LFIA strip, 34 clinical plasma samples were collected from thyroid patients. The diagnostic kit of immunoturbidimetry was used as a reference method. As shown in Fig. 6a and b, the T/C value of colorimetric temperature signals showed a good linearity relationship with the logarithm of the CRP concentration, and the correlation coefficients (r) were 0.96 and 0.91 respectively. The levels of CRP in thyroid nodule (TN) and papillary thyroid carcinoma (PTC) patients were also compared by the two methods, as shown in Fig. 6c. The results indicated that the levels of CRP in plasmas showed insignificant difference in the TN and the PCT patients, and the results of the two methods exhibited good conformance. Therefore, this proposed method has great potential for directly analyzing the CRP levels in clinical plasma samples.4 Conclusions
In this study, a dual-modal, low-cost and user-friendly LFIA method based on GNRs was proposed for rapid and quantitative detection of CRP in plasma. With the unique optical and photothermal properties of GNRs, the concentration of CRP can be simultaneously monitored by colorimetric and temperature signals, which can be directly observed and read. The detection procedure took less than 15 min using the proposed immunochromatographic strip. The fabricated strip exhibits the advantages of strong specificity, good quantifiability and high sensitivity. The clinical plasma samples were measured using the developed test strip, and the good correlations were obtained between the values of detection signals and the logarithm of concentration measured using the diagnostic kit of immunoturbidimetry (r = 0.96). Therefore, we believe that the dual-modal LFIA strip has great potential to be used as an in vitro diagnostic kit.Conflicts of interest
There are no conflicts to declare.Acknowledgements
This research was supported by the National Natural Science Foundation of China (No. 21775145) and the Natural Science Foundation of Jilin Province (No. 20200201357JC).References
- B. Clyne and J. S. Olshaker, J. Emerg. Med., 1999, 17, 1019–1025 CrossRef CAS.
- M. B. Pepys and G. M. Hirschfield, J. Clin. Invest., 2003, 111, 1805–1812 CrossRef CAS.
- A. Molinero-Fernandez, M. Moreno-Guzman, L. Arruza, M. A. Lopez and A. Escarpa, ACS Sens., 2019, 4, 2117–2123 CrossRef CAS.
- N. Zhan, Y. Zhou, L. Mei, Y. Han and H. Zhang, Anal. Sci., 2019, 35, 257–263 CrossRef CAS.
- P. M. Ridker, J. Am. Coll. Cardiol., 2016, 67, 712–723 CrossRef PubMed.
- B. R. Sahu, R. K. Kampa, A. Padhi and A. K. Panda, Clin. Chim. Acta, 2020, 509, 91–94 CrossRef CAS PubMed.
- R. Wu, S. Zhou, T. Chen, J. Li, H. Shen, Y. Chai and L. S. Li, Anal. Chim. Acta, 2018, 1008, 1–7 CrossRef CAS PubMed.
- P. M. Ridker, Circ. Res., 2016, 118, 145–156 CrossRef CAS PubMed.
- M. Rieger, C. Kochleus, D. Teschner, D. Rascher, A. K. Barton, A. Geerlof, E. Kremmer, M. Schmid, A. Hartmann and H. Gehlen, Anal. Bioanal. Chem., 2014, 406, 5507–5512 CrossRef CAS PubMed.
- S. K. Vashist, G. Czilwik, T. van Oordt, F. von Stetten, R. Zengerle, E. Marion Schneider and J. H. Luong, Anal. Biochem., 2014, 456, 32–37 CrossRef CAS PubMed.
- W. J. Kim, H. Y. Cho, B. Jeong, S. Byun, J. Huh and Y. J. Kim, Sensors, 2017, 18, 55 CrossRef.
- C. Bravin and V. Amendola, Biosens. Bioelectron., 2020, 169, 112591 CrossRef CAS PubMed.
- X. Yang, W. Shu, Y. Wang, Y. Gong, C. Gong, Q. Chen, X. Tan, G. D. Peng, X. Fan and Y. J. Rao, Biosens. Bioelectron., 2019, 131, 60–66 CrossRef CAS PubMed.
- M. Dong, J. Wu, Z. Ma, H. Peretz-Soroka, M. Zhang, P. Komenda, N. Tangri, Y. Liu, C. Rigatto and F. Lin, Sensors, 2017, 17, 684 CrossRef.
- C. Downs, M. Milovancev and E. Fu, Talanta, 2020, 220, 121319 CrossRef CAS.
- L. Anfossi, F. Di Nardo, S. Cavalera, C. Giovannoli and C. Baggiani, Biosensors, 2018, 9, 2 CrossRef PubMed.
- K. M. Koczula and A. Gallotta, Essays Biochem., 2016, 60, 111–120 CrossRef PubMed.
- E. Sheng, Y. Lu, Y. Xiao, Z. Li, H. Wang and Z. Dai, Biosens. Bioelectron., 2021, 181, 113149 CrossRef CAS PubMed.
- J. Chen, S. Zhou and J. Wen, Anal. Chem., 2014, 86, 3108–3114 CrossRef CAS.
- Y. Yao, W. Guo, J. Zhang, Y. Wu, W. Fu, T. Liu, X. Wu, H. Wang, X. Gong, X. J. Liang and J. Chang, ACS Appl. Mater. Interfaces, 2016, 8, 22963–22970 CrossRef CAS.
- R. Banerjee and A. Jaiswal, Analyst, 2018, 143, 1970–1996 RSC.
- F. Scholz, L. Ruttinger, T. Heckmann, L. Freund, A. M. Gad, T. Fischer, A. Gutter and H. H. Soffing, Biosens. Bioelectron., 2020, 164, 112324 CrossRef CAS.
- N. A. Byzova, A. V. Zherdev, B. N. Khlebtsov, A. M. Burov, N. G. Khlebtsov and B. B. Dzantiev, Sensors, 2020, 20, 3608 CrossRef CAS.
- Y. Panraksa, A. Apilux, S. Jampasa, S. Puthong, C. S. Henry, S. Rengpipat and O. Chailapakul, Sens. Actuators, B, 2021, 329, 129241 CrossRef CAS.
- M. Antonio, J. Nogueira, R. Vitorino and A. L. Daniel-da-Silva, Nanomaterials, 2018, 8, 200 CrossRef PubMed.
- Z. Rong, R. Xiao, S. Xing, G. Xiong, Z. Yu, L. Wang, X. Jia, K. Wang, Y. Cong and S. Wang, Analyst, 2018, 143, 2115–2121 RSC.
- H. Zhang, Z. She, H. Su, K. Kerman and H. B. Kraatz, Analyst, 2016, 141, 6080–6086 RSC.
- A. Abareshi, M. Arshadi Pirlar and M. Houshiar, New J. Chem., 2021, 45, 298–303 RSC.
- D. K. Smith and B. A. Korgel, Langmuir, 2008, 24, 644–649 CrossRef CAS.
- H. Zhang, Q. Li and G. F. Liu, Chin. J. Inorg. Anal. Chem., 2020, 48, 1018–1024 Search PubMed.
- Y. Zha, S. Lu, P. Hu, H. Ren, Z. Liu, W. Gao, C. Zhao, Y. Li and Y. Zhou, ACS Appl. Mater. Interfaces, 2021, 13, 6091–6098 CrossRef CAS PubMed.
- Y. Liu, K. Ai, J. Liu, M. Deng, Y. He and L. Lu, Adv. Mater., 2013, 25, 1353–1359 CrossRef CAS PubMed.
- J. Xie, M. Q. Tang, J. Chen, Y. H. Zhu, C. B. Lei, H. W. He and X. H. Xu, Talanta, 2020, 217, 121070 CrossRef CAS.
- X. Liu, X. Yang, K. Li, H. Liu, R. Xiao, W. Wang, C. Wang and S. Wang, Sens. Actuators, B, 2020, 320, 128350 CrossRef CAS.
- M. F. Siddiqui, Z. A. Khan and S. Park, Nanomaterials, 2020, 10, 1240 CrossRef CAS PubMed.
Footnote |
| † Electronic supplementary information (ESI) available. See DOI: 10.1039/d1ra04404d |
| This journal is © The Royal Society of Chemistry 2021 |

