
 Open Access Article
 This Open Access Article is licensed under a Creative Commons Attribution-Non Commercial 3.0 Unported Licence
Synthesis and efficacy of norfloxacin loaded onto magnetic hydrogel nanocomposites
Nehal Salahuddin *,
Ahmed Rehab* and
Sahar Emad
*,
Ahmed Rehab* and
Sahar Emad
Chemistry Department, Faculty of Science, Tanta University, Tanta 31527, Egypt. E-mail: ahmed.fathalla@science.tanta.edu.eg; nehal.attaf@science.tanta.edu.eg
First published on 17th September 2021
Abstract
A targeted drug delivery system based on biocompatible magnetic hydrogel nanocomposites consisting of poly[oligo(oxyethylene methacrylate)] anchored Fe3O4 nanoparticles was synthesized. The characteristics, thermal properties, morphology and magnetic properties were studied by XRD, FT-IR, TGA, SEM, TEM and VSM. A norfloxacin (NOR) anti-bacterial agent with a potential antitumor activity was immobilized into hydrogels, Fe3O4 nanoparticles and their magnetic hydrogel nanocomposites. The in vitro drug release manner of NOR was explored at different temperatures and pH values. The behavior of the drug release has been studied via different kinetic models. The antibacterial efficacy was tested against Streptococcus, Staphylococcus aureus, Kelebsella pneumonia and Escherichia coli via well diffusion method, and showed significant activity compared to the unloaded drug. Furthermore, an antitumor efficacy against HCT-116, HepG-2, PC3 and MCF-7 cancer cells revealed the highest cytotoxic efficacy with no influence on healthy cells. These nanodrugs, retaining both antibacterial and anticancer efficacy, have a talented therapeutic potential because of their selective cytotoxicity, connected with the ability to minimize the risk of bacterial infection in a cancer patient who is frequently immunocompromised.
1 Introduction
Hydrogels have advantages for different biomedical applications because of their inherent biocompatibility and their similarity to natural soft tissues, due to their flexible, soft nature, and ability to import a high percentage of water.1 Hydrogels have a high porosity structure, which allow the drugs to be loaded into the gel matrix. Afterwards, the drugs are released at a rate depending on the diffusion coefficient of the small molecule across the gel network.2 The biocompatibility of hydrogels is reflected by their successful use in peritoneum3 in vivo, and its ability to be biodegradable by environmental factors (temperature, pH), hydrolysis or enzymatic analysis.2 The relative deformability of hydrogels also makes it adaptable to the shape of the surface to which it will be applied.2 In the later context, some hydrogels of bio-adhesive properties may be beneficial in applying them to non-horizontal surfaces, or by transferring them at the application site.2Recently, hydrogel nanocomposites have been applied in various biomedical applications, such as cancer treatment and drug delivery.4 Lately, the magnetic hydrogel has witnessed great advancement, which can comply to an external magnetic field.5 Regarding old-style stimuli, such as temperature and pH, the magnetic response is more appropriate for monitoring delivery because of its exceptional characteristics, which include remote operation, easy management control and rapid response.6 In the hyperthermia technique, biocompatible magnetic gel composites that are made by incorporating magnetic nanoparticles (MNPs) into polymer hydrogel matrices were used.7,8
Magnetite nanoparticles (MNPs) is a kind of smart nanomaterials with super paramagnetism, magnetic response, large specific surface area and small particle size.9 Fe3O4-NPs should be biodegradable and biocompatible to reduce their toxicity.10–12 Because of the MNPs' properties, they can easily reach the position of the injury.13 MNPs were used as drugs delivery agents, so that drugs may be directed towards the targeted place in vivo through applying an external magnetic field.14 This participates in overcoming the difficulties accompanying the traditional chemotherapeutic agents, including rapid clearance, poor solubility under aqueous conditions and lack of selectivity, which subsequently lead to nonspecific toxicity towards normal cells.15 Drug-loaded Fe3O4-NPs can pile up at the tumor site through the assistance of an external magnetic field.12 This leads to increasing the efficacy of releasing drugs without any harm to healthy cells.12
However, because of some toxicity associated with the use of MNPs, several limitations have been applied in their application.16 Therefore, the surface coating of MNPs and size control can improve the magnetic behavior and minimize toxicity.16 The utilization of MNPs in drug release field is the most promising application, particularly for cancer treatment.17 This innovative strategy consists of loading magnetic systems with the drug, which may be directed to the target using an external magnetic field.18,19 MNPs release the drugs once they reach the target under the action of alternating magnetic field.17 MNPs have shortcomings related to the loading of a small amount of drugs associated with each NP. This shortcoming implies the necessity of injecting large concentrations of NPs for achieving the targeted treatment.17
Some of the incurred issues may be dealt with through introducing MNPs into a hydrogel.17 There are many methods suggested for using metal oxide nanoparticles in hydrogels.20,21 Most magnetic hydrogels are invented by in situ precipitation method22 or by blending method.8 Cross-linked structural magnetic hydrogels were prepared hierarchically by encapsulating MNPs into micelles, followed by embedding in a polymer matrix.23 Functionalized MNPs were used as crosslinked chemical elements to form hydrogel networks24,25 through modifying the surface of the nanoparticles that ensure the covalent conjugation of a hydrogel matrix.5 Interestingly, the introduction of covalent bonds between the hydrogel network and MNPs improved the MNP dispersion inside the hydrogel matrix.5 Incorporating iron oxide nanoparticles into hydrogels may lead to producing tunable nanocomposites, which may be controlled remotely through an external magnetic field.26–30
Magnetic hydrogel nanocomposites, in addition to being used with drug delivery, can be used in hyperthermia cancer treatment in order to heat cancer cells and tissues, making them more sensitive to chemotherapy or radiation.7,31,32 In magnetic targeting vehicles, there is no need for any additional chemical additives to induce the response; only an external magnetic field is needed compared to other target compounds.5
It is challenging to design drug carriers that have all of the desired characteristics. Overcoming all barriers and improving the accumulation are always a critical mission for drug carriers, and it is very important to induce the release after accumulation by increasing the functionality of the drug carriers.33 In particular, spatially variant magnetic fields have been used to encourage the accumulation of drug-loaded MNPs at target sites, while time-variant magnetic fields have been used to induce drug release from thermally sensitive nanocarriers. This work was aimed to design targeted drug delivery systems based on hydrogels and magnetic hydrogel nanocomposites to improve the functionality of the carriers. These systems consist of poly[oligo(oxyethylene methacrylate)]-anchored MNPs via in situ polymerization in the presence of MNPs, followed by the loading of norfloxacin (NOR) as an antibacterial agent with potential antitumor activity. In addition, the release of the drug under different conditions, antibacterial activity and potential antitumor activity will be examined under different conditions.
2 Materials and methods
Ferric chloride [FeCl3] (Alpha Chemica), ferrous sulfate [FeSO4·7H2O] (Oxford Lab Chem, India), sodium hydroxide [NaOH] (Bio Chem), HCl (Elnasr Pharmaceuticals Chemicals Co.), ethanol (Bio Chem), ammonium peroxydisulfate and potassium persulfate were used as received from Riedel-de Haen AG, Seelze-Hannover. Commercial di(oxyethylene) methacrylate (DOEMA) and tetra(oxyethylene) methacrylate (TOEMA) were obtained from Nippon Oil and Fats Co., Japan without further treatment. N,N′-Methylenebisacrylamide (MBAA, Aldrich) and norfloxacin, NOR, (Epico, Egypt) were used as received. The empirical formula of NOR is C16H18FN3O3 and the structural formula is shown in Fig. 1.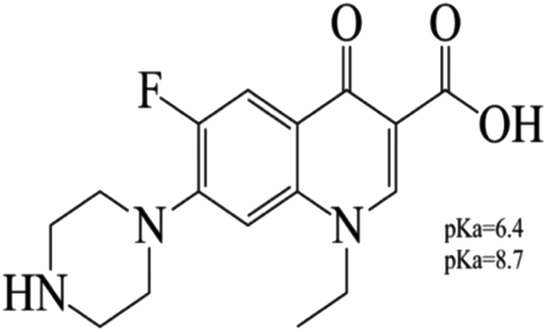 | ||
| Fig. 1 Structure of norfloxacin. | ||
2.1. Synthesis of MNPs
The synthesis of MNPs was carried out by dissolving a mixture of 8.125 g FeCl3 and 6.950 g of FeSO4·7H2O (2![[thin space (1/6-em)]](https://www.rsc.org/images/entities/char_2009.gif) :1 molar ratio) in 50 mL deoxygenated distilled water under N2 atmosphere. After stirring for 1 h, the precipitate was achieved by adding 2 M NaOH solution dropwise under vigorous stirring at 30 °C. The mixture was heated and kept at 70 °C (pH ≈ 12) under vigorous stirring for 5 h. Then, the system was cooled to ≈25 °C and the black precipitate was separated, followed by washing with deoxygenated distilled water and ethanol. Finally, MNPs was dried at 60–70 °C.34
:1 molar ratio) in 50 mL deoxygenated distilled water under N2 atmosphere. After stirring for 1 h, the precipitate was achieved by adding 2 M NaOH solution dropwise under vigorous stirring at 30 °C. The mixture was heated and kept at 70 °C (pH ≈ 12) under vigorous stirring for 5 h. Then, the system was cooled to ≈25 °C and the black precipitate was separated, followed by washing with deoxygenated distilled water and ethanol. Finally, MNPs was dried at 60–70 °C.34
2.2. Synthesis of polymeric hydrogels (Ia,b)
The hydrogels were synthesized through radical polymerization by dissolving oligo(oxyethylene methacrylates) (PE-90 or PE-200) monomers in 50 mL distilled water in the presence of 1% potassium persulfate as an initiator with stirring, followed by heating at 80–90 °C for 6–8 hours. The obtained hydrogels were removed by decantation, washed with ethanol three times, and finally dried under reduced pressure at 30–40 °C for 24 h to obtain the hydrogels (Ia,b), as shown in Scheme 1.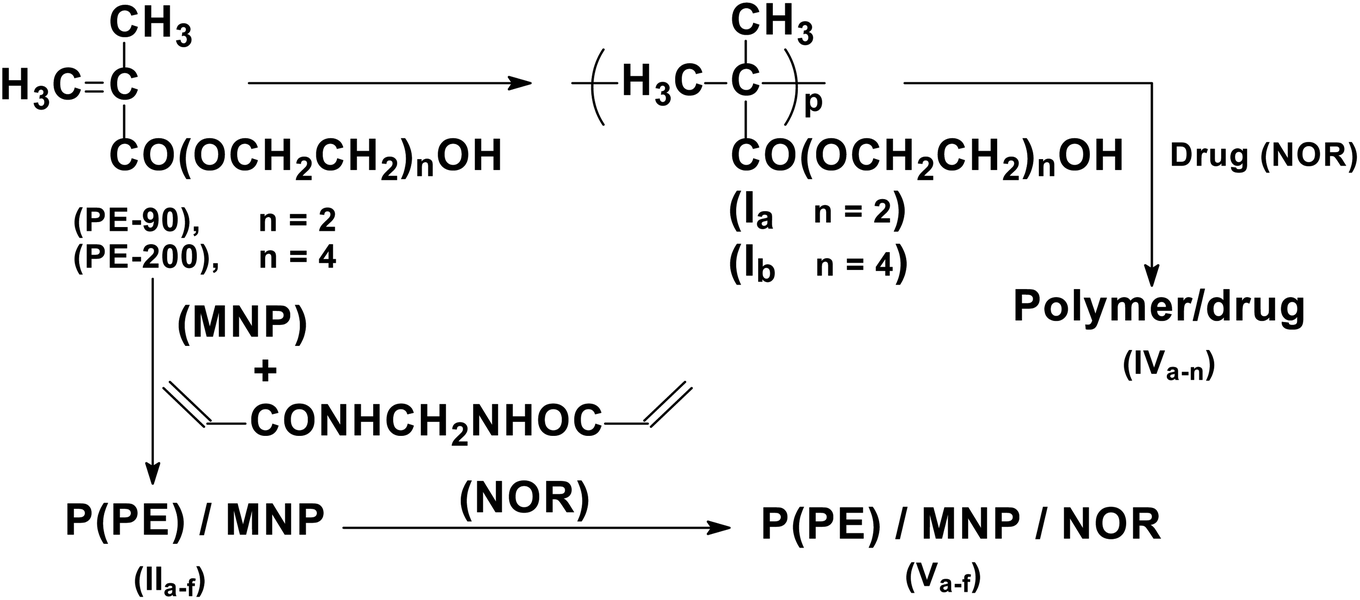 | ||
| Scheme 1 Synthesis of polymeric hydrogels and magnetic hydrogel nanocomposites. | ||
2.3. Synthesis of magnetic hydrogel nanocomposites (IIa–f)
Magnetic hydrogel nanocomposites were synthesized by in situ polymerization, as shown in Scheme 1. Accordingly, a mixture of 5 g monomers (PE-90), 0.195 g of N,N-methylen-bisacrylamide (crosslinker) and 0.25 g (5 w/w%) of MNPs were dispersed under nitrogen in 40 mL distilled water using a sonication bath for 30 minutes. Then, 0.074 g of potassium persulfate solution in 10 mL of distilled water was added to the previous mixture with stirring. After that, the mixture was heated at 80–90 °C for 8 h under nitrogen gas. The obtained nanocomposite was washed with ethanol twice and dried at 30–40 °C under low pressure to produce (IIa). The same procedure was followed using different amounts of MNPs and monomer (PE-200) to produce (IIb–f), as in Table 1.2.4. Loading of NOR on the prepared carriers
A stock solution of the NOR drug was prepared by dissolving 0.04 g in 20 mL of DMSO, and supplemented to 1000 mL with distilled water. After that, successive dilutions were made to reach the required concentrations. Then, the drug (NOR) was loaded onto MNPs, hydrogels and their nanocomposites by adding 0.1 g of the sample into 20 mL of NOR solution (16 ppm), followed by stirring, and the precipitate was then collected by centrifuge. The loaded drug was followed by calculating the concentration of supernatant after centrifugation using a UV-visible instrument. The loading (%) was calculated by measuring the absorption at λmax = 274 nm from the calibration curve of NOR using the following equation:1
 | (1) |
The data of loading for the hydrogels and their nanocomposites are shown in Table 3. The effect of different conditions, such as the sample structure, temperature, drug concentration and pH of the medium on loading the drug onto hydrogels, was studied and the best conditions were used for loading the drug onto the MNPs and magnetic hydrogel nanocomposites with different MNPs contents. All measurements were made and the mean value is reported.
2.5. Preparation of buffer solutions
The buffer solutions were prepared at different pH values (5.4, 6.7 and 7.4) by mixing 500 mL of 0.1 M Na2HPO4 with 500 mL of 0.1 M NaH2PO4 solutions. Then, the solution was adjusted to the desired pH values by the addition of 1 M HCl or 1 M NaOH. The buffer solution at pH = 5.4 was chosen to imitate the intracellular pH of tumor tissue (endosomes of cancer tissue). The slightly acidic pH = 6.7 was chosen to simulate the extracellular pH of the tumor tissue, and the slightly basic pH = 7.4 was taken to imitate the body fluid environments and extracellular pH of normal tissue.2.6. Release study of NOR
The release investigation of norfloxacin was done as follows: concisely, 0.1 g of NOR-loaded carriers were dialyzed by cellulose dialysis tubing. Both of the ends of the dialysis tubing were sealed and suspended in 20 mL buffer. Then, a buffer solution at 37 °C was stirred and a solution was withdrawn at particular intervals of time. The release of NOR was investigated by measuring the UV absorption. The released concentration of NOR was calculated through a calibration curve. The extracted release data were analyzed in vitro through fitting them to different kinetics equations in order to study the release mechanism of NOR from its carriers.2.7. Antibacterial activity
The antibacterial efficacy of the conventional drug, free carriers and NOR-loaded carriers against Gram-negative bacteria (Kelebsella pneumonia, Escherichia coli) and Gram-positive bacteria (Staphylococcus aureus, Streptococcus) were tested via well diffusion method35 by pouring a specified amount of the medium at a temperature of 40–50 °C into a Petri plates until it reached a depth of 3–4 mm and left to harden, the suspended microorganisms were prepared to hold 5 × 10⁻⁵ CFU mL−1. The tested microorganisms were put into the culture plates, and subsequently allowed to solidify. They were struck with a sterile cork borer (with a diameter of 5.0 mm) to cut regular wells. The open wells were then filled with 0.01 g of the tested compounds, and incubated at 37 °C for 24 hours. The zones of inhibition were evaluated, and the median value was estimated.2.8. Cytotoxicity assay
Cytotoxic effects of the drug-loaded nanocarriers on various tumors and normal cell lines were detected using the MTT assay.36 Selected cell lines, including colorectal carcinoma, HCT 116; ductal carcinoma, MCF-7; hepatocellular carcinoma HepG 2; adenocarcinoma, PC-3 and WISH cell lines were tested, and doxorubicin was used for comparison as a standard cytotoxic agent. Cell lines were cultivated in a 96-well plate in RPMI-1640 medium with 10% fetal bovine serum with 1.0 × 10⁴ cells per well, and then incubated at 37 °C in the presence of 5% CO2 for 48 h. Cells were treated after incubation with different concentrations of tested samples, and then incubated for 24 h. After that, 20 μl of MTT solution was added at 5 mg mL −1, followed by incubation for 4 h, and dimethyl sulfoxide (DMSO) (100 μl) was then added to each well. Then, the cell viability was measured as (A570 of treated samples/A570 of untreated sample) × 100.2.9. Characterization techniques
The FT-IR spectra of the MNPs, hydrogel Ia, Ib and their nanocomposites II(a–f) were done using (Shimadzu FTIR-8101 A), a potassium bromide disc with resolution of 4 cm−1 and 64 scans per sample. X-ray diffraction was measured for samples using Philips PW1710 supplied with Cu-Kα radiation (λ = 1.54060 Å) and current (30 mA), which was recorded at room temperature at a scanning rate of 0.05° min−1 to determine their crystallinity. Thermogravimetric analysis (TGA) was conducted on a (TGA-50 Shimadzu) during heating process (25–800 °C) to record the residual weight at a heating rate of 10 °C min−1 under N2 gas. The morphology of MNPs, hydrogel Ia, Ib and their nanocomposites II(a–f) were examined with a scanning electron microscope (SEM) (SU8000 2.0 kV, 4.0 mm, 25.0 K SE(U)) and transmission electron microscope (TEM) (JEM-2100 JEOL). In TEM, the samples were examined using a copper grid (200 mesh) immersed in the dispersion of MNPs and nanocomposites in an ethanolic or distilled water, respectively, after ultrasonication for 30 min. The magnetic properties of the MNPs and magnetic hydrogel nanocomposites were quantified at room temperature by means of a vibration magnetometer (VSM). The NOR concentration was recorded using UV-Visible spectrophotometry on a Shimadzu 2101PC (UV-1800 double beam) Scanning Spectrophotometer at 200–500 nm.3 Results and discussion
The objective of the current work is directed to formulate and study the efficacy of MNPs, hydrogel and magnetic hydrogel nanocomposites loaded drug moieties. MNPs were prepared followed by in situ radical polymerization of different oxyethylene methacrylates monomers in presence of MNPs using different contents followed by loading NOR onto initially prepared MNPs, polymeric hydrogels and magnetic polymeric hydrogels, as presented in Scheme 1.The FT-IR spectrum of the Fe3O4 nanoparticles (Fig. 2A) shows a strong peak at 578 cm−1 due to Fe–O stretching, and bands at 3423 and 1636 cm−1 due to the OH stretching and bending, respectively. The XRD pattern (Fig. 2B) of Fe3O4 reveals sharp peaks at 2θ = 29.97°, 35.37°, 43°, 53.31°, 56.88° and 62.46° that correlates perfectly with the (220), (311), (400), (422), (511) and (440) crystal planes, respectively, according to the Joint Committee on Powder Diffraction Standards (JCPDS no 01-072-2303). The average crystallite size was found to be 23.9 nm as calculated according to the Scherer equation.37 The morphology of the Fe3O4 nanoparticles illustrated in the TEM image (Fig. 2C) displays spherical and cuboid shaped dimensions ranging from 5 to 45 nm, with an average of 15 nm. Fig. 2D shows the isothermal magnetization (M − H) curve at room temperature for MNPs. The M − H curve shows a symmetrical loop of hysteresis in the low field and magnetic field with a saturation magnetization (σs) of 60 emu g−1. This behavior indicated that Fe3O4 has superparamagnetic behavior.
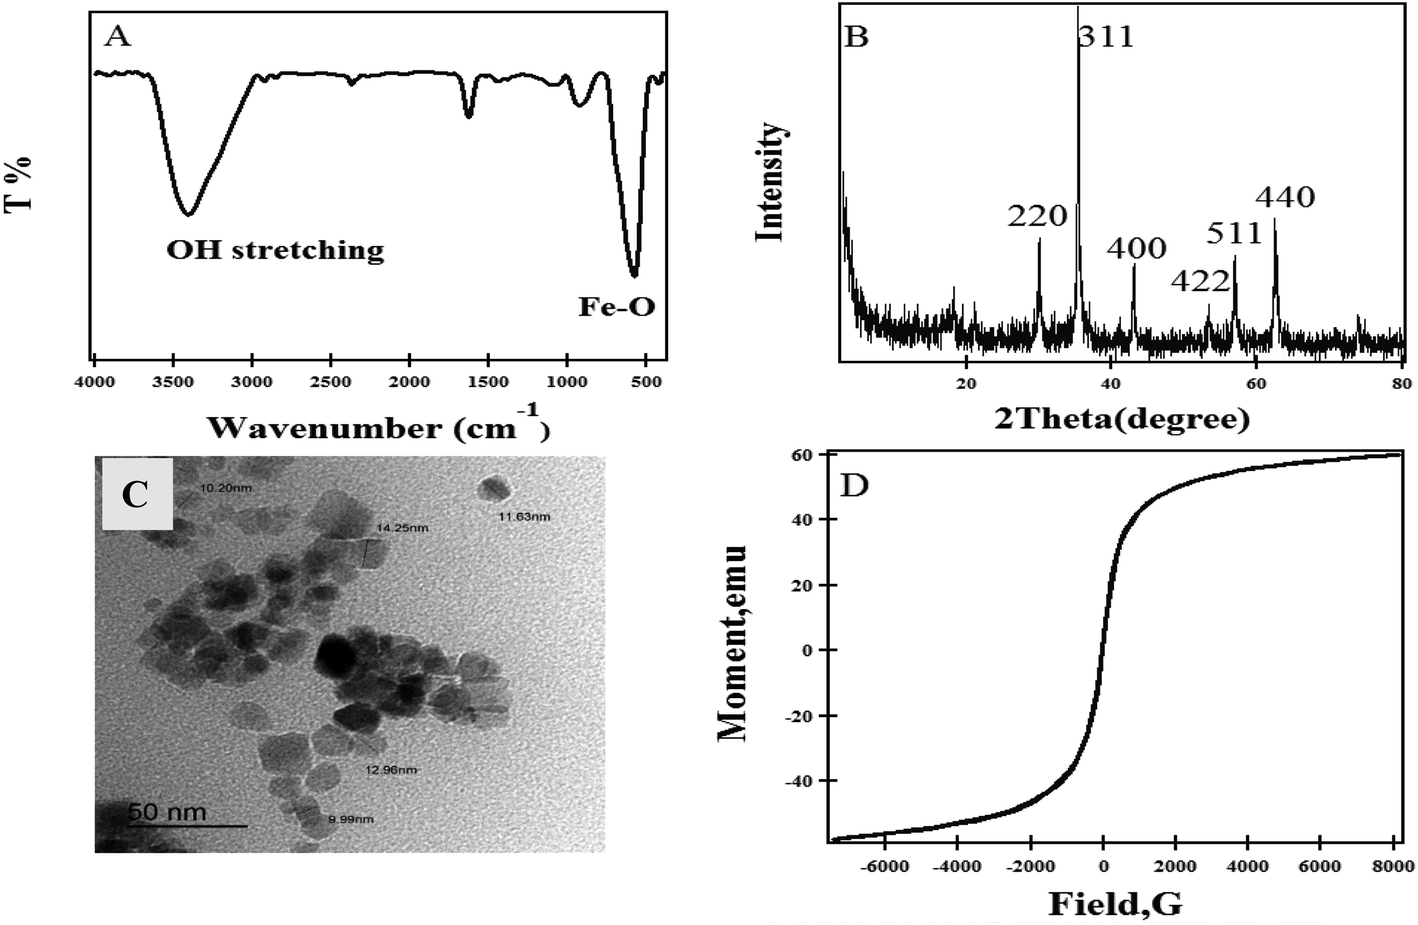 | ||
| Fig. 2 (A) FTIR spectrum, (B) XRD pattern, (C) TEM of MNP and (D) magnetization versus the applied magnetic field at room temperature of MNPs. | ||
The FT-IR spectra of hydrogel polymers Ia,b (Fig. 3) display a very strong peak at 1726 cm−1 arising from the C![[double bond, length as m-dash]](https://www.rsc.org/images/entities/char_e001.gif) O stretching of the ester group. Bands are observed in the range from 1177–1075 cm−1 corresponding to the C–O–C stretching vibrations. The peaks at 2926 and 2917 cm−1 are associated with the stretching C–H bands, and broad absorption bands at higher wavenumbers of 3444 and 3430 cm−1 are due to the OH linked to hydrophilic polymeric chains in Ia, Ib, respectively. The spectra of the IIa–f hydrogel nanocomposites show that the peaks assigned to the OH stretching at 3444 and 3430 cm−1 were shifted to 3445, 3436, 3433, 3436, 3442, and 3439 cm−1 in IIa–f, respectively, and the characteristic peak of the carbonyl of the ester group at 1726 was shifted to 1725, 1721, 1719,1724, 1725, and 1725 cm−1 in IIa–f, respectively. The shift may arise from the interaction between the hydrogel and MNPs.
O stretching of the ester group. Bands are observed in the range from 1177–1075 cm−1 corresponding to the C–O–C stretching vibrations. The peaks at 2926 and 2917 cm−1 are associated with the stretching C–H bands, and broad absorption bands at higher wavenumbers of 3444 and 3430 cm−1 are due to the OH linked to hydrophilic polymeric chains in Ia, Ib, respectively. The spectra of the IIa–f hydrogel nanocomposites show that the peaks assigned to the OH stretching at 3444 and 3430 cm−1 were shifted to 3445, 3436, 3433, 3436, 3442, and 3439 cm−1 in IIa–f, respectively, and the characteristic peak of the carbonyl of the ester group at 1726 was shifted to 1725, 1721, 1719,1724, 1725, and 1725 cm−1 in IIa–f, respectively. The shift may arise from the interaction between the hydrogel and MNPs.
 | ||
| Fig. 3 FT-IR spectra of hydrogel Ia, Ib and their nanocomposites II(a–f). | ||
The XRD pattern of Ia includes two broad peaks at 12.65° and 19.1° and for Ib, a broad beak at 18.15° is observed which indicates that the polymers are in the amorphous form (Fig. 4). The spectra show peaks at 2θ = 29.97°, 35.37°, 43°, 53.31°, 56.88° and 62.46° for the magnetic hydrogel nanocomposite (IIa–c), which are assigned to the (220), (311), (400), (422), (511) and (440) crystalline phase for Fe3O4. The average crystallite size was roughly calculated for (MNPs) according to Scherrer equation37 to be 23.9 nm.
 | ||
| Fig. 4 XRD patterns of MNPs, hydrogel Ia,b and their nanocomposites IIa–f. | ||
The thermograms (Fig. 5) of the prepared hydrogels and magnetic hydrogel nanocomposites reveal two stages of decomposition. The first stage occurred at a temperature range from 30 °C up to 200 °C. In this stage, the loss of absorbed water ranged from 2 to 6%. The second stage is due to the thermal decomposition of the polymers starting from 225 °C up to 450 °C with weight loss ranging from 65% to 84%.
 | ||
| Fig. 5 TGA thermograms of hydrogels Ia,b and their hydrogel nanocomposites IIa–f. | ||
The thermal analyses of the prepared samples are illustrated in Table 2. The temperature at different weight loss percentages (T-2, T-5, T-10, T-40, T-50, and T-60%) and the residual at 800 °C were calculated. The data in the table showed that the weight losses due to decomposition temperature ranged from 70 to 84% in the temperature range from ∼220 °C to ∼470 °C. It was found that the residuals at 800 °C are nearly identical with the weight ratio used in the preparation conditions.
| Sample | T-2% | T-5% | T-10% | T- 40% | T-50% | T-60% | Residual (%) at 800 °C |
|---|---|---|---|---|---|---|---|
| Ia | 107.77 | 200.87 | 229.29 | 290.88 | 302.6 | 313.88 | 0.57 |
| IIa | 63.99 | 207.21 | 224.7 | 315.13 | 336.92 | 359.08 | 6.03 |
| IIb | 151.71 | 215.61 | 232.17 | 318.57 | 337.26 | 359.66 | 8.65 |
| IIc | 84.81 | 224.2 | 246.1 | 344.72 | 368.75 | 387.89 | 11.89 |
| Ib | 78.41 | 206.87 | 261.95 | 346.25 | 360.41 | 373.75 | 1.44 |
| IId | 88.58 | 215.21 | 290.02 | 380.7 | 389.06 | 396.49 | 9.44 |
| IIe | 90.02 | 271.33 | 298.72 | 367.25 | 383.99 | 395.46 | 11.27 |
| IIf | 94.82 | 258.22 | 294.78 | 378.72 | 388.23 | 396.92 | 15.83 |
It was found from the degradation temperature that samples Ib and IId–f are more thermally stable than samples Ia and IIa–c. This was attributed to the presence of a longer oligo(oxyethylene) group, which led to a more stable residual and later degradation process. In addition, the degradation temperature was increased with increasing amounts of Fe3O4 nanoparticles in the polymer samples, and this means that greater thermal stability is achieved. Furthermore, by increasing the Fe3O4 nanoparticles content in the polymer matrix, the formation of carbon residues is increased and this can explain the high heat capacity of the IId–f nanocomposites.
Magnetic hydrogels can be used in hyperthermia, which is one of the effective methods for cancer treatment.38 When the MNPs are exposed to an external magnetic field, they absorb energy and cause a local temperature increase above 43 °C. This leads to the destruction of cancer cells, while healthy cells will survive.5,39 The measured magnetization curves at room temperature for MNPs, IIc and IIf are shown in Fig. 6. It can be seen that the saturation magnetization for MNPs, IIc and IIf are 60.06, 48.28 and 10.45 emu g−1, respectively. There was no hysteresis in the magnetization of the samples, indicating that the produced magnetic particles are superparamagnetic. The magnetic hydrogels saturation magnetization values were smaller than the values of the pure magnetic nanoparticles. This is caused by the presence of a diamagnetic polymer around the magnetic nanoparticles that quenches the magnetic moment. Super magnetic behaviors have been exposed by both of them, indicating the incorporation of magnetic nanoparticles into the composite particles, with no residual effect of hysteresis loops in the applied magnetic field.
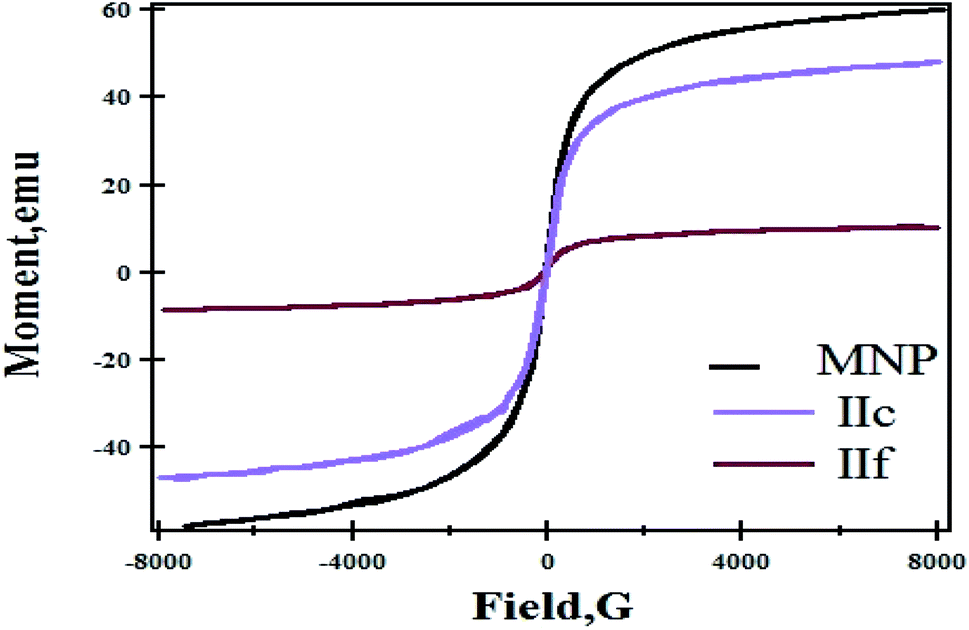 | ||
| Fig. 6 Magnetization curves of MNP, IIc, and IIf. | ||
The surface morphologies of the prepared hydrogel (Ia) and magnetic hydrogel nanocomposite (IIc) were distinguished by using SEM. The morphology of the hydrogels was noticed at different scales, as shown in Fig. 7(A and B). The morphology of the hydrogels shows that there are dense, rough, tight, and wavy surfaces. This refers to its dense cross-linking. The cross-sectional images of the magnetic hydrogel (IIc) nanocomposites, shown in Fig. 7(C and D), confirm a wrinkled, rough morphology with tiny nanoparticles, which may arise from the incorporation of iron oxide nanoparticles. This comparatively rough surface is convenient for the diffusion of the drug, which enhances the drug loading efficacy.
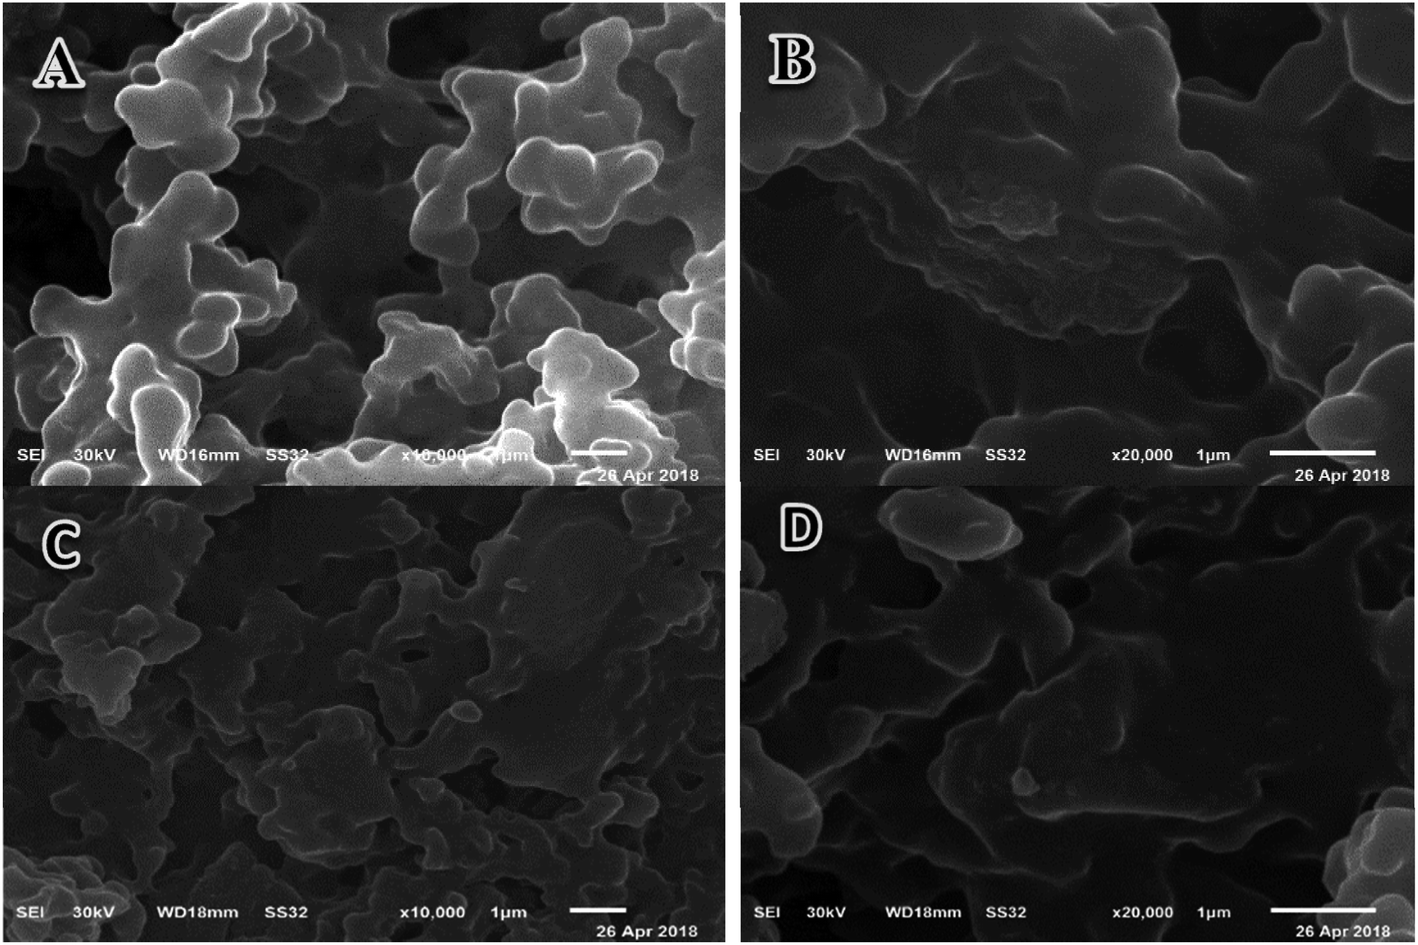 | ||
| Fig. 7 SEM images of hydrogel Ia (A, B) and magnetic hydrogel nanocomposite IIc (C, D). | ||
TEM images of the magnetic hydrogels (IIb, IIc, IIe, IIf) are shown in Fig. 8A–D, respectively. In the TEM image, the black spheres and cubes are attributed to Fe3O4 nanoparticles. It is clearly visible from Fig. 8 that iron oxide nanoparticles were well dispersed through the polymer matrix in some regions, and tend to aggregate in other regions.
 | ||
| Fig. 8 TEM images of the hydrogel nanocomposites. | ||
3.1. Drug loading onto carriers
To investigate the optimum condition of drug loading onto the hydrogels (Ia,b), different conditions were studied, such as the drug concentration, temperature, and pH medium (Table 3). It was observed that there is no loading in acidic or basic medium at the tested temperatures, and the most efficient concentration of drug was found at 16 ppm (loading 53.4% onto the Ia polymer) and loading reduced with increasing temperature. However, for Ib, the most suitable conditions for maximum loading was observed at 16 ppm, 43 °C. The optimum conditions were used for loading the magnetic hydrogels nanocomposites (IIa–f), and the loading percentage (54–58%) was enhanced with increasing Fe3O4 contents.| Loaded carrier code | Carrier code | NOR Conc. (ppm) | Temperature (°C) | Medium | Loading (%) |
|---|---|---|---|---|---|
| IIIa | MNP | 16 | 28 | Dist. H2O | 88.28 |
| IVa | Ia | 16 | 28 | Dist. H2O | 53.4 |
| IVb | Ia | 16 | 43 | Dist. H2O | 31.45 |
| IVc | Ia | 16 | 55 | Dist. H2O | 27.5 |
| IVd | Ia | 16 | 65 | Dist. H2O | 10.22 |
| IVe | Ia | 16 | 28 | pH = 2 | 0 |
| IVf | Ia | 16 | 28 | pH = 10 | 0 |
| IVg | Ib | 16 | 28 | Dist. H2O | 14 |
| IVh | Ib | 8 | 43 | Dist. H2O | 45.12 |
| IVi | Ib | 10 | 43 | Dist. H2O | 41.46 |
| IVj | Ib | 16 | 43 | Dist. H2O | 63 |
| IVk | Ib | 20 | 43 | Dist. H2O | 44.87 |
| IVl | Ib | 16 | 55 | Dist. H2O | 13.28 |
| IVm | Ib | 16 | 65 | Dist. H2O | 12.31 |
| IVn | Ib | 16 | 28 | pH = 2 | 0 |
| IVo | Ib | 16 | 28 | pH = 10 | 0 |
| Va | IIa | 16 | 28 | Dist. H2O | 57.893 |
| Vb | IIb | 16 | 28 | Dist. H2O | 58.310 |
| Vc | IIc | 16 | 28 | Dist. H2O | 63.485 |
| Vd | IId | 16 | 43 | Dist. H2O | 54.346 |
| Ve | IIe | 16 | 43 | Dist. H2O | 55.100 |
| Vf | IIf | 16 | 43 | Dist. H2O | 55.987 |
3.2. Release studies of norfloxacin
The release rate of the NOR drug from the prepared carriers-loaded NOR was studied with respect to the effect of the polymer structure, the percentage of loaded drug, the ratios of the MNPs, temperature and the pH of the aqueous medium.Fig. 9 shows the release profile of NOR from IVh, IVi, IVj, and IVk. An initial burst release was observed from all of the hydrogel-loaded drugs. The rate of NOR release from IVh, IVi, IVj, IVk continued to reach 100% after 194, 178, 352, 240 h at pH 7.4, respectively. It is worth mentioning that the highest loaded carrier, IVj, shows sustained release over a period of 352 h.
 | ||
| Fig. 9 In vitro release of NOR from IVh, IVi, IVj, and IVk in normal buffer solution at pH = 7.4. | ||
Fig. 10 displays the release profile of NOR from different carriers at different pHs buffer solutions. In general, the sample IIIa was distinguished by faster initial release in the first few days, followed by a moderate, gradual release. The rate of NOR release from IIIa was persistent to reach 67% after 243 h at pH 5.4, 148 h at pH 6.7 and 76 h at pH 7.4, respectively. However, a sustained release was observed for the hydrogel and magnetic hydrogel nanocomposites. The rate of NOR release from IVa and IVj continued to reach 100% after 888, 440 h at pH 5.4; 720, 390 h at pH 6.7; and 648, 352 h at pH 7.4, respectively. The rate of NOR release from Vc and Vf continued to reach 100% after 1111, 845 h at pH 5.4; 976, 773 h at pH 6.7; and 871, 702 h at pH 7.4, respectively. The rate of release of NOR from different magnetite contents carriers shows that the release from Va, Vb, and Vc continued to reach 100% after 941, 1003, 111 h at pH 5.4; and 792, 888, 967 h at pH 6.7; and 696, 768, 871 h at pH 7.4. In addition, the same trend was observed with increasing content of magnetite, the rate of release from Vd, Ve, and Vf continued to reach 100% after 685, 766, 845 h at pH 5.4; 576, 690, 773 at pH 6.7; and 502, 600, 702 h at pH 7.4, respectively. It is worth mentioning that magnetic nanoparticles not only produce magnetothermal for direct killing effect, but also act as a trigger to enhance the drug release.40,41 “In our study, the inclusion of magnetite nanoparticles into the hydrogel slows down the release, and increasing the percentage in the nanocomposites extends the time of release.”
 | ||
| Fig. 10 In vitro release of NOR from IIIa, IVa, and V(a–c) nanocomposites in a normal buffer solution at pH = 5.4 (A), pH = 6.7 (B), and pH 7.4 (C). In vitro release of NOR from IIIa, IVj and V(d–f) nanocomposites in a normal buffer solution at pH = 5.4 (D), pH = 6.7 (E), and pH 7.4 (F), in normal and saline buffer solution for sample IVa at pH = 6.7 (G). | ||
All systems showed significantly faster release in basic media (pH = 7.4). The order of release found was as follows: pH = 7.4 > pH = 6.7 > pH = 5.4. This may be due to the increasing solubility of NOR by increasing the pH of the medium. In addition, it was established that the drug release from the prepared samples occurs during the time period of 15–40 days. It was reported that the lipid-polylactic hybrid nanoparticles loaded norfloxacin showed initially burst release followed by sustained drug release with a maximum of 67.4–89.7% in 24 h, depending on the formulation.42 A magnetic thermosensitive hydrogel was developed as an intravesical Bacillus Calmette–Guérin (BCG) delivery system,43 and characterized by high antitumor efficacy with a continuous release of BCG up to 48 h. The additions of NaCl to the solution (pH 6.7) affect the release rate of the NOR from IVa [Fig. 10G], and it becomes slower because of the increase in ionic strength. Interestingly, the release from Vb (58.3% loading) at pH values of 6.7 and 5.4 is slower than that of Ve (55.1% loading). By increasing the temperature of the medium to 50 °C, the burst release happened and almost 50–75% of the drug was released within 24 h, as shown in Fig. 11.
 | ||
| Fig. 11 In vitro release of NOR at 50 °C from IIIa, IVa, IVj, Vc and Vf nanocomposites in a normal buffer solution at pH = 5.4. | ||
The release kinetics of Vc was studied in order to identify the release mechanism. The release data were tested by applying the following model equations:
Zero-order release kinetics:44
| W = W0 + k1t | (2) |
First-order release kinetics:45
|
log(100 − W) = log100 − k2t
| (3) |
Higuchi-kinetics:46
| W = k3t1/2 | (4) |
Hixson–Crowell Kinetics:47
| (100 − W)1/3 = 1001/3 − k4t | (5) |
Korsemeyer–Peppas equation:48
| Mt/M∞ = k5tn | (6) |
The kinetic mechanism of the release process was investigated by applying kinetic model equations eqn (2)–(6). The parameters of the release kinetics, such as regression coefficient (R2), rate constant (K), release exponent value (n) and the slope for each model, are graphically determined for all models, and are collected in Table 4. The data in the table suggest that the release of the drug was found to follow Hixson–Crowell kinetics, rather than other models in pH = 5.4, and follow Higuchi kinetics rather than other models at pH = 6.7 and 7.4. From the Korsmeyer–Peppas equation at pHs (5.4, 6.7 and 7.4) media, the release mechanism follows the Fickian diffusion mechanism.
| Release medium | Zero order | 1st order | Higuchi | Hixson–Crowell | Korsmeyer–Peppas | ||||||
|---|---|---|---|---|---|---|---|---|---|---|---|
| K1 | R2 | K2 | R2 | K3 | R2 | K4 | R2 | K5 | R2 | n | |
| pH 7.4 | 0.0749 | 0.727 | −0.002 | 0.830 | 0.031 | 0.945 | −0.003 | 0.896 | 0.837 | 0.930 | 0.295 |
| pH 6.7 | 0.0785 | 0.907 | −0.001 | 0.7387 | 0.030 | 0.950 | −0.003 | 0.892 | −1.157 | 0.929 | 0.395 |
| pH 5.4 | 0.0825 | 0.920 | −0.002 | 0.834 | 0.030 | 0.946 | −0.003 | 0.955 | −1.210 | 0.945 | 0.398 |
The antibacterial activities of the free carriers and loaded NOR were tested against four human pathogens: Staphylococcus aureus, Streptococcus (Gram-positive bacteria) and E. coli, and Klebsiella pneumonia (Gram-negative bacteria). The inhibition zone (ZOI) resulting from each sample was measured after 24 h incubation at 37 °C (Table 5). MNPS showed antibacterial efficacy against E. coli, Klebsiella pneumonia and Streptococcus. Interestingly Ib showed unique powerful activity against Klebsiella pneumonia, E. coli and Staphylococcus aureus however, Ia showed no activity against them. The antibacterial efficacy of the loaded hydrogels (IVa, IVj) and magnetic hydrogel (Va–f) nanocomposites showed excellent activity compared to the unloaded drug, which indicated the efficacy of the prepared nanocomposites.
| Sample | E. coli | Streptococcus | Klebsiella pneumonia | Staphylococcus |
|---|---|---|---|---|
| NOR | 16 ± 0 mm | 40 ± 0 mm | 25 ± 0 mm | 39 ± 0 mm |
| MNP | 11.5 ± 0 mm | 35.5 ± 0 mm | 14.5 ± 0 mm | −ve |
| Ia | −ve | 18 ± 0.5 mm | −ve | −ve |
| IIa | −ve | 17 ± 0 mm | −ve | −ve |
| IIb | −ve | 10 ± 0.5 mm | −ve | −ve |
| IIc | −ve | 23 ± 2 mm | −ve | −ve |
| Ib | 15 ± 1 mm | 12.5 ± 0.5 mm | 17 ± 0 mm | 9 ± 0.3 mm |
| IId | −ve | −ve | −ve | −ve |
| IIe | −ve | −ve | −ve | −ve |
| IIf | −ve | −ve | −ve | −ve |
| IVa | 15 ± 1 mm | 29 ± 0.8 mm | 15 ± 0 mm | −ve |
| Va | 16 ± 0.25 mm | 34 ± 4 mm | 26.1 ± 1 mm | 10 ± 0 mm |
| Vb | 24.45 ± 2.15 mm | 24 ± 0.3 mm | 25 ± 1.32 mm | −ve |
| Vc | −ve | 35 ± 3 mm | 24.05 ± 1 mm | −ve |
| IVj | 23 ± 1 mm | 19 ± 0.6 mm | 18 ± 0.25 mm | 14 ± 1.02 mm |
| Vd | −ve | −ve | 13.1 ± 0.5 mm | −ve |
| Ve | 16 ± 1.3 mm | 27 ± 2.5 mm | 15 ± 3 mm | −ve |
| Vf | 14 ± 0.8 mm | 13.25 ± 1.5 mm | 21.3 ± 1 mm | −ve |
The result of the anti-microbial efficacy of the lipid polylactic acid nanohybrid loaded with NOR showed good antibacterial efficacy towards Pseudomonas aeruginosa (Gram-negative bacteria) with ZOI ranging from 11 to 21 mm, and moderate efficacy towards Staphylococcus aureus (Gram-positive bacteria) with ZOI 7–15 mm, depending on the concentration of the nanocarrier (2–8 μg mL−1).42
Some antibacterial quinolones have been reported to employ their efficacy by targeting both Gram-positive bacteria topoisomerase IV and Gram-negative bacteria DNA gyrase,49 and inhibiting the process of DNA replication.50 NOR exerts its influence by inhibition of two kinds of enzymes, topoisomerase IV and DNA gyrase.51 DNA topoisomerases are found in both prokaryotic and eukaryotic cells, and are a target for chemotherapeutic medication in anticancer and antibacterial therapies.52 These enzymes perform critical tasks in many basic nuclear processes,53 and are necessary for eukaryotic cells survival.54
In fact, the enzyme DNA topoisomerase II stimulates the breakage of the DNA double strand to allow strand passage, and thus controls the conformation and topology of DNA.55
The cytotoxic activity of NOR, MNP and carriers-loaded NOR (IIIa, IVa, IVj and V(a–f)) was investigated in vitro compared to DOX against four cancer cell lines (HCT-116, MCF-7, HepG-2 and PC3) using the MTT colorimetric assay. The inhibitory activities of compounds NOR, MNP, IIIa, IVa, IVj and V(a–f) nanocomposites versus the cell lines are shown in Table 6 as IC50 values, along with relevant mean values. The IC50 values of IIIa towards all cancer cell lines indicate that IIIa possessed poor activity with the exclusion of the PC3 tumor cell line that showed the non-cytotoxicity against this cell line (IC50 > 100 μM). In addition, the IC50 values towards all cancer cell lines indicate that IVa possessed very strong activity with regard to Doxorubicin. In addition, the IC50 values of IVj and Vb towards all cancer cell lines indicate that all these compounds possessed strong activity with respect to Doxorubicin. It is worthy to note that IVa and Vb showed a higher activity than free NOR and MNP with respect to Doxorubicin. In contrast, IVj, Va, Vc, Vd, Ve and Vf nanocomposites showed moderate activity towards all tested cell lines.
| No. | Comp. | In vitro cytotoxicity IC50 (μg mL−1)a | |||
|---|---|---|---|---|---|
| HePG2 | HCT-116 | MCF-7 | PC3 | ||
| a IC50 (μg mL−1): 1–10 (very strong). 11–20 (strong). 21–50 (moderate). 51–100 (weak) and above 100 (non-cytotoxic). | |||||
| DOX | 4.50 ± 0.2 | 5.23 ± 0.3 | 4.17 ± 0.2 | 8.87 ± 0.6 | |
| A | NOR | 14.30 ± 1.2 | 23.62 ± 1.8 | 20.47 ± 1.6 | 34.94 ± 2.5 |
| B | MNP | 38.53 ± 2.5 | 52.02 ± 3.1 | 45.25 ± 2.8 | 71.86 ± 3.4 |
| C | IIIa | 88.34 ± 4.2 | 92.13 ± 4.9 | 71.39 ± 3.5 | >100 |
| D | IVa | 7.83 ± 0.6 | 10.48 ± 0.9 | 9.37 ± 0.7 | 15.29 ± 1.3 |
| E | Va | 32.22 ± 2.3 | 48.27 ± 2.8 | 25.16 ± 1.9 | 43.38 ± 2.9 |
| F | Vb | 11.61 ± 1.0 | 13.56 ± 1.2 | 14.85 ± 1.1 | 20.70 ± 1.6 |
| G | Vc | 23.09 ± 1.9 | 30.54 ± 2.3 | 21.20 ± 1.7 | 39.04 ± 2.5 |
| H | IVj | 18.57 ± 1.4 | 16.71 ± 1.4 | 19.64 ± 1.5 | 28.72 ± 2.1 |
| I | Vd | 26.24 ± 1.5 | 33.75 ± 1.9 | 25.45 ± 2.0 | 39.26 ± 2.4 |
| J | Ve | 36.18 ± 2.5 | 48.19 ± 1.2 | 29.30 ± 1.8 | 52.75 ± 2.6 |
| K | Vf | 49.68 ± 2.8 | 54.89 ± 3.1 | 34.18 ± 2.4 | 75.19 ± 3.5 |
In addition, the MNPs and IIc nanocomposite were examined against the normal human cell line (WISH). The obtained results showed that the MNPs and IIc had IC50 (94.12 ± 5.4, 69.61 ± 3.5 μg mL−1) more than the control drug DOX (6.72 ± 0.5 μg mL−1), indicating the selectivity of action towards cancer cells, as well as a shortage of cytotoxicity towards healthy cells.
4 Conclusion
Antitumor nanocarriers with antimicrobial analogs were prepared via radical polymerization of oligo(oxyethylene) methacrylate in the presence of Fe3O4 nanoparticles. A magnetic spherical and cuboid shaped of MNPs with an average particle size of 15 nm were dispersed in the hydrogels. A sustained NOR drug release was observed at different pH values. However, by increasing temperature, a burst release was observed. It was found that the drug release followed the Hixson–Crowell kinetics at pH = 5.4, and Higuchi kinetics at pH = 6.7 and 7.4. From the Korsmeyer–Peppas equation in pH media (5.4, 6.7 and 7.4), the release mechanism follows the Fickian diffusion mechanism. Furthermore, these nanodrugs had high anticancer efficacy against cancer cell lines, and were free of cytotoxicity against healthy cells. The permutation of an effective activity against bacteria and cancer cell lines, coupled with a dearth of cytotoxicity against healthy cells, make these factors important in the search for new potential antimicrobials capable of minimizing bacterial infection risks in cancer patients who are frequently immunocompromised. More studies are underway to evaluate the promising double-acting chemotherapeutics of the nanodrugs in vivo.Conflicts of interest
There are no conflicts to declare.References
- A. S. Hoffman, Ann. N. Y. Acad. Sci., 2001, 944, 62–73 CrossRef CAS PubMed.
- T. R. Hoare and D. S. Kohane, Polymer, 2008, 49, 1993–2007 CrossRef CAS.
- C. Sutton, Obstet. Gynecol., 2005, 7, 168–176 Search PubMed.
- S. Davaran, S. Alimirzalu, K. Nejati-Koshki, H. T. Nasrabadi, A. Akbarzadeh, A. A. Khandaghi, M. Abbasian and S. Alimohammadi, Asian Pac. J. Cancer Prev., 2014, 15, 49–54 CrossRef PubMed.
- J. Zhang, Q. Huang and J. Du, Polym. Int., 2016, 65, 1365–1372 CrossRef CAS.
- Z. Liu, H. Wang, B. Li, C. Liu, Y. Jiang, G. Yu and X. Mu, J. Mater. Chem., 2012, 22, 15085–15091 RSC.
- M. Babincová, D. Leszczynska, P. Sourivong, P. Čičmanec and P. Babinec, J. Magn. Magn. Mater., 2001, 225, 109–112 CrossRef.
- J. I. Kim, C. Chun, B. Kim, J. M. Hong, J.-K. Cho, S. H. Lee and S.-C. Song, Biomaterials, 2012, 33, 218–224 CrossRef CAS PubMed.
- E. Yarar, G. Karakas, D. Rende, R. Ozisik and S. Malta, APS March Meeting Abstracts, 2016, p M1. 090 Search PubMed.
- L. Zhang, W.-F. Dong and H.-B. Sun, Nanoscale, 2013, 5, 7664–7684 RSC.
- H. Zhao, K. Saatchi and U. O. Häfeli, J. Magn. Magn. Mater., 2009, 321, 1356–1363 CrossRef CAS.
- Y. P. Yew, K. Shameli, M. Miyake, N. B. B. A. Khairudin, S. E. B. Mohamad, T. Naiki and K. X. Lee, Arab. J. Chem., 2020, 13(1), 2287–2308 CrossRef CAS.
- M. Ahmed and M. Douek, Biomed Res. Int., 2013, 2013, 281230 CAS.
- A. Singh, F. Dilnawaz, S. Mewar, U. Sharma, N. Jagannathan and S. K. Sahoo, ACS Appl. Mater. Interfaces, 2014, 6, 4595 CrossRef CAS PubMed.
- H. Maeda, Adv. Enzym. Regul., 2001, 41, 189–207 CrossRef CAS.
- M. Wu and S. Huang, Mol. Clin. Oncol., 2017, 7, 738–746 CAS.
- G. Giani, S. Fedi and R. Barbucci, Polym, 2012, 4, 1157–1169 Search PubMed.
- B. Gaihre, M. S. Khil, D. R. Lee and H. Y. Kim, J. Pharmacol., 2009, 365, 180–189 CAS.
- J. Chomoucka, J. Drbohlavova, D. Huska, V. Adam, R. Kizek and J. Hubalek, Pharmacol. Res., 2010, 62, 144–149 CrossRef CAS PubMed.
- Y. Y. Liang, L. M. Zhang, W. Jiang and W. Li, ChemPhysChem, 2007, 8, 2367–2372 CrossRef CAS PubMed.
- H. Liu, C. Wang, Q. Gao, J. Chen, B. Ren, X. Liu and Z. Tong, Int. J. Pharm., 2009, 376, 92–98 CrossRef CAS PubMed.
- W. Zhao, K. Odelius, U. Edlund, C. Zhao and A.-C. Albertsson, Biomacromolecules, 2015, 16, 2522–2528 CrossRef CAS PubMed.
- Y. Zhou, N. Sharma, P. Deshmukh, R. K. Lakhman, M. Jain and R. M. Kasi, J. Am. Chem. Soc., 2012, 134, 1630–1641 CrossRef CAS PubMed.
- P. Ilg, Soft Matter, 2013, 9, 3465–3468 RSC.
- S. van Berkum, P. D. Biewenga, S. P. Verkleij, J. B. van Zon, K. W. Boere, A. Pal, A. P. Philipse and B. H. Erné, Langmuir, 2015, 31, 442–450 CrossRef CAS PubMed.
- N. Satarkar and J. Hilt, Acta Biomater., 2008, 4, 11–16 CrossRef CAS PubMed.
- R. A. Frimpong, S. Fraser and J. Zach Hilt, J. Biomed. Mater. Res. A: An Official Journal of The Society for Biomaterials, The Japanese Society for Biomaterials, and The Australian Society for Biomaterials and the Korean Society for Biomaterials, 2007, vol. 80, pp. 1–6 Search PubMed.
- W.-T. Liu, J. Biosci. Bioeng., 2006, 102, 1–7 CrossRef CAS PubMed.
- P. M. Xulu, G. Filipcsei and M. Zrínyi, Macromolecules, 2000, 33, 1716–1719 CrossRef CAS.
- M. Zrınyi, D. Szabó and H.-G. Kilian, Polym. Gels Netw., 1998, 6, 441–454 CrossRef.
- R. Hergt, S. Dutz, R. Müller and M. Zeisberger, J. Phys. Condens. Matter, 2006, 18, S2919 CrossRef CAS.
- J.-K. Yang, J.-H. Yu, J. Kim and Y.-H. Choa, Mater. Sci. Eng. A, 2007, 449, 477–479 CrossRef.
- J. Li and K. Kataoka, J. Am. Chem. Soc., 2021, 143, 538–559 CrossRef CAS PubMed.
- P. Loekitowati Hariani, M. Faizal, R. Ridwan, M. Marsi and D. Setiabudidaya, Int. J. Environ. Sci. Develop., 2013, 4, 336–340 CrossRef.
- J. H. Jorgensen and J. D. Turnidge, in Manual of Clinical Microbiology, American Society of Microbiology, 11th edn, 2015, pp. 1253–1273 Search PubMed.
- T. Mosmann, J. Immunol. Methods, 1983, 65, 55–63 CrossRef CAS PubMed.
- C. Hammond, The Basics of Crystallography and Diffraction, Oxford University Press, 2nd edn, 2001, ISBN-13: 978-0198505525, ISBN-10: 0198505523 Search PubMed.
- A. L. Daniel-da-Silva, R. S. Carvalho and T. Trindade, Recent Pat. Nanotechnol., 2013, 7, 153–166 CrossRef CAS PubMed.
- A. K. Gupta and M. Gupta, Biomaterials, 2005, 26, 3995–4021 CrossRef CAS PubMed.
- J. Li, Y. Anraku and K. Kataoka, Angew. Chem., Int. Ed., 2020, 59, 13526–13530 CrossRef CAS PubMed.
- J. Li, Y. Li, Y. Wang, W. Ke, W. Chen, W. Wang and Z. Ge, Nano Lett., 2017, 17, 6983–6990 CrossRef CAS PubMed.
- V. Dave, R. B. Yadav, K. Kushwaha, S. Yadav, S. Sharma and U. Agrawal, Bioact. Mater., 2017, 2, 269–280 CrossRef PubMed.
- D. Zhang, P. Sun, P. Li, A. Xue, X. Zhang, H. Zhang and X. Jin, Biomaterials, 2013, 34, 10258–10266 CrossRef CAS PubMed.
- M. A. Kalam, M. Humayun, N. Parvez, S. Yadav, A. Garg, S. Amin, Y. Sultana and A. Ali, Cont. J. Pharm. Sci., 2007, 1, 30–35 Search PubMed.
- J. G. Wagner, J. Pharm. Sci., 1969, 58, 1253–1257 CrossRef CAS PubMed.
- T. Higuchi, J. Pharm. Sci., 1963, 52, 1145–1149 CrossRef CAS PubMed.
- A. Hixson and J. Crowell, Ind. Eng. Chem., 1931, 23, 923–931 CrossRef CAS.
- R. W. Korsmeyer, R. Gurny, E. Doelker, P. Buri and N. A. Peppas, Int. J. Pharm., 1983, 15, 25–35 CrossRef CAS.
- D. C. Hooper, Clin. Infect. Dis., 1998, 27, S54–S63 CAS.
- L. M. Wentzell and A. Maxwell, J. Mol. Biol., 2000, 304, 779–791 CrossRef CAS PubMed.
- A. V. Shindikar and C. Viswanathan, Bioorg. Med. Chem. Lett, 2005, 15, 1803–1806 CrossRef CAS PubMed.
- V. T. Andriole, Clin. Infect. Dis., 2005, 41, S113–S119 CrossRef CAS PubMed.
- A. K. McClendon and N. Osheroff, Mutat. Res. Fund. Mol. M., 2007, 623, 83–97 CrossRef CAS PubMed.
- S. Elsea, N. Osheroff and J. Nitiss, J. Biol. Chem., 1992, 267, 13150–13153 CrossRef CAS.
- E. Willmore, S. de Caux, N. J. Sunter, M. J. Tilby, G. H. Jackson, C. A. Austin and B. W. Durkacz, Blood, 2004, 103, 4659–4665 CrossRef CAS PubMed.
| This journal is © The Royal Society of Chemistry 2021 |