 Open Access Article
Removal of copper ions by functionalized biochar based on a multicomponent Ugi reaction
Qi Liu,
Guo-Long Zang * and
Quan Zhao
Tianjin Key Lab of Indoor Air Environmental Quality Control, School of Environmental Science and Engineering, Tianjin University, No. 92 Weijin Road, Nankai District, Tianjin 300072, China. E-mail: guolongz@tju.edu.cn
First published on 27th July 2021
Abstract
Copper is widely present in the natural environment and inevitably poses a risk to both human health and the natural environment. Biochar is an inexpensive, clean and sustainable sorbent material that can be used as a resource for copper removal, and there is interest in new ways to chemically treat biochar to tune its unique properties and modify its atomic structure. In this study, biochar was oxidized, and then polyethyleneimine (PEI) modified chitosan and carboxylated biochar were economically compounded through a multicomponent Ugi reaction to effectively remove Cu(II). PEI enhances the adsorption of Cu(II) within an optimum solution pH range of 3.5–5.5. The adsorption process follows a pseudo-second-order kinetic model. When the dosage of BC-NH2 was 4 g L−1 and the temperature was 303 K, the maximum adsorption capacity calculated by the Langmuir model was 26.67 mg g−1. The adsorption process of Cu(II) on BC-NH2 was heat-trapping and spontaneous. BC-NH2 showed good selectivity for K+ and Mg2+, and BC-NH2 desorbed by NaOH showed better adsorption performance than H2SO4 in the adsorption–desorption cycle. Characterization by SEM, EDS, BET, FTIR, TGA and XPS showed successful coupling and that the amide group of BC-NH2 had chelated with Cu(II). This atomically economical multicomponent Ugi reaction provides a new option for preparing composite materials that effectively remove heavy metals.
1. Introduction
Copper is one of the most widely used heavy metals in the world, and it is overused in many industries, such as the electroplating industry, mining and smelting, brass manufacturing, oil refining and copper-based agrochemical mining.1 Although copper is a trace element necessary for life, chronic and extensive exposure can cause harmful effects on tissues and organs, eventually leading to cancer, and copper can cause severe harm to aqueous fauna when entering a water body.2,3 Copper sulfate has been used as an algicide in eutrophic lakes since the early 1900s and is still widely used today.4 In addition, excessively high Cu(II) has an inhibitory effect on the treatment of nitrogen and phosphorus by aquatic plants and microalgae, resulting in serious environmental pollution.5,6 The US Environmental Protection Agency (EPA) recommends that the Cu(II) in drinking water is lower than 1.3 mg L−1.7 Therefore, it is necessary to take measures to remove excess Cu(II) in wastewater.A large number of technologies have been adapted and practiced to ensure environmental safety in the removal of heavy metals; these include chemical precipitation,8 ion exchange,9 membrane separation,10 flocculation,11 electrolysis,12 reverse osmosis13 and adsorption.14 The large-scale application of these technologies has been hindered due to constraints such as high operating costs, large amounts of waste generation, limitations on the operating conditions (such as pH, temperature, and pressure), and the use of toxic chemicals.15 Among the removal methods, adsorption is quite effective due to its low cost and high efficiency.
A variety of adsorbents for Cu(II) removal have been extensively studied in water treatment, including biochar,16 algae,17 activated carbon,1 cellulose18 and chitosan and their derivatives.19 However, biomass energy resources on Earth are relatively abundant, and they are clean and sustainable. Biomass ranks as the fourth largest source of energy in the world, representing approximately 14% of world final energy consumption, and it is the main source of energy for many developing countries. Biomass supplies almost six times the energy of geothermal, solar and wind energy combined.20,21 Biochar (BC) is a carbon-rich material produced from biomass under certain thermal combustion conditions with limited oxygen.22 Due to its rich carbon content, high cation exchange capacity, large specific surface area, and stable structure, biochar has been widely used in environmental applications, such as soil remediation and amelioration, carbon sequestration, organic solid waste composting, decontamination of water and wastewater, catalysts and activators, electrode materials and electrode modifiers.23 Adsorption is the main mechanism by which biochar removes heavy metals. Modification can enhance the porosity, specific surface area and surface functional groups of biochar and improve the ability to remove heavy metals.24
Chitosan (CTS) is an excellent natural adsorbent because of its advantages of low cost, abundance, biodegradability, biocompatibility, nontoxicity, and adsorption capacity.7 However, CTS usually has an inadequate adsorption capacity for heavy metal ions despite containing amine and hydroxyl groups, which can be used as coordination sites to form complexes with various heavy metal ions; this low capacity is primarily due to its limited number of active sites and low specific surface area.25 Chitosan-modified biochar combines the advantages of biochar's large surface area and porous network with chitosan's high chemical affinity and can not only effectively remove heavy metals from aqueous solution but also greatly reduce the toxicity of heavy metals to plants.26 Polyethyleneimine (PEI) contains a large number of primary and secondary amine groups on the linear macromolecular chain and has a strong adsorption capacity for heavy metals.27 Shi et al. grafted polyethyleneimine to hydrochar to improve the removal of chromium(VI) and nickel(II).28
Multicomponent reactions (MCRs) are defined as modular, atom-economical reactions in which three or more reactants produce a single product containing most of the atoms from the starting materials in a “one-pot” method.29 Their atom economy, efficiency, mild conditions, high convergence, economy and green compatibility justify their central place in chemical synthesis.30 Among them, the Ugi reaction is a simple four-molecule condensation reaction of aldehyde, amine, acid, and isocyanide to obtain α-aminoamides. Most researchers who conduct drug synthesis and medical research use the Ugi reaction. Aram Rezaei et al. developed a new type of graphene complex as a nanocarrier for gene delivery through the Ugi reaction, and this nanocomposite has been successfully applied to the transfection of cultured mammalian cells.31 Siamak Javanbakht et al. prepared dual-core shell magnetic nanoparticles through the Ugi reaction to improve drug release and enhance resistance to cancer cells.32 Zhenghua Li et al. used Pd to catalyze the Ugi reaction, and the cyclization method can be controlled by selecting an appropriate ligand to obtain different types of products in high yields.33 However, there are few reports on the removal of heavy metals by preparing adsorbents via multicomponent reactions. Jibo Dou et al. prepared chitosan-coated carbon nanotube (CNT) composites by the Diels–Alder (DA) reaction and a multicomponent thioglycolic acid locked imine (MALI) reaction to improve the removal ability of Cu(II).2 However, there is still a lack of reports on the modification of materials to remove heavy metals by the Ugi reaction. Therefore, we believe that it is necessary to incorporate the Ugi reaction into the modification of composite biochar materials to evaluate their efficiency and applicability in removing heavy metals from wastewater.
This work aims to improve the removal ability of heavy metals through a multicomponent Ugi reaction for preparing modified biochar; this modification method is novel and atomically economical for biochar. To this end, we (1) prepared PEI-modified chitosan-functionalized biochar composite material through a multicomponent Ugi reaction; (2) used physical and chemical characterization methods to describe the morphology and chemical composition of the obtained samples; (3) studied various factors affecting the adsorption of Cu(II) by the composite biochar material, including the amount of PEI, the solution pH, the contact time, the initial Cu(II) concentration, temperature, competing ions and regeneration performance; and (4) explored the interaction mechanism between Cu(II) and the functional groups on the surface of the biochar composite.
2. Experimental sections
2.1. Materials
The rice husk was purchased from Tianjin Adel Biomass Technology Co., Ltd., washed with deionized water and dried at 80 °C for use. Chitosan (deacetylation degree ≥95%), polyethyleneimine (PEI, MW 600, 99%), copper sulfate, p-toluenesulfonylmethyl isocyanide (TI), and glutaric dialdehyde (GD, 25%) were all purchased from Tianjin Chemart Chemical Technology Co., Ltd. All other chemicals were of analytical grade and used without further purification. All solutions were prepared with deionized water.2.2. Preparation of biochar
A certain amount of raw material of rice husk was put into a quartz porcelain boat, which was put into a tube resistance furnace, and nitrogen gas was passed through at a rate of 200 ml min−1 for 30 min to remove the air, ensuring an oxygen-free environment; after that, the temperature was increased to 500 °C at a heating rate of 10 °C min−1, heated for 2 h and then cooled to room temperature; the biochar was passed through a 120 mesh sieve, the sieved biochar was washed several times with deionized water and dried to constant weight at 378 K. The biochar was obtained and denoted as BC, and the sample was collected and put into a desiccator for storage prior to use.2.3. Carboxylation of BC
The biochar was modified for carboxylation according to previous study.34 10 g biochar was added to 100 ml HCl (2 mol L−1) and stirred for 2 h to clean the biochar and remove the ash. The biochar was washed several times with deionized water until the pH was neutral, and dried at 378 K to a constant weight. 10 g acid-washed biochar was added to 100 ml HNO3 (5 mol L−1) and stirred at 363 K for 4 h in a constant temperature water bath with a condensing device, followed by washing several times with deionized water until the pH was neutral and drying at 378 K until a constant weigh was reached; thus, BC-COOH was obtained.2.4. Ugi four-component reaction on BC-COOH
At 25 °C, 0.1696 g chitosan (1 mmol) was added to 20 ml CH3COOH (2%), and 10 ml methanol was added after ultrasonic dissolution; after that, 0.6061 g polyethyleneimine (1 mmol) was dispersed in 10 ml methanol, and it was poured into the chitosan solution while rapidly stirring; then, 1.88 ml glutaraldehyde solution (5%) was slowly dropped into the mixed solution while rapidly stirring for 30 min. Then, 0.1992 g p-toluenesulfonylmethyl isocyanide was dissolved in 5 ml of methanol and poured into the mixed solution together with 1 g BC-COOH and stirred magnetically for 2 h. The mixture was first washed with 100 ml methanol (70%) and then repeatedly washed with deionized water 5 times, centrifuged and dried to constant weight at 378 K. The composite biochar was named BC-NH.To investigate the effect of the addition of polyethyleneimine (PEI) on the adsorption performance of the materials, different composite biochars were prepared by adding 0, 0.5, 1, 1.5, 2 and 2.5 mmol of PEI, which were denoted as BC-NH0, BC-NH0.5, BC-NH1, BC-NH1.5, BC-NH2, BC-NH2.5 and BC-NH3, respectively.
2.5. Material characterizations
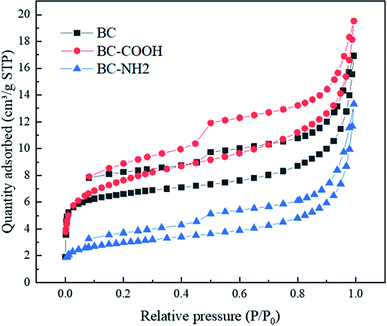
The surface morphology of the raw materials and adsorbents was analyzed by using a scanning electron microscope (SEM, ZEISS, Gemini 300) equipped with an EDS measurement system. Thermogravimetric analysis (TGA) and differential thermal analysis (DTA) were conducted using a Rigaku TG-DTA8122 under N2 flow at a heating rate of 10 °C min−1. The surface functional groups and bonding of BC, BC-COOH and BC-NH were analyzed by Fourier transform infrared (FTIR) spectroscopy (Tensor II, Bruker, Germany). KBr was used as the background and in a transmission mode in wavenumber ranges from 4000 to 400 cm−1. An ESCALAB 250Xi photoelectron spectrometer with an Al Kα ray source (Thermo Scientific, The United States) was used to analyze the surface element composition and element valence of the adsorbent. N2 adsorption–desorption was measured on an ASAP 2460 physisorption analyzer (Micromeritics, The United States) to obtain the texture properties of the adsorbent, and the specific surface area of the adsorbent was calculated by the Brunauer–Emmett–Teller (BET) equation. The pore volume of the adsorbent was calculated by the Barrett–Joyner–Halenda (BJH) equation.2.6. Adsorption experiments
Adsorption experiments were performed on Cu(II) at 25 °C to evaluate the adsorption performance of BC-NH. First, 160 mg different BC-NH was mixed with 40 ml of Cu(II) solution (100 mg L−1) in a 50 ml centrifuge tube, and then the mixture was shaken in a constant temperature shaker at 200 rpm for 12 h. The concentration of Cu(II) in the filtrate was determined after filtering the suspension with a 0.45 μm polyethersulfone (PES) filter membrane. The concentration of Cu(II) in the filtrate was tested at 457 nm by 2,9-dimathy-1,10-phenanthroline spectrophotometric method using an ultraviolet-visible spectrophotometer (UV-754, Shanghai, China), the upper limit of the determination is 1.3 mg L−1. This method used hydroxylamine hydrochloride to reduce copper ions to cuprous ions, which reacted with 2,9-dimathy-1,10-phenanthroline to form yellow complexes.Next, the effect of pH on Cu(II) removal was explored by adjusting the pH (2–7) with 0.1 M H2SO4 and NaOH solutions. Subsequently, kinetic studies were carried out at different time intervals (5–1440 min) under optimal pH and adsorbent conditions. The adsorption isotherm models were obtained by varying the initial concentration of Cu(II) solution (40–200 mg L−1). Thermodynamic studies were carried out at reaction temperatures of 288 K, 298 K and 308 K.
Finally, the ion selectivity of BC-NH was explored by proportioning different molar ratios of K+ and Mg2+ solutions. BC-NH regeneration experiments were further explored to evaluate the reusability. The saturated BC-NH after adsorption equilibrium was desorbed with H2SO4 solution (1 mol L−1) and NaOH solution (0.03 mol L−1) for 2 h, washed five times with deionized water, and then regenerated by drying at 80 °C. The regenerated BC-NH was mixed with Cu(II) solution (100 mg L−1) and shaken at 200 rpm for 12 h in a constant temperature shaker at 298 K. The adsorption–desorption process was repeated for five cycles.
The equilibrium adsorption (qe) and partition coefficient (Kd) were calculated separately according to the following equations:
 | (1) |
 | (2) |
3. Results and discussion
3.1. Physico-chemical characterization of materials
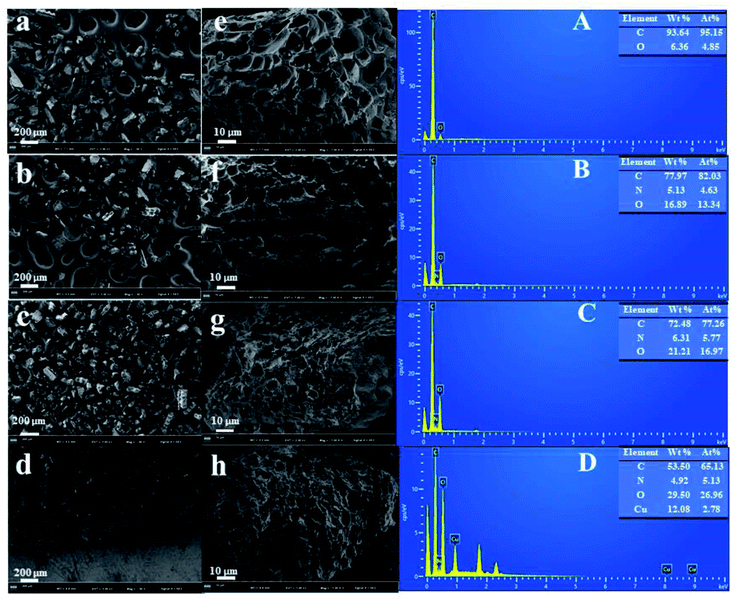 | ||
| Fig. 1 SEM images of BC (a) and (e), BC-COOH (b) and (f), BC-NH2 (c) and (g), BC-NH2-Cu (d) and (h); EDS spectra of BC (A), BC-COOH (B), BC-NH2 (C) and BC-NH2-Cu (D). | ||
The EDS spectra of BC, BC-COOH, BC-NH2 and BC-NH2-Cu are shown in Fig. 1A–D. It is obvious that the increase in O content on the BC-COOH indicates a large increase in oxygen-containing functional groups after oxidation, while the increase in the N content is due to the oxidation of HNO3. The increase in the N content of BC-NH2 indicates that the PEI cross-linked chitosan was successfully combined with BC-COOH after the four-component Ugi reaction, thus showing the successful synthesis of BC-NH2. The adsorption of Cu(II) by BC-NH2 was also observed in the EDX spectrum for Cu, indicating that BC-NH2 can effectively adsorb Cu(II).
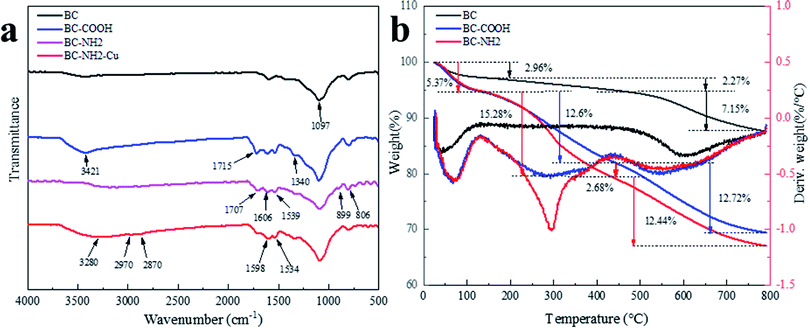
![[double bond, length as m-dash]](https://www.rsc.org/images/entities/char_e001.gif) O peak at 1715 cm−1 than BC,34 and the absorption peak at 3421 cm−1 is caused by O–H and N–H stretching vibrations,25 indicating the formation of carboxyl groups that occurred during BC oxidation.18 The absorption peak at 1340 cm−1 is caused by C–N stretching, which is due to the oxidation of HNO3.32 For BC-NH2, the absorption peak at 1606 cm−1 is caused by the N–H group of the cross-linking reaction, and the absorption peak at 1539 cm−1 is caused by the bending vibration of the N–H bond in the amide group.36 The absorption peak at 899 cm−1 is caused by the stretching vibration of the C–H bond.3 The absorption peak at 806 cm−1 is caused by the bending vibration of the C–H bond in the imidazole ring. The absorption peaks at 2970 cm−1 and 2870 cm−1 were caused by the stretching vibration of C–H, indicating that the PEI-modified chitosan was successfully compounded with BC-COOH.37 The broad overlapping peak shifted to 3280 cm−1 after the compounding of biochar with PEI-modified chitosan due to the introduction of a large number of amine groups into the surface and the fact that chitosan is rich in hydroxyl groups. Amide groups appeared at 1606 cm−1 and 1539 cm−1 in the course of the Ugi reaction.36 The carboxylate C
O peak at 1715 cm−1 than BC,34 and the absorption peak at 3421 cm−1 is caused by O–H and N–H stretching vibrations,25 indicating the formation of carboxyl groups that occurred during BC oxidation.18 The absorption peak at 1340 cm−1 is caused by C–N stretching, which is due to the oxidation of HNO3.32 For BC-NH2, the absorption peak at 1606 cm−1 is caused by the N–H group of the cross-linking reaction, and the absorption peak at 1539 cm−1 is caused by the bending vibration of the N–H bond in the amide group.36 The absorption peak at 899 cm−1 is caused by the stretching vibration of the C–H bond.3 The absorption peak at 806 cm−1 is caused by the bending vibration of the C–H bond in the imidazole ring. The absorption peaks at 2970 cm−1 and 2870 cm−1 were caused by the stretching vibration of C–H, indicating that the PEI-modified chitosan was successfully compounded with BC-COOH.37 The broad overlapping peak shifted to 3280 cm−1 after the compounding of biochar with PEI-modified chitosan due to the introduction of a large number of amine groups into the surface and the fact that chitosan is rich in hydroxyl groups. Amide groups appeared at 1606 cm−1 and 1539 cm−1 in the course of the Ugi reaction.36 The carboxylate C![[double bond, length as m-dash]](https://www.rsc.org/images/entities/char_e001.gif) O peak moves from 1715 cm−1 to 1707 cm−1, and the vibrational intensity decreased, so the carboxylate group was involved in the multicomponent Ugi reaction to produce the amide group. The absorption peak at 1097 cm−1 is the C–O peak. Therefore, the PEI-modified chitosan successfully functionalized biochar.
O peak moves from 1715 cm−1 to 1707 cm−1, and the vibrational intensity decreased, so the carboxylate group was involved in the multicomponent Ugi reaction to produce the amide group. The absorption peak at 1097 cm−1 is the C–O peak. Therefore, the PEI-modified chitosan successfully functionalized biochar.
![[double bond, length as m-dash]](https://www.rsc.org/images/entities/char_e001.gif) O, centered at binding energies of 284.8 eV, 285.64 eV and 288.19, respectively,25 with an increase in oxygen content from 28.66% to 38.01%, and the presence of the O–C
O, centered at binding energies of 284.8 eV, 285.64 eV and 288.19, respectively,25 with an increase in oxygen content from 28.66% to 38.01%, and the presence of the O–C![[double bond, length as m-dash]](https://www.rsc.org/images/entities/char_e001.gif) O peak indicated the successful carboxylation of the biochar. The N 1s spectrum consisted of two fitted peaks, including those attributed to –NH2 and –NO2, centered on binding energies of 400.09 eV and 405.51 eV, respectively;35 these functional groups were are obtained from the oxidation of HNO3, which made the nitrogen content significantly higher.
O peak indicated the successful carboxylation of the biochar. The N 1s spectrum consisted of two fitted peaks, including those attributed to –NH2 and –NO2, centered on binding energies of 400.09 eV and 405.51 eV, respectively;35 these functional groups were are obtained from the oxidation of HNO3, which made the nitrogen content significantly higher.
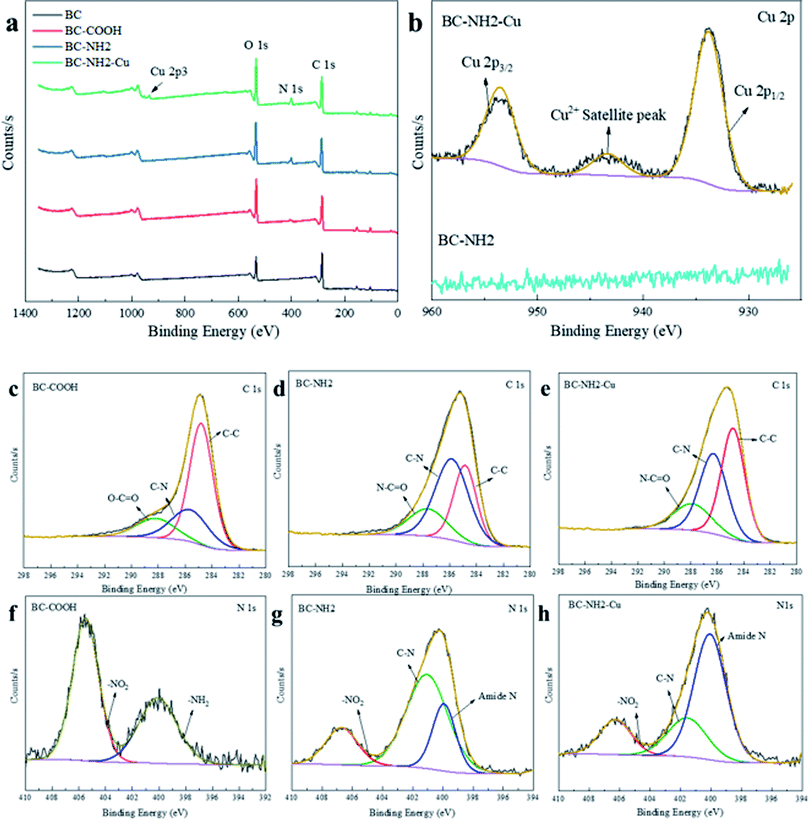 | ||
| Fig. 3 XPS spectrum survey (a); Cu 2p (b); C 1s XPS spectra of BC-COOH (c), BC-NH2 (d), BC-NH2-Cu (e); N 1s XPS spectra of BC-COOH (f), BC-NH2 (g), BC-NH2-Cu (h). | ||
For BC-NH2, the C 1s spectrum consisted of C–C, C–N and N–C![[double bond, length as m-dash]](https://www.rsc.org/images/entities/char_e001.gif) O fitting peaks centered at binding energies of 284.8 eV, 285.83 eV and 287.63 eV, respectively.38 The N 1s spectrum consisted of three fitted peaks, including those attributed to amide N, C–N and –NO2, centered at binding energies of 399.92 eV, 401.05 and 406.70 eV, respectively. New peaks that were not present in the BC-COOH spectrum, N–C
O fitting peaks centered at binding energies of 284.8 eV, 285.83 eV and 287.63 eV, respectively.38 The N 1s spectrum consisted of three fitted peaks, including those attributed to amide N, C–N and –NO2, centered at binding energies of 399.92 eV, 401.05 and 406.70 eV, respectively. New peaks that were not present in the BC-COOH spectrum, N–C![[double bond, length as m-dash]](https://www.rsc.org/images/entities/char_e001.gif) O, amide N and C–N, appear.39,40 Additionally, the N content increased from 3.48% to 6.78%, indicating the success of the PEI-modified chitosan composite BC-COOH, and the disappearance of the –NH2 peak was precisely due to the multicomponent Ugi reaction that led to the reduction of the amino group and the generation of amide N and C–N bounds. The decrease in oxygen content from 38.01% to 33.14% was due to the decrease in the –NO2 peak area, while its binding energy shifted from 405.51 eV to 406.70 eV, indicating its possible involvement in the reaction. The C 1s spectrum for BC-NH2-Cu showed fitted peaks of C–C, C–N and N–C
O, amide N and C–N, appear.39,40 Additionally, the N content increased from 3.48% to 6.78%, indicating the success of the PEI-modified chitosan composite BC-COOH, and the disappearance of the –NH2 peak was precisely due to the multicomponent Ugi reaction that led to the reduction of the amino group and the generation of amide N and C–N bounds. The decrease in oxygen content from 38.01% to 33.14% was due to the decrease in the –NO2 peak area, while its binding energy shifted from 405.51 eV to 406.70 eV, indicating its possible involvement in the reaction. The C 1s spectrum for BC-NH2-Cu showed fitted peaks of C–C, C–N and N–C![[double bond, length as m-dash]](https://www.rsc.org/images/entities/char_e001.gif) O centered at binding energies of 284.8 eV, 286.30 eV and 287.92 eV, respectively.
O centered at binding energies of 284.8 eV, 286.30 eV and 287.92 eV, respectively.
3.2. Adsorption of Cu(II)
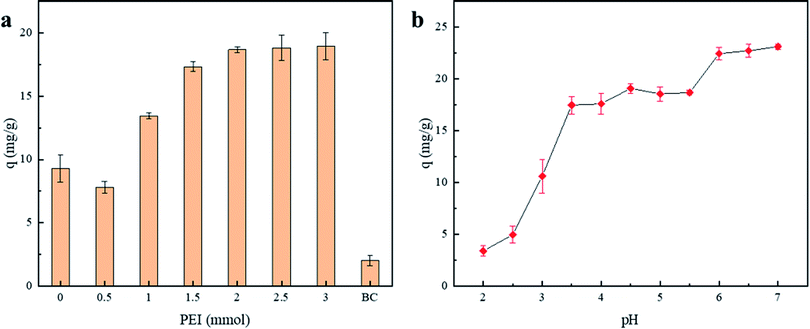
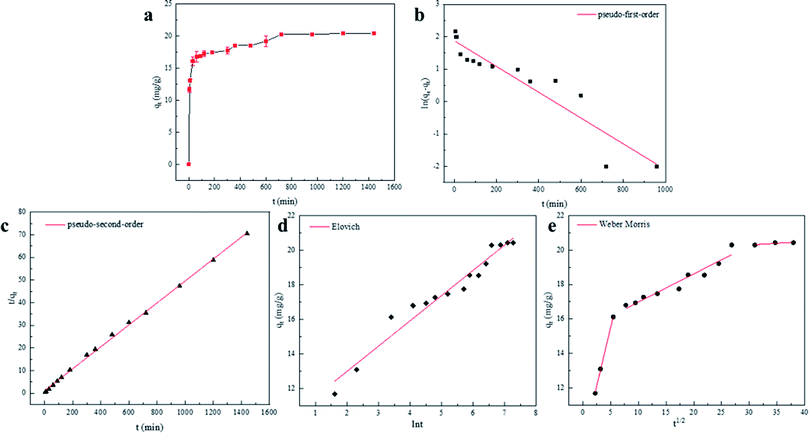
As adsorption, the active site gradually chelated with Cu(II), the adsorption rate decreased, and eventually, the active site reached saturation and tended to equilibrium. Therefore, 720 min was identified as the time at which the adsorption reached equilibrium. The maximum adsorption capacity of BC-NH2 was 20.43 mg g−1, while that of BC was only 2.02 mg g−1. To further explore the material adsorption mechanism of Cu(II), the obtained data were fitted to a pseudo-first-order kinetic model, pseudo-second-order kinetic model, Elovich kinetic model and Weber Morris diffusion model for the study. The mathematical expressions of the kinetic models are as follows:
ln(qe − qt) = ln![[thin space (1/6-em)]](https://www.rsc.org/images/entities/char_2009.gif) qe − k1t qe − k1t
| (3) |
 | (4) |
 | (5) |
 | (6) |
The linear models fitted by the pseudo-first-order model, pseudo-second-order model, Elovich model and Weber Morris diffusion model are shown in Fig. 6. According to the coefficients of determination (R2), the pseudo-second-order model (R2 = 0.999) has a better correlation than the pseudo-first-order model (R2 = 0.874). Moreover, the maximum adsorption capacity calculated by the pseudo-second-order model when the adsorption reached equilibrium was 20.64 mg g−1, which was closer to the experimental maximum adsorption capacity of 20.43 mg g−1. Therefore, it was determined that the adsorption of Cu(II) by BC-NH2 was controlled by the pseudo-second-order kinetic model, and the adsorption of Cu(II) by BC-NH2 was caused by chemisorption with exchange or sharing of electrons between the adsorbent and the adsorbed material.45
Although the pseudo-second-order model can better describe the kinetics of Cu(II) adsorption by BC-NH2, the coefficients of determination of the Elovich model (R2 = 0.959) and the Weber Morris diffusion model are also higher than that of the pseudo-first-order model (R2 = 0.874), and the initial adsorption rate α of BC-NH2 is 1.43 × 10³ mg g−1 min−1, which is larger. Therefore, BC-NH2 can promote the adsorption of Cu(II).41 As shown in Fig. 6e, the Weber Morris diffusion model can be divided into three phases, which suggests that the adsorption of Cu(II) involves multiple kinetic mechanisms. The first stage can be attributed to the external mass transport across the solid phase boundary, which is controlled by boundary layer diffusion. The second phase is the slow adsorption phase, in which intraparticle diffusion determines the adsorption rate. The third stage is the equilibrium stage. Since C is not equal to zero in all three phases, intraparticle diffusion is involved in the adsorption process but is not the only rate-controlling step.2 Based on the above results, the pseudo-second-order kinetic model can better describe the adsorption process, where the adsorption process of Cu(II) is dominated by chemical processes on the adsorbent surface.
 | (7) |
 | (8) |
ln![[thin space (1/6-em)]](https://www.rsc.org/images/entities/char_2009.gif) Qe = ln Qe = ln![[thin space (1/6-em)]](https://www.rsc.org/images/entities/char_2009.gif) Qmax − Yε2 Qmax − Yε2
| (9) |
 | (10) |
 | (11) |
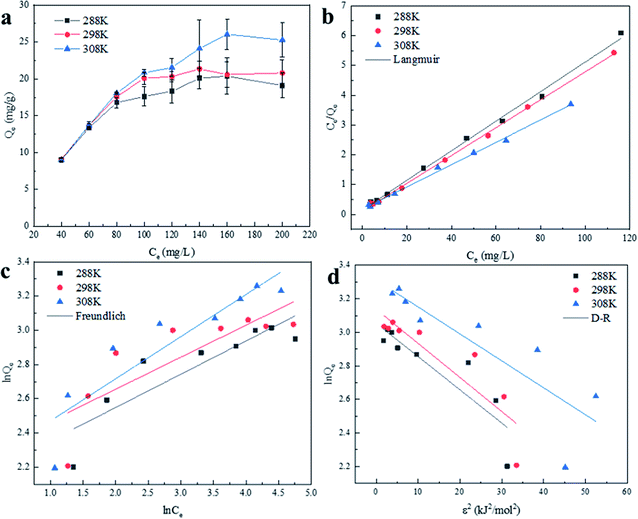
Table 1 shows the relevant parameters of the three models. It is clear that the coefficient of determination of the Langmuir isotherm (R2) is greater than that of the Freundlich isotherm and D–R isotherm models. This indicates that the Langmuir isotherm model can better describe the adsorption equilibrium, which suggests that the adsorption of Cu(II) on BC-NH2 is monolayer adsorption. Moreover, the adsorption capacity of BC-NH2 for Cu(II) increased from 20.17 mg g−1 to 26.67 mg g−1 with increasing temperature, indicating that the temperature increase is beneficial for adsorption. In addition, the value of 1/n in the Freundlich isotherm model was less than 1 at different temperatures, indicating that the adsorption process of Cu(II) by BC-NH2 was favorable.3
| T (K) | Langmuir | Freundlich | Dubinin–Redushkevich | ||||||
|---|---|---|---|---|---|---|---|---|---|
| Qmax (mg g−1) | KL (L mg−1) | R2 | KF (mg1−1/n g−1 L1/n) | n | R2 | Qmax (mg g−1) | E (kJ mol−1) | R2 | |
| 288 | 20.17 | 0.3169 | 0.996 | 8.6691 | 5.141 | 0.784 | 21.18 | 5.02 | 0.784 |
| 298 | 21.39 | 0.4293 | 0.999 | 9.7925 | 5.345 | 0.670 | 23.028 | 4.96 | 0.795 |
| 308 | 26.67 | 0.2182 | 0.997 | 9.2484 | 4.062 | 0.824 | 27.428 | 5.58 | 0.745 |
In addition, the free energy (E) of the D–R model was used to determine whether the adsorption process of Cu(II) was physical or chemical adsorption. Usually, E < 8 kJ mol−1 indicates that adsorption is a physical adsorption process, while E = 8–16 kJ mol−1 indicates that adsorption is a chemical ion exchange process.46 The free energy of the D–R model was calculated to be less than 8 kJ mol−1 at 288 K, 298 K and 308 K. However, the correlation was low, so physical adsorption process occurred. Combined with the discussion on the effect of pH, Cu(II) is mainly adsorbed on the surface of the adsorbent by electrostatic attraction with a –NH2 chelate monolayer. Therefore, the adsorption of Cu(II) by BC-NH2 includes both chemical adsorption and physical adsorption.
As shown in Table 2, the adsorption capacity of BC-NH2 is higher compared to other amino-modified adsorbents or commercial adsorbents reported in previous Cu(II) removal studies. Because biomass energy is abundant, the price is low, and the multicomponent Ugi reaction is atomically economical, although its adsorption capacity is not very high, its ability to remove heavy metals is still very attractive.
 | ||
| Fig. 8 (a) van't Hoff plot of Cu(II) adsorption on BC-NH2; (b) the effect of competitive cations on Cu(II) adsorption by BC-NH2; (c) adsorption–regeneration cycles of BC-NH2 for Cu(II) removal. | ||
Temperature is an important factor in the adsorption of Cu(II) at the solid–liquid interface. To elucidate the adsorption properties, thermodynamic parameters such as Gibbs free energy change (ΔG0), enthalpy change (ΔH0) and entropy change (ΔS0) at different temperatures were calculated using the following equations:
ΔG0 = −RT![[thin space (1/6-em)]](https://www.rsc.org/images/entities/char_2009.gif) ln ln![[thin space (1/6-em)]](https://www.rsc.org/images/entities/char_2009.gif) K0 K0
| (12) |
| ΔG0 = ΔH0 − TΔS0 | (13) |
 | (14) |
![[thin space (1/6-em)]](https://www.rsc.org/images/entities/char_2009.gif) K versus 1/T. The adsorption equilibrium constant K0 was calculated by plotting ln
K versus 1/T. The adsorption equilibrium constant K0 was calculated by plotting ln![[thin space (1/6-em)]](https://www.rsc.org/images/entities/char_2009.gif) Kd against Ce and extrapolating Ce to zero.
Kd against Ce and extrapolating Ce to zero.
Fig. 8a shows the linear plot of ln![[thin space (1/6-em)]](https://www.rsc.org/images/entities/char_2009.gif) K0 versus 1/T for Cu(II) adsorption on BC-NH2. The ΔG0 values were −17.97 kJ mol−1, −19.17 kJ mol−1 and −20.33 kJ mol−1 at 288 K, 298 K and 308 K, respectively. The ΔH0 and ΔS0 were 16.01 kJ mol−1 and 117.99 kJ mol−1, respectively. The positive values of ΔH0 and negative values of ΔG0 for Cu(II) adsorption indicate that Cu(II) adsorption on BC-NH2 absorbs heat and is a spontaneous process. Meanwhile, the positive value of ΔS0 reflects the better affinity of the BC-NH2 for Cu(II). The change in Gibbs free energy increases with increasing of temperature, indicating that the driving force of the reaction is amplified.48
K0 versus 1/T for Cu(II) adsorption on BC-NH2. The ΔG0 values were −17.97 kJ mol−1, −19.17 kJ mol−1 and −20.33 kJ mol−1 at 288 K, 298 K and 308 K, respectively. The ΔH0 and ΔS0 were 16.01 kJ mol−1 and 117.99 kJ mol−1, respectively. The positive values of ΔH0 and negative values of ΔG0 for Cu(II) adsorption indicate that Cu(II) adsorption on BC-NH2 absorbs heat and is a spontaneous process. Meanwhile, the positive value of ΔS0 reflects the better affinity of the BC-NH2 for Cu(II). The change in Gibbs free energy increases with increasing of temperature, indicating that the driving force of the reaction is amplified.48
4. Adsorption mechanism
As shown in Fig. 2a, after BC-NH2 adsorbs Cu(II), the FTIR spectrum changed. The NH peak shifted from 1606 cm−1 to 1598 cm−1, and the bending vibration peak of N–H shifted from 1539 cm−1 to 1534 cm−1, indicating that during the adsorption of Cu(II) by BC-NH2, the Cu(II) chemically reacted with N–H.16 Fig. 3b shows the XPS spectra of BC-NH2 before and after the adsorption of Cu(II). It is obvious that the peak of Cu 2p appears only after the adsorption of Cu(II) by BC-NH2, indicating that BC-NH2 can successfully adsorb Cu(II). The Cu 2p3/2 peak was at 933.78 eV and the Cu 2p1/2 peak was at 953.50 eV after the adsorption of Cu(II),7 indicating that BC-NH2 can successfully adsorb Cu(II); in addition, strong shaking satellite lines appeared at 940–945 eV.50 The N 1s spectrum consisted of three fitted peaks, including amide N–H, C–N and –NO2 centered at 400.04 eV, 402.17 eV and 406.07 eV binding energies were centered. Both the C and N peaks shifted, indicating that both atoms are involved in the adsorption process. The chemical shifts of amide N and C–N are 0.12 eV and 0.53 eV with increased binding energy, indicating that N has an obvious tendency to lose electrons or share its lone pairs of electrons.35 The increase in binding energy is caused by the chelation of Cu(II) with the amide group.40 In summary, the chemisorption of Cu(II) ions on BC-NH2 is driven by the complexation between Cu(II) ions and the N atoms in the amide group.5. Conclusions
In this study, we achieved one-pot functionalization of biochar materials by Ugi multicomponent reaction and successfully prepared PEI-modified chitosan composite biochar materials as shown by SEM, EDS, BET, FTIR, TGA and XPS characterization. BC-NH2 exhibited good Cu(II) removal performance, while PEI could enhance Cu(II) adsorption. The pH of the solution had a significant effect on the removal performance, and the optimal pH range was 3.5–5.5. The adsorption process followed a pseudo-second-order model, and internal particle diffusion was not the only rate control step. The maximum adsorption of BC-NH2 calculated with the Langmuir model was 26.67 mg g−1, which was significantly higher than that of pristine biochar. The adsorption process of Cu(II) on BC-NH2 is heat-absorbing and spontaneous. The selectivity of BC-NH2 for K+ and Mg2+ was good, and the regeneration of BC-NH2 with NaOH was better than that with H2SO4. The adsorption performance still reached 89.25% of the maximum adsorption capacity after five adsorption–desorption cycles, but its recovery was difficult and needed further improvement. FTIR and XPS confirmed the successful generation of amide groups in the biochar composites, the nitrogen content was significantly increased, and the amide group of BC-NH2 chelated with Cu(II) during the adsorption process. In conclusion, compared with conventional functional modifications, this study provides a new, simple and effective method to economically combine reactive matrix atoms with biochar, offering a promising option for the preparation of composites that can effectively treat heavy metal-containing wastewater.Conflicts of interest
The authors declare no conflict of interest.Acknowledgements
This work was supported by the NSFC (Grant Number 21607113); the Natural Science Foundation of Tianjin City (Grant Number 17JCQNJC07700); and the National Key Research and Development Program-China (Grant Number 2017YFE0127200).References
- E. Demirbas, N. Dizge, M. T. Sulak and M. Kobya, Chem. Eng. J., 2009, 148, 480–487 CrossRef CAS.
- J. Dou, D. Gan, Q. Huang, M. Liu, J. Chen, F. Deng, X. Zhu, Y. Wen, X. Zhang and Y. Wei, Int. J. Biol. Macromol., 2019, 136, 476–485 CrossRef CAS PubMed.
- Y. Zhu, W. Fan, K. Zhang, H. Xiang and X. Wang, Sci. Total Environ., 2020, 709, 136154 CrossRef CAS PubMed.
- D. Zhou, Y. Wang, H. Wang, S. Wang and J. Cheng, J. Hazard. Mater., 2010, 174, 34–39 CrossRef CAS PubMed.
- Q. Zhou, X. Li, Y. Lin, C. Yang, W. Tang, S. Wu, D. Li and W. Lou, Water Res., 2019, 158, 171–181 CrossRef CAS PubMed.
- X. Li, W. L. Yang, H. He, S. Wu, Q. Zhou, C. Yang, G. Zeng, L. Luo and W. Lou, Bioresour. Technol., 2018, 251, 274–279 CrossRef CAS PubMed.
- C. Xiao, X. Liu, S. Mao, L. Zhang and J. Lu, Appl. Surf. Sci., 2017, 394, 378–385 CrossRef CAS.
- Y. Liu, D. Wang, M. Xue, R. Song, Y. Zhang, G. Qu and T. Wang, Sep. Purif. Technol., 2021, 257, 117885 CrossRef CAS.
- P. Goyal, C. S. Tiwary and S. K. Misra, J. Environ. Manage., 2021, 277, 111469 CrossRef CAS PubMed.
- D. Bożejewicz, B. Ośmiałowski, M. A. Kaczorowska and K. Witt, Membranes, 2021, 11, 233 CrossRef PubMed.
- X. Xiao, Y. Sun, J. Liu and H. Zheng, Sep. Purif. Technol., 2021, 267, 118628 CrossRef CAS.
- V. Ya, N. Martin, Y. Chou, S. Chen, K. Choo, V. Naddeo, N. C. Le and C. Li, Chemosphere, 2021, 264, 128573 CrossRef CAS PubMed.
- M. Mohsen-Nia, P. Montazeri and H. Modarress, Desalination, 2007, 217, 276–281 CrossRef CAS.
- T. Bandara, J. Xu, I. D. Potter, A. Franks, J. B. A. J. Chathurika and C. Tang, Chemosphere, 2020, 254, 126745 CrossRef CAS PubMed.
- M. Bilal, J. A. Shah, T. Ashfaq, S. M. H. Gardazi, A. A. Tahir, A. Pervez, H. Haroon and Q. Mahmood, J. Hazard. Mater., 2013, 263, 322–333 CrossRef CAS PubMed.
- G. Yang and H. Jiang, Water Res., 2014, 48, 396–405 CrossRef CAS PubMed.
- H. Demey, T. Vincent and E. Guibal, Chem. Eng. J., 2018, 332, 582–595 CrossRef CAS.
- N. Zhang, G. Zang, C. Shi, H. Yu and G. Sheng, J. Hazard. Mater., 2016, 316, 11–18 CrossRef CAS PubMed.
- A. Ayoub, R. A. Venditti, J. J. Pawlak, A. Salam and M. A. Hubbe, ACS Sustainable Chem. Eng., 2013, 1, 1102–1109 CrossRef CAS.
- J. Heinimö and M. Junginger, Biomass Bioenergy, 2009, 33, 1310–1320 CrossRef.
- R. Saidur, E. A. Abdelaziz, A. Demirbas, M. S. Hossain and S. Mekhilef, Renewable Sustainable Energy Rev., 2011, 15, 2262–2289 CrossRef CAS.
- J. O'Laughlin and K. McElligott, For. Policy Econ., 2009, 11, 535–536 CrossRef.
- J. Wang and S. Wang, J. Cleaner Prod., 2019, 227, 1002–1022 CrossRef CAS.
- L. Wang, Y. Wang, F. Ma, V. Tankpa, S. Bai, X. Guo and X. Wang, Sci. Total Environ., 2019, 668, 1298–1309 CrossRef CAS PubMed.
- L. Zhang, S. Tang, F. He, Y. Liu, W. Mao and Y. Guan, Chem. Eng. J., 2019, 378, 122215 CrossRef CAS.
- Y. Zhou, B. Gao, A. R. Zimmerman, J. Fang, Y. Sun and X. Cao, Chem. Eng. J., 2013, 231, 512–518 CrossRef CAS.
- X. Wang, J. Feng, Y. Cai, M. Fang, M. Kong, A. Alsaedi, T. Hayat and X. Tan, Sci. Total Environ., 2020, 708, 134575 CrossRef CAS PubMed.
- Y. Shi, T. Zhang, H. Ren, A. Kruse and R. Cui, Bioresour. Technol., 2018, 247, 370–379 CrossRef CAS PubMed.
- A. Dömling, W. Wang and K. Wang, Chem. Rev., 2012, 112, 3083–3135 CrossRef PubMed.
- R. C. Cioc, E. Ruijter and R. V. A. Orru, Green Chem., 2014, 16, 2958–2975 RSC.
- A. Rezaei, O. Akhavan, E. Hashemi and M. Shamsara, Biomacromolecules, 2016, 17, 2963–2971 CrossRef CAS PubMed.
- S. Javanbakht, M. Shadi, R. Mohammadian, A. Shaabani, M. Ghorbani, G. Rabiee and M. M. Amini, Mater. Chem. Phys., 2020, 247, 122857 CrossRef CAS.
- Z. Li, N. Sharma, U. K. Sharma, J. Jacobs, L. Van Meervelt and E. V. Van der Eycken, Chem. Commun., 2016, 52, 5516–5519 RSC.
- X. Song, H. Liu, L. Cheng and Y. Qu, Desalination, 2010, 255, 78–83 CrossRef CAS.
- X. Xie, H. Gao, X. Luo, T. Su, Y. Zhang and Z. Qin, J. Environ. Chem. Eng., 2019, 7, 103183 CrossRef.
- S. Deng and Y. Ting, Water Res., 2005, 39, 2167–2177 CrossRef CAS PubMed.
- S. Roy, S. Majumdar, G. C. Sahoo, S. Bhowmick, A. K. Kundu and P. Mondal, J. Hazard. Mater., 2020, 399, 122841 CrossRef CAS PubMed.
- S. Ravi, S. Zhang, Y. Lee, K. Kang, J. Kim, J. Ahn and W. Ahn, J. Ind. Eng. Chem., 2018, 67, 210–218 CrossRef CAS.
- A. Rezaei, O. Akhavan, E. Hashemi and M. Shamsara, Chem. Mater., 2016, 28, 3004–3016 CrossRef CAS.
- Q. Jiang, W. Xie, S. Han, Y. Wang and Y. Zhang, Colloids Surf., A, 2019, 583, 123962 CrossRef CAS.
- G. Prasannamedha, P. S. Kumar, R. Mehala, T. J. Sharumitha and D. Surendhar, J. Hazard. Mater., 2021, 407, 124825 CrossRef CAS PubMed.
- S. Chen, J. Wang, Z. Wu, Q. Deng, W. Tu, G. Dai, Z. Zeng and S. Deng, J. Colloid Interface Sci., 2018, 523, 110–120 CrossRef CAS PubMed.
- M. K. Aroua, C. Y. Yin, F. N. Lim, W. L. Kan and W. M. A. W. Daud, J. Hazard. Mater., 2009, 166, 1526–1529 CrossRef CAS PubMed.
- M. Liu, L. Jia, Z. Zhao, Y. Han, Y. Li, Q. Peng and Q. Zhang, Chem. Eng. J., 2020, 390, 124667 CrossRef CAS.
- Q. Wang, C. Zheng, Z. Shen, Q. Lu, C. He, T. C. Zhang and J. Liu, Chem. Eng. J., 2019, 359, 265–274 CrossRef CAS.
- Q. Hu and Z. Zhang, J. Mol. Liq., 2019, 277, 646–648 CrossRef CAS.
- S. Huang and D. Chen, J. Hazard. Mater., 2009, 163, 174–179 CrossRef CAS PubMed.
- Z. H. Khan, M. Gao, W. Qiu, M. S. Islam and Z. Song, Chemosphere, 2020, 246, 125701 CrossRef CAS PubMed.
- S. Wan, J. Wu, S. Zhou, R. Wang, B. Gao and F. He, Sci. Total Environ., 2018, 616–617, 1298–1306 CrossRef CAS PubMed.
- Y. Shao, Y. Gao, Q. Yue, W. Kong, B. Gao, W. Wang and W. Jiang, Chem. Eng. J., 2020, 379, 122384 CrossRef CAS.
| This journal is © The Royal Society of Chemistry 2021 |

