
 Open Access Article
 This Open Access Article is licensed under a Creative Commons Attribution-Non Commercial 3.0 Unported Licence
Biomass-derived O, N-codoped hierarchically porous carbon prepared by black fungus and Hericium erinaceus for high performance supercapacitor†
Xinxian Zhong a,
Quanyuan Maoa,
Zesheng Lib,
Zhigao Wuc,
Yatao Xied,
Shu-Hui Li*a,
Guichao Lianga and
Hongqiang Wang*a
a,
Quanyuan Maoa,
Zesheng Lib,
Zhigao Wuc,
Yatao Xied,
Shu-Hui Li*a,
Guichao Lianga and
Hongqiang Wang*a
aState Key Laboratory for the Chemistry and Molecular Engineering of Medicinal Resources, Guangxi Key Laboratory of Low Carbon Energy Materials, School of Chemistry and Pharmaceutical Sciences, Guangxi Normal University, Guilin, 541004, China. E-mail: gxnulsh@gxnu.edu.cn; whq74@mailbox.gxnu.edu.cn
bCollege of Chemistry, Guangdong University of Petrochemical Technology, Maoming, 525000, China
cGuangxi Vocational and Technical Institute of Industry, Nanning, 530005, China
dSchool of Materials Science and Engineering, Ocean University of China, Qingdao, 266100, China
First published on 17th August 2021
Abstract
Biomass-derived carbon materials have been widely researched due to their advantages such as low cost, environmental friendliness, readily available raw materials. Black fungus and Hericium erinaceus contain many kinds of amino acids. In this paper, unique O, N-codoped black fungus-derived activated carbons (FACX), and Hericium erinaceus-derived activated carbons (HACX) were prepared by KOH chemical activation under different temperatures without adding additional reagents containing nitrogen and oxygen functional groups, respectively. As electrode materials of symmetric supercapacitors, FAC2 and HAC2 calcined at 800 °C exhibited the highest specific capacitance of 209.3 F g−1 and 238.6 F g−1 at 1.0 A g−1 in the two-electrode configuration with 6.0 M KOH as the electrolyte, respectively. The X-ray photoelectron spectroscopy confirmed that the as-synthesized FACX and HACX contained small amounts of nitrogen and oxygen elements. Moreover, heteroatom-doped FAC2 and HAC2 electrode materials shown excellent rate performance (84.1% and 75.0% capacitance retention at 20 A g−1, respectively). By comparison, the oxygen-rich hierarchical porous carbon (HAC2) shows higher specific capacitance and energy density and longer cycling performance. Nevertheless, carbon-rich hierarchical porous carbon (FAC2) indicates excellent rate performance. Biomass-derived heteroatom self-doped porous carbons are expected to become ideal active materials for high performance supercapacitor.
Introduction
With the rapid development of modern society, the increasing demand for renewable energy has stimulated great interest in electrochemical energy conversion and storage.1,2 Supercapacitors are also called electrochemical capacitors, and are widely recognized as promising energy storage systems because of their unique properties such as high power density, fast charge–discharge rate, outstanding cycling stability and environmental friendliness. These advantages of supercapacitors can make up the shortage of conventional capacitors and batteries in many application fields.3,4 Meanwhile, the electrochemical performance of supercapacitors mainly depends on the electrode materials, and their physicochemical properties are a crucial and vital factor for supercapacitors. Therefore, searching for excellent electrode materials will greatly facilitate the future developments of supercapacitors.5–8Carbon materials, conducting polymers9 and metal oxides10 as electrode materials of supercapacitors have been widely studied. Though conducting polymers and metal oxides have high theoretical specific capacitance due to their pseudocapacitance property, depending on the fast reversible redox reactions to storage energy,11 the low conductivity and high cost are the main drawbacks of metal oxides, and the conducting polymers structure suffers repetitive swelling and shrinkage during the progress of charge–discharge, and results in the decrease of the capacity and cycle life.12 However, carbon materials are the earliest and the most widely studied electrode materials of supercapacitors. According to the storage energy mechanism, carbon materials belong to electric double-layer capacitors (EDLC), whose storage energy depends on the ion absorption–desorption at the interface between the electrolyte and the electrode.13,14 Although the low energy density and the low theoretical specific capacitance, these carbon-based materials including activated carbon, carbon nanotubes, graphene, carbon nanofiber, porous carbon and their derivatives exhibit excellent performance such as good conductivity, high thermal stability, high specific surface area, meanwhile the low cost and abundant resources of carbon have attracted many researchers concentrating on new carbon materials.15–19
Biomass materials have been widely selected as precursors to fabricate porous carbon materials with different morphologies for supercapacitors.20 These biomass materials include rapeseed dregs,21 loofah sponge,22 willow catkin,23 shiitake mushroom,24 potato starch,25 bamboo char,26 bacterial cellulose,27 walnut shell,28 tobacco rods,29 corn grain,30 rice husk,31 osmanthus flower,32 peanut shell,33 sunflower seed shell,34 corncob,35 cornstalk,36 etc. Most biomass-derived carbon materials as mentioned above possess an excellent electrochemical capacitive performance. Cheng et al. reported a hierarchically porous carbon (the specific surface area reaches up to 2988 m2 g−1) via H3PO4 carbonization and KOH activation from natural shiitake mushroom for supercapacitor, which exhibits a specific capacitance of 306 F g−1 at 1.0 A g−1 in three-electrode cell with 6.0 M KOH as electrolyte and delivers a specific capacitance of 238 F g−1 at 0.2 A g−1 in a two-electrode cell.24 Zou et al. prepared a high-performance porous carbon (the specific surface area is 1463 m2 g−1) by KOH activation from osmanthus flower and applied it for supercapacitor, which displays the best specific capacitance of 255 F g−1 at 1.0 A g−1 in there-electrode cell using 6.0 M KOH as electrolyte.32 Xu et al. improved an activated method of porous carbons derived from agricultural waste biomass corncobs via facile KOH solution soaking at room temperature prior to a one-step carbonization process.35 The obtained porous carbon showed a high capacity of 394.9 F g−1 at a current density of 1.0 A g−1 in there-electrode system in a 6.0 M KOH aqueous electrolyte solution and the specific capacitance of the porous carbons-based supercapacitor measured under two-electrode configuration is 247 F g−1 at 0.5 A g−1. Thus, hierarchical porous carbon can not only provide high specific surface area to store energy, but also shorten the diffusion distance of ions, which are beneficial to increasing the specific capacitance of supercapacitor.37
Furthermore, the electrochemical performance of porous carbon for supercapacitor usually could be improved by doping heteroatoms (e.g., N, O and S atoms) in carbon framework. Especially, the oxygen and nitrogen functional groups can improve the surface wettability to promote the access of electrolyte and offer extra pseudocapacitance during charging and discharging process.38–42 Therefore, developing a convenient method to prepare hierarchical porous carbon with suitable heteroatom functional groups is highly desirable for high performance supercapacitor.
Herein, we select black fungus and Hericium erinaceus containing rich protein and amino acid as resources of carbon to prepare oxygen and nitrogen codoped hierarchical porous carbon. In this work, black fungus-derived activated carbons (FACX) and Hericium erinaceus-derived activated carbons (HACX) were obtained by carbonization and KOH chemical activation under different temperature, respectively. The heteroatom-doped FAC2 and HAC2 calcined at 800 °C demonstrate porous 3D structure, moderate graphization degree and satisfied specific surface area, meanwhile FAC2 and HAC2 as electrode materials of supercapacitor exhibit excellent electrochemical performance.
Experimental
Fabrication of carbon materials
The preparation process schematic of FACX and HACX porous activated carbons is demonstrated in Fig. 1. Firstly, the black fungus and Hericium erinaceus bought from the market were ground by crushing mill, then were washed with distilled water and dried at 80 °C in vacuum oven, successively. Secondly, the desiccated black fungus and Hericium erinaceus powders were put into tube furnace and treated at 500 °C for 60 min under Ar atmosphere with a heating rate of 5 °C min−1, respectively. The carbonized black fungus and Hericium erinaceus were washed with 1.0 M NaOH and 95% ethanol to remove metal ions and organic deposition within the products, respectively. The initial products were activated with KOH (KOH mixed with the initial product in a mass ratio of 3![[thin space (1/6-em)]](https://www.rsc.org/images/entities/char_2009.gif) :1), then were calcined at 600 °C, 800 °C and 1000 °C with a heating rate of 2 °C min−1 under Ar atmosphere for 120 min, respectively. Finally, these obtained coarse products were washed with 1.0 M HCl and distilled water to remove excess KOH and dried in vacuum oven for 24 h. The as-obtained products were denoted as FACX and HACX, where X = 1, 2 and 3 correspond to the temperature 600 °C, 800 °C and 1000 °C, respectively.
:1), then were calcined at 600 °C, 800 °C and 1000 °C with a heating rate of 2 °C min−1 under Ar atmosphere for 120 min, respectively. Finally, these obtained coarse products were washed with 1.0 M HCl and distilled water to remove excess KOH and dried in vacuum oven for 24 h. The as-obtained products were denoted as FACX and HACX, where X = 1, 2 and 3 correspond to the temperature 600 °C, 800 °C and 1000 °C, respectively.
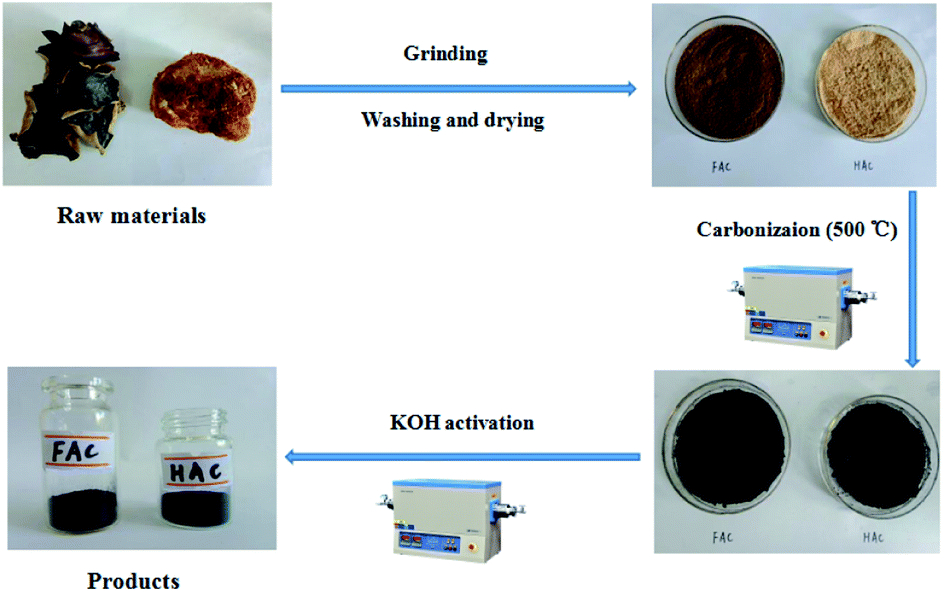 | ||
| Fig. 1 Preparation process schematic of FACX and HACX. | ||
Electrochemical measurement
The fabrication procedure of electrode materials is as follows: carbon materials, polytetrafluoroethylene and carbon black were mixed together in a mass ratio of 8:1:1. Then they were dispersed into ethanol, stirred and heated into paste, later the paste was crushed about a thickness of 150 μm, the sheet was cut into electrodes with a diameter of 12 mm and then was dried under vacuum at 60 °C overnight. Then the symmetric button-type supercapacitor was assembled with polypropylene membrane as separator.
All the electrochemical tests were performed at the voltage range of 0–1.0 V in 6.0 M KOH aqueous solution at room temperature. The specific capacitance of two-electrode configuration was calculated based on the discharge curve according to the following formulas:
 | (1) |
 | (2) |
The energy density and power density of supercapacitor were calculated according to the following formulas:
 | (3) |
 | (4) |
Results and discussion
Materials characterization
The morphologies of FACX and HACX are demonstrated in Fig. 2. It is apparent that activation temperature has a great influence on morphology and pore size of as-prepared carbon materials. There are only some shallow pores on the surface of bulk and thick FAC1 (shown in Fig. 2a) and HAC1 (shown in Fig. 2d), which the initial products were activated at 600 °C. When the activation temperature increased to 800 °C, the as-obtained FAC2 (shown in Fig. 2b) and HAC2 (shown in Fig. 2e) emerge more pores, HAC2 possesses more abundant pores with different sizes than FAC2 and presents distinct three-dimensional network. From Fig. 2c and f, we can observe that more nano graphite sheets appear with the further increase of activation temperature to 1000 °C, which indicates that part of the bulk carbon matrix converted to flake graphite carbon.43 FAC3 has large and folded graphite carbon layers with some pores, and HAC3 has more graphite carbon fragments and pores. These unique structures are useful for forming a double-layer interface between electrode and electrolyte solution, which benefit for the rapid diffusion of electrolyte ions from the surface into the interiors of FACX and HACX electrodes and reducing the resistance during the charge–discharge process.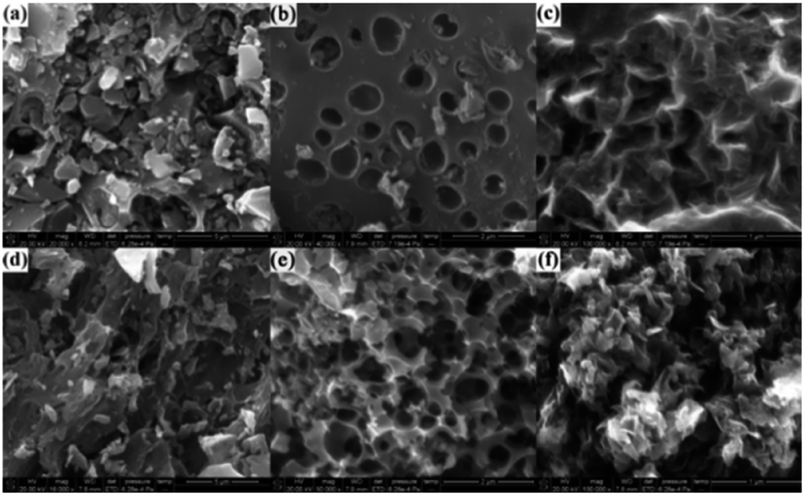 | ||
| Fig. 2 SEM images of (a) FAC1, (b) FAC2, (c) FAC3, (d) HAC1, (e) HAC2 and (f) HAC3. | ||
The nitrogen adsorption and desorption isotherms of FACX and HACX are showed in Fig. 3a and c. It is obvious that the isotherm of FAC1 belongs to the type-I, which means a typical microporous material, and the specific surface area of FAC1 is 363.5 m2 g−1, the average pore diameter is 0.889 nm. When the activation temperature reached at 800 °C or 1000 °C, the isotherms of FAC2 and FAC3 change to the combination of type-I curve and type-IV curve, which show typical feature of micropores and mesopores. It demonstrates that the two materials consist of both microporous structure and mesoporous structure,44 the specific surface area of FAC2 and FAC3 are 1227.3 m2 g−1 and 1501.6 m2 g−1, respectively, corresponding average pore size are 1.278 nm and 1.332 nm. However, HACX materials all present the combined I/IV type isotherms, which are different from that of FACX. And the specific surface area of HAC1, HAC2 and HAC3 are 957.2 m2 g−1, 1362.0 m2 g−1 and 1667.5 m2 g−1, respectively, which are higher than that of FACX. Their corresponding average pore diameters are 1.030 nm, 1.186 nm and 1.352 nm, respectively. These materials, except FAC1, possess interconnected hierarchical porous structure, which is beneficial to improving the supercapacitive performance. Studies have shown that micropores can offer a larger specific surface area to absorb electrolyte ions, mesopores can be used as rapid channels for ionic diffusion.39
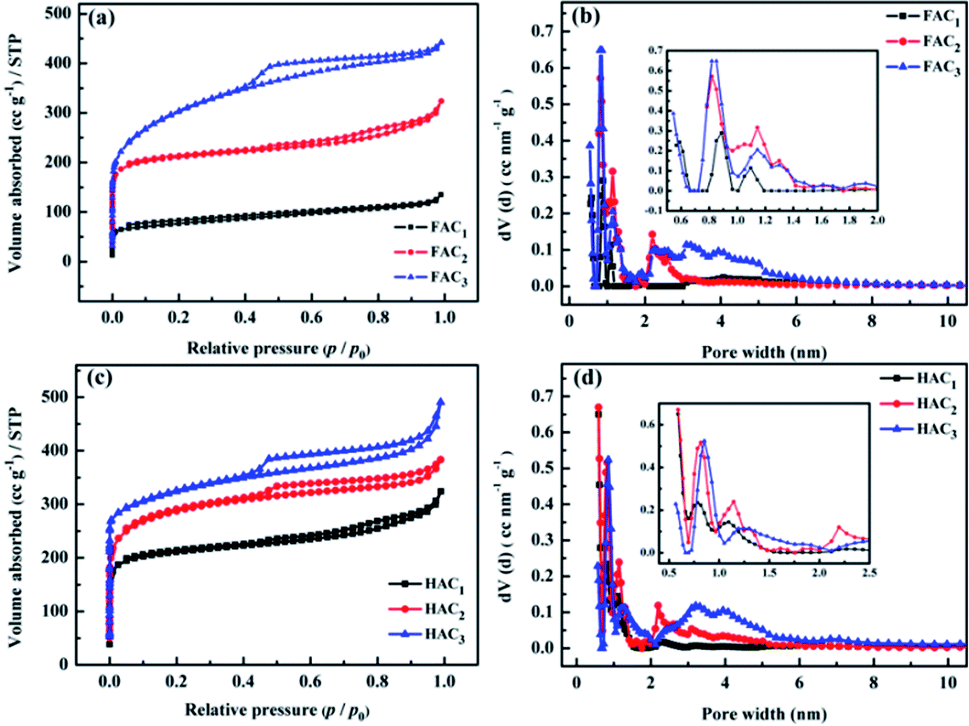 | ||
| Fig. 3 (a and c) N2 adsorption–desorption isotherms and (b and d) pore size distributions of FACX and HACX. | ||
The pore size distribution (shown in Fig. 3b and d) was obtained by DFT method. It is apparent that the pore size distributions of FAC1 and HAC1 are mainly focused on the range of microporous (below 2 nm), while FAC2, FAC3, HAC2 and HAC3 possess some small mesoporous, which are distributed at around 2–4 nm. In addition, the values of specific surface area and pore volume of FACX and HACX samples are showed in Table S1 (ESI†). According to these results, it can be seen that with the activation temperature increasing from 600 °C to 1000 °C, the BET area, micropore area, total pore volume and mesoporous number of FACX and HACX samples increase gradually, FAC3 and HAC3 possess the maximum specific surface area of 1501.6 m2 g−1 and 1667.5 m2 g−1, respectively. Though the average pore diameter of HAC2 is smaller than that of FAC2, the specific surface area and pore volume of HAC2 are higher than that of FAC2. The high specific surface area and suitable number of microporous and mesoporous have a crucial effect on supercapacitor energy storage.45,46 The rich pore structure provides more active sites and electron transport channels for electrolyte ions, meanwhile improves the utilization rate of the active substance of the electrode. The hydrated cations such as K+ and H+ can easily get through these unique channels and contribute to energy storage because the sizes of bare and hydrated cations of electrolytes are smaller than 1 nm.47 Therefore, it is predicted that the HAC2 may exhibits better electrochemical capacitance than other samples because of the smaller pore size, the higher specific surface area and higher micropore volume as well as suitable mesopore.32
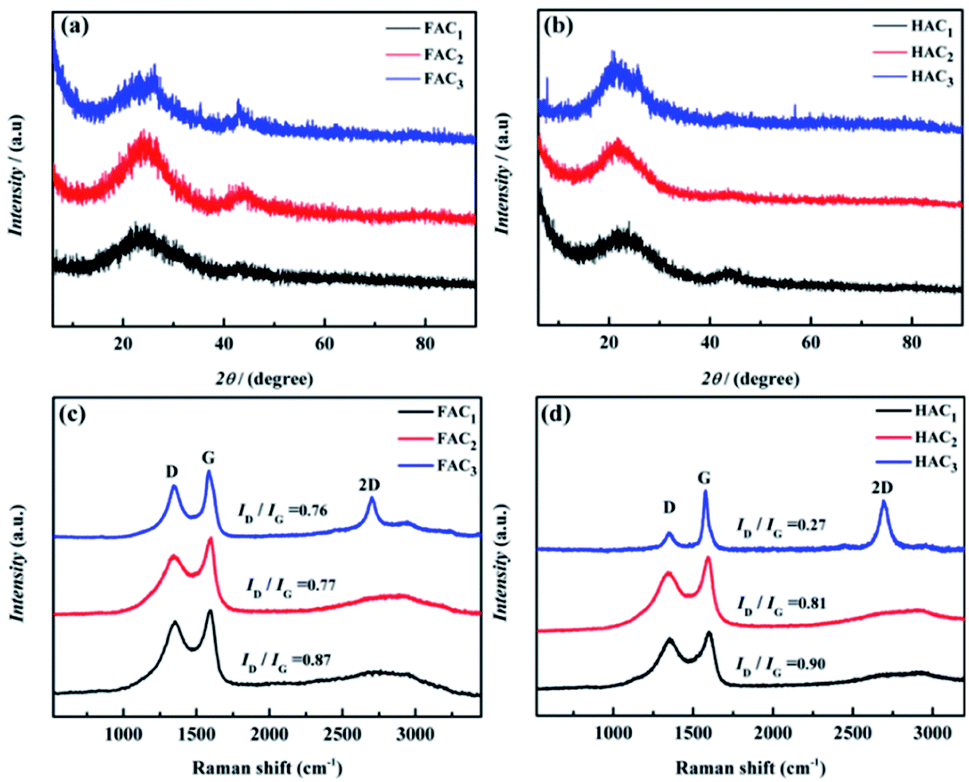
The crystal structures of FACX and HACX were further confirmed by XRD analysis and are displayed in Fig. 4a and b. It is obvious that the prepared carbon materials all present characteristic graphitic peaks located at around 24.7° and 43.7°, which can be ascribed to C (002) and C (101) plane reflection,16,21,48,49 respectively. The high intensity in the low angle region indicates higher graphitization degree, which may be ascribed to the existence of the abundant micropores in all the samples,49 is consistent with the N2 sorption results. From Fig. 4a, the peaks of FAC2 are very sharper, suggesting that it's crystalline and graphization degree improve. But the lower and enlarged width of peaks of FAC1 and FAC3 implies more amorphous nature of samples. In contrast with FACX, the C (002) peaks at around 24.7° of HACX resemble each other in shape. However, the peak at 43° of HACX is weakened gradually when the activation temperature became from 600 °C to 1000 °C, suggesting that the amorphous of HACX increased with the increasing of activation temperature.
 | ||
| Fig. 4 X-ray diffraction pattern of (a) FACX and (b) HACX, and Raman spectroscopy of (c) FACX and (d) HACX. | ||
The graphitic structure of FACX and HACX was also characterized by Raman spectra (shown in Fig. 4c and d). Two featured peaks at around 1340 cm−1 (D-band) and 1600 cm−1 (G-band) can be observed among all of these carbon materials, which are attributed to the defective carbon crystallites and the vibration of sp2 carbon atoms,50 respectively. It is interesting that FAC3 and HAC3 are detected second-order 2D peaks at around 2700 cm−1. The 2D-band is sensitive to the number of graphene layers, indicating that the two materials possess a few well-graphitized layers. The relative intensity ratio of D-band to G-band (ID/IG) is extensively adopted to evaluate the graphitization degree of carbon materials; the lower ID/IG value signifies the higher graphitization degree of the materials.51 It can be calculated that the ID/IG values of FAC1, FAC2 and FAC3 are 0.87, 0.77 and 0.76, respectively, meanwhile ID/IG values of HAC1, HAC2 and HAC3 are 0.90, 0.81 and 0.27, which indicate that the obtained carbon materials treated with higher activation temperature own better graphitization degree and lower crystal defects. The defect of hierarchical porous carbon can improve wettability, whereas carbon with the high graphitization degree can deliver a satisfying electrical conductivity and outstanding chemical stability. Hierarchical porous carbon with moderate ID/IG values may show high supercapacitive performance.
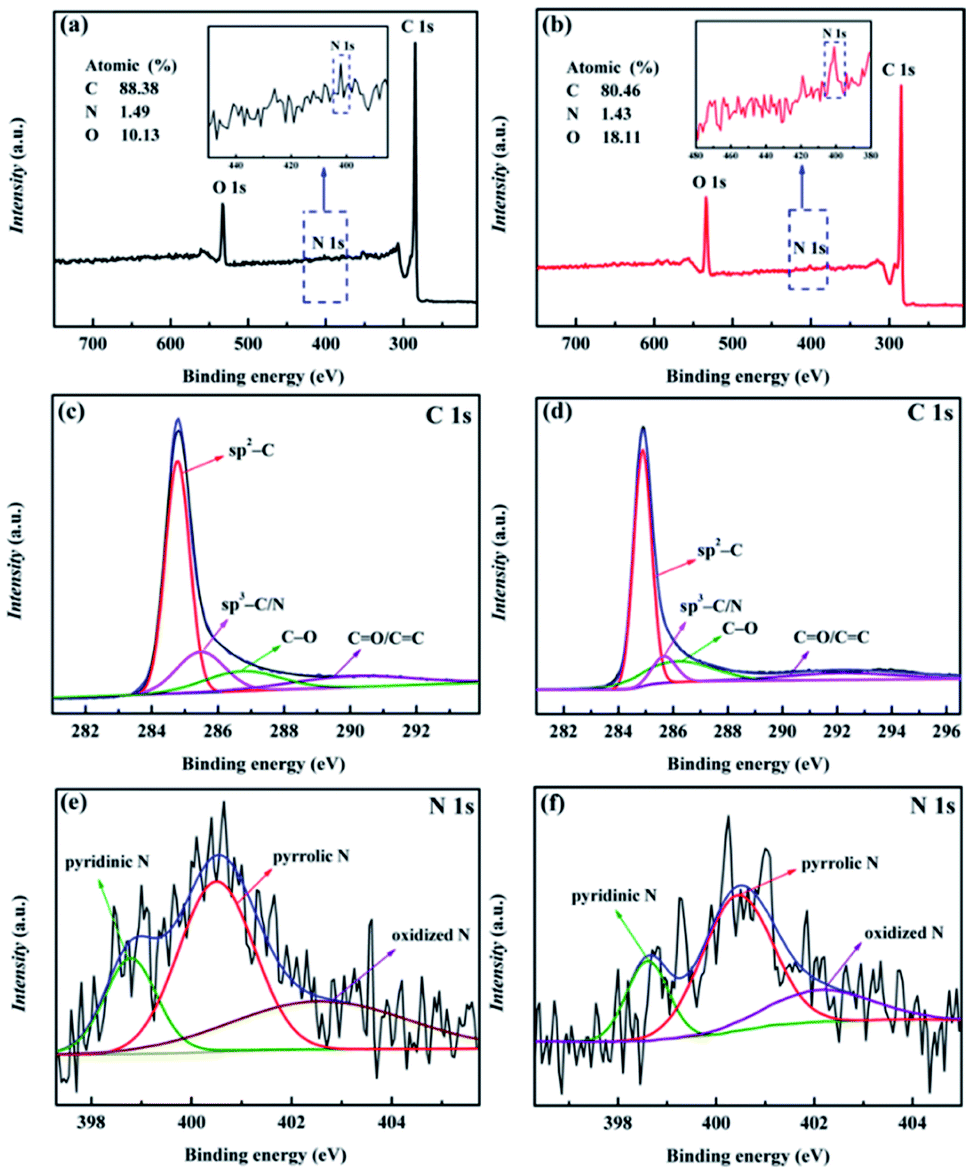
X-ray photoelectron spectroscopy (XPS) was carried out to analyze the main element and content of as-prepared FAC2 (shown in Fig. 5a) and HAC2 (shown in Fig. 5b). Three peaks concentrated at about 284.6, 401.0 and 533.2 eV are detected in the general spectroscopy, the values of these binding energy are corresponded to C 1s, N 1s and O 1s element, respectively. The fitting result of the spectrum indicates that FAC2 mainly contains carbon (∼88.38 at%) along with few amount of nitrogen (∼1.49 at%) and oxygen (∼10.13 at%), while the corresponding element content of HAC2 are 80.46 at%, 1.43 at% and 18.11 at%, respectively, indicating that the N element content of HAC2 is almost equal to that of FAC2 and the O element content of HAC2 is higher than that of FAC2. Fig. 5c and d show the C 1s spectra of FAC2 and HAC2, respectively. Both of them are differentiated into four peaks, which include sp2-C peak at 284.6 eV, sp3-C/N peak at 285.6 eV, C–O peak at 286.6 eV and C![[double bond, length as m-dash]](https://www.rsc.org/images/entities/char_e001.gif) O/CC peak at 289.8–291.8 eV, respectively. Furthermore, the N 1s spectra of FAC2 and HAC2 are shown in Fig. 5e and f, respectively, whose peaks located at 398.4, 400.3 and 402.7 eV can be assigned to pyridinic N (N-6), pyrrolic N (N-5) and oxidized N (N–X), which may be the decomposition product of organic ingredients. It is well known that oxygen and nitrogen functionalities could upgrade the surface wettability of carbon materials to facilitate the access of electrolyte and be involved in the faradaic reactions that enhance the pseudocapacitance of supercapacitor, which result in the better electrochemical performance.
O/CC peak at 289.8–291.8 eV, respectively. Furthermore, the N 1s spectra of FAC2 and HAC2 are shown in Fig. 5e and f, respectively, whose peaks located at 398.4, 400.3 and 402.7 eV can be assigned to pyridinic N (N-6), pyrrolic N (N-5) and oxidized N (N–X), which may be the decomposition product of organic ingredients. It is well known that oxygen and nitrogen functionalities could upgrade the surface wettability of carbon materials to facilitate the access of electrolyte and be involved in the faradaic reactions that enhance the pseudocapacitance of supercapacitor, which result in the better electrochemical performance.
 | ||
| Fig. 5 XPS spectra of (a) FAC2 and (b) HAC2; (c) C 1s and (e) N 1s of FAC2; (d) C 1s and (f) N 1s of HAC2. | ||
Electrochemical performance characterization
The electrochemical properties of the prepared FACX and HACX electrodes were respectively investigated under a two-electrode configuration with 6.0 M KOH aqueous solution as electrolyte. The CV curves of FACX and HACX measured at a sweep rate of 50 mV s−1 are shown in Fig. 6a and 7a. In Fig. 6a, it is obvious that the CV profiles of FAC2 electrode displays nearly rectangular, and the CV curve of FAC2 exhibits great current response and displays the largest area among the FACX, indicating that FAC2 possesses higher capacitance than FAC1 and FAC3. Moreover, there are no significant changes of rectangular characteristic of FAC2 (shown in Fig. 6b) with the scan rate increasing from 5 mV s−1 to 50 mV s−1. These indicate that FAC2 demonstrates better electrical double layer capacitor (EDLC) behaviour and excellent electrochemical reversibility during the stage of charge–discharge.52 By contrast, the shapes of CV curves of HACX (shown in Fig. 7a) measured at a sweep rate of 50 mV s−1 exhibit some similar and different characteristics from FACX, the CV profiles of HAC2 and HAC3 are quite similar to the rectangle profile of FAC3 and are different from that of FAC2, and HAC2 also displays the largest area among the HACX materials. The elliptical shape of FAC1 and HAC1 indicates that they remain charge transfer resistance during the charge–discharge progress.53 In addition, above results suggest that FAC2 and HAC2 fabricated at 800 °C exhibit better capacitance properties than those carbon materials fabricated at 600 °C or 1000 °C.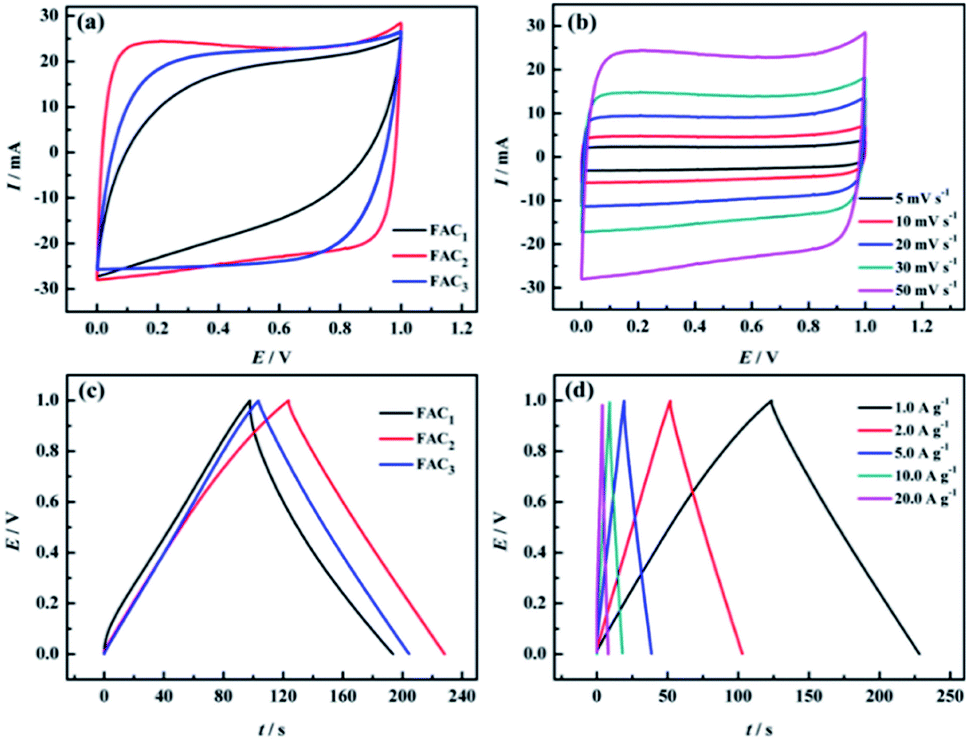 | ||
| Fig. 6 Electrochemical performance of FACX measured in two-electrode system in 6.0 M KOH electrolyte. (a) CV curves of FAC1, FAC2 and FAC3 at 50 mV s−1; (b) CV curves of FAC2 at different scan rates; (c) GCD curves of FAC1, FAC2 and FAC3 at 1.0 A g−1; (d) GCD curves of FAC2 at different current densities. | ||
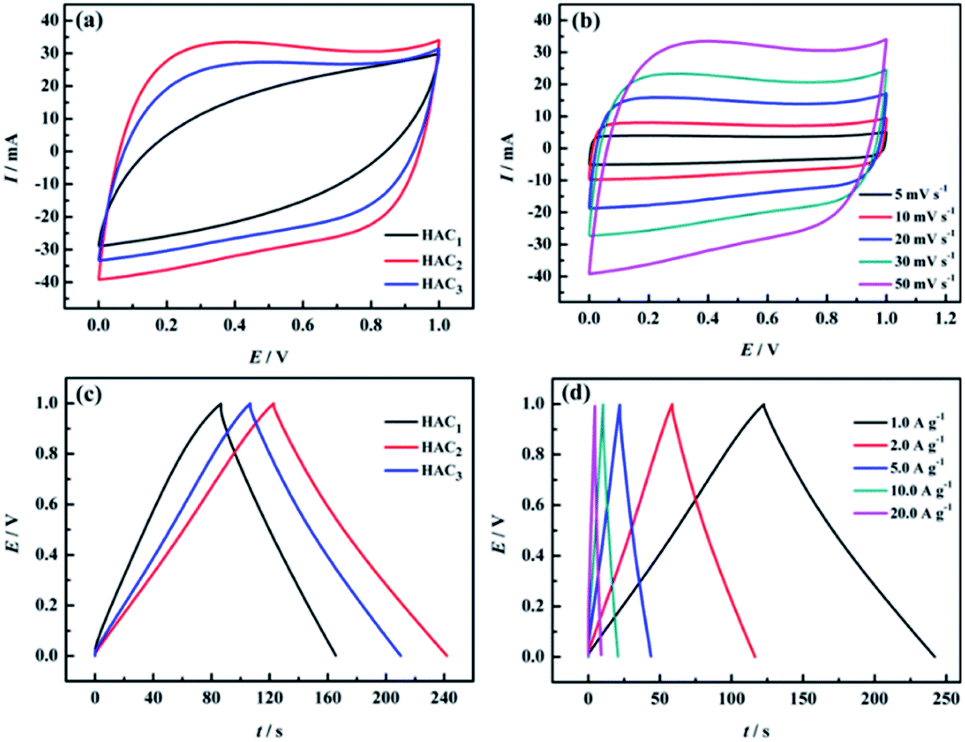 | ||
| Fig. 7 Electrochemical performance of HACX measured in two-electrode system in 6.0 M KOH electrolyte. (a) CV curves of HAC1, HAC2 and HAC3 at 50 mV s−1; (b) CV curves of HAC2 at different scan rates; (c) GCD curves of HAC1, HAC2 and HAC3 at 1.0 A g−1; (d) GCD curves of HAC2 at different current densities. | ||
The galvanostatic charge–discharge (GCD) curves of FACX (shown in Fig. 6c) and HACX (shown in Fig. 7c) electrodes were measured at 1.0 A g−1. All curves show an approximate isosceles triangle shape, which indicate excellent Coulomb efficiency and electrochemical reversibility at the stage of charge–discharge.54 There are small voltage drops observed from GCD curves among of these electrode materials, indicating a low equivalent series resistance of FACX and HACX. It can be seen that the voltage drops of FAC2 (shown in Fig. 6d) and HAC2 (shown in Fig. 7d) continually rise along with the current density increase from 1.0 A g−1 to 20 A g−1, which can be explained as follows: during the progress of charge–discharge the electrolyte ions will transport from the surface of electrode into the inner of electrode, at this time, the pore structure and pore size of electrode material make great influence on electrolyte ions, narrow pore diameter will greatly obstruct electrolyte ions to access to inner of electrode with the current intensity increase, thus result in larger voltage drops.55 In addition, the GCD curves of FAC2 and HAC2 display longer discharge time than other prepared materials at 1.0 A g−1, indicating that the two electrode materials exhibit higher specific capacitance, the corresponding specific capacitance of FAC2 and HAC2 calculated following above formula (1) and (2) are 209.3 F g−1 and 238.6 F g−1, respectively, which are higher than the values of commercial carbon materials (132 F g−1 at 0.2 A g−1)24 and can be compared with some reported biomass carbon materials. The comparison of specific capacitance of some reported biomass-based carbon materials are listed in Table S2.†
Based on the discharge curves of those electrode materials, the specific capacitance values of FACX and HACX electrodes are also calculated following above formula (1) and (2), these results are given in Fig. 8a and b. The detailed data are shown in Table 1. Among FACX materials (shown in Fig. 8a) FAC2 displays the highest specific capacitance and excellent rate performance, the specific capacitance of FAC2 is 209.3, 204.6, 194.5, 186.0 and 176.0 F g−1 at current densities of 1.0, 2.0, 5.0, 10, 20 A g−1, respectively. Its capacitance retention is 84.1% when the current density increases from 1.0 A g−1 to 20 A g−1. And the specific capacitance values of FAC3 are close to that of FAC2 at the corresponding current densities, the specific capacitance of FAC3 decrease from 201.8 F g−1 to 163.0 F g−1 with the capacitance retention of 80.8%. The specific capacitance of FAC1 decays quickly with the increasing of current density. Compared with FACX, the highest specific capacitance value of HAC2 electrode is 238.6 F g−1 at 1.0 A g−1, higher than the specific capacitance of 158.3 F g−1 and 207.2 F g−1 of HAC1 and HAC3, respectively. Meanwhile the capacitance retention of HAC1, HAC2 and HAC3 are 46.1%, 75.0% and 61.8% at 20 A g−1. It is apparent that FAC2 electrode shows the most excellent rate performance among FACX electrodes, and HAC2 electrode displays more excellent rate performance than other prepared HACX electrodes. These results are ascribed to their unique O, N-codoped hierarchical pore structures of FAC2 and HAC2 materials, which have more reactive sites and conductive network providing more conductive channels and shortening the electrolyte ion transport path.49 The specific capacitance of HAC2 electrode is higher than that of FAC2 electrode, which is ascribed to the higher content of oxygen element for HAC2. The more oxygen functional groups can offer extra pseudocapacitance. It is interesting that FAC2 containing rich carbon element shows better rate performance than HAC2. This may be the reason that the construction of HAC2 possessing more defective carbon crystallites is easy to be destroyed under the high current density.
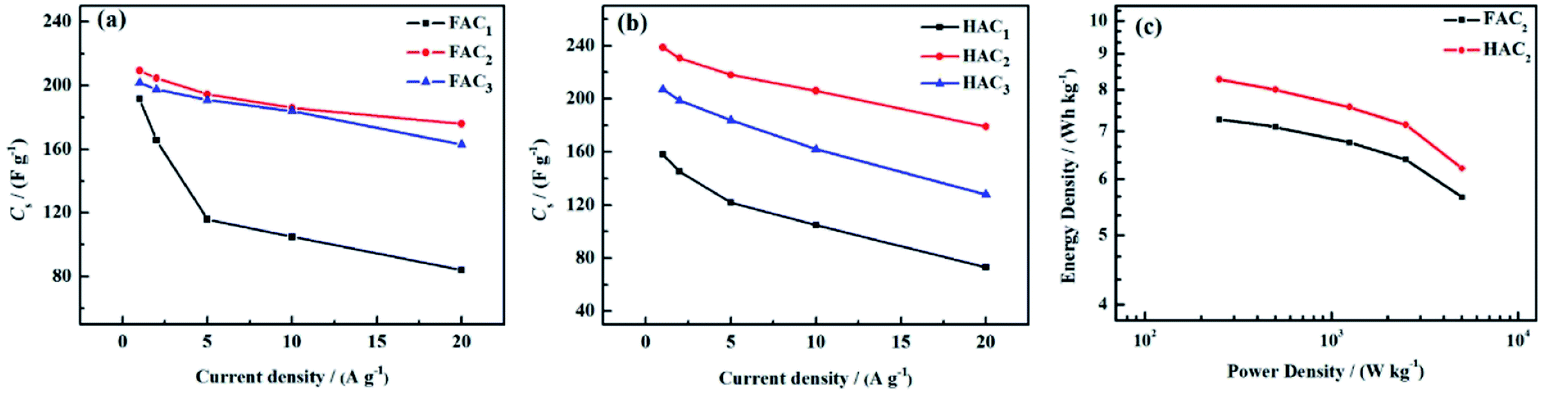 | ||
| Fig. 8 Specific capacitance of (a) FACX and (b) HACX at different current densities; (c) Ragone plot of FAC2 and HAC2. | ||
| Sample | 1.0 A g−1 | 2.0 A g−1 | 5.0 A g−1 | 10.0 A g−1 | 20.0 A g−1 | Capacitance retention |
|---|---|---|---|---|---|---|
| FAC1 | 191.8 F g−1 | 165.6 F g−1 | 116.0 F g−1 | 105.0 F g−1 | 84.0 F g−1 | 43.7% |
| FAC2 | 209.3 F g−1 | 204.6 F g−1 | 194.5 F g−1 | 186.0 F g−1 | 176.0 F g−1 | 84.1% |
| FAC3 | 201.8 F g−1 | 197.6 F g−1 | 191.0 F g−1 | 184.0 F g−1 | 163.0 F g−1 | 80.8% |
| HAC1 | 158.3 F g−1 | 145.4 F g−1 | 122.0 F g−1 | 105.0 F g−1 | 73.0 F g−1 | 46.1% |
| HAC2 | 238.6 F g−1 | 230.6 F g−1 | 218.0 F g−1 | 206.0 F g−1 | 179.0 F g−1 | 75.0% |
| HAC3 | 207.2 F g−1 | 198.8 F g−1 | 184.0 F g−1 | 162.0 F g−1 | 128.0 F g−1 | 61.8% |
The energy density and power density are important parameters for evaluating the performance of supercapacitors. According to above formula (3) and (4), the energy density and power density values of FAC2 and HAC2 electrodes are calculated, and the Ragone plot is shown in Fig. 8c. It can be seen that the maximum energy densities of FAC2 and HAC2 are 7.3 W h kg−1 and 8.3 W h kg−1 with the same power density of ∼250 W kg−1, respectively, which are far higher than the value of commercial activated carbon based supercapacitors,56 and it can be comparable with some reported biomass activated materials24,26,31,35,45,57 and activated carbon56 (listed in Table S3†). Moreover, even at a high power density of 5000 W kg−1 FAC2 and HAC2 still retain 5.7 W h kg−1 and 6.2 W h kg−1, respectively, indicating excellent rate performance of the two electrodes.
Electrochemical impedance spectroscopy (EIS) is widely used to investigate the ion transport effect between electrolyte and electrode interface. The Nyquist plots of FACX and HACX are showed in Fig. 9a and b. The equivalent electrolyte ions transfer internal resistances at the electrode interface of FAC1, FAC2 and FAC3 are almost 1.86 Ω, 0.94 Ω and 1.12 Ω in high frequency region, respectively, and the line of FAC2 displays the straightest among that of FACX in the low frequency region, which indicates that FAC2 electrode presents lower ion diffusion resistance and better capacitance behavior.58 In contrast, the equivalent series resistances of HAC1, HAC2 and HAC3 are 1.98 Ω, 0.62 Ω and 0.90 Ω, respectively, and HAC2 electrode shows the straightest line with a nearly 90° angle in the low frequency region, suggesting that it can efficiently reduce ions transfer resistance at the stage of charge–discharge and demonstrating ideal capacitance behavior. In essence, rich micro-mesoporous structure and high specific surface area of carbon materials can provide more efficient channels for electrolyte ions, which can shorten ion transport path, and greatly reduce charge transfer resistance and improve the utilization ratio of electrode active materials, and then improve the electrochemical performance.
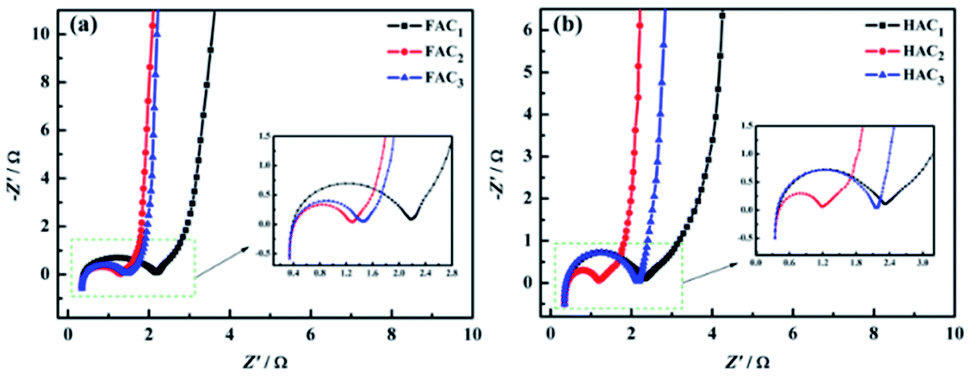 | ||
| Fig. 9 Electrochemical impedance spectroscopy of (a) FACX and (b) HACX electrodes. | ||
The cycling lifetime for FAC2 and HAC2 materials were also investigated at the current density of 1.0 A g−1 in 6.0 M KOH. As shown in Fig. 10, FAC2 and HAC2 represent no apparent capacity shrinkage after 3000 cycles, and maintain 95.8% and 98.1% of the initial discharging capacity, respectively. Coulomb efficiency is also a mean of evaluating the electrochemical performance of supercapacitors, which is calculated by the ratio of discharge capacity to charge capacity during the same cycling process. The coulombic efficiency curves are showed in Fig. 10. It is apparent that the coulombic efficiency of FAC2 (shown in Fig. 10a) and HAC2 (shown in Fig. 10b) electrodes are around 100%, which indicate good reversible behavior and no any side reactions taking place during GCD cycling test.59 In a word, the two electrode materials both present excellent cycling stability and outstanding charge–discharge efficiency.
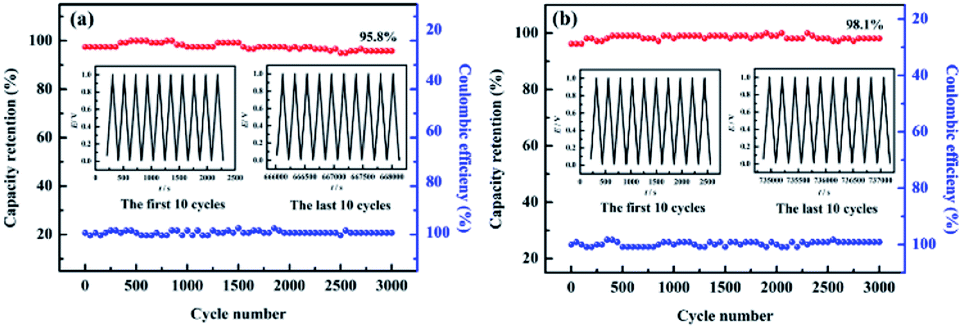 | ||
| Fig. 10 Cycling stability and coulombic efficiency of (a) FAC2 and (b) HAC2 electrodes at 1.0 A g−1 for 3000 cycles. Inset: the GCD curves of the first and last ten cycles. | ||
Conclusions
FACX materials were prepared from black fungus and HACX materials were produced from Hericium erinaceus via KOH chemical activation. Different activation temperature has great effect on the pore structure and pore diameter of prepared carbon materials, and then influences their electrochemical performance. The O, N-codoped FAC2 and HAC2 materials present unique hierarchical porous structure and satisfied surface area. Meanwhile FACX and HACX as electrode materials for supercapacitor exhibit an outstanding electrochemical performance, for instance, the satisfied specific capacitance of FAC2 (209.3 F g−1) and HAC2 (238.6 F g−1) at 1.0 A g−1, excellent rate performance (the capacitance retention at 20 A g−1 of FAC2 and HAC2 are 84.1% and 75.0%, respectively) and prominent cycling performance (FAC2 and HAC2 almost no apparent capacity loss after 3000 cycles). And the corresponding maximum energy densities of FAC2 and HAC2 reach at 7.3 W h kg−1 and 8.3 W h kg−1, respectively. These results imply that the oxygen-rich hierarchical porous carbon (HAC2) shows higher specific capacitance and energy density and longer cycling performance. Nevertheless, carbon-rich hierarchical porous carbon (FAC2) demonstrates excellent rate performance. The two biomass-derived porous and O, N-codoped activated carbons are potential electrode materials for supercapacitors.Author contributions
Xinxian Zhong: data curation, formal analysis, writing original draft, funding acquisition. Quanyuan Mao: resources, formal analysis, visualization. Zesheng Li: formal analysis, visualization. Zhigao Wu: data curation, formal analysis. Yatao Xie: visualization. Shu-Hui Li: supervision, writing – review & editing. Guichao Liang: data curation, formal analysis. Hongqiang Wang: supervision, writing – review & editing, funding acquisition.Conflicts of interest
There are no conflicts to declare.Acknowledgements
The research was supported by National Natural Science Foundation of China (51964006, 51902108, 51762006, 51964013 and 5177041230), the Natural Science Foundation of Guangxi Province of China (2018GXNSFAA138136 and 2020GXNSFBA159037), and Innovation Project of Guangxi Graduate Education (XYCSZ 2018071).Notes and references
- H. D. Yoo, E. Markevich, G. Salitra, D. Sharon and D. Aurbach, Mater. Today, 2014, 17, 110–121 CrossRef CAS.
- W.-L. Zhang, J. Yin, Z.-Q. Lin, J. Shi, C. Wang, D.-B. Liu, Y. Wang, J.-P. Bao and H.-B. Lin, J. Power Sources, 2017, 342, 183–191 CrossRef CAS.
- Z. Bi, Q. Kong, Y. Cao, G. Sun, F. Su, X. Wei, X. Li, A. Ahmad, L. Xie and C.-M. Chen, J. Mater. Chem. A, 2019, 7, 16028–16045 RSC.
- H. Zhao, L. Liu, R. Vellacheri and Y. Lei, Adv. Sci., 2017, 4, 1700188 CrossRef PubMed.
- S. Cao, J. Yang, J. Li, K. Shi and X. Li, Diamond Relat. Mater., 2019, 96, 118–125 CrossRef CAS.
- Y. He, W. Chen, C. Gao, J. Zhou, X. Li and E. Xie, Nanoscale, 2013, 5, 8799–8820 RSC.
- C. Pan, Z. Liu, W. Li, Y. Zhuang, Q. Wang and S. Chen, J. Phys. Chem. C, 2019, 123, 25549–25558 CrossRef CAS.
- Z. Zou and C. Jiang, J. Alloys Compd., 2020, 815, 152280 CrossRef CAS.
- J. Dominic, T. David, A. Vanaja, G. Muralidharan, N. Maheswari and K. K. S. Kumar, Appl. Surf. Sci., 2018, 460, 40–47 CrossRef CAS.
- V. Augustyn, P. Simon and B. Dunn, Energy Environ. Sci., 2014, 7, 1597–1614 RSC.
- V. Ruiz, S. Roldán, I. Villar, C. Blanco and R. Santamaría, Electrochim. Acta, 2013, 95, 225–229 CrossRef CAS.
- D. J. Kim, J. W. Yoon, C. S. Lee, Y.-S. Bae and J. H. Kim, Appl. Surf. Sci., 2018, 439, 833–838 CrossRef CAS.
- Z.-Q. Hao, J.-P. Cao, Y. Wu, X.-Y. Zhao, Q.-Q. Zhuang, X.-Y. Wang and X.-Y. Wei, J. Power Sources, 2017, 361, 249–258 CrossRef CAS.
- L. Yao, Q. Wu, P. Zhang, J. Zhang, D. Wang, Y. Li, X. Ren, H. Mi, L. Deng and Z. Zheng, Adv. Mater., 2018, 30, 1706054 CrossRef PubMed.
- J. Deng, M. Li and Y. Wang, Green Chem., 2016, 18, 4824–4854 RSC.
- L. Miao, H. Duan, D. Zhu, Y. Lv, L. Gan, L. Li and M. Liu, J. Mater. Chem. A, 2021, 9, 2714–2724 RSC.
- Z. Song, L. Miao, L. Li, D. Zhu, L. Gan and M. Liu, Carbon, 2021, 180, 135–145 CrossRef CAS.
- L. Miao, Z. Song, D. Zhu, L. Li, L. Gan and M. Liu, Energy Fuels, 2021, 35, 8443–8455 CrossRef CAS.
- H. Peng, S. Qi, Q. Miao, R. Zhao, Y. Xu, G. Ma and Z. Lei, J. Power Sources, 2021, 482, 228993 CrossRef CAS.
- Q. Ma, Y. Yu, M. Sindoro, A. G. Fane, R. Wang and H. Zhang, Adv. Mater., 2017, 29, 1605361 CrossRef PubMed.
- X. Kang, H. Zhu, C. Wang, K. Sun and J. Yin, J. Colloid Interface Sci., 2018, 509, 369–383 CrossRef CAS PubMed.
- X.-L. Su, J.-R. Chen, G.-P. Zheng, J.-H. Yang, X.-X. Guan, P. Liu and X.-C. Zheng, Appl. Surf. Sci., 2018, 436, 327–336 CrossRef CAS.
- K. Wang, N. Zhao, S. Lei, R. Yan, X. Tian, J. Wang, Y. Song, D. Xu, Q. Guo and L. Liu, Electrochim. Acta, 2015, 166, 1–11 CrossRef CAS.
- P. Cheng, S. Gao, P. Zang, X. Yang, Y. Bai, H. Xu, Z. Liu and Z. Lei, Carbon, 2015, 93, 315–324 CrossRef CAS.
- R. Qiang, Z. Hu, Y. Yang, Z. Li, N. An, X. Ren, H. Hu and H. Wu, Electrochim. Acta, 2015, 167, 303–310 CrossRef CAS.
- Y. Gong, D. Li, C. Luo, Q. Fu and C. Pan, Green Chem., 2017, 19, 4132–4140 RSC.
- X. Hao, J. Wang, B. Ding, Y. Wang, Z. Chang, H. Dou and X. Zhang, J. Power Sources, 2017, 352, 34–41 CrossRef CAS.
- X. Xu, J. Gao, Q. Tian, X. Zhai and Y. Liu, Appl. Surf. Sci., 2017, 411, 170–176 CrossRef CAS.
- Y.-Q. Zhao, M. Lu, P.-Y. Tao, Y.-J. Zhang, X.-T. Gong, Z. Yang, G.-Q. Zhang and H.-L. Li, J. Power Sources, 2016, 307, 391–400 CrossRef CAS.
- M. S. Balathanigaimani, W.-G. Shim, M.-J. Lee, C. Kim, J.-W. Lee and H. Moon, Electrochem. Commun., 2008, 10, 868–871 CrossRef CAS.
- X. He, P. Ling, M. Yu, X. Wang, X. Zhang and M. Zheng, Electrochim. Acta, 2013, 105, 635–641 CrossRef CAS.
- R. Zou, H. Quan, W. Wang, W. Gao, Y. Dong and D. Chen, J. Environ. Chem. Eng., 2018, 6, 258–265 CrossRef CAS.
- X. He, R. Li, J. Han, M. Yu and M. Wu, Mater. Lett., 2013, 94, 158–160 CrossRef CAS.
- X. Li, W. Xing, S. Zhuo, J. Zhou, F. Li, S.-Z. Qiao and G.-Q. Lu, Bioresour. Technol., 2011, 102, 1118–1123 CrossRef CAS PubMed.
- M. Xu, Q. Huang, J. Lu and J. Niu, Ind. Crops Prod., 2021, 161, 113215 CrossRef CAS.
- J. Li, L. Wei, Q. Jiang, C. Liu, L. Zhong and X. Wang, Ind. Crops Prod., 2020, 154, 112666 CrossRef CAS.
- D. Guo, L. Zhang, X. Song, L. Tan, H. Ma, J. Jiao, D. Zhu and F. Li, New J. Chem., 2018, 42, 8478–8484 RSC.
- B. Liu, Y. Liu, H. Chen, M. Yang and H. Li, J. Power Sources, 2017, 341, 309–317 CrossRef CAS.
- S. Sun, F. Han, X. Wu and Z. Fan, Chin. Chem. Lett., 2020, 31, 2235–2238 CrossRef CAS.
- N. F. Sylla, N. M. Ndiaye, B. D. Ngom, B. K. Mutuma, D. Momodu, M. Chaker and N. Manyala, J. Colloid Interface Sci., 2020, 569, 332–345 CrossRef CAS PubMed.
- Y. Wang, B. Ding, D. Guo and X. Wu, Microporous Mesoporous Mater., 2019, 282, 114–120 CrossRef CAS.
- H. Zhou, Y. Zhou, L. Li, Y. Li, X. Liu, P. Zhao and B. Gao, ACS Sustainable Chem. Eng., 2019, 7, 9281–9290 CrossRef CAS.
- A. Viinikanoja, J. Kauppila, P. Damlin, E. Mäkilä, J. Leiro, T. Ääritalo and J. Lukkari, Carbon, 2014, 68, 195–209 CrossRef CAS.
- A.-Y. Lo, C.-T. Hung, N. Yu, C.-T. Kuo and S.-B. Liu, Appl. Energy, 2012, 100, 66–74 CrossRef CAS.
- C. Gong, X. Wang, D. Ma, H. Chen, S. Zhang and Z. Liao, Electrochim. Acta, 2016, 220, 331–339 CrossRef CAS.
- J.-P. Tessonnier, D. Rosenthal, T. W. Hansen, C. Hess, M. E. Schuster, R. Blume, F. Girgsdies, N. Pfänder, O. Timpe, D. S. Su and R. Schlögl, Carbon, 2009, 47, 1779–1798 CrossRef CAS.
- C. Hun Yun, Y. Heum Park, G. Hwan Oh and C. Rae Park, Carbon, 2003, 41, 2009–2012 CrossRef.
- L. Qie, W.-M. Chen, Z.-H. Wang, Q.-G. Shao, X. Li, L.-X. Yuan, X.-L. Hu, W.-X. Zhang and Y.-H. Huang, Adv. Mater., 2012, 24, 2047–2050 CrossRef PubMed.
- F. Sun, L. Wang, Y. Peng, J. Gao, X. Pi, Z. Qu, G. Zhao and Y. Qin, Appl. Surf. Sci., 2018, 436, 486–494 CrossRef CAS.
- M. Sevilla, C. Sanchís, T. Valdés-Solís, E. Morallón and A. B. Fuertes, Carbon, 2008, 46, 931–939 CrossRef CAS.
- D. F. Li, G. Z. Yang, L. N. Qi, Q. B. Zheng and J. H. Yang, Adv. Mater. Res., 2012, 487, 860–863 CAS.
- H. Guo, B. Ding, J. Wang, Y. Zhang, X. Hao, L. Wu, Y. An, H. Dou and X. Zhang, Carbon, 2018, 136, 204–210 CrossRef CAS.
- H. Hwang, C. H. Kim, J.-H. Wee, J. H. Han and C.-M. Yang, Appl. Surf. Sci., 2019, 489, 708–716 CrossRef CAS.
- S. Ren, Y. Yang, M. Xu, H. Cai, C. Hao and X. Wang, Colloids Surf., A, 2014, 444, 26–32 CrossRef CAS.
- S. Yoon, S. M. Oh, C. W. Lee and J. H. Ryu, J. Electroanal. Chem., 2011, 650, 187–195 CrossRef CAS.
- A. Burke, Electrochim. Acta, 2007, 53, 1083–1091 CrossRef CAS.
- H.-h. Fu, L. Chen, H. Gao, X. Yu, J. Hou, G. Wang, F. Yu, H. Li, C. Fan, Y.-l. Shi and X. Guo, Int. J. Hydrogen Energy, 2020, 45, 443–451 CrossRef CAS.
- M. Hou, K. Sun, X. Deng, F. Xiao and H. Yang, RSC Adv., 2015, 5, 74664–74670 RSC.
- M. Li, J. P. Cheng, F. Liu and X. B. Zhang, Electrochim. Acta, 2015, 178, 439–446 CrossRef CAS.
Footnote |
| † Electronic supplementary information (ESI) available. See DOI: 10.1039/d1ra03699h |
| This journal is © The Royal Society of Chemistry 2021 |