 Open Access Article
Chemical structure stabilities of a SixFy (x ≤ 6, y ≤ 12) series†
An-jiang Tang *a,
Qi-shan Huanb,
Shi-yun Tanga,
De-ju Weia,
Jun-jiang Guoa and
Yu-han Zhaoa
aSchool of Chemical Engineering, Guizhou Institute of Technology, Guiyang, China. E-mail: tangaj2000@163.com
bSchool of Chemistry and Chemical Engineering, Guizhou University, Guiyang, China
First published on 21st June 2021
Abstract
In this paper, we construct a SixFy (x ≤ 6, y ≤ 12) series optimised at the B3LYP/6-31G(d,p) level. At the same level, we perform frontline molecular orbital (FMO), Mayer bond order (MBO), molecular surface electrostatic potential (MS-EPS) and natural population analysis (NPA) calculations to study the chemical structure stabilities of these SixFy molecules. The FMO and MBO results demonstrate that the chemical structure stabilities of the SixFy (x ≤ 6, y ≤ 12) series are ranked (from strong to weak) as SiF4 > Si2F6 > Si3F8 > Si4F10 > SiF2 > Si5F12 > Si3F6 (ring) > Si5F10 (ring) > Si6F12 (ring) > Si4F8 (ring). Furthermore, the chemical structure stabilities of the chains are stronger than those of the rings, while the number of silicon atoms is the same. In addition, infrared spectroscopy analysis shows that SiF4 is the most stable among the SixFy (x ≤ 6, y ≤ 12) series, followed by Si2F6, and SiF2 is unstable. The experimental results are consistent with theoretical calculations. Finally, the MS-EPS and NPA results indicate that compounds in the SixFy (x ≤ 6, y ≤ 12) series tend to be attacked by nucleophiles rather than by electrophiles; also, they show poor chemical structure stability when encountering nucleophiles.
1. Introduction
Silicon is the main support material in the semiconductor, communications and photovoltaic industries. The main requirements for silicon are purity and configuration. In industry, the high-temperature smelting method and Siemens or modified Siemens method are used to meet these requirements. In the reported methods, the core aim is to form a flowing stream that is suitable for industrial operations. Additionally, halogen and silicon are naturally present in phosphate rock (silicon and fluorine in halogen are associated with each other in phosphate rock). In the industrial processing of phosphate rock, silicon and fluorine are naturally combined to form a gas compound, e.g. silicon tetrafluoride (SiF4), with flow characteristics at room temperature.To separate and purify this flowing compound directly and even effectively prepare various configurations of silicon materials (endowed with functional properties) in industrialization, it is necessary to explore the transformation between SixFy (x ≤ 6, y ≤ 12) series substances. In comparison with other halogen silicon compounds, silicon fluorides (SixFy) are relatively less known except for SiF4, obviously due to the lack of understanding of the synthesis and stability of silicon fluorides. Furthermore, the chemical structure stabilities of SixFy (x ≤ 6, y ≤ 12) are a highly interesting topic for the scientific and industrial community.
Here, we start with a common example: by calculating at the CBS-QB3 level, the corresponding C–F, C–H, Si–F and Si–H bond energies of C2F4, C2H4, Si2F4, and Si2H4 are 531, 456, 446 and 338 kJ mol−1, respectively. The stabilities of the corresponding chain polymers are as follows:
Accordingly, among the compounds mentioned above, the silane polymer is the most unstable and difficult to operate in industry; meanwhile, the study of tetrafluoroethylene polymer and ethylene polymer is relatively mature, and a large number of studies have been reported. However, the structure stabilities of tetrafluorosilane polymer are in the middle, allowing the possibility of industrial operation, and it has potential application value. Therefore, increasing interest is being focused on tetrafluorosilane.
There have been some studies conducted on the macro-chemical synthesis methods of the SixFy (x ≤ 6, y ≤ 12) series, distinguishing the following stable compounds: (1) SiF4. Since Davy synthesized silicon tetrafluoride in 1812, it has become a common compound. The main synthesis methods are as follows: firstly, direct reaction preparation of high-purity silicon (or SiCl4) and F2; secondly, preparation with metal fluorosilicates (including Na2SiF6 and BaSiF6) by pyrolysis; thirdly, co-thermal preparation with fluorosilicic acid and concentrated sulfuric acid; fourthly, reaction of fluorite and concentrated sulfuric acid or HF with solid Si at a temperature above 250 °C; finally, the reaction of CaSiF6 and concentrated sulfuric acid under heating. (2) Disilicon hexafluoride (Si2F6). In 1932, Schumb et al.1 used Si2Cl6 to react with anhydrous ZnF to prepare Si2F6; in 1994, Tosa et al.2 reacted Si and Fe mixed at a ratio of 3![[thin space (1/6-em)]](https://www.rsc.org/images/entities/char_2009.gif) :
:![[thin space (1/6-em)]](https://www.rsc.org/images/entities/char_2009.gif) 2 with Cl2 using KCl as a catalyst to obtain Si2Cl6; then, the prepared Si2Cl6 and SbF3 were reacted under the catalyst SbCl5 to obtain Si2F6 (98%) by heating. (3) Trisilicon octafluoride (Si3F8). In 1967, Johannesen et al.3 studied the nuclear magnetic resonance of Si3F8. In 1976, Höfler et al.4 treated Si3(OCH3)8 with BF3 in a sealed tube to synthesize Si3F8 with a yield of 55%–60%, and the Raman spectrum of Si3F8 was obtained. Due to the poor chemical stability of SixFy with long silicon chains, only a few compounds with longer chains than Si3F8 have been reported.
2 with Cl2 using KCl as a catalyst to obtain Si2Cl6; then, the prepared Si2Cl6 and SbF3 were reacted under the catalyst SbCl5 to obtain Si2F6 (98%) by heating. (3) Trisilicon octafluoride (Si3F8). In 1967, Johannesen et al.3 studied the nuclear magnetic resonance of Si3F8. In 1976, Höfler et al.4 treated Si3(OCH3)8 with BF3 in a sealed tube to synthesize Si3F8 with a yield of 55%–60%, and the Raman spectrum of Si3F8 was obtained. Due to the poor chemical stability of SixFy with long silicon chains, only a few compounds with longer chains than Si3F8 have been reported.
Moreover, among the unstable compounds, the preparations of SiFn (n = 0–3) are as follows: in 1958, Pease et al.5 used SiF4 to react with Si for the first time at high temperature, and a (SiF2)x polymer was obtained by cold polymerisation of the generated SiF2 gas. Subsequently, Timms et al.6 and Bassler et al.7 used Ar as the carrier gas and cold-polymerised SiF2 at 20–42 K; thus, the (SiF2)x polymer was also obtained. In 2008, Cruz et al.8 successfully synthesised Si3N4 using a conventional chemical vapor deposition (CVD) mixed precursor system [Na2SiF6(s)–N2(g)]. Because SiF4 and N2 are very stable under heating and will not react directly, it is believed that the process is based on thermal dissociation to form SiFn (n = 0–3). In 1965, Timms et al.9 detected SiF+, SiF2+, SiF3+, SiF4+, Si2F4+, Si2F5+, Si5F6+ and Si2F6+ by performing mass spectrometry of Si2F6.
Moreover, Mai et al.10 used plasma-enhanced CVD and a mixed gas source (SiF4–SiH4–H2) to prepare polysilicon membranes with preferred orientations at low temperature (≤400 °C); Kim et al.11 used inductively coupled plasma-enhanced CVD to study F, Si, H, and Ar systems; Fisher et al.12 successfully captured SiFx radicals using spatially resolved laser-induced fluorescence imaging technology and generated radio frequency power and SiF2 radicals; Takayuki et al.13 used SiF4 as the raw material gas and used ultraviolet absorption spectroscopy, light-induced fluorescence and infrared laser absorption spectroscopy at 60 MHz to measure the density changes of SiF4, SiF2, SiF and Si.
In addition to experimental studies, there have been some theoretical calculations involving SiFn compounds. For instance, Colvin et al.14 studied the ground state and excited state structures of SiF2 radicals; Knizikevičius15 studied the desorption activation energy of SiF2 radical molecules; Helluy et al.16 studied the nuclear magnetic resonance spectra of Si and F atoms in fluorosilicon compounds; Hrusak et al.17 calculated the heat of formation of SiF22+; Jiang et al.18 used density functional theory (DFT) to analyse the molecular structures and energy changes of SiX2 (X = H, F); Zhao et al.19 used DFT to study the SiF2 potential energy curve; Jiang20 used DFT to study the structure and thermodynamic properties of the ground state of SiF2; and Han21 used ab initio calculations to optimise the structure of the ground state of SiF2. However, the studies mentioned above were mainly focused on individual compounds. As far as we know, there is no systematic study about the theoretical calculations of a SixFy (x ≤ 6, y ≤ 12) series.
In this paper, systematic comparative studies on a SixFy (x ≤ 6, y ≤ 12) series were performed, including stable compounds and even semi-stable intermediate substances with a short lifetime. First, we constructed the optimized models of the SixFy (x ≤ 6, y ≤ 12) series at the B3LYP/6-31G(d,p) level, including stable substances such as SiF4, Si2F6, Si3F8, Si4F10 and Si5F12, intermediate substances such as SiF, SiF2 and SiF3, and cyclic substances such as i3F6, Si4F8, Si5F10, and Si6F12. Then, further frequency, frontline molecular orbital (FMO), Mayer bond order (MBO), molecular surface electrostatic potential (MS-EPS) and natural population analysis (NPA) calculations were conducted. Furthermore, the theoretical results were compared with the experimental infrared spectra of the synthesised compounds for verification.
2. Theoretical and experimental methods
2.1. Computational methods
Solid Si and SiFn (n = 1–4) readily form SixFy series or SiF2 polymers under low-temperature conditions, as mentioned in the introduction; considering the bond length and strength of the Si–Si bond and Si–F bond, the formed SixFy series are difficult to rearrange. This paper mainly studies a SixFy(x ≤ 6, y ≤ 12) series, a total of 12 molecules, including chain structures, SiF, SiF2, SiF3, SiF4, Si2F6, Si3F8, Si4F10 and Si5F12, and cyclic structures, Si3F6, Si4F8, Si5F10 and Si6F12. DFT is effective in predicting the structural stability of materials.22–25 Therefore, the calculation method in this paper mainly uses the B3LYP functional, which is located in the fourth order of Jacob's ladder.26 It is the first functional that was widely used in chemical theoretical calculations. It is used in pure DFT exchange-related energy that includes part of the HF exchange energy for hybridization. According to the three-parameter hybrid method proposed by Becke27 (eqn (1)),| E = A × ESlaterx + (1 − A)EHFx + B × EBeckex + C × ELYPc + (1 − C)EVWNc | (1) |
2.2. Experimental methods
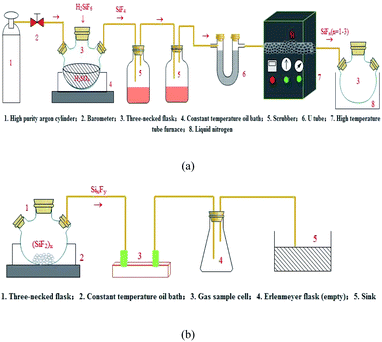
The preparation of the SixFy (x ≤ 6, y ≤ 12) series was performed in two steps with silicon tetrafluoride gas and high-purity silicon as starting materials. Before the experiment, the first step was to dry the activated carbon to remove impurities such as water vapour in the activated carbon, and the experimental device was assembled according to Fig. 1(a). Then, we slowly added fluorosilicic acid to a three-necked flask containing 300 ml concentrated sulfuric acid. The resulting SiF4 gas passed through two scrubbers containing 98% concentrated sulfuric acid and a U-shaped tube containing activated carbon. Finally, SiF4 gas (purified by activated carbon) was introduced into the ceramic tube of the high-temperature tube furnace through the pipeline. The temperature of the high-temperature tube furnace was 1250 °C, and SiFn (n = 1–3) gas was produced; at this time, the SiFn (n = 1–3) gas obtained in the preparation was frozen with liquid nitrogen. The second step was obtaining SiFn (n = 1–3) gas at 1250 °C after it was frozen in liquid nitrogen for a certain period. The polymerisation reaction generated a solid SiF2 polymer (SiF2)x, which was heated to 200 °C to obtain SixFy. The experimental device is shown in Fig. 1(b). In the process, the flow of silicon tetrafluoride gas and argon gas was controlled at 0.1 L min−1, high-purity silicon was in excess, the outlet pressure of the pressure-reducing valve was 0.2 MP, and the reaction was controlled for 60 min. During this process, air should be strictly prevented from entering. Finally, SiF4 gas, SiFn (n = 1–3) gas, and SixFy gas were collected using gas sampling bags, and the valve was closed to isolate the air. Under normal temperature and pressure conditions, after no storage, 1 hour storage, and 1 day storage, infrared spectrum detection was performed. The reaction device process is shown in Fig. 1.3. Results and discussion
3.1. Analysis of the equilibrium configuration
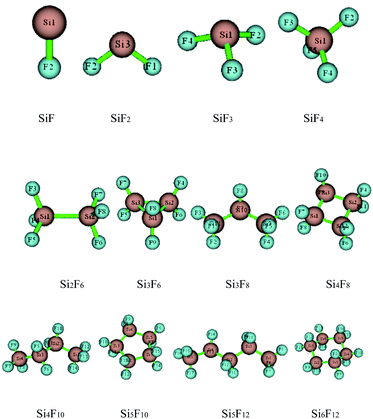
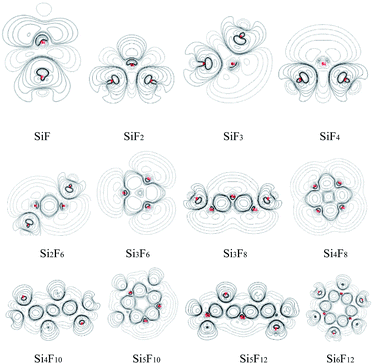
The preliminary molecular structures of the SixFy (x ≤ 6, y ≤ 12) series were constructed through Gaussian view. A total of 12 molecules existed, including chain substances, SiF, SiF2, SiF3, SiF4, Si2F6, Si3F8, Si4F10 and Si5F12, and ring substances, Si3F6, Si4F8, Si5F10 and Si6F12. All of the structures were optimised at the B3LYP/6-31G(d,p) level and are shown in Fig. 2. The optimised bond lengths and bond angles are shown in Table S1 of the ESI.†The optimized Si–F bond length and bond angle of SiF2 are 1.616 Å and 100.9°, respectively. These results are in good agreement with the theoretical values of 1.601 Å and 100.7° from Zhao et al.30 calculated at the B3P86/6-311++G(3df, 3pd) level and experimental values31 of 1.591 Å and 100.9°. Also, the structural comparisons of SiF2 are shown in Table 1, indicating that the choices of the calculation method and basis set are reasonable. Therefore, the structure models of the SixFy (x ≤ 6, y ≤ 12) series optimised by Gaussian 09 at the B3LYP/6-31G(d,p) level are very accurate and reliable.
From Table S1 of the ESI,† it can be seen that the Si–F bond lengths of SiF, SiF2, SiF3 and SiF4 are 1.626 Å, 1.616 Å, 1.600 Å and 1.579 Å, respectively. Moreover, the F–Si–F bond angles of SiF2, SiF3 and SiF4 are 100.9°, 108.0°, and 109.5°, respectively. Therefore, the Si–F bond lengths of SiFn (n = 1–4) become shorter as the F atom numbers increase, as do the bond angles. The Si–Si bond length of Si2F6 is 2.317 Å, the Si–F bond lengths are 1.593 Å, the F–Si–F bond angles are both 108.4°, and the Si–Si–F bond angles are both 110.6°. The Si–Si bond lengths of the cyclic Si3F6 are 2.390 Å, the Si–F bond lengths are 1.609 Å, the F–Si–F bond angles are 107.6°, the Si–Si–F bond angles are 120.8°, the Si–Si bond angles are 60.0°, and other structural parameters are shown in Table S1 of the ESI.† From the bond length and bond angle parameters of the SixFy (x ≤ 6, y ≤ 12) series, it can be concluded that the Si–F bonds of SiF4 are the shortest among the SixFy (x ≤ 6, y ≤ 12) series, indicating that SiF4 is the most stable. At the B3LYP/6-31G(d, p) level, we obtained stable structures of the 8 chain substances (SiF, SiF2, SiF3, SiF4, Si2F6, Si3F8, Si4F10 and Si5F12) and the 4 cyclic substances (Si3F6, Si4F8, Si5F10 and Si6F12). On the basis of these stable structures, the frequency analyses were performed and scaled by a factor of 0.9614.32 The relevant values obtained are shown in Table S2 of the ESI.† From Table S2,† we can see that the experimental value is between the corrected and uncorrected values; therefore, it can be used to predict the peak range of the SixFy (x ≤ 6, y ≤ 12) series. The difference between the theoretical and experimental values is ±20 cm−1, which is caused by an experimental error.
3.2. Chemical structure stability analysis
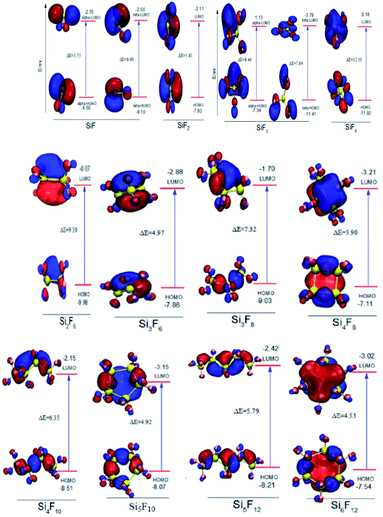
In addition, the FMO maps for the chain SixFy (x ≤ 6, y ≤ 12) series are shown in Fig. 3, including SiF, SiF2, SiF3, SiF4, Si2F6, Si3F8, Si4F10 and Si5F12. As can be seen from Fig. 3, the HOMO energy values of SiF are −4.50 eV and −9.10 eV, and the LUMO energy values are −2.76 eV and −2.50 eV. Then, the ΔE values in SiF are 1.75 eV and 6.60 eV, respectively; the HOMO energy values of SiF3 are −7.34 eV and −11.41 eV, the LUMO energy values are 1.13 eV and −3.78 eV, and the ΔE values in SiF3 are 7.64 eV and 8.46 eV, respectively. In addition to SiF and SiF3, the HOMO energy value of the SiF2 molecule is −7.92 eV, and the LUMO energy value is −2.11 eV. Then, the ΔE in the SiF2 is 5.81 eV. Accordingly, the ΔE values of SiF4, Si2F6, Si3F8, Si4F10 and Si5F12 are respectively 2.10 eV, 9.30 eV, 7.32 eV, 6.35 eV and 5.79 eV; therefore, the ΔE of SixFy (x ≤ 6, y ≤ 12) is ranked from large to small as SiF4(12.10 eV), Si2F6(9.30 eV), Si3F8(7.32 eV), Si4F10(6.35 eV), SiF2(5.81 eV), Si5F12(5.79 eV). It can be concluded that the chemical structure stabilities of the chain structures in the SixFy (x ≤ 6, y ≤ 12) series are ranked (from strong to weak) as SiF4 > Si2F6 > Si3F8 > Si4F10 > SiF2 > Si5F12.
For the cyclic structures, as can be seen from Fig. 3, the HOMO energy value of the Si3F6 molecule is −7.66 eV and the LUMO energy value is −2.88 eV. The ΔE in the Si3F6 is 4.97 eV. Accordingly, the ΔE values of Si4F8, Si5F10 and Si6F12 are 3.90 eV, 4.92 eV and 4.53 eV, respectively. Moreover, the order of the chemical structure stabilities (from strong to weak) is Si3F6 (4.97 eV) > Si5F10 (4.92 eV) > Si6F12 (4.53 eV) > Si4F8 (3.90 eV), and the three-membered ring structure is the most stable. The ΔE values of the three, five, and six-membered ring structures are nearly the same and are all much stronger than those of the four-membered ring structures. The ΔE in the chain Si3F8 molecule is 7.32 eV and that in cyclic Si3F6 is 4.97 eV, which indicates that chain Si3F8 is more stable than cyclic Si3F6. Recursively, when the number of silicon atoms is the same, the chemical structure stabilities of the chain substances are stronger than that of the ring substances. In addition to SiF and SiF3, the chemical structure stabilities of molecules SiF2 to Si6F12 are ranked as SiF4 > Si2F6 > Si3F8 > Si4F10 > SiF2 > Si5F12 > Si3F6 (ring) > Si5F10 (ring) > Si6F12 (ring) > Si4F8 (ring), where SiF4 is the most stable.
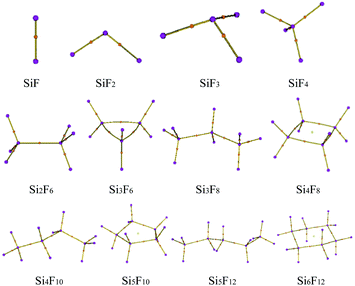
For the chain SixFy (x ≤ 6, y ≤ 12) series, as we can see from Table S1 of the ESI,† the main components are SiF, SiF2, SiF3, SiF4, Si2F6, Si3F8, Si4F10 and Si5F12. In addition to SiF and SiF3, the MBO values of Si–Si are less than 1, while those of Si–F are greater than 1, indicating that the Si–F bond strength is greater than the Si–Si bond and the energy required to break the Si–F bond is greater than that of the Si–Si bond, that is, when the chain SixFy (x ≤ 6, y ≤ 12) series are thermally broken, the Si–Si bond should be broken first. From the perspective of SiFn (n ≤ 4), the MBO values of Si–F in SiF, SiF2, SiF3 and SiF4 are respectively 0.9863, 1.0171, 0.9872, and 1.0538; therefore, the rank of the MBO strengths is SiF4 > SiF2 > SiF3 > SiF. Therefore, SiF4 is more stable than SiF2, SiF and SiF3, while Si2F6, Si3F8, Si4F10 and Si5F12 are subject to the weakest chemical bonds (Si–Si bonds) when undergoing thermal breaking. The lowest MBO values of the Si–Si bonds in Si2F6, Si3F8, Si4F10, Si5F12 are 0.8471, 0.7884, 0.7312 and 0.7288, respectively. The rank of stability among them is Si2F6 > Si3F8 > Si4F10 > Si5F12.
For the cyclic SixFy (x ≤ 6, y ≤ 12) series, the rank of chemical structure stabilities among the Si4F8, Si3F6, Si5F10 and Si6F12 is similarly Si4F8 (0.7614) > Si6F12 (0.7176) > Si5F10 (0.7031) > Si3F6 (0.6521), which shows that the chemical structure stability of the four-membered ring is stronger than those of the five-, the six- and three-membered rings, while the chemical structure stability of the three-membered ring is the worst.
In summary, in addition to SiF and SiF3, the molecular chemical structure stabilities of the SixFy (x ≤ 6, y ≤ 12) series ranks as SiF4 > SiF2 > Si2F6 > Si3F8 > Si4F10 > Si5F12 > Si4F8 (ring) > Si6F12 (ring) > Si5F10 (ring) > Si3F6 (ring). It also can be found that when the silicon atom numbers are the same, the chemical structure stabilities of the chain substances are stronger than that those the ring substances. Compared with the chemical structure stability results from the FMO, the possible reason for the difference in the stability of the cyclic substances is that the MBO only considers the role of the bond, and it is difficult to compare different chemical bonds.
3.3. Experimental results
The theoretical calculations of the stabilities of the SixFy (x ≤ 6, y ≤ 12) series show that SiF4 is the most stable among the SixFy (x ≤ 6, y ≤ 12) series, followed by Si2F6, while SiF2 is unstable. Because the mass spectrometer is obscure to the ion sources of SiFn (n = 1–3), SiF4, and SixFy, infrared spectroscopy was chosen to verify the ion sources in samples stored under normal temperature and pressure. The stability after storing for 1 hour and 1 day and the stability without storage are discussed. The infrared spectra of SiF4 were the same when it was stored for 1 hour, 1 day and without storage (immediate detection), indicating that SiF4 is the most stable substance. Fig. 7 shows the infrared spectra of SiFn (n = 1–3) prepared with SiF4 and Si at a high temperature according to the process flow shown in Fig. 1 and stored for various periods. Compared with immediate detection, after 1 hour and 1 day, the peak value of SiF2 (858 cm−1) gradually decreases with increasing storage time, indicating that SiF2 is unstable. Fig. 8 shows the infrared spectrum of the high-temperature gas SixFy prepared at a high temperature and stored for different times. It can be seen that the peak value of Si2F6 (992 cm−1) gradually decreases with storage time. Compared with SiF4, Si2F6 is less stable. The theoretical calculations are consistent with the experimental results.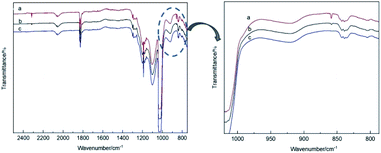 | ||
| Fig. 7 Infrared spectrum of SiFn (n = 1–3) after storage: (a) detected immediately, (b) detected after one hour, (c) detected after one day. | ||
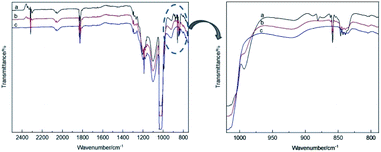 | ||
| Fig. 8 Infrared spectrum of SixFy after storage: (a) detected immediately, (b) detected after one hour, (c) detected after one day. | ||
4. Conclusion
We constructed the structures of a SixFy (x ≤ 6, y ≤ 12) series, including chain substances (SiF, SiF2, SiF3, SiF4, Si2F6, Si3F8, Si4F10 and Si5F12) and cyclic substances (Si3F6, Si4F8, Si5F10, and Si6F12). At the B3LYP/6-31G(d,p) level, the stable structures of the SixFy (x ≤ 6, y ≤ 12) series were obtained. Based on these stable structures, we explored the chemical structure stabilities using theoretical and experimental methods. The FMO analysis showed that the active site among them is at the position of the silicon or silicon–silicon single bond, and the rank of the chemical structure stabilities is SiF4 > Si2F6 > Si3F8 > Si4F10 > SiF2 > Si5F12 > Si3F6 (ring) > Si5F10 (ring) > Si6F12 (ring) > Si4F8 (ring), which is consistent with that obtained from MBO analysis. When the number of silicon atoms is the same, the chemical structure stabilities of the chain substances are stronger than those of the ring substances. Moreover, infrared spectroscopy shows that SiF4 is the most stable among the SixFy (x ≤ 6, y ≤ 12) series, followed by Si2F6, while SiF2 is unstable. MS-EPS and NPA analyses show that the active sites close to silicon or silicon–silicon single bonds in the SixFy (x ≤ 6, y ≤ 12) series are vulnerable to attack by nucleophiles. When encountering nucleophiles, these substances have poor chemical structure stabilities. These results can provide theoretical insight into the research and applications of fluorosilicon compounds.Conflicts of interest
There are no conflicts to declare.Acknowledgements
This work was supported by the National Natural Science Foundation of China (No. 21766005), the Science and Technology Planning Project of Guizhou Province (No. Qian Ke He Ping Tai Ren Cai [2019] 5609 and Qiankehezhicheng [2021]Yiban 493), Guizhou Provincial Key Laboratory of Energy Chemistry (Qianjiaohe KY Zi[2017] 009), the GIT Academic Seedling Training and Innovation Exploration Project (No. GZLGXM-11).References
- W. C. Schumb and E. L. Gamble, J. Am. Chem. Soc., 1932, 54, 583–590 CrossRef CAS.
- V. Tosa, S. Isomura and Y. Kuga, et al., Vib. Spectrosc., 1994, 8, 45–52 CrossRef CAS.
- B. R. Johannesen, J. Chem. Phys., 1967, 47, 955–960 CrossRef.
- F. Höfler and R. Jannach, Monatsh. Chem., 1976, 107, 731–735 CrossRef.
- D. C. Pease, Process for the preparation of difluorosilylene and the polymers thereof, US Pat., 2840588, 1958-06-24 Search PubMed.
- P. L. Timms, R. A. Kent and T. C. Ehlert, et al., J. Am. Chem. Soc., 1965, 87, 2824 CrossRef CAS.
- J. M. Bassler, P. L. Timms and J. L. Margrave, Inorg. Chem., 1966, 5, 729–732 CrossRef CAS.
- A. L. L. Cruz, J. L. D. L. Pea and M. I. P. Canul, Rev. Mex. Fis., 2008, 54, 200–207 Search PubMed.
- P. L. Timms, R. A. Kent, T. C. Ehlert and J. L. Margrave, J. Am. Chem. Soc., 1965, 87, 2824–2828 CrossRef CAS.
- Y. Mai, S. Klein and R. Carius, et al., J. Appl. Phys., 2005, 97, 114–119 CrossRef.
- B.-H. Jun, J. S. Lee and D.-W. Kim, et al., J. Mater. Res., 1999, 14, 1688–1701 CrossRef.
- K. L. Williams, C. I. Butoi and E. R. Fisher, J. Vac. Sci. Technol., A, 2003, 21, 1688–1701 CrossRef CAS.
- O. Takayuki and H. Ken-ichiro, et al., J. Appl. Phys., 2003, 94, 1428–1435 CrossRef.
- M. E. Colvin, R. S. Grev III and H. F. Schaefer, et al., Chem. Phys. Lett., 1983, 99, 399–405 CrossRef CAS.
- R. Knizikevičius, Chem. Phys. Lett., 2005, 410, 177–178 CrossRef.
- X. Helluy, R. Pietschnig and A. Sebald, Solid State Nucl. Magn. Reson., 2003, 24, 286–300 CrossRef CAS.
- J. Hrusak, Z. Herman and S. Iwata, Mass Spectrom., 1999, 192, 165–171 CAS.
- L.-j. Jiang, Y.-f. Liu, Z.-z. Liu and X.-q. Han, Acta Phys. Sin., 2009, 58, 201–208 CAS.
- J. Zhao, X.-l. Cheng and X.-d. Yang, et al., Acta Phys. Sin., 2009, 58, 5280–5284 Search PubMed.
- W.-s. Jiang and J.-p. Zhu, J. Sichuan Norm. Univ., Nat. Sci., 2010, 33, 519–522 CAS.
- X.-q. Han, Acta Phys. Sin., 2014, 63, 114–119 Search PubMed.
- D. Bandyopadhyay and P. Sen, J. Phys. Chem. A, 2010, 114, 1835–1842 CrossRef CAS PubMed.
- D. B. andyopadhyay, P. Kaur and P. Sen, J. Phys. Chem. A, 2010, 114, 12986–12991 CrossRef.
- R. Trivedi, A. Banerjee and D. Bandyopadhyay, Phys. E, 2021, 131, 114725 CrossRef CAS.
- D. Bandyopadhyay, Struct. Chem., 2019, 30, 955–963 CrossRef CAS.
- J. P. Perdew and K. Schmidt, Phys. Rev. Lett., 2001, 577, 1–20 CAS.
- P. J. Stephens, et al., J. Phys. Chem., 1994, 98, 11623–11627 CrossRef CAS.
- L. Tian and F. Chen, J. Comput. Chem., 2012, 33, 580–592 CrossRef PubMed.
- M. J. Frisch, G. W. Trucks and H. B. Schlegel, et al., Gaussian 09, Revision D.01, Wallingford, CT, 2013 Search PubMed.
- J. Zhao, X.-l. Cheng and X.-d. Yang, et al., Acta Phys. Sin., 2009, 157–161 Search PubMed.
- M. W. Chase, C. A. Davies and J. R. Downey, J. Phys. Chem. Ref. Data, 1985, 14, 553 Search PubMed.
- A. P. Scott and L. Radom, J. Phys. Chem., 1996, 100, 16502–16513 CrossRef CAS.
- G.-d. Zhou and L.-y. Duan, Fundamentals of Structural Chemistry, Peking University Press, Beijing, 2008, pp. 168–171 Search PubMed.
- B.-r. Li, Structural Chemistry, Higher Education Press, 2004, pp. 172–178 Search PubMed.
- A. L. L. Cruz, J. L. D. L. Pea and M. I. P. Canul, Rev. Mex. Fis., 2008, 54, 200–207 Search PubMed.
- X. Helluy, R. Pietschnig and A. Sebald, Solid State Nucl. Magn. Reson., 2003, 24, 286–300 CrossRef CAS PubMed.
- I. Mayer, Chem. Phys. Lett., 1985, 117, 396 CrossRef.
Footnote |
| † Electronic supplementary information (ESI) available. See DOI: 10.1039/d1ra03526f |
| This journal is © The Royal Society of Chemistry 2021 |


