
 Open Access Article
 This Open Access Article is licensed under a Creative Commons Attribution-Non Commercial 3.0 Unported Licence
Phase-dependent dielectric properties and proton conduction of neopentyl glycol
Hailong Pan ab,
Jiangshui Luo*ab,
Bing Lic and
Michael Wübbenhorstb
ab,
Jiangshui Luo*ab,
Bing Lic and
Michael Wübbenhorstb
aCollege of Materials Science and Engineering, Sichuan University, Chengdu, 610065, China. E-mail: Jiangshui.Luo@scu.edu.cn
bLaboratory for Soft Matter and Biophysics, Department of Physics and Astronomy, KU Leuven, Leuven, 3001, Belgium
cShenyang National Laboratory for Materials Science, Institute of Metal Research, Chinese Academy of Sciences, 72 Wenhua Road, Shenyang, Liaoning 110016, China
First published on 5th July 2021
Abstract
Phase-dependent dielectric properties and proton conduction of neopentyl glycol (NPG), which is an organic molecular plastic crystal, were studied via variable-temperature broadband dielectric spectroscopy (BDS). Permittivity and conductivity data show the phase transformations of NPG from the crystalline state to the plastic crystalline state at 315 K and then to the molten state at 402 K across the temperature range of 293–413 K. The Vogel temperatures (Tv) fitted from the Vogel–Fulcher–Tammann (VFT) equation agree well with the values extrapolated by the Stickel plot (linearized Vogel plot). Impedance and modulus data display a separation of the −Z′′ (the imaginary part of the complex impedance) and M′′ (the imaginary part of the complex electric modulus) peaks in the crystalline phase. However, they overlap in both the plastic crystalline phase and the molten phase, indicating long-range proton conduction. In both the molten phase and the plastic crystalline phase, the temperature dependence of direct current conductivity (σdc) obeys the VFT equation very well. While the vehicle mechanism (translational diffusion) is an intrinsic mechanism for ionic or protonic conduction in the molten phase, it is speculated that the Grotthuss mechanism also works due to the self-dissociation of NPG molecules, which are similar to water molecules. In the plastic crystalline phase, the proton hopping mechanism is most likely the underlying ion-conducting mechanism because of the rotational disorder and intrinsic defects (vacancies) of the NPG molecules. In the ordered crystalline phase, the proton conduction is presumed to follow the proton hopping mechanism as determined from the localized relaxation and the temperature dependence of σdc (Arrhenius behavior).
Introduction
Molecular substances composed of globular or pseudo-globular molecules often lead to the formation of mesophases (mesostates) between the ordered crystalline state and isotropic liquid. This mesophase is usually referred to as the plastic crystalline state, and the molecular substances are known as plastic crystals.1 Plastic crystals have the long-range center-of-mass crystalline order (positional order) and short-range dynamic disorder of molecular orientations, and thus are also known as the orientationally disordered crystals or rotator phases.2,3 Normally, they have a very low entropy of fusion and a relatively large entropy of solid–solid phase transition thus enabling high ionic conductivities, which makes them promising candidates for applications as protonic or ionic conductors in fuel cells, batteries, and supercapacitors.4–10Neopentylglycol (NPG) or 2,2-dimethyl-1,3-propanediol, an important representative of molecular plastic crystals, has been widely studied in various aspects.11–37 Many studies focused on phase transitions and/or crystal structures.11–19 It can be concluded that within the investigated temperature range (e.g. from 150 K to 423 K), NPG undergoes one solid–solid phase transition and one solid–liquid phase transition successively. Specifically, NPG exhibits its solid–solid phase transition from the ordered crystalline state to the plastic crystalline state at around 314 K (the low temperature monoclinic α phase transforms into the high temperature cubic γ phase), and then the melting transition at around 403 K between the plastic crystalline state and the molten state.11–19 Scheme 1 shows the crystal structure (monoclinic α phase) of NPG at 295 K based on the results from Chandra et al.15
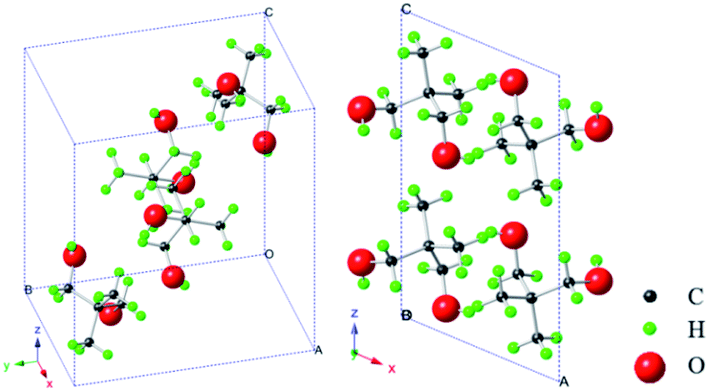 | ||
| Scheme 1 Crystal structure (monoclinic phase) of NPG at 295 K.15 Notes: left, view along (1 1 1) crystal plane; right, view along (0 1 0) crystal plane. | ||
There were also some studies on dielectric properties and dielectric relaxations of NPG.20,21 Chandra et al. reported the AC conductivities of NPG in a powder form in a narrow temperature range between 295 K and 356 K and both the α and γ phases are thermally activated.20 They also reported the AC impedance spectroscopic results and the frequency and temperature effects on the conductivities, relaxation times, and diffusional parameters. In addition, Tamarit et al. studied dielectric relaxation behaviors of NPG in the plastic crystalline phase and its supercooled plastic crystalline phase, which was interpreted in terms of the Dissado–Hill theory by means of the Jonscher and Havriliak-Negami equations.21 They also reported that the α phase is thermally activated. But they revised this conclusion in another paper,22 which revealed that the temperature dependence of the relaxation time showed a non-Arrhenius behavior. This different conclusion may be largely due to the narrow temperature range. Previous reports seem to be doubtful, which prompted the present new investigation on this compound. In addition, dielectric properties of NPG in liquid state are scarce and the possible conduction mechanisms of protons need further elucidation.
There were some studies of NPG in terms of calorimetric properties, solid–liquid interfacial energy, and colossal barocaloric effects.23–26 In addition, orientationally disordered molecular mixed crystals relating to NPG were also studied.27–33 The related studies includes the packing, thermodynamic analysis, relaxation dynamics, calorimetric investigation and structural recovery. Forming a solid solution by mixing another similar molecule is to some extent an effective way to form a supercooled plastic crystal, which would be simple to study the glass transition phenomenon as only one degree of freedom is involved. Interestingly, it was found that admixing a related molecular species of larger size can considerably enhance the ionic conductivity and the stability range of the plastic phase.34 NPG and its derivatives have many applications including water based coatings, magnetic coatings, and powder coatings.31,35 In addition, it is used as an intermediate for the synthesis of lubricants, plasticizers, adhesives, photographic materials, pharmaceuticals, pesticides, fragrances, fabric softeners and vibration dampeners.31 It also has potential applications in the intumescent flame retardants, refrigeration, and air-conditioning.25,26,36,37
Broadband dielectric spectroscopy (BDS) has the advantage of probing electrical properties, (dielectric) relaxation phenomena and thermal phase transitions over a wide range of temperatures and frequencies.38–40 In the present work, NPG was studied across a wide range of temperatures (from 293 K to 413 K) and frequencies via the BDS. Dielectric properties of NPG in three phases (the ordered crystalline, plastic crystalline and liquid phases) were studied. In addition, the possible proton conduction mechanisms were also explored.
Experimental
Materials
NPG ((CH3)2C(CH2OH)2) was purchased from Sigma-Aldrich with purity of 99% and used as received.Dielectric measurements
Dielectric properties were measured by means of a Novocontrol BDS spectrometer based on a high resolution impedance analyzer (Alpha A) in the 10−1 to 106 Hz frequency range. A Novocontrol Quatro Cryosystem was used to control the temperatures (from 293 K to 413 K) via a dry nitrogen gas flow derived from liquid nitrogen. NPG was placed in a stainless-steel liquid cell and then heated from ambient temperature to 413 K to ensure complete filling of the cell. The system was then cooled down to 293 K. Afterwards, the sample was heated up again to 413 K with temperature interval of 1 K. The detailed operation process can be found in ref. 41.Results and discussion
Three representations of dielectric properties
In general, dielectric spectra can be shown in three complex quantities – complex permittivity (ε*), complex conductivity (σ*) and complex electric modulus (M*), which are related to each other based on eqn (1).38| M*(f) = 1/ε*(f) = i2πfε0/σ*(f) | (1) |
Specifically, Fig. 1a displays the frequency dependence of ε′ (the real part of ε*), ε′′ (the imaginary part of ε*), σ′ (the real part of σ*), M′ (the real part of M*) and M′′ (the imaginary part of M*) recorded at 353 K (in the plastic crystalline state). Clearly, it shows that there are no obvious relaxation phenomena of NPG recorded at 353 K in the frequency range of 10−1 to 106 Hz based on the frequency dependence of ε′′. The dc conductivity (σdc) is characterized by a plateau of the frequency dependence of σ′ (in-phase part of conductivity). In addition, the frequency dependence of M′′ takes the form of a well-pronounced peak, a so-called conductivity relaxation peak, which directly yields the relaxation time τM (e.g. τM = 1.04 × 10⁻⁵ s at 353 K). Fig. 1b depicts the temperature-dependent dielectric properties of NPG at 133 Hz in the temperature range of 293–413 K. As the temperature increases, ε′, ε′′ and σ′ show an increasing tendency, while M′ and M′′ present a decreasing tendency. In addition, the two jumps at around 315 K and 402 K indicate two phase transitions clearly, which are in accord with the previous results.11,12,14,18 Thus, the three phases (phase II, phase I and melt phase) can be distinguished according to these two phase transition temperatures.
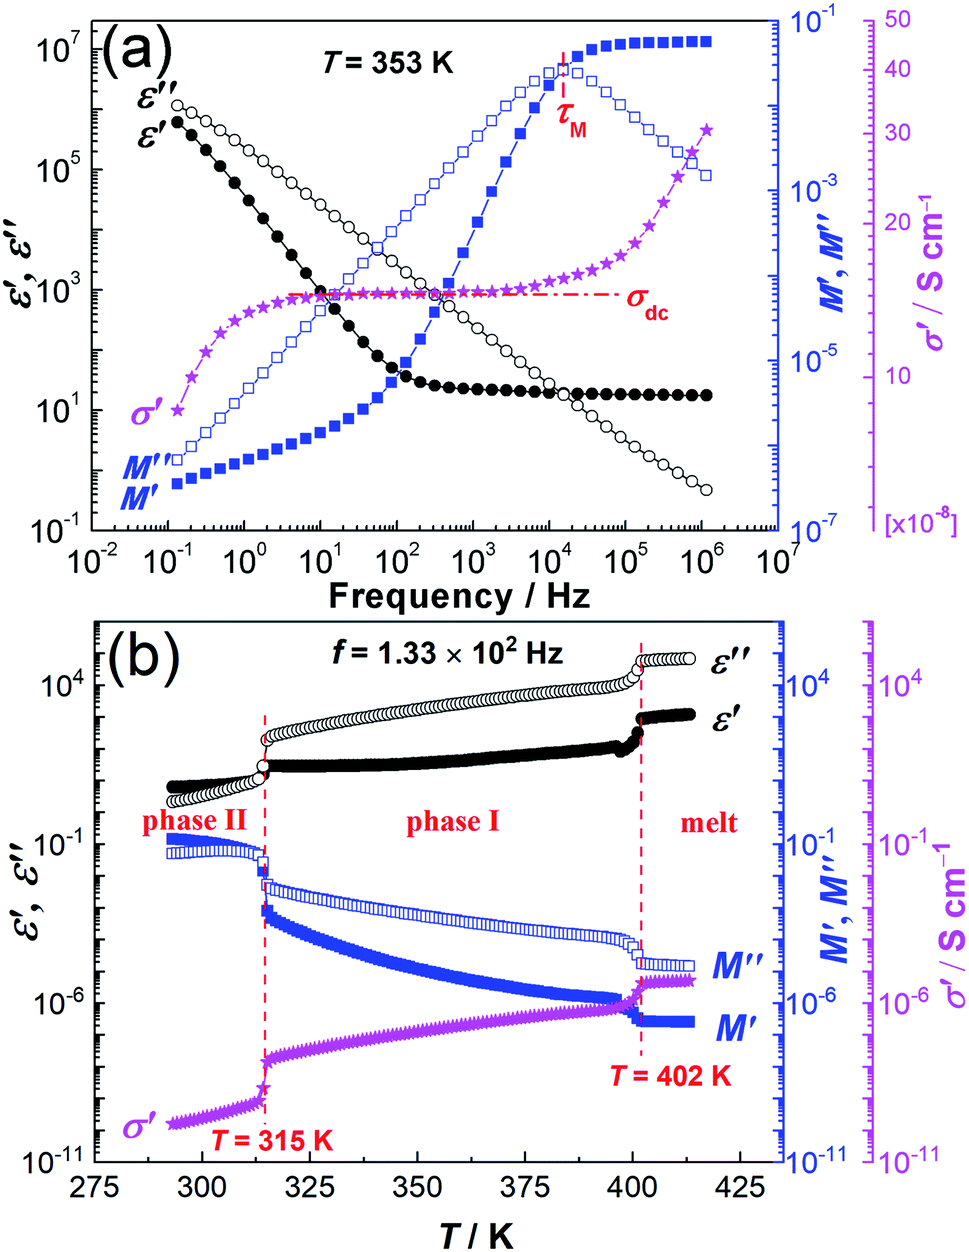 | ||
| Fig. 1 (a) The frequency-dependent dielectric properties of NPG recorded at 353 K (in the plastic crystalline state) in the frequency range of 10−1 to 106 Hz and (b) the temperature-dependent dielectric properties of NPG at 133 Hz in the temperature range of 293–413 K. Note: dielectric properties are shown in three representations: the complex permittivity (ε*), the complex conductivity (σ*) and the complex electric modulus (M*). | ||
Permittivity analysis
Fig. 2a and b presents ε′ and ε′′, respectively, as a function of frequency (10−1 to 106 Hz) and temperature (293–413 K). With the decrease of frequency, ε′ and ε′′ both show an increasing tendency in the lower frequency region, which is attributed to the electrode polarization. Clearly, both graphs show the two same jumps at 315 K and 402 K during the heating process and the former jump is significantly larger than the latter, which is a characteristic of plastic crystals. In addition, there are no obvious relaxation phenomena over the frequency range of 10−1 to 106 Hz. Detailed analysis of relaxation phenomena (e.g. molecular tumbling) can be found in previous research.21,22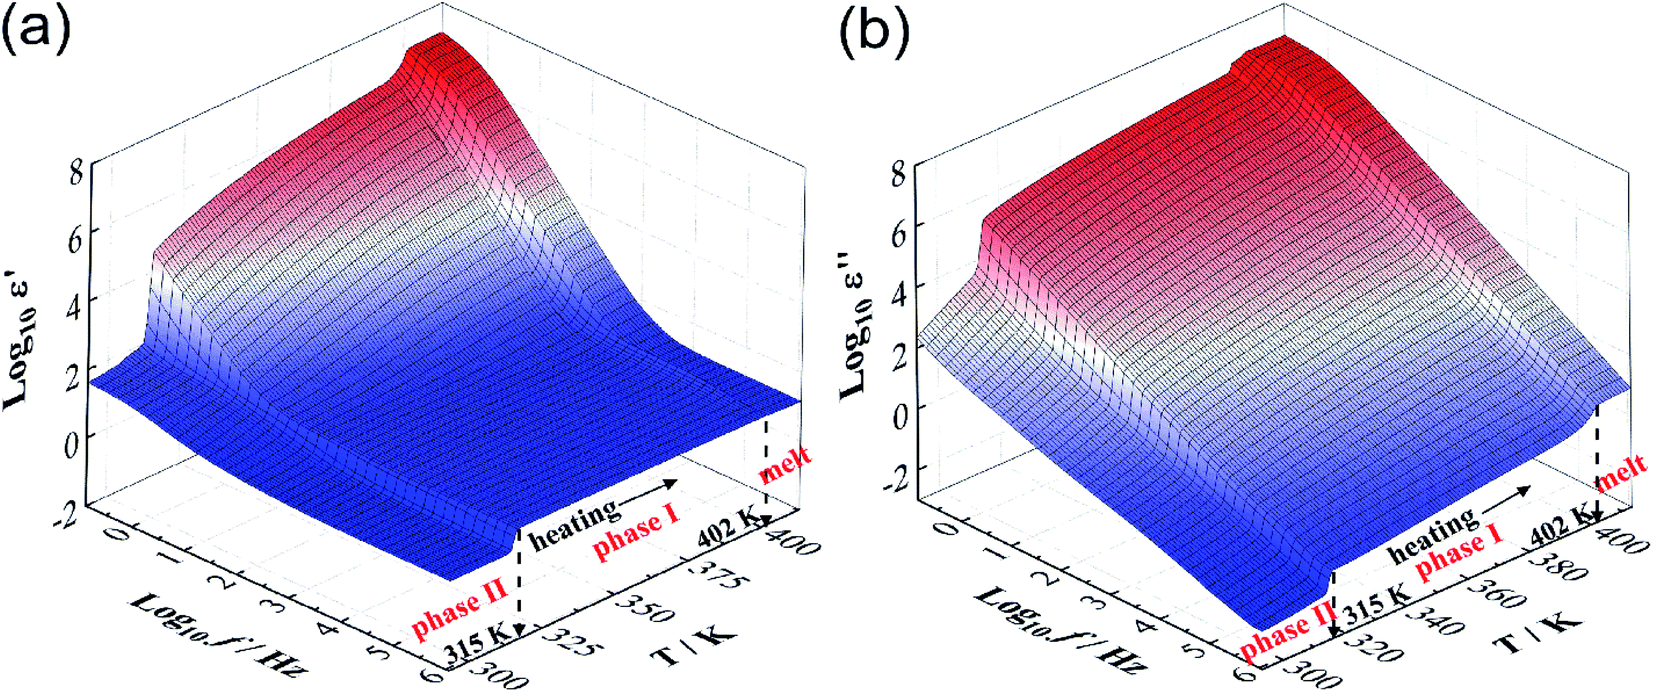 | ||
| Fig. 2 The temperature and frequency dependence of (a) ε′ and (b) ε′′. Both graphs clearly show the two jumps at 315 K and 402 K during the heating process, respectively. | ||
Conductivity analysis
Fig. 3 depicts the three dimensional (3D) graph of the real part of complex conductivity (σ′), the in-phase component of conductivity, as a function of frequency and temperature. Similar to permittivity results (Fig. 1 and 2), two apparent jumps take place at the sample temperatures of 315 K and 402 K. In addition, the dc conductivity (σdc) is characterized by a plateau of the frequency dependence of σ′ and thus it can be determined by fitting the plateau of the temperature dependence of σ′ curves.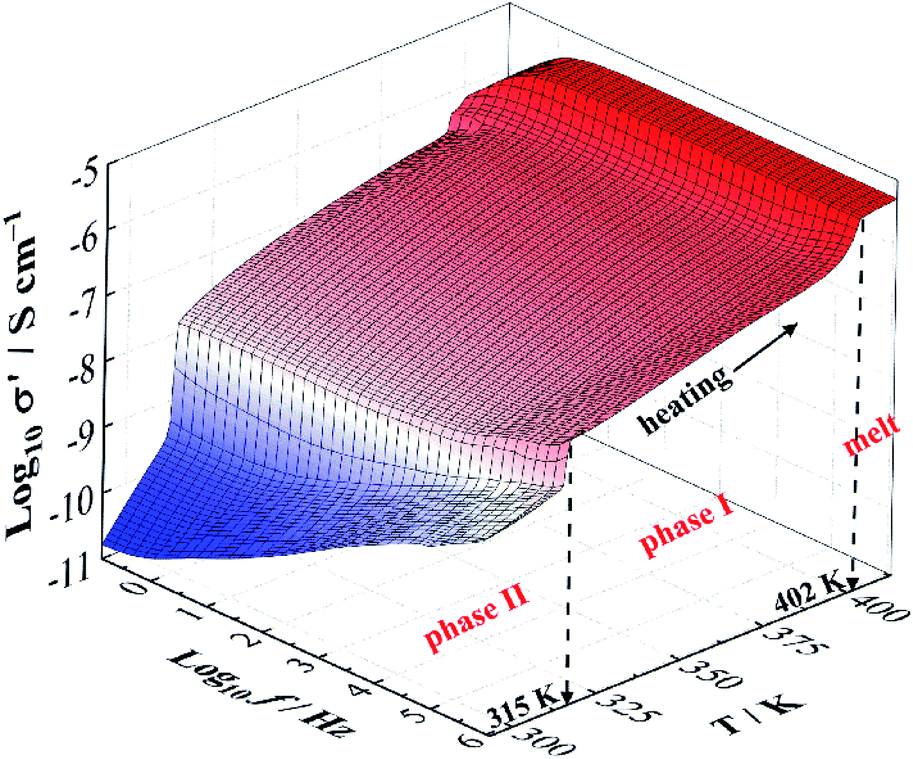 | ||
| Fig. 3 Three dimensional (3D) graph of the real part of complex conductivity (σ′) as a function of frequency (10−1 to 106 Hz) and temperature (between 293 K and 413 K). | ||
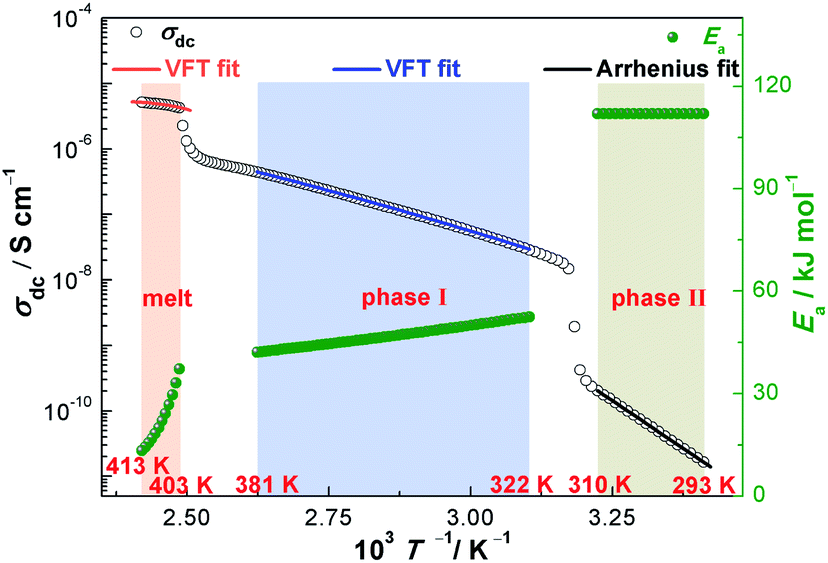
The temperature dependence of σdc for NPG is shown in Fig. 4. With the increase of the temperatures from 293 K to 413 K, σdc presents an upward tendency. The two apparent jumps at 315 K and 402 K in σdc are in good agreement with the two endothermic peaks at 316 K and 403 K in DSC trace (Fig. 4). These two jumps can also be found in Fig. 1b, 2 and 3. The value of σdc increases about 1.5 orders of magnitude after it undergoes the solid–solid phase transition at 315 K, while it increases more rapidly in phase II than in phase I.
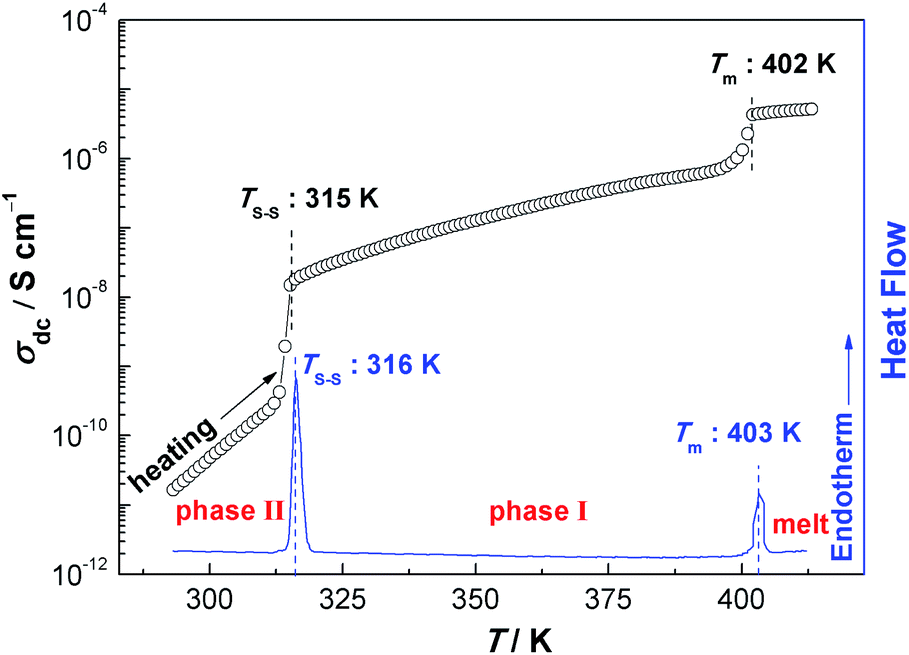 | ||
| Fig. 4 σdc of NPG as a function of temperature (between 293 K and 413 K). Note: the DSC curve is cited from ref. 18. | ||
To study the temperature dependence of σdc, a simple test (eqn (2)) to check whether σdc obeys a Vogel–Fulcher–Tammann (VFT) relation or an Arrhenius equation was introduced by Turnhout and Wübbenhorst:42
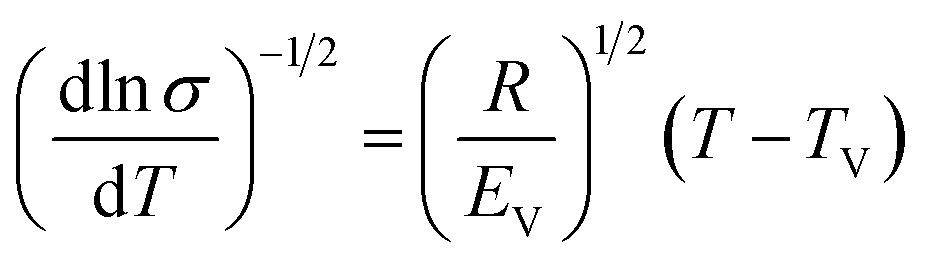 | (2) |
Fig. 5 shows linearized Vogel plots of NPG with the corresponding correlation coefficient (R2) in the temperature range of 293–413 K. Overall, σdc of these three phases (phase II, phase I and the melt phase) can be fitted by three equations with high R2, respectively. Specifically, TV values of phase II, phase I and the melt phase are 0 K, 153.1 K and 391.7 K, respectively. Because TV is equal to 0 K in phase II, the temperature dependence of σdc most likely obeys the Arrhenius law. In addition, the temperature dependence of σdc most likely obeys the VFT equation for both phase I and the melt phase due to TV ≠ 0 K.
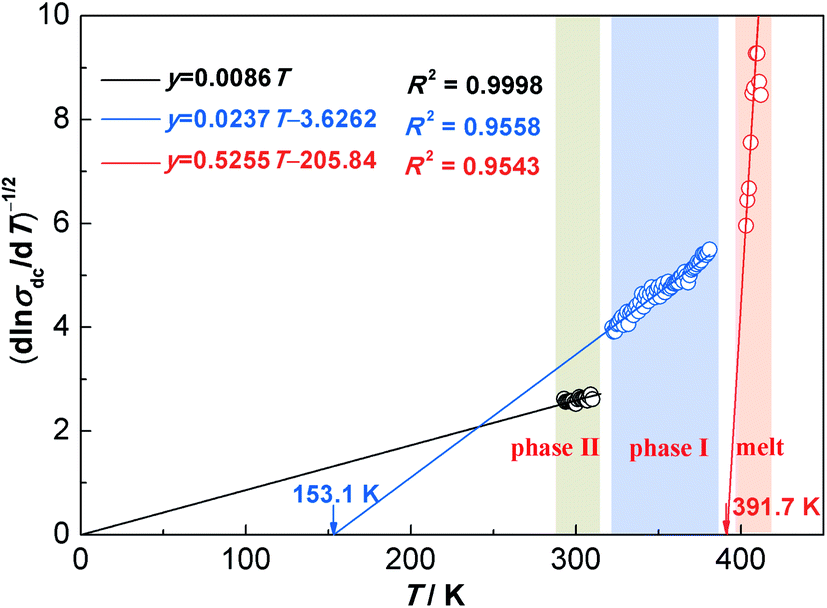 | ||
| Fig. 5 Linearized Vogel plots of NPG with the fitted equations and the corresponding correlation coefficients (R2) in the temperature range of 293–413 K. | ||
In order to quantitatively verify the above conclusion (Fig. 5), the σdc values in the three phases are fitted by the VFT equation (eqn (3)) and the Arrhenius equation (eqn (4)), respectively.43–45
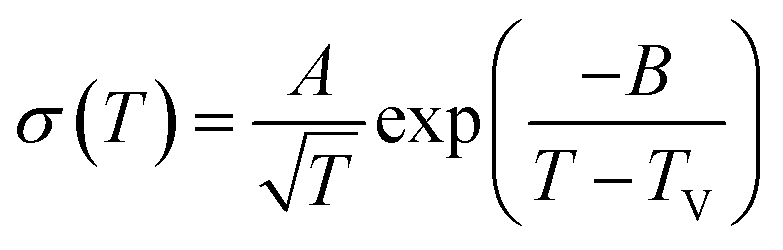 | (3) |
 | (4) |
 | ||
| Fig. 6 The temperature dependence of σdc and the activation energy (Ea) for NPG in the temperature range of 293–413 K. | ||
To study σdc in terms of energy landscape for the related temperature range, the activation energies in phase I and the melt phase are calculated based on eqn (6), which can be obtained by performing partial differentiation of eqn (3) in its logarithmic form with respect to T (eqn (5)).41,46,47
Ea = RT2(∂ln![[thin space (1/6-em)]](https://www.rsc.org/images/entities/char_2009.gif) σ/∂T) σ/∂T)
| (5) |
| Ea = RBT2/(T − TV)2 − RT/2 | (6) |
Obviously, activation energies are in function of temperatures because R, B and TV are constants in eqn (6). The temperature dependence of Ea is also shown in Fig. 6. It is shown that Ea in the low temperature region (phase II) is a constant, which indicates the thermally activated conductivity. In phase I and the melt phase, as the temperature increases, Ea decreases rapidly (especially in the melt phase), which indicates the non-thermally activated conductivity, agreeing well with the analysis of relaxation time.22
Impedance and modulus analysis
Fig. 7 illustrates the temperature dependence of M′′ and −Z′′ for NPG at selected temperatures. One or two temperatures are chosen as representatives for each phase. Clearly, both the impedance and electric modulus data show a single relaxation response in the frequency range of 10−1 to 106 Hz. The separation of the −Z′′ and M′′ peaks (phase II: Fig. 7a) results from localized relaxation while the overlapping of the −Z′′ and M′′ peaks (phase I: Fig. 7b and c; melt: Fig. 7d) in the spectra reflects long-range migration of protons.48,49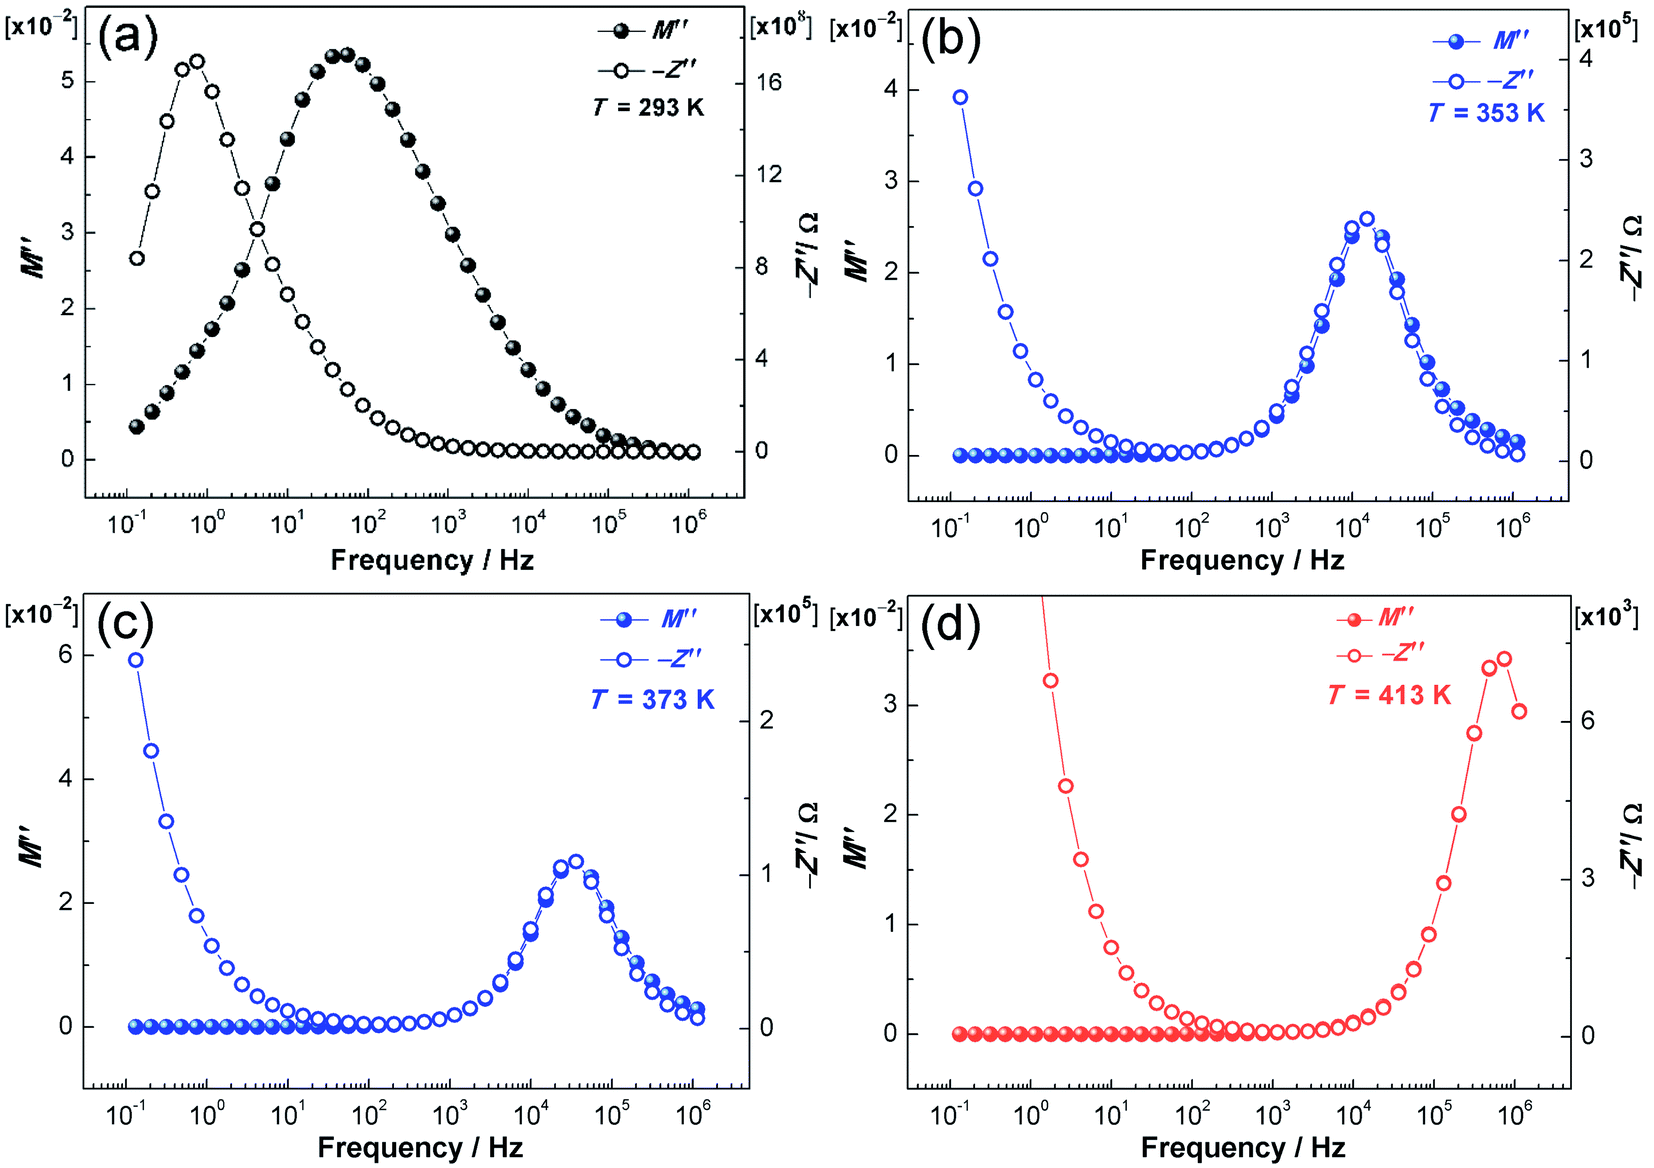 | ||
| Fig. 7 The temperature dependence of M′′ (the imaginary part of complex electric modulus) and −Z′′ (the imaginary part of the complex impedance) at selected temperatures of 293 K (a), 353 K (b), 373 K (c) and 413 K (d). | ||
While the vehicle mechanism (translational diffusion) is an intrinsic mechanism for proton conduction in the melt phase, it is speculated that the Grotthuss mechanism should also function due to the self-dissociation of hydrogen-bonded NPG molecules (eqn (7)), which are similar to water molecules. Therefore, in the melt phase, the proton conduction results from both the vehicle and Grotthuss mechanisms.
| (CH3)2C(CH2OH)2 ↔ [(CH3)2C(CH2OH)(CH2O)]− + H+ ↔ [(CH3)2C(CH2O)2]2− + 2H+ | (7) |
In the plastic crystalline phase (phase I), the proton hopping mechanism is most likely the underlying ion-conducting mechanism because of the rotational disorder in the cubic phase and intrinsic defects (vacancies) of the NPG molecules featured by the hydrogen bond network,26 and the long-range migration of protons indicated by the overlapping of the −Z′′ and M′′ peaks.
In the ordered crystalline state (Fig. 7a), the proton conduction is presumed to follow the proton-hopping mechanism via the hydrogen bond network due to the localized relaxation and the temperature dependence of σdc (Arrhenius behavior).
Conclusions
Phase dependent dielectric properties and proton conduction of the molecular plastic crystal neopentyl glycol (NPG) were studied via the variable-temperature broadband dielectric spectroscopy. Permittivity and conductivity data show that NPG undergoes phase transitions from crystalline phase to plastic crystalline phase at 315 K and then to the molten state at 402 K successively from 293 K to 413 K. The Vogel temperatures obtained by the Vogel–Fulcher–Tammann (VFT) fits agree well with the values extrapolated by the Stickel plots (linearized Vogel plots). Impedance and electric modulus data display the separation of the −Z′′ and M′′ peaks in the crystalline phase, and the overlaps of the −Z′′ and M′′ peaks in the plastic crystalline phase and the molten phase; the latter case indicates the long-range migration of protons. In both the molten phase and the plastic crystalline phase, the temperature dependence of direct current conductivity (σdc) obeys the VFT equation well. In the molten phase, the proton conduction results from both the vehicle and Grotthuss mechanisms. In the plastic crystalline phase, the proton hopping mechanism is most likely the main ion-conducting mechanism due to the rotational disorder and intrinsic defects (vacancies) of the hydrogen-bonded NPG molecules. In the ordered crystalline phase, the proton conduction is speculated to be intermolecular proton transport via proton hopping as determined from the localized relaxation and the temperature dependence of σdc (Arrhenius behavior).Conflicts of interest
The authors declare no conflict of interest.Acknowledgements
J. Luo thanks funding from National Natural Science Foundation of China (project No.: 21776120) and the starting grant (“One Hundred Talent Program”) from Sichuan University (project No.: YJ202089). H. Pan acknowledges China Scholarship Council (CSC) for a doctoral scholarship (Grant No.: 201808370196). Funding from the Research Foundation − Flanders (FWO) (project No.: G0B3218N) and Natural Science Foundation of Fujian Province, China (No.: 2018J01433) is acknowledged. J. Luo also thanks Innovative Teaching Reform Project for Postgraduate Education of Sichuan University. Dedicated to Prof. Baolian Yi (Dalian Institute of Chemical Physics, the Chinese Academy of Sciences) on the occasion of his 83rd birthday.References
- N. G. Parsonage and L. A. K. Staveley, Disorder in Crystals, Oxford University Press, Oxford, 1978 Search PubMed.
- J. Timmermans, J. Phys. Chem. Solids, 1961, 18, 1–8 CrossRef CAS.
- D. Reuter, K. Seitz, P. Lunkenheimer and A. Loidl, J. Chem. Phys., 2020, 153, 014502 CrossRef CAS.
- J. M. Pringle, P. C. Howlett, D. R. MacFarlane and M. Forsyth, J. Mater. Chem., 2010, 20, 2056–2062 RSC.
- J. Luo, A. H. Jensen, N. R. Brooks, J. Sniekers, M. Knipper, D. Aili, Q. Li, B. Vanroy, M. Wübbenhorst, F. Yan, L. Van Meervelt, Z. Shao, J. Fang, Z.-H. Luo, D. E. De Vos, K. Binnemans and J. Fransaer, Energy Environ. Sci., 2015, 8, 1276–1291 RSC.
- (a) K. Geirhos, P. Lunkenheimer, M. Michl, D. Reuter and A. Loidl, J. Chem. Phys., 2015, 143, 081101 CrossRef CAS PubMed; (b) D. Reuter, C. Geiß, P. Lunkenheimer and A. Loidl, J. Chem. Phys., 2017, 147, 104502 CrossRef CAS; (c) T. Mochida, M. Ishida, T. Tominaga, K. Takahashi, T. Sakurai and H. Ohta, Phys. Chem. Chem. Phys., 2018, 20, 3019–3028 RSC.
- (a) X. Chen, H. Tang, T. Putzeys, J. Sniekers, M. Wübbenhorst, K. Binnemans, J. Fransaer, D. E. De Vos, Q. Li and J. Luo, J. Mater. Chem. A, 2016, 4, 12241–12252 RSC; (b) J. Luo, O. Conrad and I. F. J. Vankelecom, J. Mater. Chem. A, 2013, 1, 2238–2247 RSC.
- (a) X. Wang, R. Kerr, F. Chen, N. Goujon, J. M. Pringle, D. Mecerreyes, M. Forsyth and P. C. Howlett, Adv. Mater., 2020, 32, 1905219 CrossRef CAS; (b) I. S. Klein, Z. Zhao, S. K. Davidowski, J. L. Yarger and C. A. Angell, Adv. Energy Mater., 2018, 8, 1801324 CrossRef.
- (a) D. R. MacFarlane, M. Forsyth, P. C. Howlett, M. Kar, S. Passerini, J. M. Pringle, H. Ohno, M. Watanabe, F. Yan, W. Zheng, S. Zhang and J. Zhang, Nature Rev. Mater., 2016, 1, 15005 CrossRef CAS; (b) S. Das, A. Mondal and C. M. Reddy, Chem. Soc. Rev., 2020, 49, 8878 RSC.
- R. Taniki, K. Matsumoto, T. Nohira and R. Hagiwara, J. Power Sources, 2014, 245, 758–763 CrossRef CAS.
- R. Zannetti, Acta Crystallogr., 1961, 14, 203–204 CrossRef CAS.
- J. A. Faucher, J. D. Graham, J. V. Koleske, E. R. Santee Jr and E. R. Walter, J. Phys. Chem., 1966, 70, 3738–3740 CrossRef CAS.
- E. Nakano, K. Hirotsu and A. Shimada, Bull. Chem. Soc. Jpn., 1969, 42, 3367 CrossRef CAS.
- M. Barrio, J. Font, D. O. López, J. Muntasell, J. Ll. Tamarit, N. B. Chanh and Y. Haget, J. Phys. Chem. Solids, 1991, 52, 665–672 CrossRef CAS.
- D. Chandra, C. S. Day and C. S. Barrett, Powder Diffr., 1993, 8, 109–117 CrossRef CAS.
- B. Granzow, J. Mol. Struct., 1996, 381, 127–131 CrossRef CAS.
- R. Strauss, S. Braun, S.-Q. Dou, H. Fuess and A. Weiss, Z. Naturforsch., 1996, 51, 871–881 CrossRef CAS.
- C. Wang, Q. Li, L. Wang and X. Lan, Thermochim. Acta, 2016, 632, 10–17 CrossRef CAS.
- J. Salud, D. O. López, M. Barrio and J. Ll. Tamarit, J. Mater. Chem., 1999, 9, 909–916 RSC.
- J. H. Helms, A. Majumdar and D. Chandra, J. Electrochem. Soc., 1993, 140, 1048–1055 CrossRef CAS.
- J. Ll. Tamarity, M. A. Pérez-Jubindoz and M. R. de la Fuente, J. Phys.: Condens. Matter, 1997, 9, 5469–5478 CrossRef.
- D. O. López, J. Ll. Tamarit, M. R. de la Fuente, M. A. Pérez-Jubindo, J. Salud and M. Barrio, J. Phys.: Condens. Matter, 2000, 12, 3871–3882 CrossRef.
- H. Suga, Thermochim. Acta, 1999, 328, 9–17 CrossRef CAS.
- Y. Cak, S. Akbulut, K. Keslioglu and N. Marasli, J. Colloid Interf. Sci., 2008, 320, 555–562 CrossRef.
- P. Lloveras, A. Azna, M. Barrio, Ph. Negrier, C. Popescu, A. Planes, L. Mañosa, E. Stern-Taulats, A. Avramenko, N. D. Mathur, X. Moya and J.-Ll. Tamarit, Nat. Commun., 2019, 10, 1803 CrossRef CAS.
- (a) B. Li, Y. Kawakita, S. Ohira-Kawamura, T. Sugahara, H. Wang, J. Wang, Y. Chen, S. I. Kawaguchi, S. Kawaguchi, K. Ohara, K. Li, D. Yu, R. Mole, T. Hattori, T. Kikuchi, S.-I. Yano, Z. Zhang, Z. Zhang, W. Ren, S. Lin, O. Sakata, K. Nakajima and Z. Zhang, Nature, 2019, 567, 506–510 CrossRef CAS PubMed; (b) F. B. Li, M. Li, X. Xu, Z. C. Yang, H. Xu, C. K. Jia, K. Li, J. He, B. Li and H. Wang, Nat. Commun., 2020, 11, 4190 CrossRef CAS.
- J. Salud, D. O. López, M. Barrio and J. Ll. Tamarit, J. Mater. Chem., 1999, 9, 909–916 RSC.
- J. Salud, D. O. López, M. Barrio, J. Ll. Tamarit and H. A. J. Oonk, J. Mater. Chem., 1999, 9, 917–921 RSC.
- J. Ll. Tamarit, D. O. López, M. R. de la Fuente, M. A. Pérez-Jubindo, J. Salud and M. Barrio, J. Phys.: Condens. Matter, 2000, 12, 8209–8220 CrossRef CAS.
- A. Drozd-Rzoska, S. J. Rzoska, S. Pawlus and J. Ll. Tamarit, Phys. Rev. B, 2006, 74, 064201 CrossRef.
- L. P. Singh and S. S. N. Murthy, Phys. Chem. Chem. Phys., 2009, 11, 5110–5118 RSC.
- L. P. Singh, S. S. N. Murthy and G. Singh, Phys. Chem. Chem. Phys., 2009, 11, 9278–9292 RSC.
- B. Riechers, K. Samwer and R. Richert, J. Chem. Phys., 2015, 142, 154504 CrossRef.
- D. Reuter, P. Lunkenheimer and A. Loidl, J. Chem. Phys., 2019, 150, 244507 CrossRef CAS PubMed.
- M. Kathalewar, N. Dhopatkar, B. Pacharane, A. Sabnis, P. Raut and V. Bhave, Prog. Org. Coat., 2013, 76, 147–156 CrossRef CAS.
- R. Zhou, J. Mu, X. Sun, Y. Ding and J. Jiang, Safety Sci, 2020, 131, 104849 CrossRef.
- S. Lemonick, Chem. Eng. News, 2019, 97, 9 Search PubMed.
- F. Kremer, and A. Schonhals, Broadband Dielectric Spectroscopy, Springer, Berlin, 2003 Search PubMed.
- M. Wübbenhorst and J. van Turnhout, J. Non-Cryst. Solids, 2002, 305, 40–49 CrossRef.
- J. Leys, M. Wübbenhorst, C. Preethy Menon, R. Rajesh, J. Thoen, C. Glorieux, P. Nockemann, B. Thijs, K. Binnemans and S. Longuemart, J. Chem. Phys., 2008, 128, 064509 CrossRef PubMed.
- H. Pan, P. Geysens, T. Putzeys, A. Gennaro, Y. Yi, H. Li, R. Atkin, K. Binnemans, J. Luo and M. Wübbenhorst, J. Chem. Phys., 2020, 152, 234504 CrossRef CAS PubMed.
- J. van Turnhout and M. Wübbenhorst, J. Non-Cryst. Solids, 2002, 305, 50–58 CrossRef CAS.
- H. Vogel, Phys. Z., 1921, 22, 645 CAS.
- G. S. Fulcher, J. Am. Ceram. Soc., 1925, 8, 339–355 CrossRef CAS.
- G. Tammann and W. Hesse, Z. Anorg. Allg. Chem., 1926, 156, 245–257 CrossRef CAS.
- J. R. Sanders, E. H. Ward and C. L. Hussey, J. Electrochem. Soc., 1986, 133, 325–330 CrossRef CAS.
- K. Wippermann, J. Wackerl, W. Lehnert, B. Huber and C. Korte, J. Electrochem. Soc., 2016, 163, F25−F37 CrossRef.
- D. Umeyama, S. Horike, M. Inukai, T. Itakura and S. Kitagawa, J. Am. Chem. Soc., 2012, 134, 12780–12785 CrossRef CAS.
- R. Gerhardt, J. Phys. Chem. Solids, 1994, 55, 1491–1504 CrossRef CAS.
| This journal is © The Royal Society of Chemistry 2021 |